Article

Antecedent Topographic and Shoreline-Infrastructure Controls on Urban Beach Geomorphic Response to Lake Michigan Water-Level Rise

by
Christopher R. Mattheus
Delaware Geological Survey, University of Delaware, Newark, DE 19716, USA
Limnol. Rev. 2026, 26(3), 41; https://doi.org/10.3390/limnolrev26030041
Submission received: 29 May 2026 / Revised: 9 July 2026 / Accepted: 10 July 2026 / Published: 20 July 2026

Abstract

This paper addresses the geomorphic response of an engineered Chicago beach to a >1.5 m rise in Lake Michigan’s base water level, from 2013 to 2020. Topographic monitoring data acquired since 2012 and subsurface geophysical data collected in 2022 are integrated to explore the roles of lakefront infrastructure and beach topographic development on sedimentary dynamics, beach morphologic development, and stratigraphic architecture. While conceptual models of coastal geomorphology infer upward and landward beach-profile translation with lake-level rise, a high degree of along-shore variance occurs within pocket beaches. This stems from infrastructure-related modifications of storm hydrodynamics and scour patterns, close to shore, and backshore terrain physiography. The studied beach evolved contrary to how regional littoral drift patterns would have suggested, with erosion most severe along the embayment’s downdrift end, a product of infrastructure-induced scour and the reduced capacity for sediment retention through overwash accretion. Documented geomorphic patterns with lake-level rise are manifested in subsurface imaging data from the lake-level highstand, accordingly, providing a guide to more regional paleo-reconstruction. Great Lakes urban pocket beaches buffer shoreline infrastructure, offer recreational terrains, and support dune ecosystems of value to migrating shorebirds. Understanding their geomorphology benefits coastal managers looking to mitigate impacts of future climate and lake-level change.

1. Introduction

Until recently, few process-oriented studies have sought to understand the roles of nearshore sand availability, alongshore sand-transport dynamics, winter-ice covers, and storm hydrodynamics (i.e., waves and currents) on urban beaches of the North American Great Lakes. These strand environments are enclosed to varying degrees by shoreline infrastructure (groins, jetties, and breakwaters) and evolve under m-scale, semi-periodic lake-level variances over decadal timespans. Associated morphodynamics are poorly constrained, and managing beaches along urban lakefront corridors presents many sand-management challenges. Technological advances of the past two decades have paved the way for precision, high-resolution topographic monitoring of dynamic shoreline environments, including by way of small uncrewed aerial vehicles (sUAVs) for image acquisition and Structure from Motion (SfM) Photogrammetry [1,2,3]. This type of data collection can address beach evolution at event-through seasonal scales, supplementing federally sourced information (e.g., coastal topobathymetric LiDAR) that, while more extensive in spatial coverage and unrivaled in accuracy, limits geomorphologic investigations to a multi-year resolution [4,5].
This paper focuses on the process of geomorphic and stratigraphic reconstruction of Chicago’s popular 63rd St. Beach (SSB), housed within one of the city’s largest engineered ‘containers.’ Lakefill comprises much of the fully engineered, > 40 km-long Chicago coastline, with constructed promontories, harbors, and beaches bound by groins and mostly backed by seawall or revetment. The beach of investigation here sits within an embayment >400,000 m2 in extent created through partial beach enclosure by seawall, groin, and other shoreline infrastructure. While prior study efforts have dealt with (1) GIS-based reconstructions of paleo-shoreline positions, at 22 Chicago beaches [6]; (2) the dynamics of beach recovery after a period of elevated lake level [7,8]; and insights into regional sand volumetric changes [9,10,11], this paper reports on an in-depth reconstruction of geomorphic changes and stratigraphic legacy at one beach site over a decadal period marked by >1.5 m of base water-level rise. SSB was selected for this analysis from >20 Chicago urban beaches given its alongshore physiographic compartmentalization into zones of different management activity. Located in Jackson Park, on Chicago’s South Side, SSB encompasses a groomed recreational terrain that is flanked by protected areas of vegetated foredune development. The SSB embayment connects with Lake Michigan across an ~750 m-wide gap between updrift and downdrift groin termini. The beach has an Interior Edge Ratio (IER) of ~0.006, calculated as perimeter divided by interior area. This is the second lowest of the >20 Chicago pocket beaches, with an IER value range from 0.005 to 0.043 [6]. Smaller carbonate bedrock-bound lake embayments, which are plentiful along the northern rims of Lakes Michigan and Huron, are natural system analogs of similar dimension. Insights from SSB thus stand to enhance our collective understanding of both urban and natural embayed beach geomorphic development with m-scale, decadal fluctuations in lake level [12].
The specific goals of studying decadal SSB geomorphology, using topographic monitoring and subsurface imaging datasets, were to: (1) Better characterize shoreline morphodynamic patterns, sand volumetrics, and stratigraphic signatures associated with m-scale water-level rise, across beach sections of different physiography and management; (2) assess the preservation potentials of emplaced transgressive backshore sedimentary deposits formed by shoreline overwash/retreat; (3) develop a process-informed architectural blueprint for recognizing transgressive sedimentary architectures along the Great Lakes; and (4) translate data results into useful information for urban coastal managers concerned with protecting lakefront infrastructure and balancing the needs of beachgoers and niche-habitat preservation. Overwash fans and the variety of terrains found within some of Chicago’s protected beach compartments serve as important migratory bird stopovers and habitat for the endangered Great Lakes piping plover [13,14]. Base water-level fluctuations, at the m-scale at multi-year through decadal timespans [12], set Great Lakes beaches apart from those of saltwater coastlines. These dynamics present a major shoreline-management challenge, as water-level changes encourage vertical and horizontal adjustments of coastal depositional profiles [15,16,17,18,19]. An improved understanding of how lake-level fluctuations and seasonal storms influence littoral zone hydrodynamic and sedimentary processes, within and around urban lakefront embayments, is needed to evaluate (1) how antecedent beach topographic conditions and management activities (e.g., grooming or winter-berm creation) factor into geomorphic response; and (2) how urban embayment infrastructure (e.g., groin occurrence/design) modifies storm hydrodynamics and influences sediment-transport patterns (e.g., by wave refraction).

Background

This section reports on past coastal geological research on the Great Lakes, with emphasis on studies engaged in (1) geophysical mapping of (paleo)shoreline environments and geological framework assessment; (2) beach morphodynamics and shoreline change; and (3) Lake Michigan hydrodynamics. GPR-based applications to coastal reconstructive work are multifold [20,21]. Ground-penetrating radar (GPR) is a commonly deployed subsurface reflection tool for imaging the depositional architecture of relict beach deposits [22,23,24,25]. Prograding clinoform geometries are a characteristic beach-subsurface structure resolved in the cross-shore orientation [26,27,28,29]. Differences in the geometry, spacing, and elevation of imaged clinoforms are regarded as reliable indicators of changing paleo-environmental conditions; this is because coastal depositional architectures reflect (1) changing water-level conditions, which alter the distribution of sediment accommodation (i.e., the space for sequestration); and (2) sediment-supply variances. Changes in the rates and magnitudes of these variables factor into the evolution and infilling of sediment accommodation, coastal depositional architecture, and preservation [30,31].
While GPR has been deployed mainly for mapping the internal architecture of sandy post-glacial strandplain deposits for paleo-hydrographic reconstruction [32,33,34,35,36], it has also helped with understanding patterns of sand sequestration at fillet beaches, which are characterized by high storage potential and littoral sand trapping efficiency. Mattheus and others mapped subsurface architectures of fillet beaches along harbor complexes on Lakes Erie and Superior, relating sand volumetric changes to historical shoreline positions [37,38]. Areal changes here reflect sand volumetric variances well, given the little along-strike variance in beach morphology [39,40]. GPR has also been used to map paleo-inlet locations along dynamic Great Lakes coastal sand barriers [41] and provided onshore sand-thickness constraints to a regional Chicago littoral zone sand-assessment project, in combination with offshore seismic reflection profile data [42].
Geomorphologic inquiries have been underway across the Great Lakes region, making use of Structure from Motion (SfM) Photogrammetry to monitor beach topographic developments and track changes in shoreline position. An Illinois State Geological Survey (ISGS) and Illinois Department of Natural Resources’ Coastal Management Program (INDR-CMP) partnership has supported coastal topobathymetric monitoring activities along Lake Michigan’s southwestern coast since 2018, with the program generating valuable insights into Great Lakes coastal morphodynamics along the Zion Beach-ridge Plain (ZBRP), a strand promontory containing the remaining natural strand shorelines within Illinois [9,29,43,44,45], and engineered beaches along Chicago’s urbanized and fragmented littoral zone [6,10,46,47]. Geomorphic change assessments along Illinois beaches have captured the impacts of seasonal to decadal lake-level changes on beach-profile adjustments and rates of wetland loss [48,49,50,51], alongshore variances in beach-profile response to lake-level rise due to alongshore sediment routing [52], and ice-related shoreline and nearshore morphodynamics [53]. Other studies of coastal geomorphology have taken place in the region, along Lake Michigan [54], Lake Superior [55,56], Lake Erie [37,41,57,58,59,60,61], and Lake Ontario [62].
Rising and elevated decadal Great Lakes water levels have historically received the most attention, given regional concerns over coastal inundation, increased likelihood of storm damage, and heightened rates of shoreline recession [63,64]. Topobathymetric monitoring work by the ISGS, at sub-annual resolutions along many parts of the southwestern Lake Michigan coast, has documented shoreline recession and overwash along urban pocket beaches during the most recent decadal m-scale lake-level rise event, from 2013 to 2020 [12]. Overwash-sediment volumes at >20 pocket beaches along the ~40 km-long Chicago coast scaled with changes in beach area due to shoreline recession [6]. While overwash was observed to have been ubiquitous, patterns of shoreline change varied from beach to beach and the same >1.5 m lake-level rise episode promoted clockwise and counterclockwise beach-rotation patterns. This was attributed to beach-specific impacts of engineered shoreline structures, beach size, and beach orientation. The urban embayment-specific engineered structures (e.g., groins and breakwaters) influence wave approach, nearshore-shoreline current formation/setup, and littoral sand-transport patterns; this is informed solely from GIS-based reconstructions of shoreline position and overwash patterns, from repeat aerial photographic and coastal LiDAR data coverages.
Sand-supply (i.e., embayment-influx) dynamics are urban beach-specific and time-variant, influenced by lake-level position and/or change trajectory. These dynamics are more evident on the downdrift ends of unobstructed stretches of coast, where efficient sand trapping can reflect sediment-sourcing dynamics and impacts to the contributing littoral cell [37,38,65]. Patterns of littoral sand routing along highly fragmented urban lakefront corridors are complex, and potentials for threshold-driven morphodynamics exist [10]. Sand cover along the Chicago nearshore can be discontinuous and/or patchy along strike, with outcropping bedrock highs and coastal infrastructure obstructing alongshore sediment transport [47]. Some urban embayments gain sand during rising and elevated base water-level conditions, facilitated by the creation of sediment accommodation and, in some cases, more effective updrift erosion and sand influx; however, this is not universal to constructed beaches and is heavily dependent upon setting [11]. Lake level-induced changes to how storm waves and currents interface with the urban lakefront infrastructure can also alter sedimentary patterns within the lakefront embayments (e.g., by directing scour patterns). General sand deprivation of the Chicago littoral zone, substantiated by geological sampling and geophysical imaging studies [47,66,67,68], further underscores the need for understanding nearshore sediment-transport pathways, the nature of alongshore versus cross-shore sediment fluxes during storm events (i.e., exchanges between different urban embayments), and changes in these dynamics over time, with lake-level variances and impacts of winter-ice covers.
Littoral sand covers along the Chicago nearshore, where present, do not extend beyond 2 km from shore [47,66,67]. The regional sedimentary character of offshore Chicago and its contrast to the much sandier ZBRP offshore, ~30 km to the north, are showcased by a recent airborne electromagnetic (EM-based) geophysical mapping effort [68]. It is against this regional offshore sedimentary framework, developed at a resolution too coarse to accurately resolve the thin (sub-m-scale) and discontinuous sand covers known to exist, that studies of urban beach geomorphology must be investigated. The littoral zone south of Navy Pier is known for its craggy Silurian reef-rock formations shore-attached or close to shore, which are shown to trap littoral sand on their updrift side and often lack sand on their leeward side [47,69]. Beyond the lakeward limits of sand cover, which, while highly variable along strike, is limited to within 2 km from shore and ~6 m in water depth, gravel-boulder lag deposits and scoured fine-grained (clay-rich) till deposits dominate the lake bottom. This is inferred from past geological sampling endeavors, geophysical imaging campaigns, and the characterization of lake-bottom rugosity [47,66,67,68]. Recent ISGS marine seismic reflection profiling resolved thin sand sheets (<0.5 m thick) within 3 km from shore, often disjointed from the shore-attached littoral drift deposits [69]. Littoral sand thicknesses increase towards the shoreline and are up to ~10 m within urban lakefront embayments, based on pre-lakefront expansion bathymetry [10] and GPR-based mapping [42,70]. The lakeward extent of littoral sand cover along Chicago was delineated in detail from federal LiDAR-derived DEMs and derivative products; rugosity and slope-aspect distinctions distinguish between ‘smooth’ and mostly shore-attached, eastward-facing sand bodies and ‘rough’ coarse-grained lag deposits (e.g., gravel ridges) and isolated carbonate bedrock outcrops [47,67]. The low sand content of Chicago’s littoral zone, in comparison to that of the ZBRP [66,68,71,72,73], stems from the composition of regional till and glaciolacustrine deposits, which are the primary source of sand to Chicago area beaches. The Wadsworth Formation, formerly the Wadsworth Till Member of the Wedron Formation [74,75], contains little sand of beach quality. It is estimated that only ~1 m3 of sand is liberated per linear meter of coastal bluff retreat in Illinois [76].
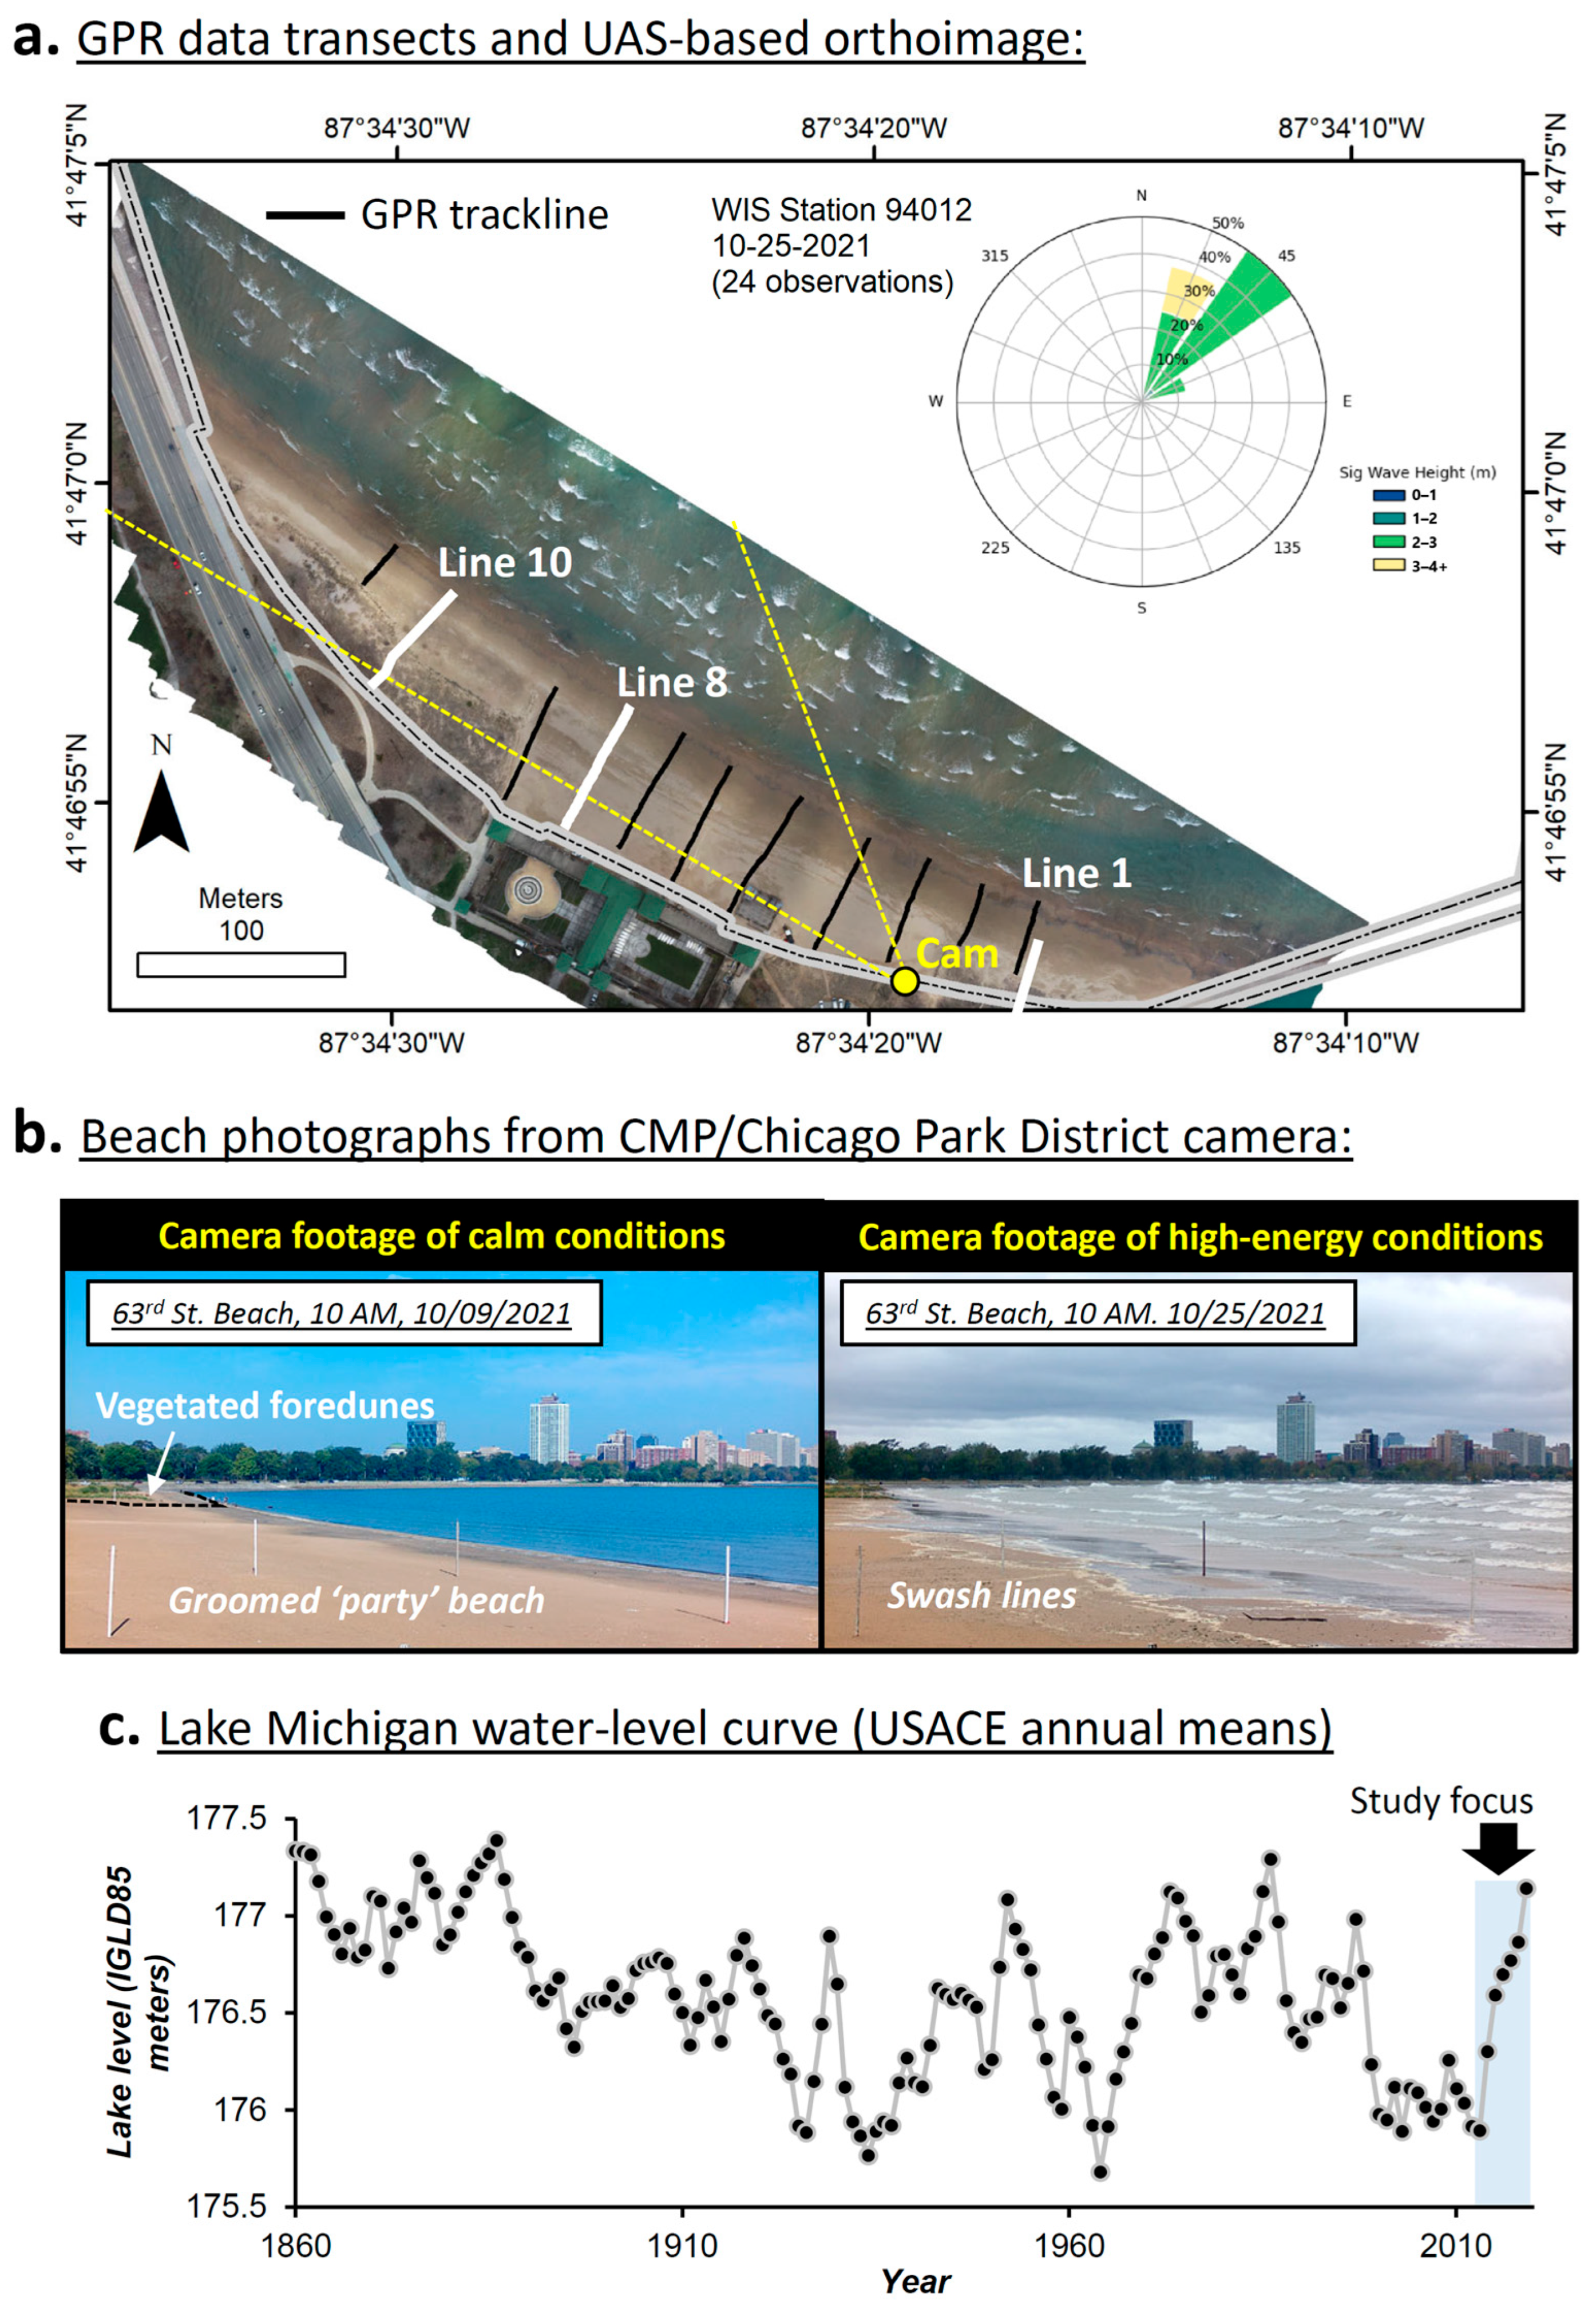
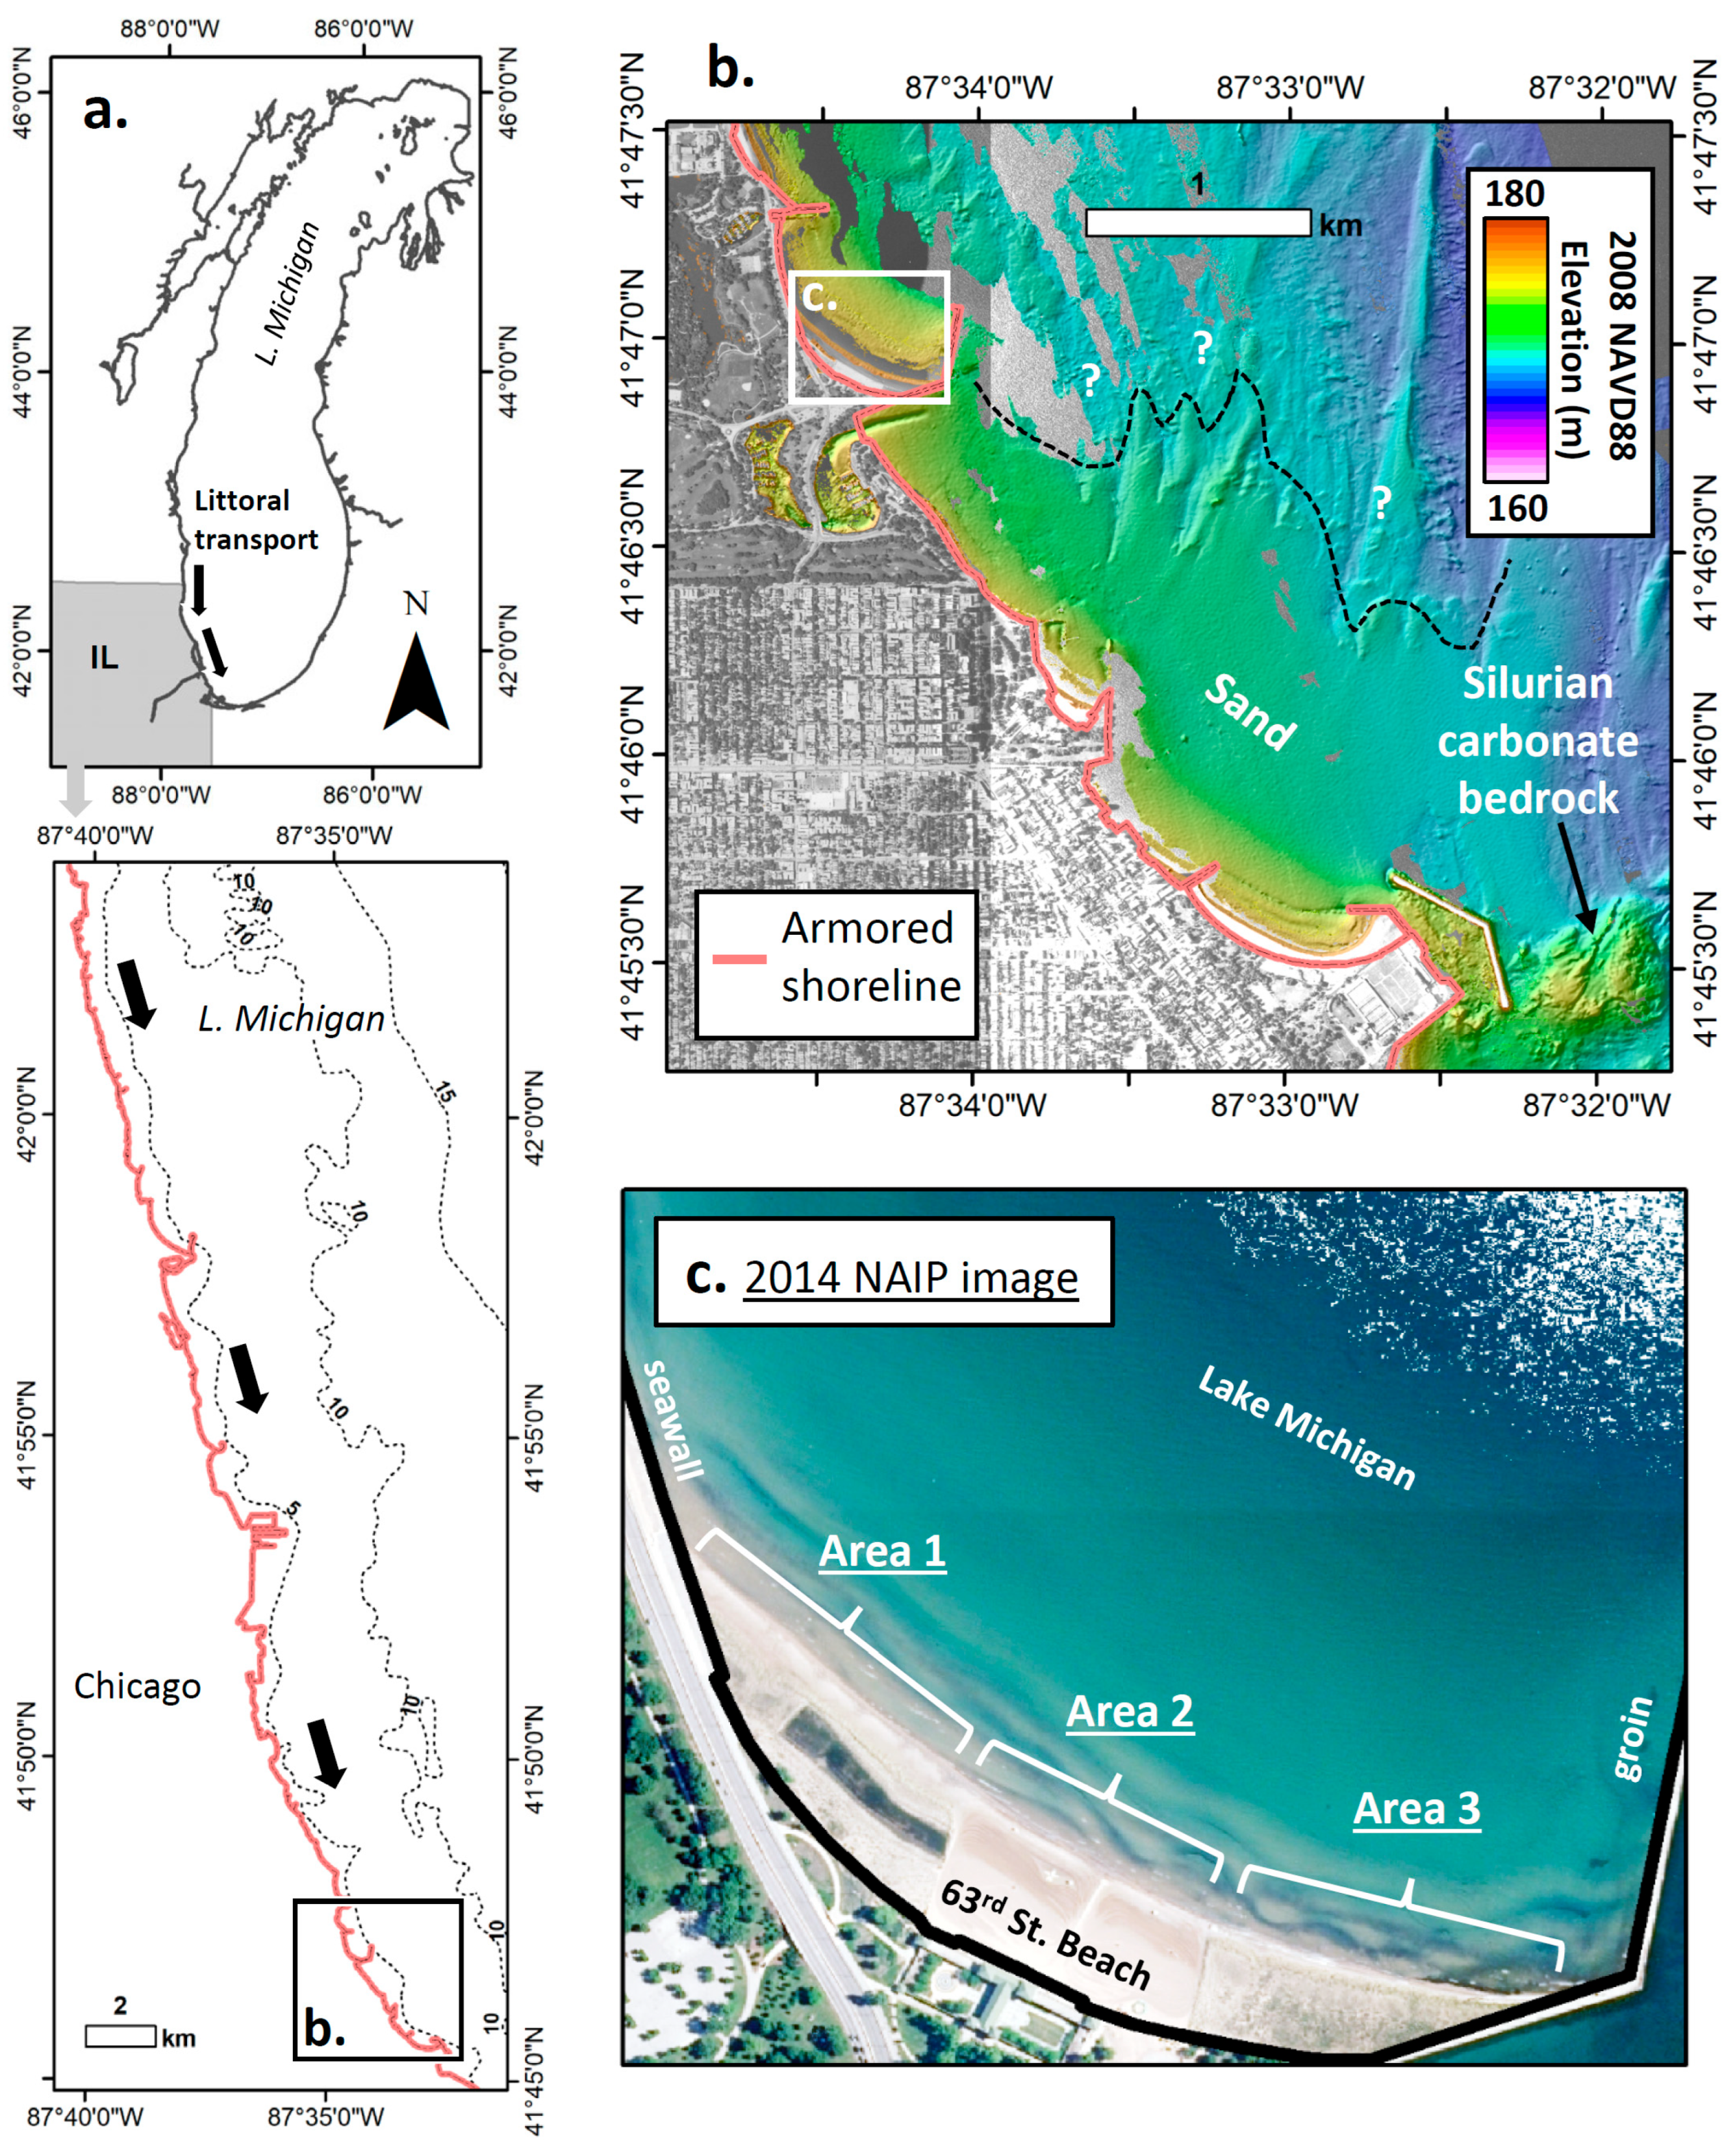
Sand-sequestration patterns at groins, harbor jetties, and other major littoral obstructions across the region attest to a net-southward flux of materials [71,77,78]. The SW Lake Michigan margin, shown in Figure 1, is categorized as a wave-dominated coastal environment. The cold-water months of October through April are the high-energy part of the year, with wave directions from the N/NE having the greatest geomorphic impact on the Chicago coastline, with >400 km of lake fetch [79]. Footage of a wave event, taken from a Chicago Park District camera installation in late October of 2021, documents wave run-up and swash-line formation (Figure 2). The October 25th event was associated with a 3 m significant wave height, based on U.S. Army Corps of Engineers (USACE) Wave Information Studies (WIS) hindcast-model information from Station 94012, at 41.8° in latitude and −87.52° in longitude [80]. This wave-modeling node is located in 10 m of water depth, <5 km from shore; information on how wave approach is modified by urban infrastructure along the Chicago coastline is not available. WIS data infer significant wave heights > 5 m along this portion of the Lake Michigan coast at a decadal recurrence interval [79,80], in line with studies from the ZBRP, to the north [71].
Winter lake-ice extents and durations can impact open-water fetch conditions and wave-generation/shoreline-erosion potentials during the high-energy part of the year [63,81]. The timing of first and last shore ice, duration of ice presence, and evolution of ice-cover extent are variable from year to year. Annual ice-cover maxima for Lake Michigan have ranged from <20% to >90%, based on records from 1973 to present, with high inter-annual variations [82]. The Great Lakes undergo seasonal water-level changes at the decimeter scale [83]. Over longer timespans (years to decades), Lake Michigan base water levels undergo semi-periodic fluctuations of >1.5 m [12,84]. Figure 2c shows the water-level curve for Lake Michigan, based on monthly averages that factor out the impacts of short-lived weather events such as seiches or storm surges. Lake-level variances at the seasonal scale and beyond are driven by offsets in the balance of water inputs, mainly by direct precipitation and fluvial-groundwater input, and water outputs, mainly evaporation and outflow [85]. Decadal water-level changes are widely acknowledged to exert an influence on coastal morphodynamic development, with rising or elevated base water levels widely linked to problematic loss of coastal habitat with shoreline recession [51,64,86].
This paper follows on the heels of prior efforts to understand coastal change during rising and elevated water-level conditions by reconstructing, in detail, developments at SSB using topographic monitoring and subsurface imaging techniques. The size of the urban lakefront enclosure (i.e., embayment), bound on updrift and downdrift sides by jetty/groin infrastructure, is about 0.4 km2. This includes the SSB subaerial beach extent, as contained by a seawall/revetment at the upland park transition (Figure 1). The length of the terminal groin, inclusive of an inwardly directed portion, is ~0.5 km, and the shoreline, measured from groin to groin, was around 700 m in length in November of 2025 [87]. Beach width across the middle portion of the strand at this time was about 90 m. The beach is sectioned into three clearly demarcated management zones. The 2014 National Agriculture Imagery Program (NAIP) photograph, shown in Figure 1c, captures this compartmentalization near the onset of 2013–2020 lake-level rise (Figure 2). A shore-parallel ditch of ~3200 m2 in extent and ~150 m in length was constructed across Area 1 between May of 2008 and October of 2009, for managing drainage off the urban upland terrains. While this area was once groomed for beach recreation, as Area 2 has been and continues to be, it was fenced off to promote vegetative growth. Unvegetated Area 2, the recreational beach, has undergone summertime grooming over the past two decades. Landform/terrain stabilization by vegetative growth and sand trapping has been promoted across Area 3 since the early 2000s, resulting in an ~11,000 m2 foredune-habitat area by April of 2013, at the onset of the last lake-level rise episode.

2. Materials and Methods

The power of combined federal and non-federal elevation datasets was leveraged against insights from sub-bottom geophysical imaging. This study coupled LiDAR-based digital elevation models (DEMs) and an Illinois State Geological Survey (ISGS) Structure from Motion (SfM) Photogrammetry-based beach topographic monitoring dataset with ground-penetrating radar (GPR) data to offer an unrivaled analysis of urban beach process morphodynamics and shallow sedimentary architecture. Digital elevation models (DEMs), constructed from ISGS beach-monitoring data, and available elevation datasets from federal sources provided geomorphic change information along GPR tracklines. This study focused on those oriented in the cross-shore direction, from the backshore to the upper foreshore. Elevation datasets offered information on beach geomorphic development with 2013–2020 m-scale lake-level rise (Figure 2c), while the GPR dataset, acquired after 2020, provided insights into the stratigraphic architecture of associated beach deposits. Subsurface interpretations were based on basic stratigraphic laws and principles of superposition and cross-cutting relationships, aided by the time-transgressive topographic data constraints.
The beach subsurface was mapped on 31 May 2022 to depths of ~5 m along 11 shoreline-perpendicular transect locations, which were spaced ~25 m apart. Acquisition of geophysical subsurface reflection imagery was undertaken with a 200 MHz GSSI ground-penetrating radar (GPR) unit, equipped with an integrated GPS unit (Figure 2a). Conversion of two-way signal travel time to depth was based on the dielectric constant of 25, the GSSI standard for wet sand; this parameterization was applied because beach elevations were within 2 m of lake level at the time of data collection. Depth conversion using this dielectric constant was corroborated at SSB and other Chicago beach sites by way of auger probing to a known subsurface horizon (e.g., to the lakefill material beneath beach sand). Acquisition across mostly horizontal to slightly lakeward dipping surface topography ensured vertical beam orientations.
Digital radar files were processed using GSSI’s Radan 7 software suite. This involved the application of IIR/FIR filters, Noise Band/Background Removal, and Range Gain functions, which enhanced signal-to-noise ratios and disproportionately amplified weakened reflections at depth. GPS-point locations of individual radar shots were exported as .txt files for topographic data-extraction analyses using ArcMap 10.7. Topographic corrections were not applied to radar files given the dynamic nature of beach change and the lack of precision elevation data from the time of GPR-data collection. GPR-based analyses and integration with topographic monitoring data are thus reliant upon thickness measures derived from stratigraphic picks.
Table 1 contains information on topographic, bathymetric, and topobathymetric datasets assembled for analysis. Insights into the ‘lake-level lowstand-beach morphology’ were provided by a 1 m 2012 USACE Joint Airborne LiDAR Bathymetry Technical Center of Expertise (JABLTCX) topobathymetric DEM, which was obtained through the National Oceanic and Atmospheric Administration’s (NOAA) online Digital Data Access Viewer [88]. An 0.5 m 2017 United States Geological Survey (USGS) topographic DEM, acquired from the same online source, offered the means to evaluate the impacts of an initial ~1 m rise in base water level, since the historical low in 2013 (Figure 2c). Information on federal geospatial datasets accessed for this study is provided in Table 1.
Beach topography during the lake-level highstand was captured by 2021, 2022, and 2023 ISGS monitoring datasets (Table 1). Annual surveys were conducted by the ISGS between March and May each year, following the winter lake-ice season [89]. Data collection occurred on 13 May, 19 April, and 21 March, respectively, and involved the acquisition of high-resolution aerial photographs by a DJI Phantom 4 quadcopter uncrewed aerial vehicle (sUAV), by SZ DJI Technology Co., Ltd., Shenzhen, China. Images were collected at 72 dpi using the integrated FC6310S model camera, with checkered survey plates emplaced across the survey area to mark geospatial benchmarks established prior to flight. Real-Time Kinematic Global Positioning System (RTK-GPS) constraints using a Trimble R12i unit allowed for cm-scale geospatial positioning precision; this was achieved by way of a VRS Now subscription providing on-the-fly corrections using a MiFi unit. Drone flights, at 75 m above beach level, were parameterized for 80% front and side overlapping between adjacent images. Digital images were post-processed using the Agisoft Metashape software program (Version 1.6), with GPS constraints imported for established survey-benchmark locations (as .CSV-file exports from the RTK-GPS unit). Structure from Motion (SfM) Photogrammetry was used to generate DEMs from sUAV-derived imagery and RTK-GPS point constraints [90,91,92]. Geospatial accuracies of derivative DEMs are within a decimeter, based on compounding errors from the processing workflow and GPS data [89]. DEMs from ISGS topographic surveys were rendered at 0.5 m resolution (Table 1).
Table 1. Geospatial dataset information. NAIP denotes the National Agricultural Imagery Program, ISGS denotes the Illinois State Geological Survey, USACE denotes the US Army Corps of Engineers, USGS denotes the United States Geological Survey, and JALBTCX denotes the Joint Airborne LiDAR Bathymetry Technical Center of Expertise. More information on ISGS topographic and bathymetric datasets can be accessed from the Illinois Geospatial Data Clearinghouse [70,89,93].
SourceYearTypeProgramVertical AccuracyResolution
USACE2012Topobathymetric DEMJALBTCX LiDAR±0.15 m1.0 m
USGS2017Topographic DEMUSGS
LiDAR
0.1 m0.5 m
ISGS2021Topobathymetric DEMCMP~0.1 m5.0 m
ISGS2021Topographic DEMCMP~0.1 m0.5 m
ISGS2022Topographic DEMCMP~0.1 m0.5 m
ISGS2023Topographic DEMCMP~0.1 m0.5 m
USDA2019Aerial imageNAIP-0.6 m
USDA2012Aerial imageNAIP-1.0 m
All geospatial data management and analyses were undertaken using the ArcMap 10.7 software and its auxiliary toolsets. DEMs were clipped to age-equivalent shoreline positions, which were digitized as polyline shapefiles from orthoimages generated from sUAV imagery in Agisoft Metashape. Topographic profiles were extracted along GPR tracklines and exported in tabular form (as .CSV files) for analyses in Microsoft Excel [94]. In the absence of GPR topographic corrections, net-change values, based on DEMs, were calculated along extraction profiles for sequential datasets. This provided the means of comparing emplaced post-2012 sand-unit thicknesses and extents (e.g., of overwash accretionary deposits) to stratigraphic signatures mapped from the 2022 GPR imagery. This paper focuses on GPR Lines 1, 8, and 10, which represent the ‘type sections’ for different lowstand beach topographies (Figure 1c and Figure 2).
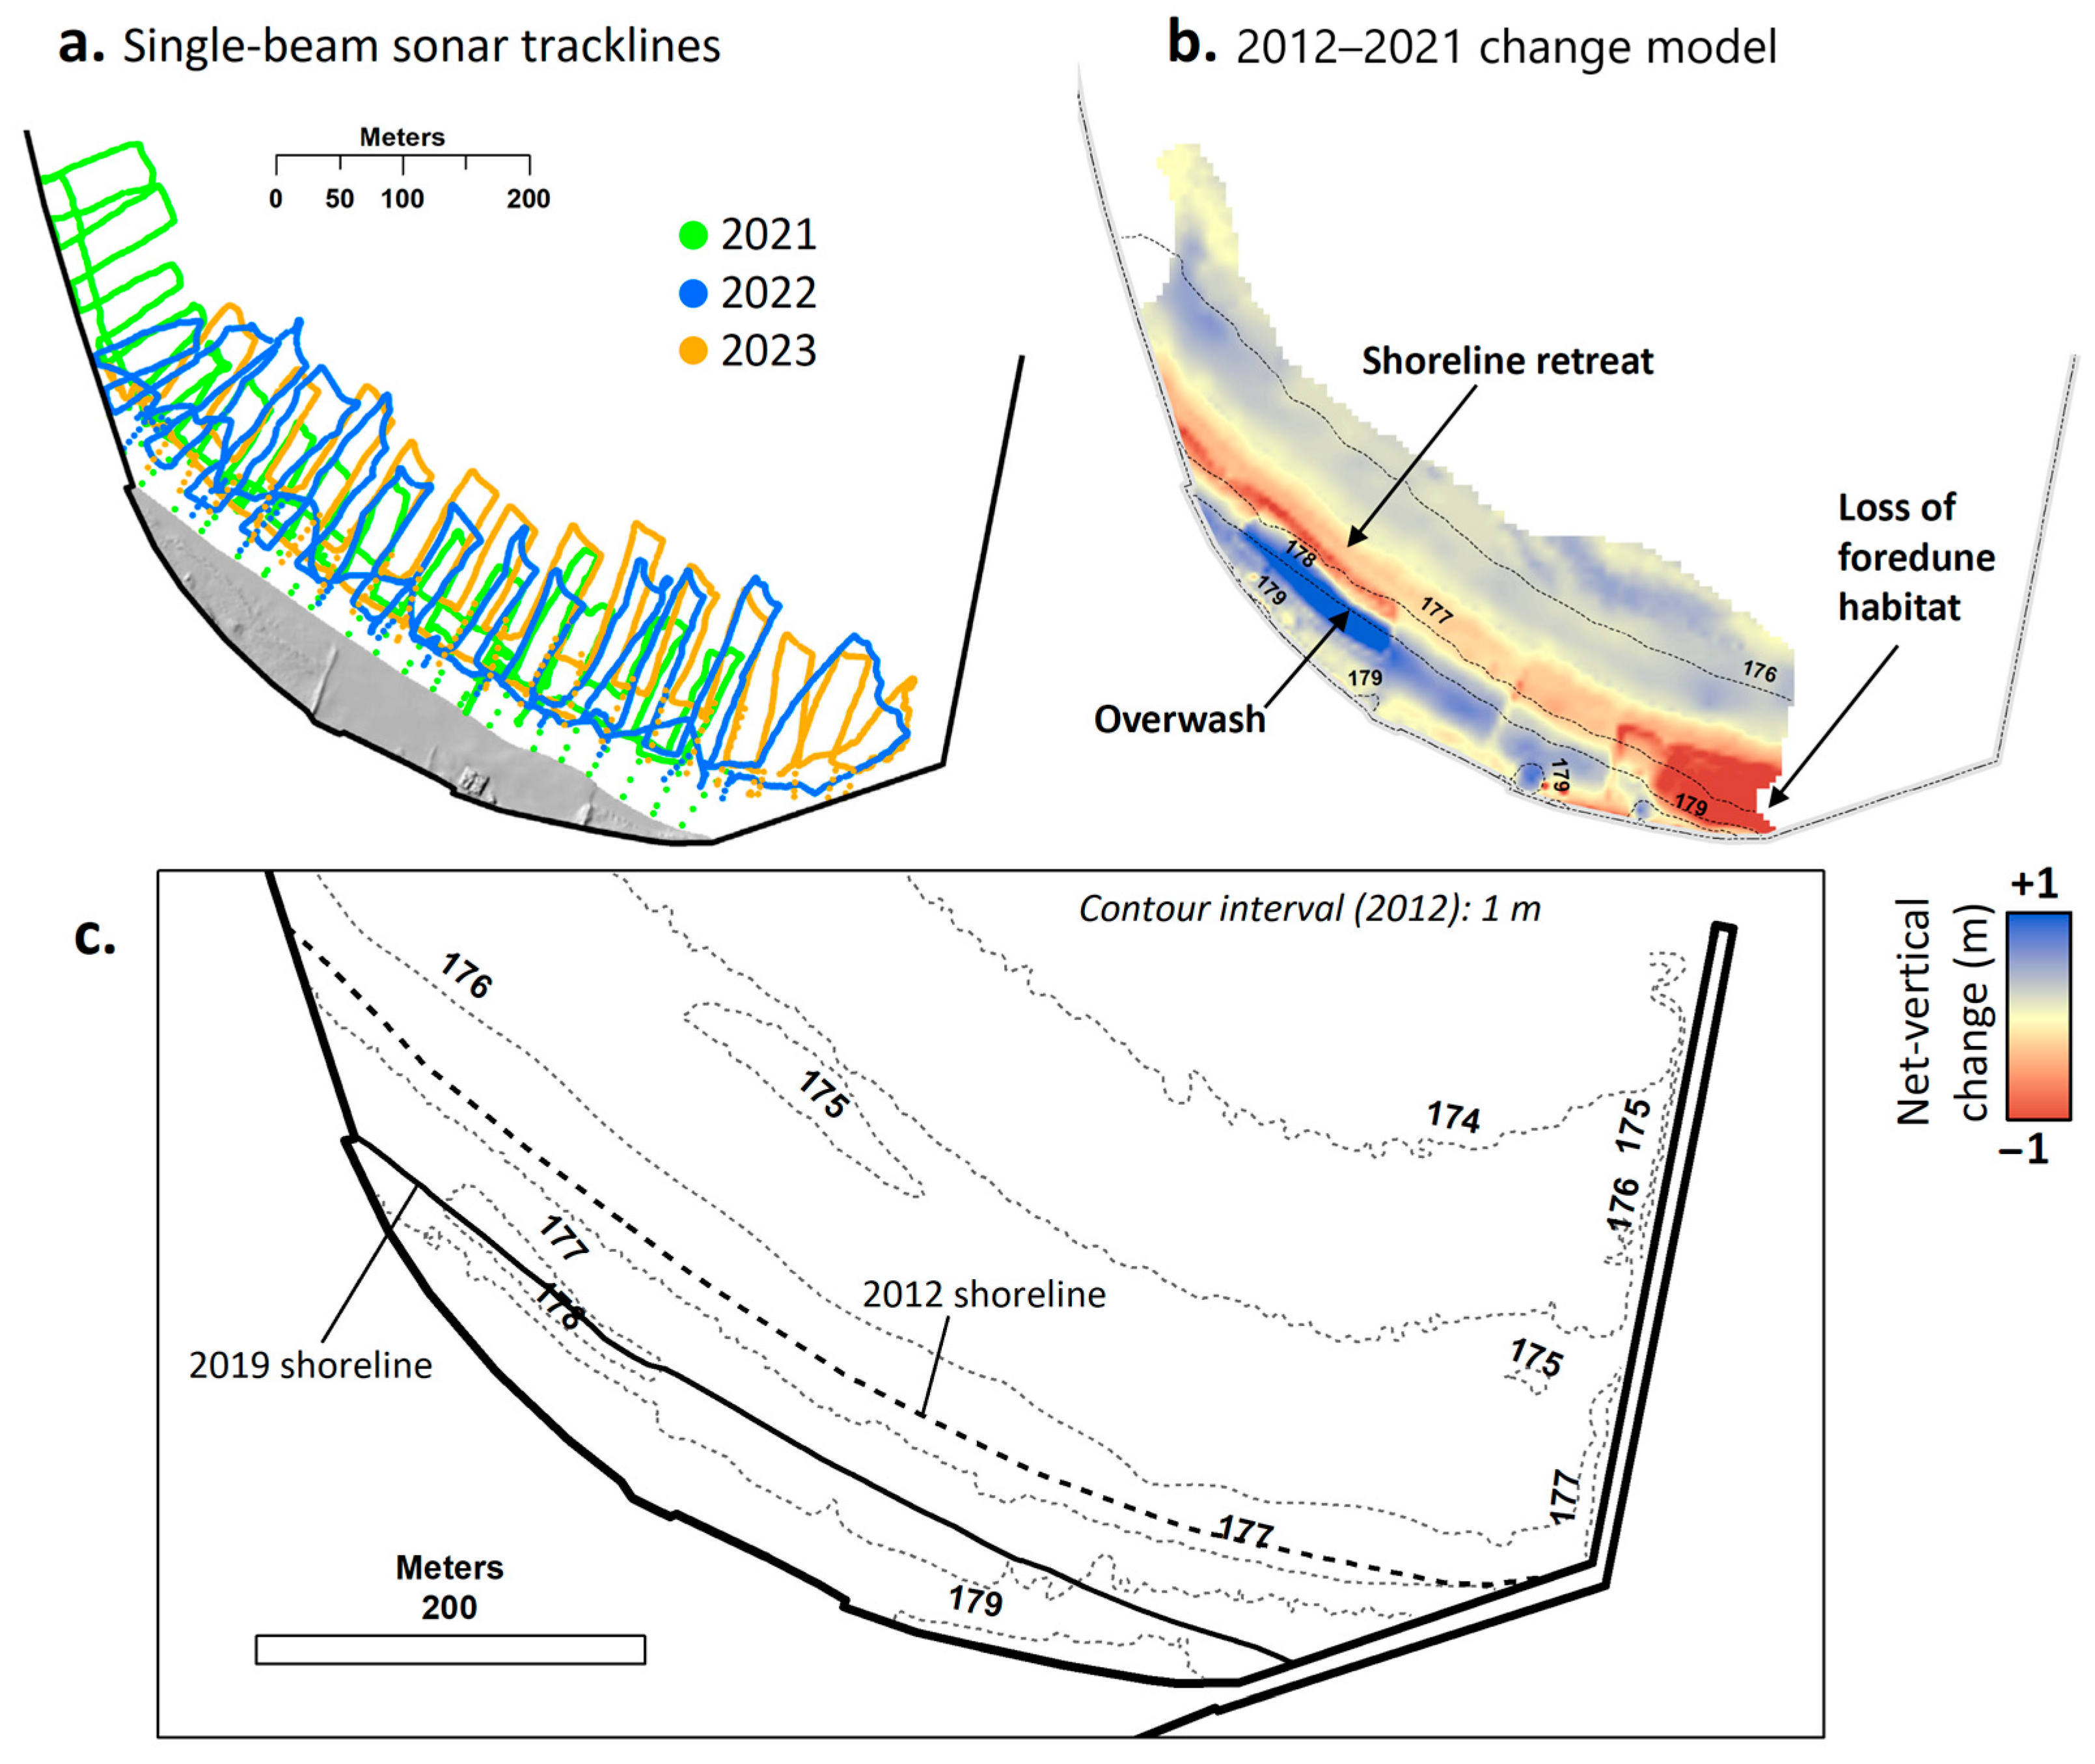
Single-beam sonar (SBES) records from across the enclosed (i.e., embayed) portion of the beach-proximal nearshore region were collected by the ISGS in 2021, 2022, and 2023, using a remotely controlled dual-pontoon vessel [93]. The Seafloor System HydroLite dual-frequency (200/30 kHz) system was integrated with the same Trimble R12i RTK-GPS unit used for the beach topographic work. The unit was guided from shore using an ~25 m spacing between shore-perpendicular transect lines, which extended from ~0.5 m in water depth to ~150 m from the shoreline. Lake depths, based on a 1500 m/s two-way signal travel time through water, were subtracted from measured GPS-point elevations and interpolated in ArcMap 10.7, using the Natural Neighbor gridding algorithm. The shallow-water gap between sonar coverage (from ~0.5 m in depth lakeward) and beach topographic coverage (across the subaerial beach), provided by SfM Photogrammetry using sUAV imagery, was closed with RTK-GPS profiling, at a 25 m spacing between cross-shore-oriented transects. Topographic and bathymetric datasets provided inputs for interpolating topobathymetric DEMs, in North American Vertical Datum of 1988 (NAVD88) meters, for comparison using raster subtraction. These were rendered at 5 m resolution, given the relative coarseness of data spacing for the bathymetric component compared to the 0.5 m resolution of sUAV-based topographic DEMs, which were subsampled accordingly. The process involved a fishnet point-based (at 5 m spacing) extraction of topographic DEM data, integration with bathymetric point data, and interpolation using the Natural Neighbor gridding algorithm. The 2021 topobathymetric DEM served as the lake-level highstand model for addressing geomorphic and sand volumetric changes since the 2013 lake-level lowstand [12], for which the 2012 USACE topobathymetric surface was used.

3. Results

This section is partitioned by data type: (1) Topographic, (2) subsurface geophysical, and (3) topobathymetric. Subsurface interpretations were integrated with topographic data extractions along shore-perpendicular transect lines for evaluation of stratigraphic manifestation of geomorphic changes. Topobathymetric assessments were undertaken to provide information on sand volumetric changes with lake-level rise and to provide a more holistic view of sedimentary changes across the SSB urban embayment.

3.1. Changes in Beach Topography

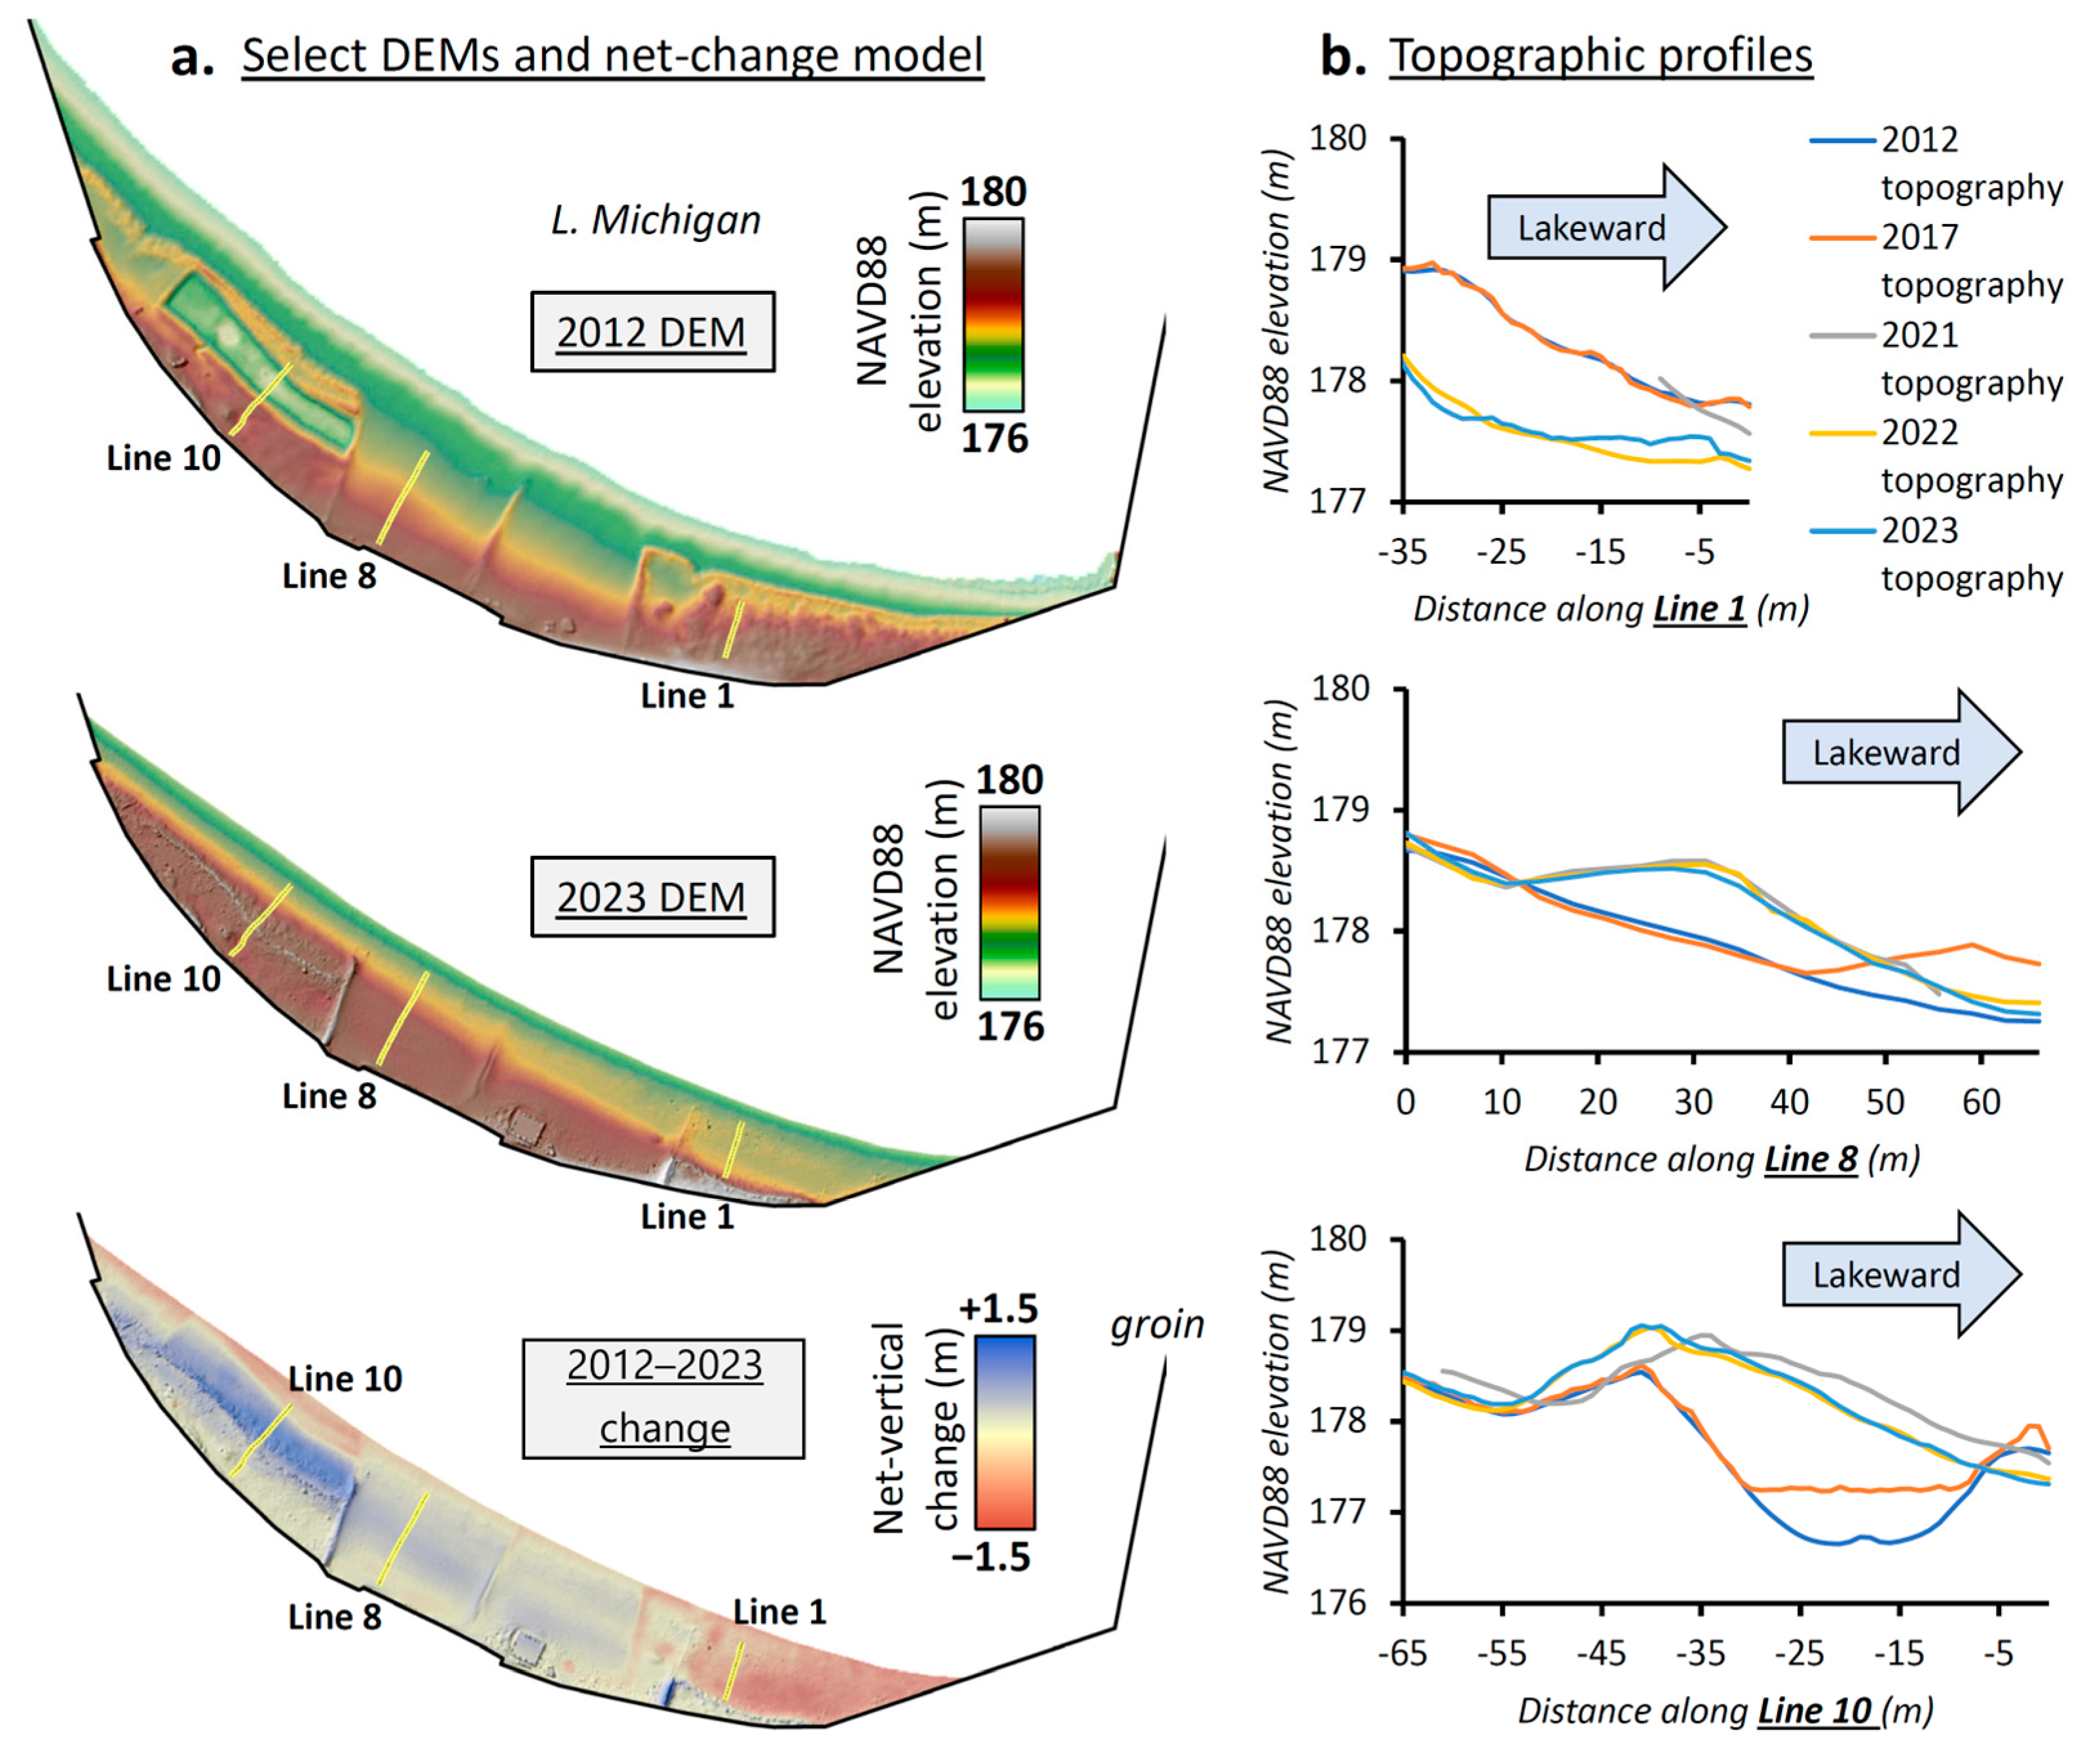
Lake-level lowstand and highstand beach topographies are captured by 2012 USACE and 2021–2023 ISGS DEMs, respectively. Figure 3 compares the 2012 and 2023 DEMs, highlighting net vertical changes by raster subtraction (2023–2012). Notable patterns of change across this timespan, over which lake-level had risen >1.5 m, from 2013 to 2020 [12]: (1) The infilling of the engineered trough (i.e., linear depression) within Area 1, along the western section of beach; (2) little vertical change, comparatively, across Area 2, the groomed central beach portion; and (3) near-total loss of the vegetated foredune environment in Area 3, the easternmost portion of beach. Only minor topographic changes are recognized between 2021, 2022, and 2023 DEMs, with interannual lake-level fall (of ~1 m in total), in comparison to geomorphic developments between 2012 and 2021, with lake-level rise. Vertical changes along select GPR transect locations are detailed.
Elevation-profile developments along GPR Line 10, on the littoral updrift, western side of the beach, were characterized by net gains in elevation between 2012 and 2017, with an ~20 m wide zone of ~0.5 m of accretion (Figure 3). This accretion was associated with the early infilling of the ‘swale’ in the 2012 beach topography, which had completely infilled by 2022, with 2017–2022 accretion spanning a 50 m-wide portion of the beach profile. This development was linked to the truncation of the more lakeward portion of the lowstand beach topographic profile; Figure 3 shows this in the 2012–2023 geomorphic change model and the topographic profile extraction for Line 10. Overwash-induced accretion from 2017 to 2023, likely sourced by shoreline retreat, extended landward beyond the confines of the former depression to reach elevations >179 NAVD88 m.
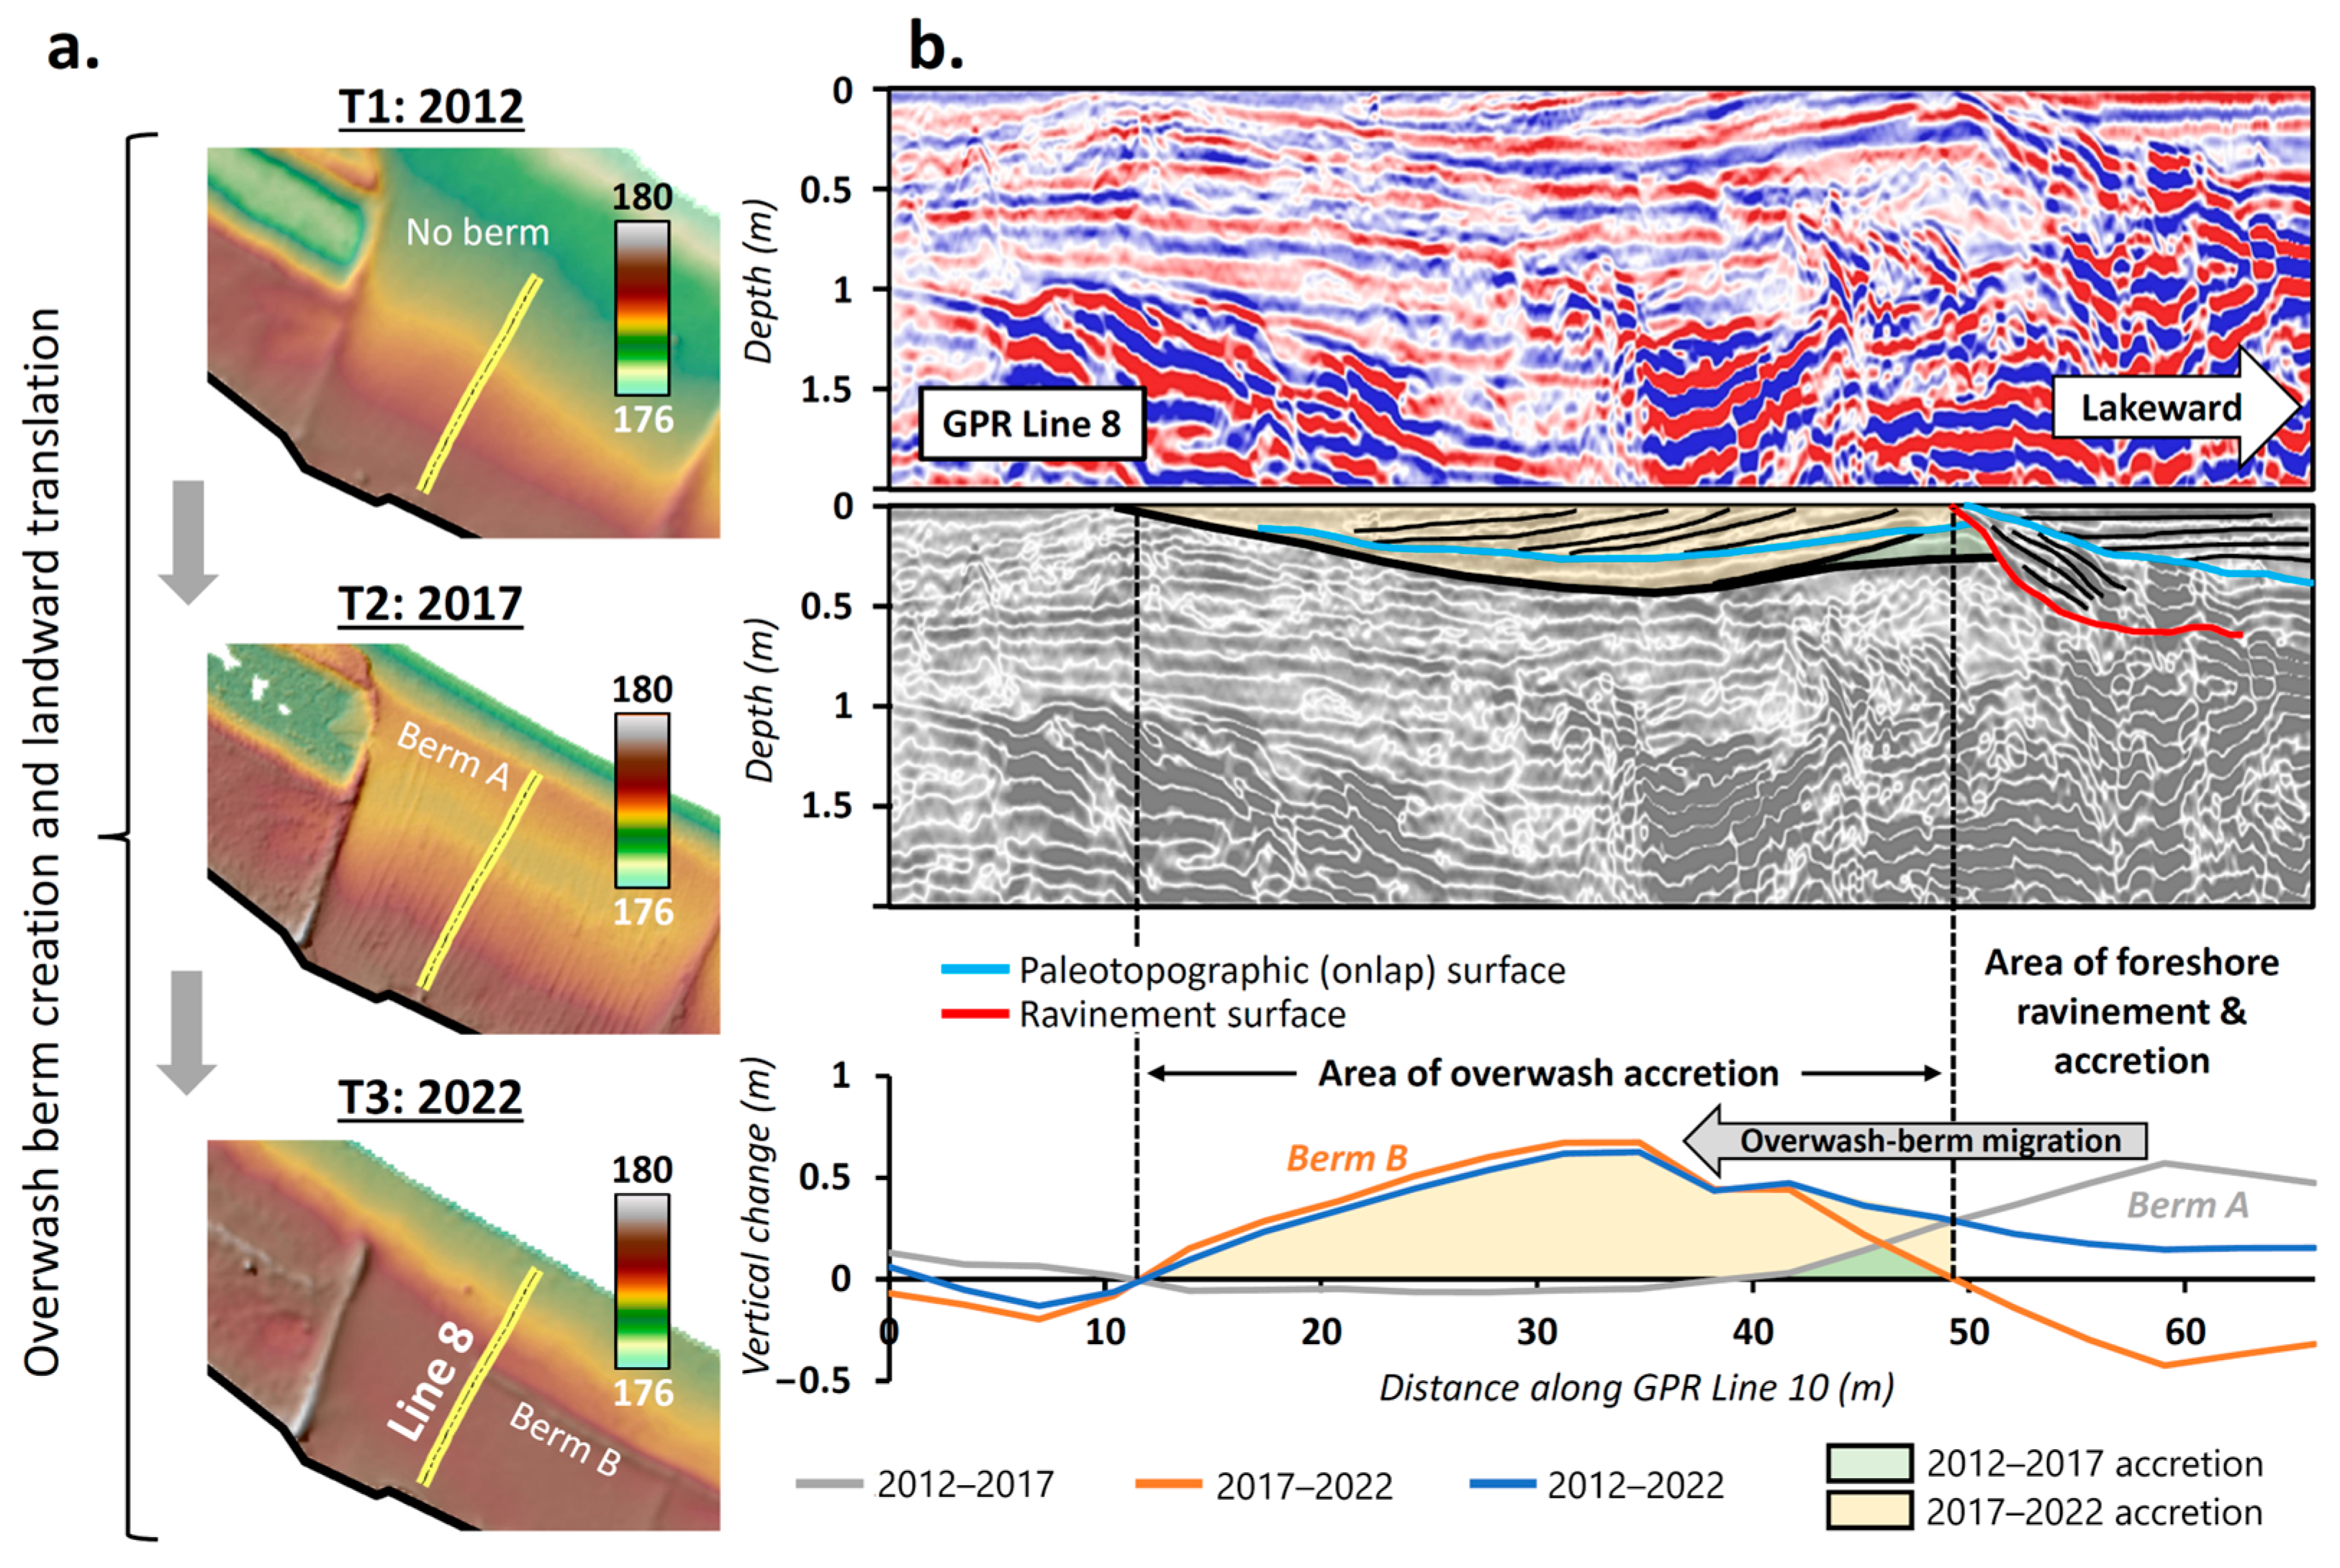
Overwash-induced accretion is also captured in topographic data extractions along GPR Line 8, from the central beach compartment. The 2017 profile shows an ~0.5 m berm in a more lakeward position than one of comparable size and morphology resolved in 2021–2023 profile extractions, with a consistent landward-dipping slope of ~0.01 on the backshore side (Figure 3b). The horizontal offset between 2017 and 2021–2023 berm positions is ~30 m, and the vertical offset measures ~0.7 m. Geomorphic changes across this portion of the beach were more subtle than those in the more naturalized management compartments to either side (Areas 1 and 3), and highstand beach elevations throughout the lake-level change episode remained <179 m (NAVD88), based on available data.
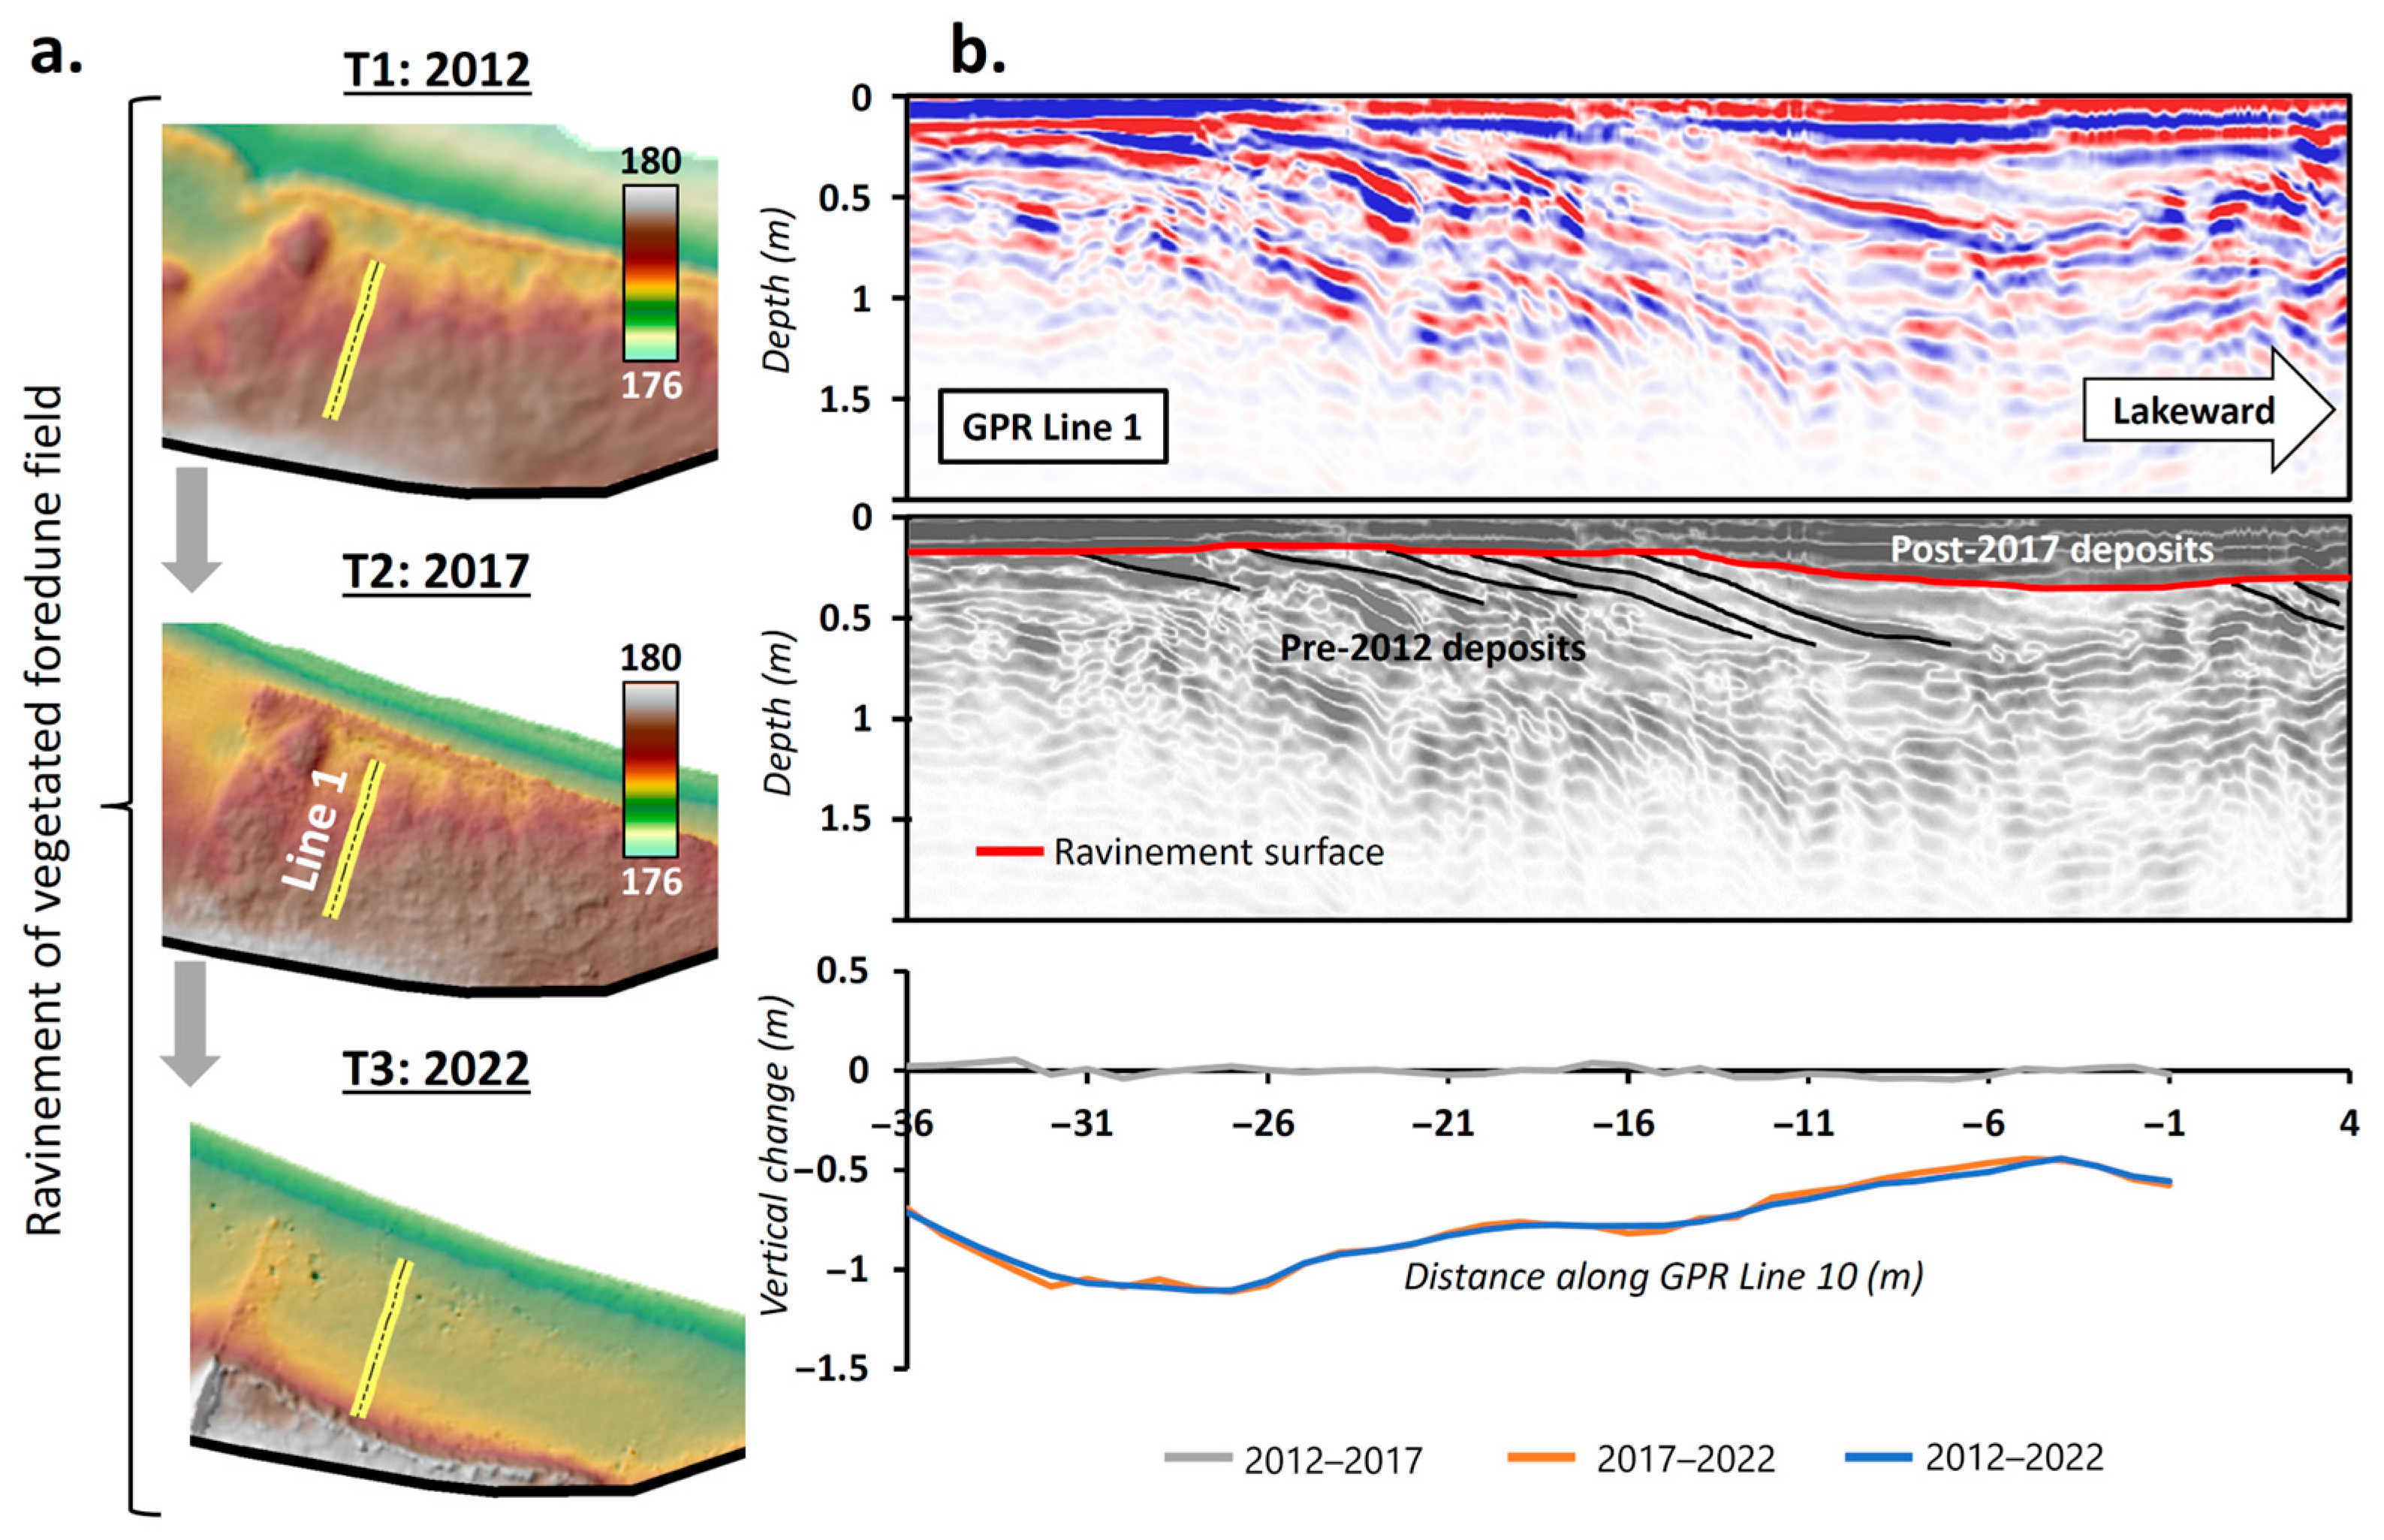
Elevation losses across the eastern management compartment’s foredune area, along GPR Line 1, were about 0.5 m to 1 m in magnitude between 2012 and 2022 (Figure 3). The lowstand beach elevations here were close to 179 m (NAVD88); beach elevations in 2022 and 2023 were <178 m (NAVD88). Much of the elevation loss occurred after the 2021 survey. The 2012 and 2017 profiles are close to identical, and 2021 topography, where mapped, suggests that most of the beach depositional profile was intact, with only minor elevation loss within 10 m of the shoreline (Figure 3b). Changes from 2022 to 2023 include evidence of dm-scale profile accretion close to the shoreline.

3.2. Subsurface Architectures

GPR data were acquired a little over a month after the sUAV-data collection rendered the 2022 beach DEM (31 May vs. 19 April). All GPR-transect lines were oriented shore-perpendicular, across mostly flat (i.e., topographically subdued) to gently lakeward-dipping beach terrains. Non-vertical GPR beam orientations were thus avoided. Given the dynamic nature of shoreline environments, the absence of co-temporal topographic and GPR data collection, and GPR data-processing limitations (i.e., inability to vertically adjust GPR imagery using a topographic profile), subsurface analyses were based on stratigraphic unit thicknesses and subsurface structural correlations with topographic profile-based information. There are few radar-facies distinctions based on reflection amplitude and internal reflection configuration, given relative homogeneity of geological materials imaged (sand). Subsurface interpretations focused on stratal termination patterns and basic stratigraphic principles (e.g., cross-cutting relationships). This section integrates subsurface interpretations with those obtained from DEM-based elevation extractions.
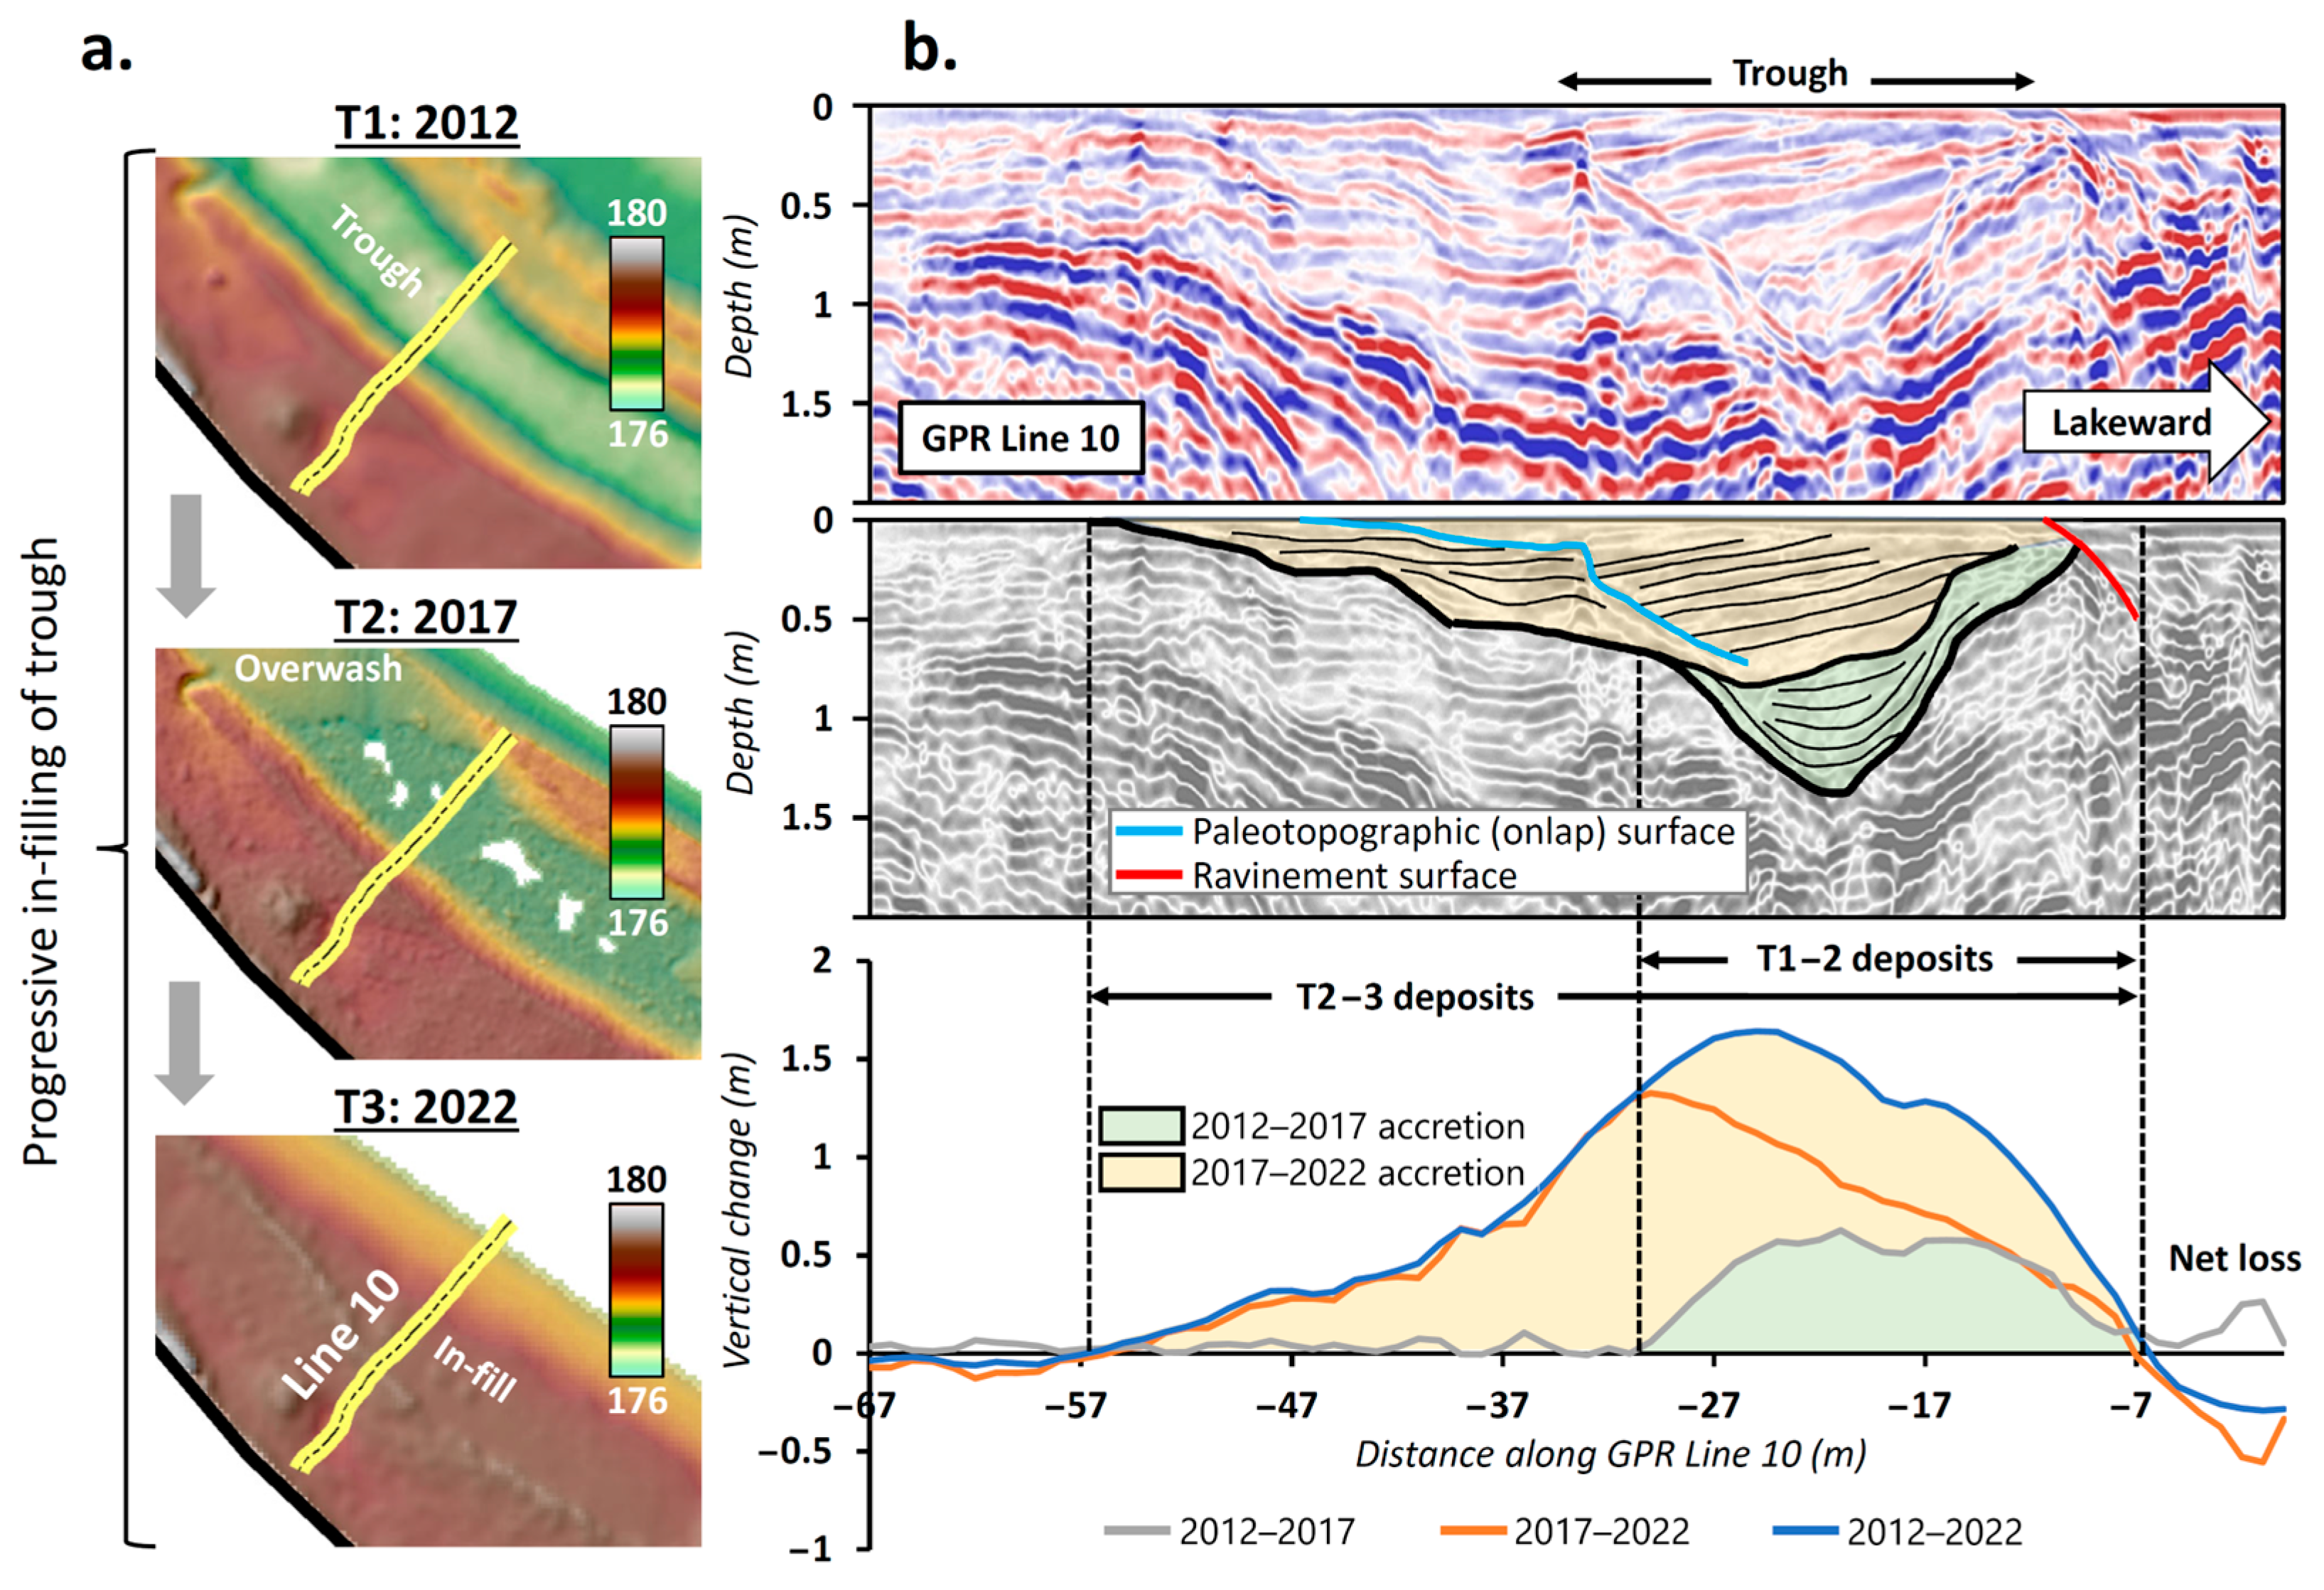
Radar reflections along GPR Line 10 delineate a U-shaped ‘container’ of ~1.5 m in depth (Figure 4). This structural feature is mapped across the exact location and approximate elevation range of the trough that was constructed in 2008/2009 and is shown prominently in Figure 1c (in an aerial image from 2014). The container’s bounding surface, shown as a heavy black line in the interpretation in Figure 4b, is recognized by onlap of stratigraphically younger, gently landward-dipping units. Onlap points reach further inland with decreasing depth (and age). These sediment packages are interpreted as products of overwash-induced accretion, based on architecture, known geomorphic history, and inferred genetic association from post-2012 topographic beach-profile developments (Figure 3). Figure 4 plots 2012–2017 and 2017–2022 elevation differentials against GPR-based stratigraphic interpretations, with horizontal extents and vertical scales normalized between GPR imagery and topographic profile graphs. Overwash-deposit thicknesses, as suggested by topographic profile extractions, align with interpreted post-2012 sand thicknesses, mapped with GPR (Figure 4). Two distinct episodes of accretion/trough infilling are recognized in GPR imagery. Their lateral extent and architecture provide clues regarding the timing of emplacement, with the 2012–2017 accretionary wedge that infilled the lowest-elevation portion of the former lowstand (2012) topography (T1–T2) distinguished from the more extensive accretion to follow post-2017 (T2–T3), which, based on relict subsurface depositional structure and topographic profile reconstruction, included the landward migration of the lowstand berm (Figure 3 and Figure 4). A GPR surface suggesting erosional truncation is noted to occur ~7 m landward of the lakeward profile terminus (shown in red in Figure 4b). This feature relates spatially to a nodal position within the net vertical change plots, which separates net-erosional from net-accretionary profile portions (from lowstand to highstand condition). This surface coincides with the highstand beach transition from lakeward-inclined foreshore to landward-inclined backshore environment.
The shallow subsurface beneath the middle portion of GPR Line 8, <1 m in depth, is defined by an onlap surface that extends beneath the area of known berm creation, as captured in the elevation difference between 2017 and 2022 topographic data profiles (Figure 5). This surface is ~40 m in cross-shore extent, and it is onlapped by overlying GPR surfaces in an increasingly landward direction, with stratigraphic superposition. The area experienced net-elevation gain from 2012 to 2022, with ~0.5 m of accretion between 2012 and 2017 linked to berm formation during the initial lake-level rise (Figure 2 and Figure 5b). Berm A, associated with 0.5 m of accretion near the lakeward terminus of GPR Line 8, between 2012 and 2017 (T1–T2), migrated landward with post-2017 lake-level rise, with Berm B located ~30 m landward of the Berm A position (Figure 3b and Figure 5b). The area lakeward of the Berm B crest position was ravined between 2017 and 2021, based on topographic profile extractions (Figure 3). The sedimentary architecture elucidated from GPR imagery lakeward beyond an approximate nodal point separating landward net-accretionary sections (associated with Berm B development) from net-erosional sections (associated with Berm A loss) is suggestive of ravinement and accretionary processes throughout the 2012–2022 developmental history (Figure 5b), with a net-erosional end result.
The 2022 beach topographic surface along GPR Line 1 is underlain by a continuous radar reflection, at <0.25 m in depth (Figure 6). This surface truncates lakeward-sloping units, which are interpreted as former foreshore accretionary surfaces reflective of a former episode or multiple episodes of profile accretion and/or progradation. Unlike the subsurface architecture along GPR Lines 8 and 10 (Figure 4 and Figure 5), there is no clear sign of directional depositional onlap against this surface. GPR imagery instead suggests that a dm-thick surficial sand unit drapes this erosional unconformity/ravinement surface. While little topographic change occurred across this area between 2012 and 2017, with the initial rise in water level (Figure 2), the final transition to the lake-level highstand coincided with 0.5–1 m loss in elevation along the entire Line 1 profile section (by 2022), despite this management terrain’s former (lowstand) vegetation cover and relatively high relief, compared with the other beach sections (Figure 3 and Figure 6).

3.3. Topobathymetric Changes

A 2021 topobathymetric DEM, based on sUAV-derived topographic and single-beam sonar-derived bathymetric data, was compared to the 2012 USACE (LiDAR-derived) topobathymetric DEM. These two datasets bracket the low-high decadal lake-level transition. The resulting net vertical change model captures the net picture of system morphodynamics and sand volumetric change, with decadal lake-level rise >1.5 m (Figure 7). Unfortunately, extremely shallow depths (<0.5 m) and navigation obstructions (e.g., rock debris) along the eastern groin-proximal nearshore prevented complete data coverage of the beach-proximal embayment. Still, a useful picture emerges from the overlapping 2012 and 2021 data coverage, the most appropriate for characterizing the cumulative impact of the lake-level rise episode. Vertical changes were most pronounced across the former backshore region of the lowstand terrain, as up to 1.6 m of accretion occurred with the in-filling of the constructed trough in Area 1, and up to ~1.75 m of elevation loss occurred in connection with scarp retreat into the vegetated foredune terrain of Area 3 (Figure 7). Three shore-parallel zones of vertical change are broadly distinguished, not accounting for minor alongshore variances: (1) Accretion of the backshore, facilitated by overwash during lake-level rise; (2) erosion between lowstand and highstand shorelines, associated with beach-profile retreat; and (3) minor accretion (<1 m) of the embayed nearshore environment. With a mean elevation change of about +12 cm, based on raster statistics for the area of overlapping 2012 and 2021 data coverages, a sand gain of 16,000 m3 across the area of analysis is inferred. However, it should be noted that this value is within the vertical range of uncertainty, based on the compounding of vertical errors of federal and ISGS datasets, each at the dm-scale. It is likely that no substantial change in sand volume occurred, given the high degree of beach enclosure by inwardly ‘bent’ groins (preventing or limiting influx potentials) and a sand-deprived proximal littoral updrift [29].

4. Discussion

Beach morphodynamics along large lakes are complex and influenced by seasonal lake-level oscillations at the dm-scale, sub-decadal water-level oscillations at the m-scale, strong storm waves, currents, and surges, and winter ice-related process dynamics. The urbanization of lakefront regions has imposed further complexities and, while beaches along engineered lakefronts are important buffers against wave attack, ecological habitat, and recreational terrains, few efforts have addressed urban beach morphodynamics. This study, built on a growing dataset from the Chicago lakefront, along southwestern Lake Michigan, sought to address the geomorphic development of a popular beach characterized by semi-enclosure and a variety of terrain physiography. The beach at 63rd St. (SSB), located in Jackson Park on the south side of Chicago, was chosen for detailed stratigraphic and geomorphologic reconstruction for the following reasons: It was prioritized by the Chicago Park District and IDNR-CMP as one of four to be actively monitored for topobathymetric changes by the ISGS [89,93]. Furthermore, beach compartmentalization into different management zones, including recreational and protected areas, is reflective of common beach activities across >20 Chicago area beaches (Figure 1 and Figure 2). Insights from this case study therefore extend beyond SSB and should be particularly applicable to similarly constructed embayments, with groins on updrift and downdrift sides, similar orientation/aspect of the embayment-lake interface, and similar littoral sand-supply conditions [6].

4.1. Beach Morphodynamics and Their Stratigraphic Legacy

Three different modes of beach-profile development with decadal water-level rise were captured at SSB, as reflected by elevation extractions along GPR transect locations from available topographic DEMs (Figure 2c). The 2012 USACE and 2021–2023 ISGS datasets inform on lowstand and highstand beach topographic conditions, respectively (Table 1; Figure 3, Figure 4, Figure 5 and Figure 6). Changes in beach morphology in response to >1.5 m of water-level rise, from 2013 to 2020 [12], were influenced by: (1) Antecedent backshore topographic conditions (e.g., ridge-and-swale topography versus groomed beach versus vegetated eolian foredune terrain; Figure 2); and (2) boundary effects along the urban lakefront infrastructure that impacted hydrodynamics during high-energy events (e.g., promoted scour alongside the terminal groin; Figure 7). As SSB started out with three different compartmentalized terrain types during the lake-level lowstand (i.e., based on the 2012 DEM), differential geomorphic responses captured by subsequent topographic monitoring and subsurface imaging datasets are evaluated within the context of these antecedent physiographic terrain conditions.
Across Area 1 (the western compartment), whose ‘ridge-and-swale’-style lowstand backshore terrain physiography was the most topographically varied (Figure 3), patterns of geomorphic change leading up to the lake-level highstand were similar to those observed along more natural sections of sandy Lake Michigan beach shoreline, including overwash deposits infilling swales [43]. The base of the swale bottomed out at <177 NAVD88 m in 2012; this elongate, topographic low was infilled with overwash sand supplied by the receding shoreline during profile adjustment to base decadal lake-level rise, from ~176 to >177 International Great Lakes Datum of 1985 (IGLD85) m (Figure 2c). The vertical difference between IGLD85 and NAVD88 is within the vertical range of uncertainty of geospatial datasets; while the former is standard for reporting Great Lakes water levels, topographic monitoring data were rendered using the latter [89]. The depositional architecture elucidated from GPR-based subsurface imaging points to a multi-phased infilling of the beach swale (i.e., ‘trough’). The initial 2012–2017 rise in lake level, ~1 m in magnitude (Figure 2c), was accompanied by the infilling of the western half of the linear, shoreline-parallel depression within the former (lowstand) backshore region, as seen along GPR Line 10 (Figure 3 and Figure 4). The 2012–2017 accretionary section of up to ~0.5 m in magnitude is at the base of the thickest 2012–2022 region of net-sand accumulation. These basal deposits, formed by overwash processes based on architecture (i.e., inferred landward-dipping stratal units), photo documentation [87], and genetic/spatial association with the lowstand berm (Figure 3), distinctly onlap a higher-amplitude bounding surface. Onlap points occur more landward with stratigraphic superposition, accordingly (Figure 4).
The preferential preservation of transgressive deposits, emplaced during lake-level rise, occurs within the lower-elevation portions of the antecedent lowstand topography and offers useful insights into process dynamics no longer evident from highstand beach physiography. This is highlighted in cross-shore beach-profile orientation in Figure 4, Figure 5 and Figure 6, with topographic monitoring and profile extractions along corresponding subsurface imaging lines helping to corroborate a reconstruction of dominant process dynamics with m-scale lake-level rise (Figure 3). The more nuanced stages of beach evolution (e.g., the initial infilling of the swale during early lake-level rise), which are reconstructed from subsurface data and historical topographic information, are not captured by topobathymetric change models, with data only covering lowstand and highstand beach conditions (Figure 7). A more closely spaced 3D grid of subsurface reflection data would render more detailed information on depositional structure to supplement/enhance aerial photo-derived insights (Figure 8). In the absence of high-resolution monitoring data, particularly pre- and post-storm surveys, one can still derive information on process dynamics from depositional architectures. Shallow subsurface geophysical imaging could be explored as a tool to help evaluate the efficacy of commonly emplaced shoreline (e.g., groin) infrastructure, offshore breakwaters, and/or constructed beach landforms (e.g., protective winter berms). The construction of winter sand berms along Chicago’s Montrose Beach, for instance, was commonplace during the years of elevated water level around 2020 [7]; this management approach was conducted to help protect bird habitat and eolian dune ridge-and-swale areas, but without concrete analytical backing of different berm designs.
The application of GPR to aid investigations of shorter-lived geomorphic process dynamics, including event-based coastal changes (e.g., with storm impact), holds much potential within the Great Lakes region, where sedimentary patterns are impacted by m-scale changes in base water level over relatively short timespans (e.g., a few years; Figure 2c). No oceanic analog is influenced by comparable base-level hydrodynamics (i.e., decadal fluctuations at the m-scale), despite cases of convergent geomorphic evolution and comparable geomorphic patterns. Beach rotation, for instance, is a common dynamic of oceanic ‘pocket’ beaches. Examples of beach rotation can be found in the Great Lakes, where they relate to multi-year to decadal lake-level rise and the therewith associated patterns of overwash into backshore regions; here, these patterns are influenced by lowstand beach characteristics, the evolving distribution of sediment accommodation with lake-level rise, and influences of lakefront infrastructure on storm hydrodynamics [6,11]. The detailed assessment of SSB further highlights the role of lowstand beach topography as a factor governing the spatial distribution of overwash deposits and alongshore differentials in shoreline response to lake-level rise. Rotational dynamics of oceanic pocket beaches, on the other hand, relate to impacts of individual storm events or seasonal climatic forcing such as shifts in prevailing storm-wind patterns [95,96,97]. Event-based shoreline rotation is an unlikely scenario for the Chicago coast given directional fetch limitations; the largest waves along southwestern Lake Michigan are exclusively associated with an approach from the N/NE sector, the direction of maximum fetch [71,79]. With alongshore sediment transport from north to south, changes in sediment accommodation with lake-level variances and hydrodynamic modifications around shoreline infrastructure (e.g., scour along groins) produce predictable patterns of beach rotational behavior with repeat, semi-periodic fluctuations in water level that alter the space for sediment redistribution.
Geomorphic change patterns along GPR Line 8, which spans the actively groomed beach section (Area 2; Figure 1 and Figure 2), are similar to those observed along GPR Line 10 (Area 1). However, the absence of a topographically varied ‘berm-and-trough’ (i.e., ridge-and-swale) lowstand beach terrain, as once in Area 1, has subdued the demarcation of the foreshore-backshore transition by grooming and grading processes. The ‘ramp-style’ lowstand topography of Area 2 reverted to a more natural one through berm nucleation and migration up the beach face during lake-level rise. This dynamic was captured by topographic data from before the onset of seasonal beach-grooming activities in May. Initial Area 2 berm formation trended spatially with the trough in Area 1 and occurred from 2012 to 2017, with few changes noted for the portion of beach landward of this location (Figure 5). The berm welded against the upper beach terrain and is unrecognized in data from 2017 onward. Geomorphic change patterns along Area 3, whose lake-level lowstand terrain was characterized by an area of vegetated foredune development (Figure 1c), appear more punctuated and potentially threshold-driven than those in Areas 1 and 2. This area also experienced little to no accretion, but underwent shoreline recession by scarp retreat, as evidenced by what remains of a once sizeable foredune terrain (Figure 1 and Figure 6). The erosive nature of this zone, which is groin-proximal (i.e., on the embayment’s downdrift side), is attributed to heightened exposure to incoming wave energies, particularly those originating from the N/NE quadrant. With few opportunities for overwash into landward backshore terrains along Area 3, mostly backed by groin infrastructure, lake-level rise here is accompanied by heavy erosion and sand export (Figure 3). Correspondingly, GPR Line 1 shows a continuous surface of erosional truncation of lakeward inclined depositional surfaces, from an earlier phase of beach accretion/progradation (Figure 6). This surface was buried just a few decimeters beneath the flat and near-horizontal 2022 beach surface, which was ~1 m lower in elevation than in 2012 and 2017 topographic datasets (Figure 6). While ravinement occurred along the other beach zones, as evidenced by similar truncation surfaces near the lakeward ends of GPR Lines 8 and 10 (Figure 4 and Figure 5), it was restricted in cross-shore extent and was accompanied by overwash accretion on the landward side (Figure 3b, Figure 4 and Figure 5). The transgressive surface beneath Area 3 is draped by a thin veneer of sand, which is interpreted as the modern ‘active zone of reworking’. It remains to be seen whether this surface is kept intact by burial (with the ensuing beach-recovery phase).
Shoreline retreat during 2013–2020 lake-level rise was common to all Chicago beaches [6,11]; however, differences in shoreline and embayment orientation, shape, and degrees of enclosure by groins and groin-attached breakwaters contributed to varying geomorphic expressions. Different directions and degrees of beach rotation, for instance, relate to: (1) Antecedent topographic conditions, which influence the distribution of sediment-accommodation creation across the backshore (guiding overwash-accretion patterns); and (2) hydrodynamic patterns driven by the surrounding infrastructure (e.g., wave refraction, approach, and scour impacts along shoreline structures). SSB provides examples of how these influences manifest stratigraphically, which can help to inform us on past base level-driven geomorphic patterns. The process-informed architectural blueprint for pocket beaches enhances our conceptual understanding of embayed beach morphodynamics in response to m-scale water-level fluctuations. The maximum overwash-deposit thickness across Area 1 exceeds that of Area 2; however, landward extents along Area 2 are greater than along Area 1 (Figure 3b). This relates, at least in part, to the controls of antecedent topographic conditions, which evolve as certain beach-management practices (e.g., grooming) are implemented throughout changing lake-level conditions. Patterns of overwash remain constant along strike within each management area. The absence of overwash deposits along Area 3 relates to the higher topographic elevations and vegetative cover (e.g., root mat-related structural enhancement); as this part of the beach is proximal to the downdrift groin, scouring is common during high-energy events, particularly for storms with wave approach from the N/E (which have the largest waves and the strongest currents). This has been observed at other Chicago beaches, all of which are generally N/NE-facing [6]. With a lack of sediment accommodation to allow for the retention of sand by overwash and backshore accretion, wave attack during elevated water-level conditions here favors foredune-scarp retreat and widening of the shoreface zone of wave runup (Figure 3b). The ISGS topographic dataset shows that the bulk of the sediment loss from Area 3, along the portion of beach mapped with GPR, occurred close to the highstand-falling limb of the decadal lake-level curve (Figure 2c and Figure 3a). No changes are seen between 2012 and 2017 topographic profiles, when other parts of the beach had already responded geomorphologically to early lake-level rise, which was about one meter. Ravinement of the foredune field (Area 3) was most dramatic between 2021 and 2022 (Figure 3a); it is possible that a geomorphic threshold had to be overcome, involving the complete loss of the foredune-fronting beach buffer for full wave energy to target the foredune scarp. Topobathymetric monitoring studies of higher resolution, hydrodynamic instrument deployments, to address embayed nearshore storm hydrodynamics, and beach camera-based image analyses could further refine this understanding, aided by computational modeling.

4.2. Insights for Regional Beach Management

Different beach-management activities during low lake-level phases, from active seasonal grooming to the targeted promotion of vegetative recruitment and eolian foredune development, have a demonstrable impact on backshore geomorphic development during the lake-level rise and highstand phase. This is exemplified by developments at SSB, Chicago, during the 2013–2020 decadal rise in base water level, from a historical (1918-present) low in winter of 2013 (at ~175.5 IGLD85 m) to a near-historical high in summer of 2020 (at ~177.5 IGLD85 m; Figure 2c). This magnitude of lake-level change has occurred many times before and is likely to occur again, prompting the question of whether geomorphic response is something that can be predicted, here or elsewhere along the urban lakefront corridor, given our understanding of the importance of sand-supply dynamics and infrastructure controls on the geomorphic development of Great Lakes beaches [6,29,30].
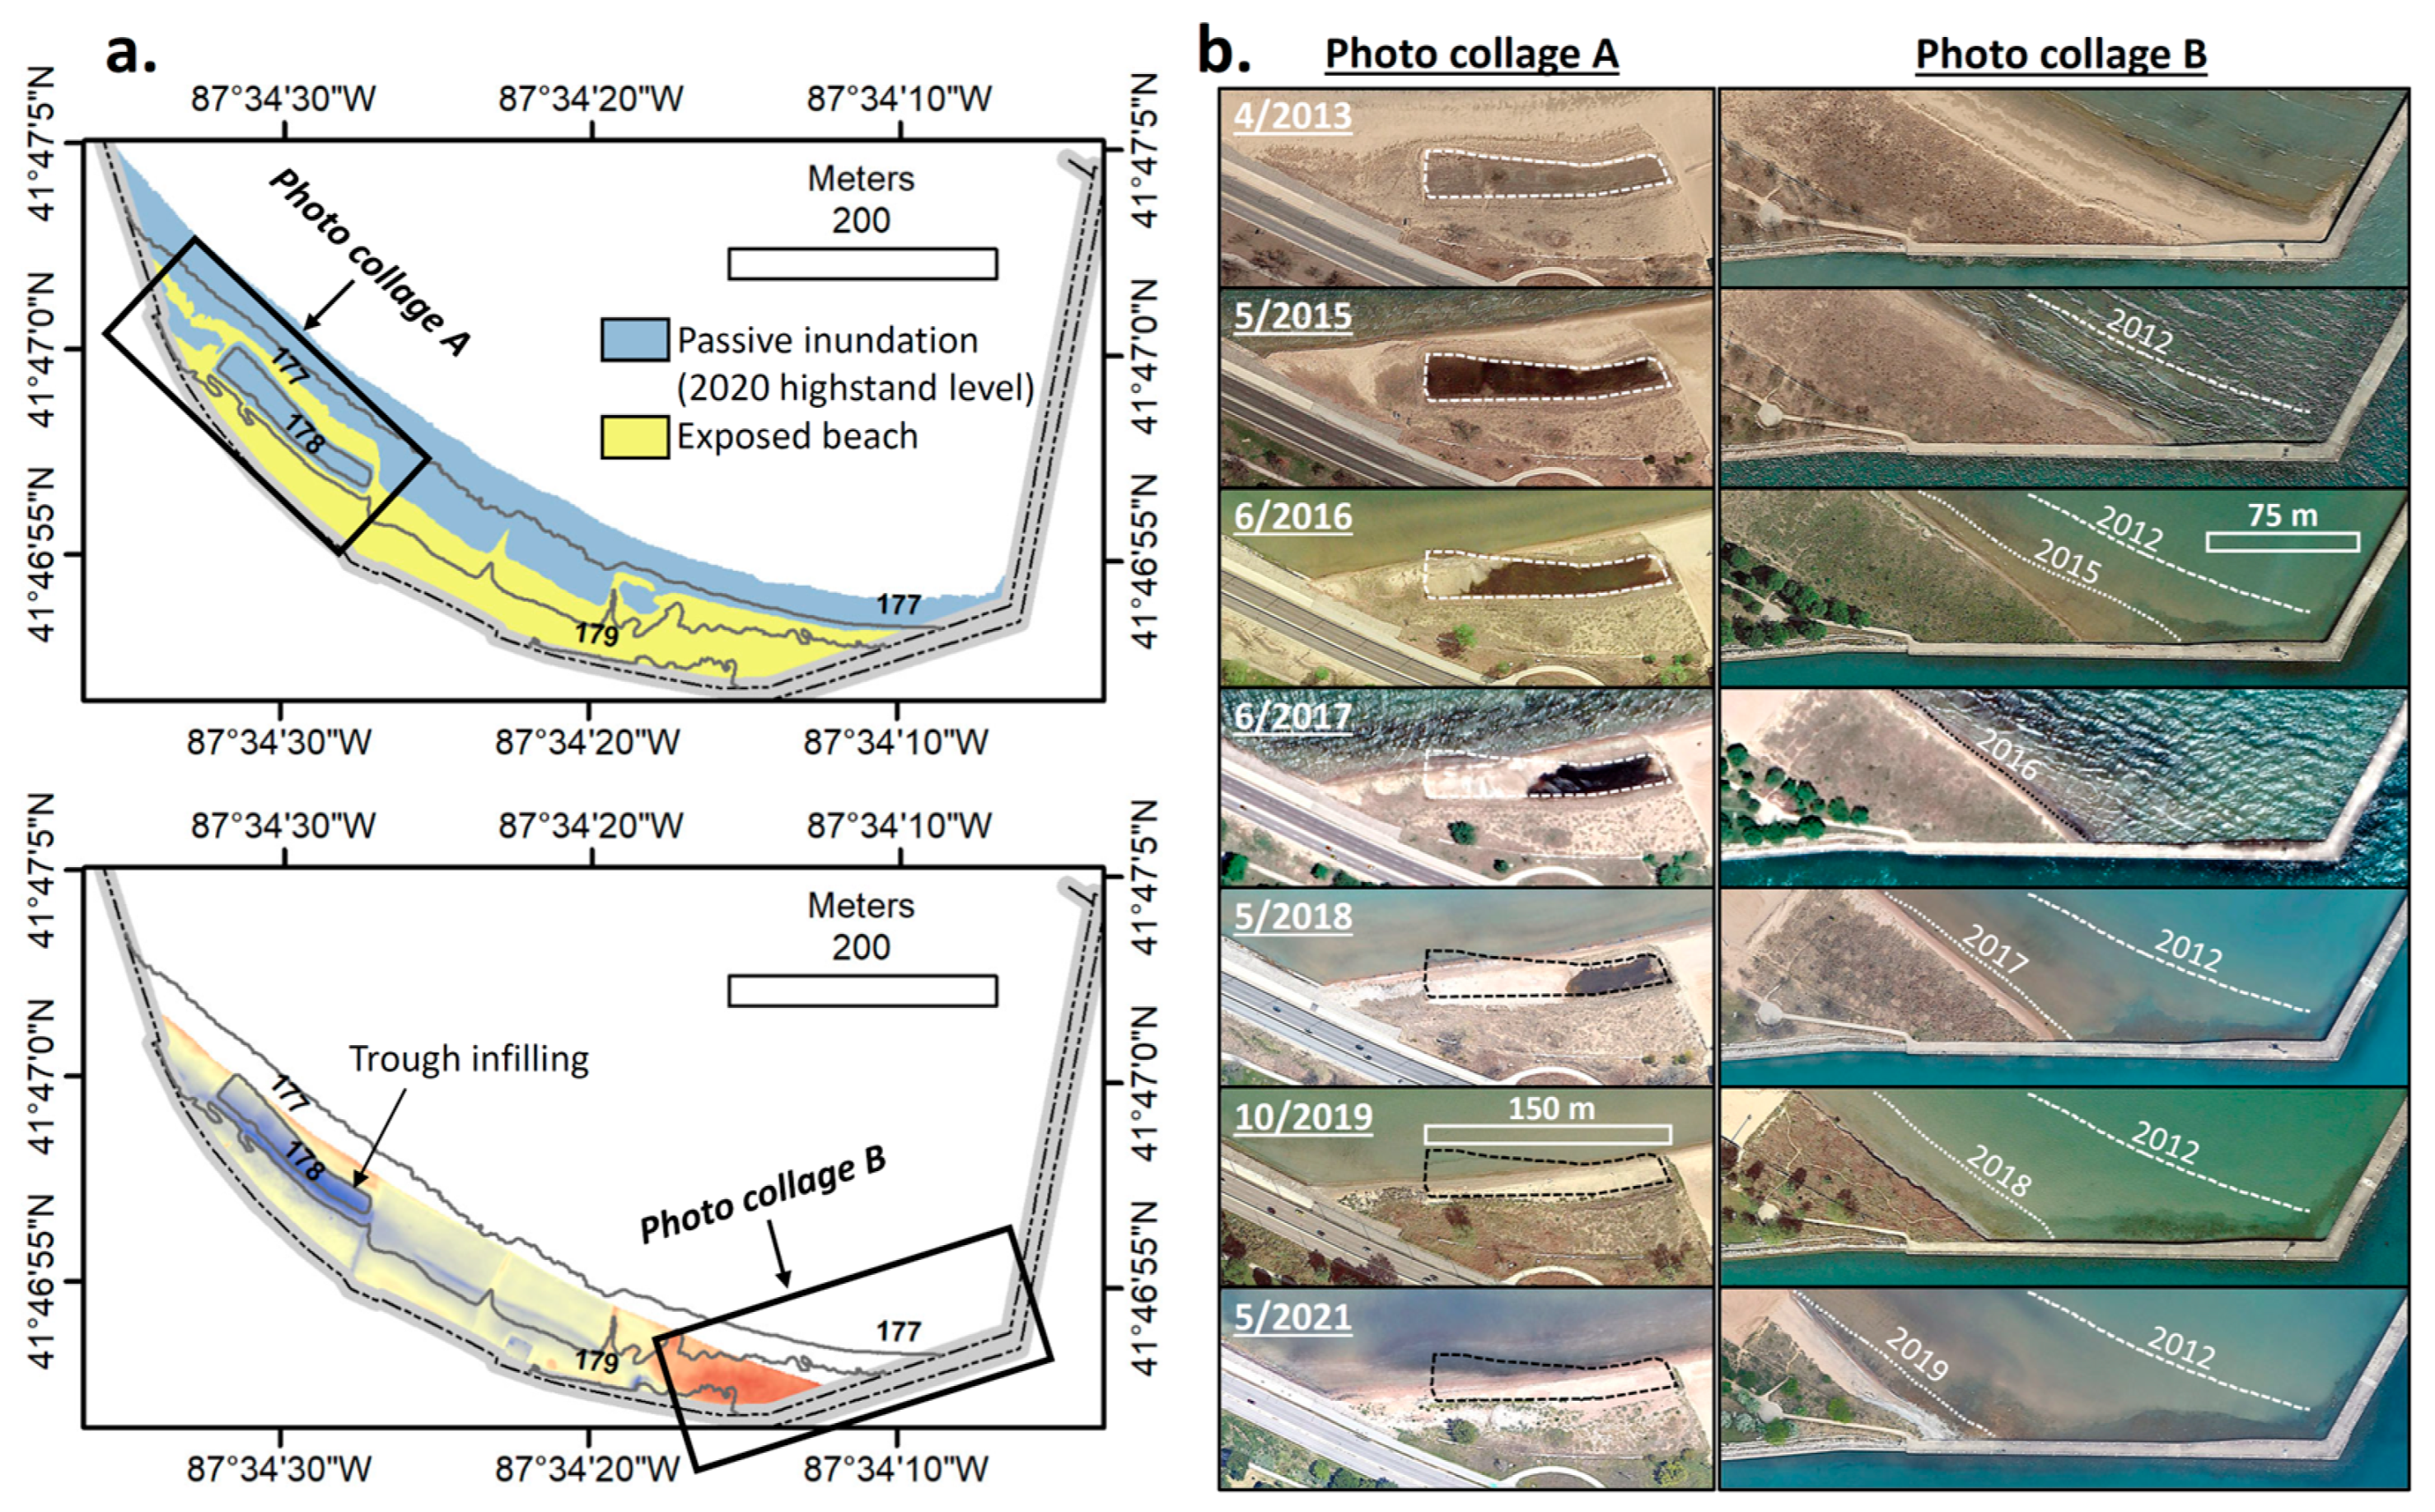
A passive ‘bathtub’ inundation model, based on the topographically varied beach terrain and the 2020 peak water level, would have offered useful insights into some of the geomorphic changes at SSB. In cases of low sand influx, at the decadal scale, backshore terrain physiography is a general indicator of inundation extent. This is exemplified by the evolutionary progression of terrain evolution at SSB, particularly across (1) the constructed trough in Area 1, where infilling of low-lying lake-level lowstand topography could have been foreseen; and (2) the lower, shoreline-proximal portion of the more ‘ramp-style’ groomed beach terrain of Area 2, where gradual shoreline retreat by washover processes could have been foreseen. Geomorphic responses at these locations to m-scale lake-level rise were in general agreement with the passive inundation model (Figure 8b). The near-total loss of the vegetated foredune across Area 3, during the late lake-level highstand to early fall, was a beach response unaccounted for by this simple model, highlighting the importance of hydrodynamic studies to help explain scour dynamics along downdrift structures and sand-transport vectors (alongshore and cross-shore). While the shape of the lowstand topography alone would have argued for improved coastal resiliency here, given the highest lowstand beach topography and dense vegetation cover, the downdrift, groin-proximal portion of beach experienced the most scour and sand loss during lake-level rise (Figure 8). Similar was experienced at the nearby Rainbow Beach, also enclosed on updrift and downdrift ends by similar groin construction [46].
While observational data and a conceptual understanding of hydrodynamics surrounding groins and other hardened shoreline structures provide suggestions of cause, integrating such into predictive models of coastal change under oscillatory lake-level conditions would require more refined data-driven numerical modeling. It is not clear whether sand from foredune-terrain losses in Area 3 contributed to the patterns of nearshore accretion mapped within the SSB embayment (Figure 7b). More work is needed to determine the nature of sedimentary coupling between urban lakefront enclosures and the broader coastal littoral transport engine. It appears the lack of avenues for direct overwash along Area 3, due to the beach-bounding infrastructure and higher elevations of the root-mat fortified foredune terrain, factored into the site-specific shoreline and beach morphodynamic patterns of change. This is likely to be a repetitive dynamic with fluctuating lake levels, particularly considering that sedimentary volume changes within the SSB enclosure appear to have been minimal [11]. The role of shore ice during the winter season must also be considered, given many studies linking the presence of nearshore-ice complexes, common to SW Michigan beaches, to enhanced scouring along lower portions of the coastal depositional profile and offshore rafting of sediment-laden ice upon breakup [53,98,99]. Mattheus and others suggested the possibility of ice grounding within urban lakefront embayments as a potential mechanism for promoting sediment bypass along the highly fragmented littoral system of Chicago [11]. Winter-time coastal morphodynamics are grossly understudied in the Great Lakes, particularly along the urban lakefront corridor, despite observational accounts and a growing conceptual understanding of their importance.
Different shoreline geomorphic responses to the same lake-level rise, observed and mapped across the subsurface at SSB, are products of the surrounding lakefront infrastructure and its modification of embayed storm hydrodynamics and the initial lowstand beach topography. Area 3 is situated on the downdrift end of the beach, beyond the protection in the immediate lee of the updrift groin (Figure 1b); it is thus more highly exposed to incoming wave and current energies during N/NE events, associated with the largest waves and strongest currents [71,79]. The abruptness of foredune-terrain loss (versus gradual loss with ongoing 2013–2020 lake-level rise) provides a management lesson to be applied more broadly to other Great Lakes urban waterfront settings. The scarp shoreline here remained unchanged between 2012 and 2017, during the initial phase of rapid lake-level rise of >1 m (Figure 2 and Figure 6). The 2021 profile along GPR Line 1 captures the onset of scarp retreat across this area (Figure 3a). Unfortunately, only the shoreline-proximal section of the beach topography was captured in that dataset; aerial photographs provide insights into the timing of scarp retreat. The unvegetated beach area fronting the foredune field was removed by 2017, and the largest amount of erosion, in terms of foredune-acreage loss, occurred between 2018 and 2019, when the rate of lake-level rise increased again (leading up to the decadal highstand; Figure 2c). By this time, there was little to no beach buffer protecting the scarp, and the elevated wave base could more directly attack the vegetated foredune area.
The following suggestions to coastal managers are informed by this assessment; they are likely to be applicable to many other beaches of the Chicago lakefront and other urban pocket beaches of the Great Lakes, which evolve under fluctuating water-level, varying winter ice-cover, and variable storm conditions: (1) Establishing a vegetated foredune field, while perhaps initially more resilient to shoreline erosion, may retreat rapidly once elevation and beach-buffer thresholds are overcome. This is especially the case if located in an area more highly exposed to dominant large wave approach; (2) Shoreline morphodynamic response can vary over short alongshore distances within urban pocket beaches, particularly those compartmentalized by land use (e.g., sectioning into groomed recreational terrains versus protected foredune fields); this is due to differential hydrodynamic impacts, modulated by the surrounding infrastructure. And (3) Shallow subsurface-reflection data (e.g., GPR) can generate useful information on recent morphodynamics that, along with topographic monitoring, can refine terrain evolutionary models of use to those engaged in long-range erosion-mitigation planning. Mapping shoreline positions through time, which is widely used for characterizing shoreline-change patterns and rates [100,101], does not capture the dynamic range of geomorphic change within urban lakefront-beach environments, which are characterized by alongshore variances in hydrodynamic and morphodynamic behavior. Changes in shoreline position may not adequately reflect beach-profile developments and sand volumetrics. The near-lowstand (2012) and near-highstand (2019) shoreline positions, while mostly parallel (Figure 7c), fail to capture the along-strike topobathymetric change characteristics, which span from net-backshore accretion (Area 1) to net-backshore erosion (Area 3; Figure 7b). GPR imagery has provided many details on the ‘in-between’ stages of geomorphic development that would have gone unresolved in shoreline reconstructions or topographic profiling efforts alone. More integrative analyses of beach environments in urban settings stand to improve our understanding of how to manage them more effectively, especially along highly populated coastal regions of the Great Lakes.

5. Conclusions

Urban pocket-beach morphodynamics are understudied in the Great Lakes region, despite the abundance of such strand environments along the heavily fragmented urban lakefront corridors. This project, whose goal was to improve our understanding of embayed system dynamics with lake-level rise, used a surface-subsurface data-integrative approach to characterize geomorphic patterns and address changes therein along strike for one of Chicago’s most popular urban beaches (on Lake Michigan), 63rd St. Beach, as a system bound by infrastructure and disconnected from sand exchange with the broader lake margin. Beach morphodynamics were assessed here from federal geospatial datasets (e.g., coastal LiDAR products from 2012 and 2017) and data generated by the ISGS through annual topobathymetric monitoring activities, from 2021 onward. These geospatial data covered the most recent Lake Michigan decadal water-level rise (from 2013 to 2020), providing morphodynamic insights across three different beach compartments of varying lowstand beach topography (characterized in 2012). GPR data were collected across the beach in 2022, after the >1.5 m rise in water level, and provided a stratigraphic model for integration with topographic data extracted from available datasets along GPR lines, enhancing our understanding of the distribution of transgressive deposits. Influences of antecedent topographic conditions on beach geomorphic development between lake-level lowstand and highstand were recognized in the distribution of overwash deposits and their stratigraphic architectures. Geomorphic patterns varied along strike, as influenced by the surrounding lakefront infrastructure and modification of hydrodynamics (e.g., incoming wave refraction and scour on the updrift side of the terminal groin). This resulted in the near-total obliteration of the most topographically prominent and vegetated lowstand terrain, which should have been the most resilient part of the beach (from a mere substrate erodibility standpoint). Geomorphic models and the recognition of past sedimentary patterns, by way of stratigraphic assessment, can help urban beach managers develop strategies for coastal resiliency in the face of future lake-level fluctuations. More work is needed to capture the morphodynamics, in detail, from surface and subsurface monitoring datasets across Great Lakes beaches of varying infrastructure design to develop regionally applicable sand-management guidelines. Much work remains to be done along the hydrodynamic and geomorphic modeling fronts in this regard. Tight constraints on how different sedimentary architectures develop within semi-confinement (i.e., coastal embayments) can also help to inform regional paleo-reconstructions based on beach-ridge plain deposits.

Funding

This research was supported by IL-IN Sea Grant, grant number F0008309702085.

Data Availability Statement

UAV-based orthomosaics, point clouds, and DEMs, in addition to single-beam sonar records and topobathymetric DEMs, can be accessed from the ‘Coastal’ section of the Illinois Geospatial Data Clearinghouse (https://clearinghouse.isgs.illinois.edu/data (accessed on 9 July 2026)).

Acknowledgments

Gratitude is extended to ISGS Katie Braun (former), Kristen Pearce, Liane Rosario, and Liz Spitzer for their help with topographic data acquisition at 63rd St. Beach and its processing. This paper benefited from geophysical data collected for that effort and an ongoing partnership with the Illinois Department of Natural Resources’ Coastal Management Program and the Chicago Park District, which are responsible for an active geological monitoring program at select Chicago beaches. Casey Sebetto and Cody Eskew, with the Coastal Management Program, helped guide Chicago-based project planning and connected us to the local coastal stakeholder groups.

Conflicts of Interest

The author declares no conflicts of interest. The funders had no role in the design of the study; in the collection, analyses, or interpretation of data; in the writing of the manuscript; or in the decision to publish the results.

Abbreviations

The following abbreviations are used in this manuscript:
DEMDigital elevation model
GPRGround-penetrating radar
ISGSIllinois State Geological Survey
SSB63rd St. Beach
USACEU.S. Army Corps of Engineers
UAVUncrewed aerial vehicle
mMeter
cmCentimeter
dmDecimeter

References

  1. Gonçalves, J.A.; Henriques, R. UAV photogrammetry for topographic monitoring of coastal areas. ISPRS J. Photogramm. Remote Sens. 2015, 104, 101–111. [Google Scholar] [CrossRef] [Scilit]
  2. Yoo, C.I.; Oh, T.S. Beach volume change using UAV photogrammetry Songjung beach, Korea. Int. Arch. Photogramm. Remote Sens. Spat. Inf. Sci. 2016, 41, 1201. [Google Scholar] [CrossRef] [Scilit]
  3. Zanutta, A.; Lambertini, A.; Vittuari, L. UAV photogrammetry and ground surveys as a mapping tool for quickly monitoring shoreline and beach changes. J. Mar. Sci. Eng. 2020, 8, 52. [Google Scholar] [CrossRef] [Scilit]
  4. Reif, M.K.; Wozencraft, J.M.; Dunkin, L.M.; Sylvester, C.S.; Macon, C.L. A review of US Army Corps of Engineers airborne coastal mapping in the Great Lakes. J. Great Lake Res. 2013, 39, 194–204. [Google Scholar] [CrossRef] [Scilit]
  5. Reif, M.K.; Krumwiede, B.S.; Brown, S.E.; Theuerkauf, E.J.; Harwood, J.H. Nearshore benthic mapping in the Great Lakes: A multi-agency data integration approach in southwest Lake Michigan. Remote Sens. 2021, 13, 3026. [Google Scholar] [CrossRef] [Scilit]
  6. Mattheus, C.R.; Braun, K.N.; Theuerkauf, E.J. Great lakes urban pocket-beach dynamics: A GIS-based analysis of infrastructure-design influences on geomorphic development. J. Great Lakes Res. 2022, 48, 68–83. [Google Scholar] [CrossRef] [Scilit]
  7. Mattheus, C.R. Foredune-ridge development along an urban pocket beach, Montrose Dunes Natural Area, southwestern Lake Michigan. J. Great Lakes Res. 2025, 51, 102449. [Google Scholar] [CrossRef] [Scilit]
  8. Mattheus, C.R. Recovery of urban Great Lakes beaches after lake-level rise: The roles of infrastructure, sand supply, and management activities. J. Great Lakes Res. 2025, 51, 102603. [Google Scholar] [CrossRef] [Scilit]
  9. Mattheus, C.R.; Braun, K.N.; Theuerkauf, E.J.; Santoro, J.A. Urban pocket-beach morphodynamics along the wave-dominated southwest coast of Lake Michigan: An analysis of shoreline and sand volumetric changes. J. Great Lakes Res. 2022, 48, 52–67. [Google Scholar] [CrossRef] [Scilit]
  10. Mattheus, C.R.; Theuerkauf, E.J.; Braun, K.N. Sedimentary in-filling of an urban Great Lakes waterfront embayment and implications for threshold-driven shoreline morphodynamics, Montrose Beach, SW Lake Michigan. J. Great Lakes Res. 2022, 48, 1147–1158. [Google Scholar] [CrossRef] [Scilit]
  11. Mattheus, C.R.; Braun, K.N.; Theuerkauf, E.J. Morphodynamics and Sand Volumetric Changes within Engineered Great Lakes Pocket Beaches: Varied Responses to a Meter-scale Lake-level Rise, Chicago Lakefront. J. Great Lakes Res. 2024, 50, 102302. [Google Scholar] [CrossRef] [Scilit]
  12. United States Army Corps of Engineers. Detroit District Great Lakes Water Management, Great Lakes Water Levels. Available online: https://water.usace.army.mil/office/lre/waterleveldata/waterLevelData (accessed on 15 April 2026).
  13. Russell, R.P., Jr. The piping plover in the Great Lakes region. Am. Birds 1983, 37, 5. [Google Scholar]
  14. U.S. Fish and Wildlife Service. Captive-Reared Great Lakes Piping Plovers Released at Montrose Beach. Available online: https://www.fws.gov/press-release/2023-07/captive-reared-great-lakes-piping-plovers-released-montrose-beach-help (accessed on 15 April 2026).
  15. Hands, E.B. Prediction of Shore Retreat and Nearshore Profile Adjustments to Rising Water Levels on the Great Lakes; U.S. Army Corps of Engineers Coastal Engineering Research Center Technical Paper No. 80-7; Coastal Engineering Research Center (U.S.): Vicksburg, MS, USA, 1980; 127p. [Google Scholar]
  16. Hands, E.B. Predicting Adjustments in Shore and Offshore Sand Profiles on the Great Lakes; U.S. Army Corps of Engineers Coastal Engineering Technical Aid No. 81-4; Coastal Engineering Research Center (U.S.): Vicksburg, MS, USA, 1981; 27p. [Google Scholar]
  17. Hands, E.B. The Great Lakes as a Test Model for Profile Response to Sea Level Changes; U.S. Army Corps of Engineers Miscellaneous Paper CERC-84-14; Coastal Engineering Research Center (U.S.): Vicksburg, MS, USA, 1984; 33p. [Google Scholar]
  18. Stockberger, M.T.; Wood, W.L. Application of equilibrium beach concepts to sandy Great Lakes profiles. Coast. Eng. Proc. 2015, 1990, 2291–2303. [Google Scholar]
  19. Wood, W.L.; Stockberger, M.T.; Madalon, L.J. Modeling beach and nearshore profile response to lake level change. J. Great Lakes Res. 1994, 20, 206–214. [Google Scholar] [CrossRef] [Scilit]
  20. Jol, H.M. Ground Penetrating Radar Theory and Applications; Elsevier: Amsterdam, The Netherlands, 2009; Volume 544, p. 31. [Google Scholar]
  21. Jol, H.M.; Bristow, C.S. GPR in sediments: Advice on data collection, basic processing and interpretation, a good practice guide. In Geological Society of London Special Publications; Geological Society: London, UK, 2003; Volume 211, pp. 9–27. [Google Scholar]
  22. Neal, A.; Pontee, N.I.; Pye, K.; Richards, J. Internal structure of mixed-sand-and-gravel beach deposits revealed using ground-penetrating radar. Sedimentology 2002, 49, 789–804. [Google Scholar] [CrossRef] [Scilit]
  23. Jol, H.M.; Lawton, D.C.; Smith, D.G. Ground penetrating radar: 2-D and 3-D subsurface imaging of a coastal barrier spit, Long Beach, WA, USA. Geomorphology 2003, 53, 165–181. [Google Scholar] [CrossRef] [Scilit]
  24. Bennett, M.R.; Cassidy, N.J.; Pile, J. Internal structure of a barrier beach as revealed by ground penetrating radar (GPR): Chesil beach, UK. Geomorphology 2009, 104, 218–229. [Google Scholar] [CrossRef] [Scilit]
  25. Loveson, V.J.; Gujar, A.R.; Iyer, S.D.; Udayaganesan, P.; Luis, R.A.A.; Gaonkar, S.S.; Chithrabhanu, P.; Tirodkar, G.M.; Singhvi, A.K. Beach dynamics and oscillations of shoreline position in recent years at Miramar Beach, Goa, India: A study from a GPR survey. Nat. Hazards 2014, 73, 2089–2106. [Google Scholar] [CrossRef] [Scilit]
  26. Rodriguez, A.B.; Meyer, C.T. Sea-level variation during the Holocene deduced from the morphologic and stratigraphic evolution of Morgan Peninsula, Alabama, USA. J. Sediment. Res. 2006, 76, 257–269. [Google Scholar] [CrossRef] [Scilit]
  27. Tamura, T. Beach ridges and prograded beach deposits as palaeoenvironment records. Earth-Sci. Rev. 2012, 114, 279–297. [Google Scholar] [CrossRef] [Scilit]
  28. Mattheus, C.R.; Farhan, S.A.; Fowler, J.K. Geomorphology of the late Holocene Sandy Hook Strandplain, San Salvador Island, the Bahamas: A Record of Changing Hydrodynamics. In Proceedings of the 2nd Joint Symposium on the Natural History and Geology of the Bahamas; Niemi, T.M., Sealey, K.S., Eds.; Gerace Research Centre: San Salvador, Bahamas, 2020; pp. 27–38. [Google Scholar]
  29. Mattheus, C.R.; Barklage, M.E.; Braun, K.N.; Theuerkauf, E.J. Stratigraphic Framework and Late Holocene History of a Lacustrine Beach-ridge Complex: Paleoclimate Archives within Migrating Strand Promontories. J. Great Lakes Res. 2024, 50, 102274. [Google Scholar] [CrossRef] [Scilit]
  30. Thompson, T.A.; Baedke, S.J. Beach-ridge development in Lake Michigan: Shoreline behavior in response to quasi-periodic lake-level events. Mar. Geol. 1995, 129, 163–174. [Google Scholar] [CrossRef] [Scilit]
  31. Johnston, J.W.; Thompson, T.A.; Baedke, S.J. Systematic pattern of beach-ridge development and preservation: Conceptual model and evidence from ground penetrating radar. Geol. Soc. Am. 2008, 432, 47–58. [Google Scholar]
  32. Pascucci, V.; Martini, I.P.; Endres, A.L. Facies and ground-penetrating radar characteristics of coarse-grained beach deposits of the uppermost Pleistocene glacial Lake Algonquin, Ontario, Canada. Sedimentology 2009, 56, 529–545. [Google Scholar] [CrossRef] [Scilit]
  33. Thompson, T.A.; Lepper, K.; Endres, A.L.; Johnston, J.W.; Baedke, S.J.; Argyilan, E.P.; Booth, R.K.; Wilcox, D.A. Mid Holocene lake level and shoreline behavior during the Nipissing phase of the upper Great Lakes at Alpena, Michigan, USA. J. Great Lakes Res. 2011, 37, 567–576. [Google Scholar] [CrossRef] [Scilit]
  34. Eyles, N.; Meulendyk, T. Ground-penetrating radar stratigraphy and depositional model for evolving Late Holocene aeolian dunes on the Lake Huron coast, Ontario. J. Great Lakes Res. 2012, 38, 708–719. [Google Scholar] [CrossRef] [Scilit]
  35. Johnston, J.W.; Thompson, T.A.; Wilcox, D.A. Palaeohydrographic reconstructions from strandplains of beach ridges in the Laurentian Great Lakes. In Geological Society of London Special Publications; Geological Society: London, UK, 2014; Volume 388, pp. 213–228. [Google Scholar]
  36. Thompson, T.A.; Johnston, J.W.; Lepper, K. The contemporary elevation of the peak Nipissing phase at outlets of the upper Great Lakes. In The Geological Society of America Special Papers; The Geological Society of America: Boulder, CO, USA, 2014; Volume 508, pp. 15–29. [Google Scholar]
  37. Mattheus, C.R.; Fowler, J.K.; Diggins, T.P. Hydrodynamic and sediment-accommodation controls on headland-beach geomorphology evaluated by statistical methods, southern Lake Erie coast. J. Great Lakes Res. 2017, 43, 228–238. [Google Scholar] [CrossRef] [Scilit]
  38. Mattheus, C.R.; Diggins, T.P.; Boyce, C.; Cockrell, J.; Kruske, M.; VanWinkle, M. Geomorphology of a harbor-breakwater beach along a high sand-supply, wave-dominated Great Lakes littoral cell. J. Coast. Res. 2019, 35, 41–55. [Google Scholar] [CrossRef] [Scilit]
  39. Farris, A.S.; List, J.H. Shoreline change as a proxy for subaerial beach volume change. J. Coast. Res. 2007, 23, 740–748. [Google Scholar] [CrossRef] [Scilit]
  40. Theuerkauf, E.J.; Rodriguez, A.B. Impacts of transect location and variations in along-beach morphology on measuring volume change. J. Coast. Res. 2012, 28, 707–718. [Google Scholar]
  41. Mattheus, C.R.; Fowler, J.K.; Diggins, T.P.; Allen, D.F. Barrier-spit geomorphology and inlet dynamics in absence of tides: Evolution of the North Pond system, eastern Lake Ontario, New York State. Earth Surf. Process. Landf. 2016, 41, 1386–1398. [Google Scholar] [CrossRef] [Scilit]
  42. Rosario, L.; Barklage, M.; Mattheus, C.; Spitzer, E.; Pearce, K. Measuring Sand Volumes of Chicago Beaches Using Ground Penetrating Radar. In AGU Fall Meeting Abstracts; EP15B-1099; AGU: Washington, DC, USA, 2022. [Google Scholar]
  43. Mattheus, C.R.; Braun, K.N.; Theuerkauf, E.J. Dynamics of beach-ridge formation along a migrating strandplain with implications for paleo-environmental assessment, Illinois Beach State Park, southwestern Lake Michigan. J. Great Lakes Res. 2023, 49, 147–162. [Google Scholar] [CrossRef] [Scilit]
  44. Mattheus, C.R.; Spitzer, E.; Rosario, L.; Pearce, K. Storm Deposits in Context of Seasonal through Decadal Water-Level Variances and Beach Geomorphic Change, Southwestern Lake Michigan. J. Coast. Res. 2025, 41, 967–988. [Google Scholar] [CrossRef] [Scilit]
  45. Mattheus, C.R.; Pearce, K.; Rosario, L.; Spitzer, E. Water-level changes and beach morphodynamics: Insights from topobathymetric monitoring of a receding shoreline, Illinois Beach, Lake Michigan. J. Coast. Res. 2025, 41, 749–769. [Google Scholar] [CrossRef] [Scilit]
  46. Mattheus, C.R.; Theuerkauf, E.J.; Braun, K.N. Response of a Sand-limited Urban Pocket Beach to Repeat Decadal Lake-level Rise Events, Southwestern Lake Michigan. J. Great Lakes Res. 2025, 51, 102501. [Google Scholar] [CrossRef] [Scilit]
  47. Mattheus, C.R.; Barklage, M.E. Lake-bottom geology of the Chicago nearshore: A sand-distribution context for urban beach morphodynamics along a fragmented littoral zone. J. Great Lakes Res. 2025, 51, 102412. [Google Scholar] [CrossRef] [Scilit]
  48. Braun, K.N.; Mattheus, C.R.; Theuerkauf, E.J. The geomorphic role of large wood in the coastal zone: Mobilization threshold and beach morphology impacts in the North American Great Lakes. Geomorphology 2022, 411, 108292. [Google Scholar] [CrossRef] [Scilit]
  49. Theuerkauf, E.J.; Braun, K.N.; Nelson, D.M.; Kaplan, M.; Vivirito, S.; Williams, J.D. Coastal geomorphic response to seasonal water-level rise in the Laurentian Great Lakes: An example from Illinois Beach State Park, USA. J. Great Lakes Res. 2019, 45, 1055–1068. [Google Scholar] [CrossRef] [Scilit]
  50. Theuerkauf, E.; Mattheus, C.R.; Braun, K.; Bueno, J. Patterns and processes of beach and foredune geomorphic change along a Great Lakes shoreline: Insights from a year-long drone mapping study along Lake Michigan. Shore Beach 2021, 89, 46–55. [Google Scholar] [CrossRef] [Scilit]
  51. Theuerkauf, E.J.; Braun, K.N. Rapid water level rise drives unprecedented coastal habitat loss along the Great Lakes of North America. J. Great Lakes Res. 2021, 47, 945–954. [Google Scholar] [CrossRef] [Scilit]
  52. Mattheus, C.R. Longshore Sand-Wave Migration and Variable Beach Morphodynamic Response to Meter-scale Water-level Rise, Southwestern Lake Michigan, USA. J. Coast. Res. 2025, 42, 1–20. [Google Scholar] [CrossRef] [Scilit]
  53. Mattheus, C.R.; Theuerkauf, E.J. Nearshore ice-complex morphodynamics within an urban embayment, Southwestern Lake Michigan: Insights from a winter 2021–2022 monitoring study. J. Great Lakes Res. 2025, 51, 102503. [Google Scholar] [CrossRef] [Scilit]
  54. Volpano, C.A.; Zoet, L.K.; Rawling, J.E., III; Theuerkauf, E.J.; Krueger, R. Three-dimensional bluff evolution in response to seasonal fluctuations in Great Lakes water levels. J. Great Lakes Res. 2020, 46, 1533–1543. [Google Scholar] [CrossRef] [Scilit]
  55. Roland, C.J.; Zoet, L.K. LiDAR-derived measurements of rapid coastal change along Wisconsin’s Lake Superior coast (2009–2019). J. Great Lakes Res. 2025, 51, 102366. [Google Scholar] [CrossRef] [Scilit]
  56. Swenson, M.J.; Wu, C.H.; Edil, T.B.; Mickelson, D.M. Bluff recession rates and wave impact along the Wisconsin coast of Lake Superior. J. Great Lakes Res. 2006, 32, 512–530. [Google Scholar] [CrossRef] [Scilit]
  57. Foyle, A.M.; Naber, M.D. Decade-scale coastal bluff retreat from LiDAR data: Lake Erie coast of NW Pennsylvania, USA. Environ. Earth Sci. 2012, 66, 1999–2012. [Google Scholar]
  58. Davidson-Arnott, R.G.; Law, M.N. Seasonal patterns and controls on sediment supply to coastal foredunes, Long Point, Lake Erie. In Coastal Dunes: Form and Process; Nordstrom, K.F., Psuty, N.P., Carter, R.W.G., Eds.; Wiley & Sons: Hoboken, NJ, USA, 1990; pp. 177–200. [Google Scholar]
  59. Davidson-Arnott, R.G.; Reid, H.E.C. Sedimentary processes and the evolution of the distal bayside of Long Point, Lake Erie. Can. J. Earth Sci. 1994, 31, 1461–1473. [Google Scholar] [CrossRef] [Scilit]
  60. Stewart, C.J.; Davidson-Arnott, R.G. Morphology, formation and migration of longshore sandwaves; Long Point, Lake Erie, Canada. Mar. Geol. 1988, 81, 63–77. [Google Scholar] [CrossRef] [Scilit]
  61. Mattheus, C.R.; Diggins, T.P.; Santoro, J.A. Punctuated decadal morphodynamics and coupled vegetation succession along a nontidal, wave-dominated Great Lakes barrier spit, Gull Point, Lake Erie, USA. J. Great Lakes Res. 2021, 47, 1538–1553. [Google Scholar] [CrossRef] [Scilit]
  62. Amin, S.M.N.; Davidson-Arnott, R.G. A statistical analysis of the controls on shoreline erosion rates, Lake Ontario. J. Coast. Res. 1997, 13, 1093–1101. [Google Scholar]
  63. Angel, J.R. Large-scale storm damage on the US shores of the Great Lakes. J. Great Lakes Res. 1995, 21, 287–293. [Google Scholar] [CrossRef] [Scilit]
  64. Meadows, G.A.; Meadows, L.A.; Wood, W.L.; Hubertz, J.M.; Perlin, M. The relationship between Great Lakes water levels, wave energies, and shoreline damage. Bull. Amer. Meteorol. Soc. 1997, 78, 675–684. [Google Scholar] [CrossRef] [Scilit]
  65. Mattheus, C.R. Climate-induced changes in rates of headland-beach progradation along the southern coast of Lake Erie. J. Coast. Res. 2014, 30, 743–755. [Google Scholar] [CrossRef] [Scilit]
  66. Creque, S.M.; Stainbrook, K.M.; Glover, D.C.; Czesny, S.J.; Dettmers, J.M. Mapping bottom substrate in Illinois waters of Lake Michigan: Linking substrate and biology. J. Great Lakes Res. 2010, 36, 780–789. [Google Scholar] [CrossRef] [Scilit]
  67. Fucciolo, C.S. Littoral Zone Habitat Classification and Mapping of Illinois Lake Michigan Coastal Areas: Bathymetry and Distribution of Bottom Materials; Illinois State Geological Survey Open File Series 1993-7; Illinois State Geological Survey: Urbana, IL, USA, 1993; 176p. [Google Scholar]
  68. Mwakanyamale, K.E.; Brown, S.E.; Theuerkauf, E.J. Delineating spatial distribution and thickness of unconsolidated sand along the southwest Lake Michigan shoreline using TEM and ERT geophysical methods. J. Great Lakes Res. 2020, 46, 1544–1558. [Google Scholar] [CrossRef] [Scilit]
  69. Barklage, M.; Mattheus, C.; Brown, S.; Pearce, K.; Spitzer, E.; Rosario, L.; Phillips, A.C. Sub-bottom Investigation of Chicago, Illinois’s Coastal Marine Environment Using Near-Surface Geophysical Imaging Techniques. In AGU Fall Meeting Abstracts; EP15B-1100; AGU: Washington, DC, USA, 2022. [Google Scholar]
  70. Illinois State Geological Survey. Illinois Geospatial Data Clearinghouse: Chicago—Offshore Mapping. Available online: https://clearinghouse.isgs.illinois.edu/data/coastal/chicago-offshore-mapping (accessed on 15 April 2026).
  71. Booth, J.S. Wave climate and nearshore lakebed response, Illinois Beach State Park, Lake Michigan. J. Great Lakes Res. 1994, 20, 163–178. [Google Scholar] [CrossRef] [Scilit]
  72. Hester, N.C.; Fraser, G.S. Sedimentology of a Beach Ridge Complex and Its Significance in Land-Use Planning; Illinois State Geological Survey Environmental Geology Notes; Illinois State Geological Survey: Champaign, IL, USA, 1973; Volume 63, 38p. [Google Scholar]
  73. Shabica, C.; Pranschke, F. Survey of littoral drift sand deposits along the Illinois and Indiana shores of Lake Michigan. J. Great Lakes Res. 1994, 20, 61–72. [Google Scholar] [CrossRef] [Scilit]
  74. Willman, H.B.; Frye, J.C. Pleistocene Stratigraphy of Illinois; Illinois State Geological Survey Bulletin; Illinois State Geological Survey: Urbana-Champaign, IL, USA, 1970; Volume 94, 204p. [Google Scholar]
  75. Hansel, A.K.; Johnson, W.H. Wedron and Mason Groups: Lithostratigraphic Reclassification of Deposits of the Wisconsin Episode, Lake Michigan Lobe Area; Illinois State Geological Survey Bulletin; Illinois State Geological Survey: Urbana-Champaign, IL, USA, 1996; Volume 104, 116p. [Google Scholar]
  76. Jibson, R.W.; Odum, J.K.; Staude, J.M. Rates and processes of bluff recession along the Lake Michigan shoreline in Illinois. J. Great Lakes Res. 1994, 20, 135–152. [Google Scholar] [CrossRef] [Scilit]
  77. Chrzastowski, M.J.; Thompson, T.A.; Trask, C.B. Coastal geomorphology and littoral cell divisions along the Illinois-Indiana coast of Lake Michigan. J. Great Lakes Res. 1994, 20, 27–43. [Google Scholar] [CrossRef] [Scilit]
  78. Shabica, C.; Meshberg, J.; Keefe, R.; Georges, R. Evolution and performance of groins on a sediment starved coast: The Illinois shore of Lake Michigan North of Chicago, 1880–2000. J. Coast. Res. 2004, 33, 39–56. [Google Scholar]
  79. Hubertz, J.M.; Driver, D.B.; Reinhard, R.D. Wind waves on the Great Lakes: A 32 year hindcast. J. Coast. Res. 1991, 7, 945–967. [Google Scholar]
  80. United States Army Corps of Engineers. Wave Information Study. 2026. Available online: https://wis.erdc.dren.mil/ (accessed on 15 April 2026).
  81. BaMasoud, A.; Byrne, M.L. The impact of low ice cover on shoreline recession: A case study from Western Point Pelee, Canada. Geomorphology 2012, 173, 141–148. [Google Scholar] [CrossRef] [Scilit]
  82. National Oceanographic and Atmospheric Administration. Great Lakes Environmental Research Laboratory. 2026. Available online: https://www.glerl.noaa.gov/data/ice/ (accessed on 15 April 2026).
  83. Lenters, J.D. Long-term trends in the seasonal cycle of Great Lakes water levels. J. Great Lakes Res. 2001, 27, 342–353. [Google Scholar] [CrossRef] [Scilit]
  84. Bishop, C.T. Historical variation of water levels in Lakes Erie and Michigan-Huron. J. Great Lakes Res. 1990, 16, 406–425. [Google Scholar] [CrossRef] [Scilit]
  85. Kayastha, M.B.; Ye, X.; Huang, C.; Xue, P. Future rise of the Great Lakes water levels under climate change. J. Hydrol. 2022, 612, 128205. [Google Scholar] [CrossRef] [Scilit]
  86. van Dijk, D. Foredune dynamics at a Lake Michigan site during rising and high lake levels. J. Great Lakes Res. 2021, 47, 1581–1593. [Google Scholar] [CrossRef] [Scilit]
  87. Map Showing 63rd St. Beach in November 2025. Google Earth Pro. Available online: https://earth.google.com/web/@41.78645664,-87.5743764,177.27819531a,4220.49658604d,35y,5.49447324h,0t,0.0025997r/data=CgwqBggBEgAYAUICCAEyKQonCiUKITF6QVltR2ZweWZlS2ZRQWVNVWtFT0dQNllKNHhORUpZaSABOgMKATBCAggASggI1LTA8wQQAQ?hl=en_US (accessed on 9 July 2026).
  88. National Oceanic and Atmospheric Administration, (NOAA). Data Access Viewer. 2026. Available online: https://coast.noaa.gov/dataviewer/#/ (accessed on 15 April 2026).
  89. Illinois State Geological Survey. Illinois Geospatial Data Clearinghouse: Chicago Beaches, Chicago Park District—Orthomosaic, Digital Elevation Model (DEM), and Point Cloud. Available online: https://clearinghouse.isgs.illinois.edu/data/coastal/UAS/Chicago (accessed on 15 April 2026).
  90. Westoby, M.J.; Brasington, J.; Glasser, N.F.; Hambrey, M.J.; Reynolds, J.M. ‘Structure-from-Motion’ photogrammetry: A low-cost, effective tool for geoscience applications. Geomorphology 2012, 179, 300–314. [Google Scholar] [CrossRef] [Scilit]
  91. Brunier, G.; Fleury, J.; Anthony, E.J.; Gardel, A.; Dussouillez, P. Close-range airborne Structure-from-Motion Photogrammetry for high-resolution beach morphometric surveys: Examples from an embayed rotating beach. Geomorphology 2016, 261, 76–88. [Google Scholar] [CrossRef] [Scilit]
  92. Bertin, S.; Stéphan, P.; Ammann, J. Assessment of RTK Quadcopter and Structure-from-Motion Photogrammetry for Fine-Scale Monitoring of Coastal Topographic Complexity. Remote Sens. 2022, 14, 1679. [Google Scholar] [CrossRef] [Scilit]
  93. Illinois State Geological Survey. Illinois Geospatial Data Clearinghouse: Chicago Beaches, Chicago Park District—Singlebeam Bathymetry. Available online: https://clearinghouse.isgs.illinois.edu/data/coastal/chicago-beaches-chicago-park-district-singlebeam-bathymetry (accessed on 15 April 2026).
  94. Microsoft Corporation. Microsoft Office LTSC Professional Plus 2021 Software; Microsoft Corporation: Redmond, WA, USA.
  95. Thomas, T.; Phillips, M.R.; Williams, A.T.; Jenkins, R.E. Short-term beach rotation, wave climate and the North Atlantic Oscillation (NAO). Prog. Phys. Geogr. 2011, 35, 333–352. [Google Scholar] [CrossRef] [Scilit]
  96. Thomas, T.; Phillips, M.R.; Williams, A.T.; Jenkins, R.E. Medium timescale beach rotation; gale climate and offshore island influences. Geomorphology 2011, 135, 97–107. [Google Scholar] [CrossRef] [Scilit]
  97. Thomas, T.; Rangel-Buitrago, N.; Phillips, M.R.; Anfuso, G.; Williams, A.T. Mesoscale morphological change, beach rotation and storm climate influences along a macrotidal embayed beach. J. Mar. Sci. Eng. 2015, 3, 1006–1026. [Google Scholar] [CrossRef] [Scilit]
  98. Reimnitz, E.; Hayden, E.; McCormick, M.; Barnes, P.W. Preliminary observations on coastal sediment loss through ice rafting in Lake Michigan. J. Coast. Res. 1991, 7, 653–664. [Google Scholar]
  99. Barnes, P.W.; Kempema, E.W.; Reimnitz, E.; McCormick, M. The influence of ice on southern Lake Michigan coastal erosion. J. Great Lakes Res. 1994, 20, 179–195. [Google Scholar] [CrossRef] [Scilit]
  100. Himmelstoss, E.A.; Henderson, R.E.; Kratzmann, M.G.; Farris, A.S. Digital Shoreline Analysis System (DSAS) Version 5.0 User Guide; U.S. Geological Survey Open-File Report 2018-1179; Illinois State Geological Survey: Champaign, IL, USA, 2018; 126p. [Google Scholar]
  101. Oyedotun, T.D. Shoreline geometry: DSAS as a tool for historical trend analysis. Geomorphol. Tech. 2014, 3, 1–12. [Google Scholar]
Figure 1. GIS maps showing (a) NE Illinois (in gray) in context of Lake Michigan and regional littoral transport directions, along with Chicago littoral zone bathymetry (based on NOAA-derived bathymetric contours in meters) and its waterfront’s armored shoreline; (b) color-ramped and hill-shaded (at 5× vertical exaggeration) 2008 bathymetric DEM of Chicago’s South Shore region, with the armored shoreline and offshore sand-cover extent (dashed black line) delineated, and the location of SSB (the study area) marked; and (c) a 2014 National Agriculture Imagery Program aerial image of SSB, with key management areas defined for the lowstand phase in recent Lake Michigan water-level history.
Limnolrev 26 00041 g001
Figure 2. Information on the study parameterization, including (a) 2022 GPR trackline coverage from 31 May, overlying an orthoimage generated from 2022 aerial drone imagery (acquired on 19 April); (b) in-field trail-camera footage of the groomed portion of SSB during calm and high-energy lake condition, in 2021, with camera location and approximate viewshed (between dashed yellow lines) shown in part (a); and (c) the Lake Michigan water-level curve, from 1860 to 2020, showing semi-periodical fluctuations at the decadal scale; 1918 to 2020 data points are based on annual lake-wide averages computed by the U.S. Army Corps of Engineers (USACE) from a network of gauging stations around the Lake Michigan-Huron system. The period of interest to this study (from the lake-level perspective), 2013–2020, is highlighted and marked. A wave rose is also shown in part (a), for the 25 October event (in 2021) captured by the camera footage shown in part (b).
Limnolrev 26 00041 g002
Figure 3. Topographic DEMS of SSB showing (a) 2012 (lake-level lowstand) and 2023 (immediate post-lake-level highstand) conditions, along with a geomorphic change model (based on raster subtraction of older from younger); and (b) topographic profile extractions from these and other datasets along GPR Lines 1, 8, and 10 (Table 1). Profile locations, which represent each of the three beach management compartments, are shown in part (a).
Limnolrev 26 00041 g003
Figure 4. An overview of GPR Line 10 data-analysis results, in the form of (a) 2012, 2017, and 2022 beach topographic DEMs (Table 1), displayed using identical color ramps and showing the location of the GPR data trackline (and topographic profile extraction); and (b) raw (colored) and interpreted (grayscale) GPR images for Line 10, underlain by plots of 2012–2017 and 2017–2022 vertical change, based on comparison of topographic profile extractions. Key GPR surfaces are color-coded and labeled.
Limnolrev 26 00041 g004
Figure 5. An overview of GPR Line 8 data-analysis results, in the form of (a) 2012, 2017, and 2022 beach topographic DEMs (Table 1), displayed using identical color ramps and showing the location of the GPR data trackline (and topographic profile extraction); and (b) raw (colored) and interpreted (grayscale) GPR images for Line 8, underlain by plots of 2012–2017 and 2017–2022 vertical change, based on comparison of topographic profile extractions. Key GPR surfaces are color-coded and labeled.
Limnolrev 26 00041 g005
Figure 6. An overview of GPR Line 1 data-analysis results, in the form of (a) 2012, 2017, and 2022 beach topographic DEMs (Table 1), displayed using identical color ramps and showing the location of the GPR data trackline (and topographic profile extraction); and (b) raw (colored) and interpreted (grayscale) GPR images for Line 1, underlain by plots of 2012–2017 and 2017–2022 vertical change, based on comparison of topographic profile extractions. Key GPR surfaces are color-coded and labeled.
Limnolrev 26 00041 g006
Figure 7. GIS maps showing (a) 2021, 2022, and 2023 bathymetric sonar tracklines; (b) topobathymetric change model representing the low lake-level to high lake-level phase shift, based on 2012 and 2021 data, with 2021 elevation contours (CI = 1 m) superimposed as dashed black lines; and (c) 2012 bathymetric contour map (CI = 1 m) showing 2012 (dashed black) and 2019 (solid black) shoreline positions, as mapped from NAIP imagery. The color ramp of the geomorphic change model in (b) is set to highlight areas of +1 m to −1 m in change.
Limnolrev 26 00041 g007
Figure 8. Map panels showing (a) passive inundation model based on 2012 DEM (i.e., the lake-level lowstand beach topography), using the 2020 highstand water level of 177.45 IGLD85 m, along with 2012–2021 geomorphic change model showing erosional areas in red and accretionary areas in blue; and (b) a series of Google Earth aerial photos capturing the 2013–2021 shoreline-change trajectories for SSB geomorphic end-member types: Net-accretionary Area 1 versus net-erosional Area 3. Key elevation contours of the 2012 lowstand DEM (in meters) are shown in both maps in (a); the geomorphic change model has no legend for the vertical change color ramp, given that only patterns matter here. The reader is referred to Figure 7b for the complete and fully annotated topobathymetric change model showing 2012–2021 changes.
Limnolrev 26 00041 g008
Disclaimer/Publisher’s Note: The statements, opinions and data contained in all publications are solely those of the individual author(s) and contributor(s) and not of MDPI and/or the editor(s). MDPI and/or the editor(s) disclaim responsibility for any injury to people or property resulting from any ideas, methods, instructions or products referred to in the content.