1. Introduction
Studying the elemental associations with nitrate concentrations in diverse natural water sources is an important area of research in environmental science and water quality management [
1]. This study examines how various elements interact with and influence nitrate levels across groundwater in the northeastern region of Saudi Arabia. Excessive water nitrate (NO
3) levels pose a significant risk to human health [
2,
3]. This problem is particularly dangerous for susceptible groups, such as infants and expectant mothers, who face an increased likelihood of developing methemoglobinemia, a potentially life-threatening condition [
4,
5]. The sources of nitrate contamination in water resources are diverse, and include agricultural drainage, livestock waste, and industrial effluents. Moreover, the infiltration of nitrate into both shallow and deep groundwater reserves complicates management and treatment efforts, necessitating effective strategies to prevent, detect, and mitigate nitrate pollution of water supplies.
Nitrate pollution frequently coincides with other contaminants, including pesticides and fertilizers, particularly in areas with intensive agriculture [
6]. However, the relationship between nitrate and other water constituents may vary depending on specific contamination sources and geographical locations [
7,
8,
9]. For example, industrial effluents and sewage can result in elevated nitrate concentrations in waterbodies. Environmental factors such as soil composition, geological features, and hydrological conditions can influence nitrate levels. Consequently, comprehensive water quality assessments and evaluations are essential for effectively mitigating nitrate contamination [
10]. These assessments can facilitate the identification of pollution sources, determination of the extent of contamination, and the formulation of appropriate prevention and remediation strategies.
In many studies, nitrate concentrations in water have been found to be influenced by various elements and environmental factors. The concentration of nitrate in groundwater within the Yinchuan Region is predominantly influenced by several factors, including the distance from the Yellow River, weather-related elements (including rainfall, water loss through evaporation, and average atmospheric temperature), and the elevation of the water table [
11]. A study on shallow lakes in Poland and the U.K. found that winter nitrate concentrations were inversely correlated with submerged plant species richness [
12]. Conversely, in Ontario, nitrate levels were positively correlated with the percentage of heavily fertilized crops and nitrogen fertilizer application rates [
13]. Research in Croatia has indicated that proximity to septic systems and broken sewage systems significantly influences the nitrate levels in shallow wells [
14]. Moreover, a strong correlation between nitrate concentration and electrical conductivity was observed in the groundwater. A study in the Arak Plain, Iran, used electrical conductivity as an input variable in a support vector machine model to predict nitrate concentrations in groundwater [
15]. Similarly, research in the Zaheerabad area found elevated concentrations of nitrate in groundwater samples with higher electrical conductivity values [
16]. Another study in Uttarakhand, India, found that the nitrate concentration was significantly correlated with turbidity in drinking water [
17]. Additionally, research in Varanasi, India, identified nitrate as a key water parameter that influences the values of other water parameters [
18]. The above study shows that nitrate concentrations in water correlate with various factors, including other water quality parameters, land use patterns, and seasonal variations. These correlations highlight the complex interactions among human activities, environmental factors, and water quality, emphasizing the need for comprehensive approaches to water resource management and protection [
19,
20,
21].
Our previous study discussed nitrate and tritium contamination in groundwater in northeastern Saudi Arabia, with concentrations ranges 16–380 mg/L across four well categories [
22]. Commercially treated water stations meet WHO standards [
23,
24], while 33% of untreated stations exceed safe drinking levels. Approximately half of private residential and agricultural wells have high nitrate levels, which are unsuitable for drinking but can be used for other purposes [
22]. The Nitrate Pollution Index (NPI) indicated high pollution levels in 18% of the wells, with agricultural and gardening wells showing the highest nitrate concentrations. Chronic Daily Intake (CDI) and Hazard Quotient (HQ) assessments highlighted the vulnerability of infants and children to nitrate exposure, with 55.55% of the samples posing potential non-cancer health risks to infants [
25]. The research findings indicated notable correlations between nitrate levels and essential water quality indicators, including acidity, total amount of dissolved solids, and electrical conductivity. Understanding these relationships is essential for assessing water quality, predicting potential environmental impacts, and developing effective strategies for addressing water pollution. These findings expand our understanding of how nitrates behave in aquatic environments, highlighting the need for comprehensive water quality assessments, and underscoring the importance of employing diverse analytical techniques to ensure sustainable water resource management.
In the present study, diverse analytical techniques, including ion-selective electrodes and photometric methods, were employed to investigate nitrate concentrations, while a normal BLE-C600 meter was used for measuring electrical conductivity and pH. GIS-based spatial interpolation, specifically the inverse distance weighting technique, was used to analyze and visualize the spatial distribution of nitrate concentrations. This comprehensive approach, which combines various measurement methods and spatial analysis, facilitated a thorough examination of nitrate levels and related water quality parameters across different concentration ranges and geographical areas, thereby contributing to a more robust understanding of the elemental association of groundwater nitrate in the region.
2. Materials and Methods
In this study, various water samples were carefully selected to represent a wide spectrum of nitrate concentrations, as shown in
Table 1.
The first category consisted of five standard nitrate samples obtained from Horiba (Kyoto, Japan). These standards contain precise nitrate concentrations of 150, 300, 500, 1000, and 2000 mg/L to calibrate and validate the analytical methods employed in this study. The inclusion of these standards served a dual purpose in the experimental setup. First, the analytical instruments and methods employed throughout the study were calibrated to ensure accurate and reliable measurement. The second category encompasses seven reference samples designed to span the nitrate concentration spectrum from high to low. The reference samples were carefully prepared by diluting the standard solution with nanopore water under controlled conditions to ensure accuracy and reproducibility. The final nitrate concentration of each reference sample was determined precisely using an established dilution factor.
The third and fourth groups include groundwater samples from deep and shallow wells at various locations. These wells were presumed to contain high and low nitrate levels. Samples were collected directly from the wells, ensuring minimal contamination risk, diligently preserved in glass containers, and promptly sealed upon collection. The final category featured a single nanopore and two distilled water samples with an almost negligible nitrate content. Water was used as an essential control to provide a reference sample for assessing nitrate levels that were close to zero.
Two different methods were employed for nitrate measurement in this study due to the wide range of nitrate concentrations present in the various water samples. The ion-selective electrode method was used for higher nitrate concentrations, while photometric analysis was used for lower concentrations. The use of both methods allowed for a more comprehensive and accurate assessment of nitrate concentrations in the diverse water samples studied, including groundwater, standard solutions, and reference samples. Ion-selective electrodes are among the most commonly used electrodes for the measurement of nitrate in water. This method uses an electrode that responds solely to the nitrate ions in a water sample. An LAQUAtwin (Horiba, Kyoto, Japan) ion-selective electrode (ISE) pocket meter (
Figure S1 in the Supporting Information) was used. The process involved transferring 0.3–2.0 mL of the sample into the ISE system’s small measurement well via pipette. This method requires no additional reagents or sample-preparation steps. The measurements took approximately 1 min. The device can measure nitrate with an accuracy of ±10% with proper calibration, as mentioned by the manufacturer. However, its efficacy depends on accurately relating readings to known nitrate concentrations. Calibration bridges this gap by correlating the instrument readings with the actual nitrate concentrations in the standard solutions. Prior to each measurement, a two-point calibration was performed using manufacturer-provided standards of 150 and 2000 mg/L.
For the Horiba nitrate meter, the default settings established the initial calibration point at 150 ppm and the second at 2000 ppm. These specific concentrations were selected to align with the anticipated range of the sample concentrations. The calibration process involved the application of several drops of standard solution to cover the entire flat sensor surface. It is worth noting that rinsing the sensor with the standard solution before application can enhance the calibration precision. This preliminary rinse helped ensure thorough contact between the sensor and standard solution, minimizing potential contamination from previous samples. The details of these measurements are described elsewhere [
26].
YSI 9500 photometers (YSI, Yellow Springs, OH, USA) were used for photometric analysis, as shown in
Figure S2 in the Supporting Information. This instrument can be used for laboratory or on-site analysis. This portable device can measure over hundred parameters by selecting an appropriate program; however, for simplicity, we will be concerned only with nitrate measurement. For general analytical applications, both transmittance (test program 0) and absorbance (test program 1) can be evaluated. The process involves directing light through a specialized test tube containing the sample solution and a colored filter, which then reaches the photodetector. The system automatically selects filters to isolate light of a specific wavelength. In completely colorless solutions, all light passes through, unimpeded. However, colored samples absorb light, resulting in a proportional reduction in light transmission. The photometer quantifies the color produced by the reaction between the chemical reagents and the water sample. The pre-programmed calibrations for each test parameter were stored in a photometer. To optimize the sensitivity, various test procedures utilize different wavelengths, with the instrument automatically choosing the appropriate one. Calibration was achieved by inputting a unique program for each test procedure, enabling the instrument to select the correct wavelength filter and convert the photodiode response into a concentration reading. Consequently, the instrument provides a direct display of test results.
The determination of nitrate concentration in the water samples involved a two-step process. Initially, nitrate is reduced to nitrite, which is then identified through a diazonium reaction, resulting in a reddish dye. The reduction process utilized a specialized Nitratest powder and a tablet containing zinc, which promoted rapid flocculation after a brief contact period. The test was conducted in a unique Nitratest tube, which is a graded container with a hopper bottom designed to facilitate sample preparation and decanting. The nitrite produced during the reduction phase reacts with SAA in the presence of N-(1-naphthyl)-ethylenediamine, generating a crimson hue. A Nitricol tablet containing the necessary reagents was then introduced into the test solution. The intensity of the red dye was quantified by measuring the absorbance at 493 nm using a YSI 9500 photometer. This measurement involved diluting 10 mL of water and comparing it with the absorbance of a distilled water blank sample. A schematic diagram to measure the nitrate concentrations in the water samples using a photometric analysis technique is shown in
Figure S3 in the Supporting Information. A calibration graph was subsequently created; further details regarding these measurements can be found in other sources [
26]. Electrical conductivity and pH were measured using a BLE-C600 meter, which is a reliable instrument for assessing water quality parameters. A detailed experimental flow diagram that visually represents the sequence of experimental steps, from sample collection to nitrate and conductivity measurements, including calibration and data analysis, is shown in
Figure S4 in the Supporting Information.
3. Results and Discussion
3.1. Dilution Effect on Electrical Conductivity, Total Dissolved Solids and Nitrate
The dilution of high-nitrate water samples is crucial for accurate analysis, efficient resource use, and safe consumption. High nitrate concentrations can interfere with the analytical instruments, leading to measurement errors and unreliable results. Proper dilution ensures that nitrate levels fall within the optimal detection range of the testing methods, thus improving precision and reproducibility. Additionally, dilution can reduce chemical consumption by reducing the number of reagents required for testing, making the analysis more cost-effective and environmentally friendly. The dilution effect may significantly alter the electrical conductivity and total dissolved solids of the solution. The addition of water to a solution containing dissolved ions decreased the concentration of these ions, resulting in a reduction in both electrical conductivity and TDS.
Figure 1a shows the relationship between the electrical conductivity (EC) of a standard sample (1410 µS/cm) diluted in distilled water at various dilution factors with error bar. The diluted samples were subsequently measured using an ion-selective electrode (ISE) and conductivity meter (BLE-C600). The graph shows a strong linear correlation between EC and dilution factor, indicating direct proportionality. The term “strong linear correlation” refers to a close, positive relationship between two variables where changes in one variable are consistently associated with proportional changes in the other. This correlation is quantified by a high coefficient of determination (R
2). The ISE and colorimetric methods showed excellent agreement, demonstrating decreasing EC values with increasing dilution with minimal error. The high coefficient of determination (R
2 = 0.99) suggests a near-perfect fit and negligible systematic error in the measurements. These results indicate the potential interchangeability of the ISE method and the conductivity meter for EC determination. The robustness of both techniques was evident, demonstrating their reliability and precision for EC measurements across various dilution factors.
The dilution process also affects total dissolved solids, showing a linear increase with increasing dilution factor. This linear dependence facilitates accurate prediction of TDS in diluted solutions. Additionally, the dilution of standard EC solution samples exhibits a strong linear relationship between the dilution factor and nitrate concentration (
Figure 1b), confirming the significant contribution of nitrate ions to solution conductivity. A similar inverse relationship (shown in
Figure S5 in Supporting Information) was observed for the dilution of standard nitrate sample, as discussed previously for old groundwater [
27]. In the dilution process, the concentration of dissolved ions decreases, resulting in a reduction in both electrical conductivity and TDS. However, it is important to consider the potential influence of other dissolved ions, such as sodium, chloride, and sulfate, which may cause slight deviations from perfect linearity in the conductivity–nitrate concentration relationship.
3.2. Nitrate Concentration in Groundwater
In this study, two analytical methods were employed to measure nitrate concentrations in water samples: the Ion-Selective Electrode (ISE) method for higher concentration ranges, and the photometric method for lower concentration ranges. A comparative analysis, as shown in
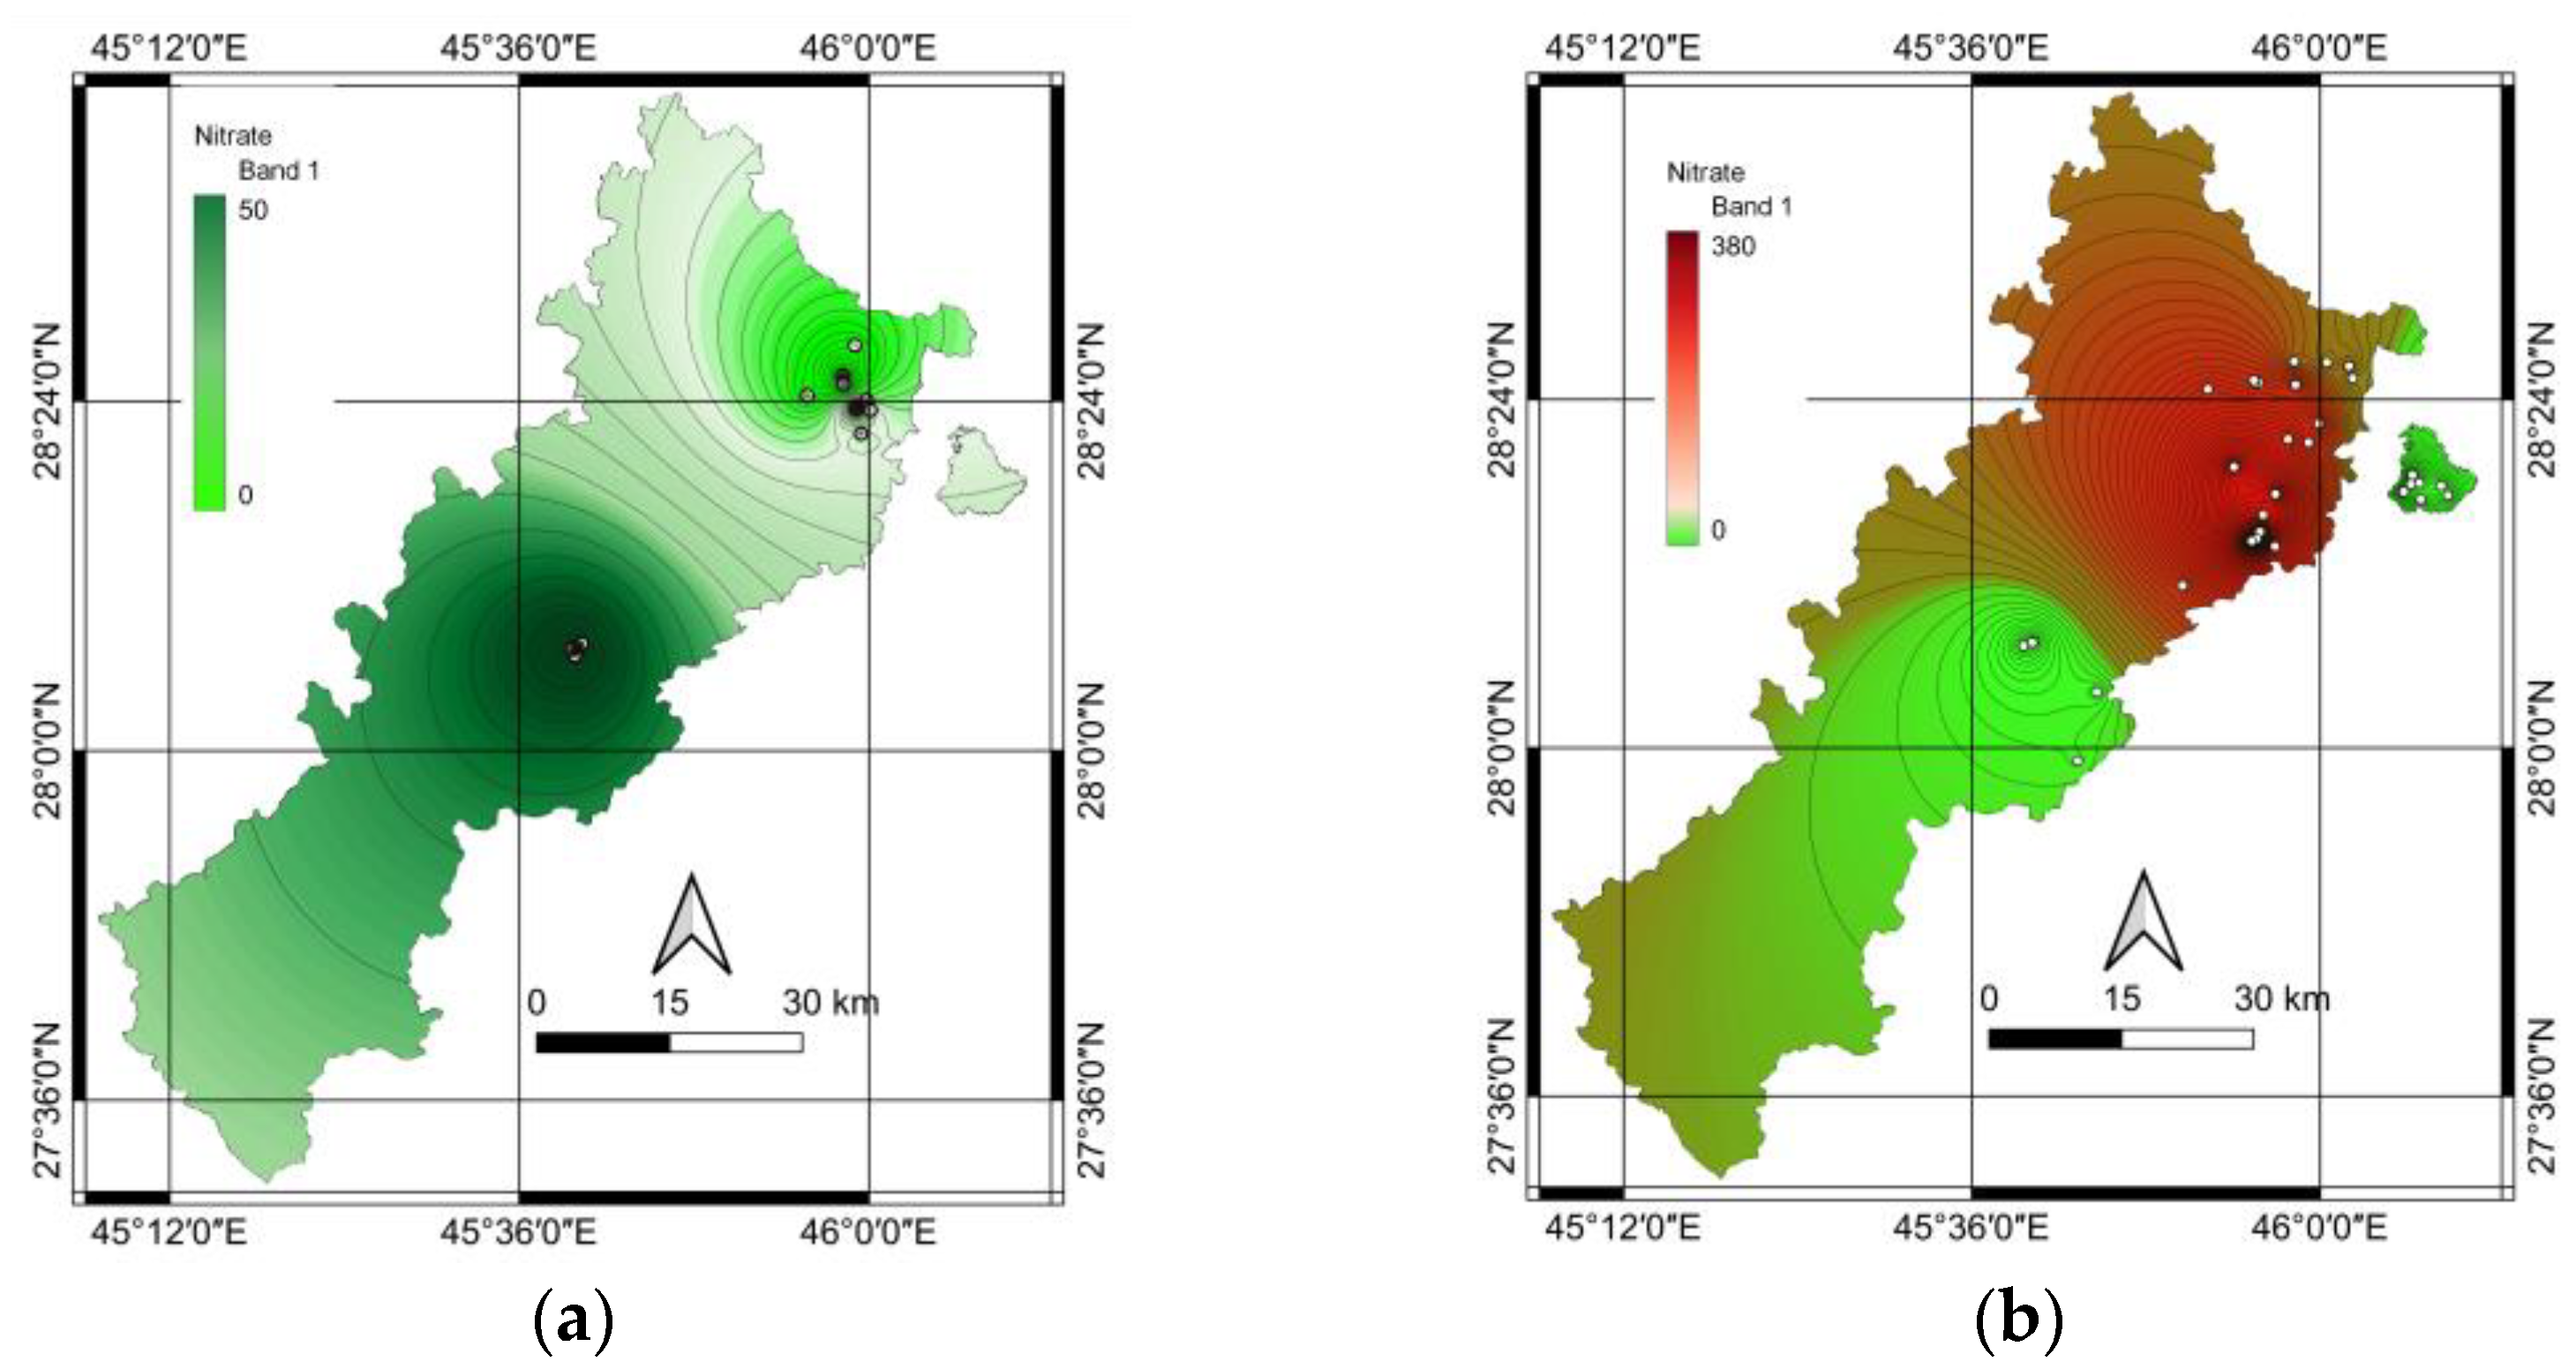
Figure S6 in the Supporting Information, revealed that both methods produced nearly identical results, demonstrating their reliability and consistency for nitrate detection. This study used GIS methodologies, particularly the inverse distance weighting (IDW) interpolation technique, to explain and visualize the spatial distribution of the nitrate concentration in groundwater wells. GIS-based approaches enhance data visualization for more accurate and comprehensive assessments of nitrate concentrations across different geographical areas. IDW is generally simpler to implement and computationally less intensive than other interpolations, making it an efficient choice for spatial analysis. It works well when sample points are relatively evenly distributed and assumes that nearby points are more closely related than distant points. The results of this approach are shown in
Figure 2 for both deep and shallow wells.
Spatial variations in the nitrate concentrations were observed across the examined regions in the deep wells, as revealed by the IDW method. Higher nitrate levels were observed in the central areas, especially in the river valley, whereas hilly regions to the north exhibited lower nitrate concentrations. The observed differences can be explained by factors related to geology, hydrology, and human activity. The concentration of nitrates can be substantially affected by several factors, including natural geological formations, movement patterns of groundwater, and proximity to various contamination sources. These sources include agricultural operations, septic systems, and industrial sites. Additionally, the characteristics of aquifers, including permeability, porosity, and hydraulic conductivity, might affect the nitrate levels in deep wells.
The geographic arrangement of nitrate levels in shallow wells showed a markedly different pattern compared to that in deep wells. Interpolation using the IDW revealed a notable north–south gradient, with elevated nitrate levels predominantly observed in the northern regions. This spatial heterogeneity suggests the influence of localized factors on groundwater quality in shallow wells. The higher nitrate concentrations in the northern areas exceeded the WHO guidelines, raising concerns regarding the potential health risks associated with consuming water from these shallow wells.
In conclusion, the spatial variations in nitrate concentrations observed across deep and shallow wells highlight the complex interplay of geological, hydrological, and anthropogenic factors influencing groundwater quality. For deep wells, higher nitrate levels in central areas, especially in the river valley, suggest potential influences from geological formations conducive to nitrate accumulation, groundwater flow patterns concentrating nitrates in specific areas, and proximity to contamination sources like agricultural operations or industrial sites. Lower concentrations in hilly northern regions may be due to different geological compositions, reduced human activities, and natural filtration processes. For shallow wells, the north–south gradient with elevated nitrate levels in northern regions indicates localized factors significantly impacting groundwater quality, potential differences in land use practices, and variations in soil characteristics and hydrogeological conditions. The exceedance of WHO guidelines in northern shallow wells raises concerns about potential health risks, the need for immediate mitigation measures, and the importance of regular monitoring and testing. To address these issues, it is crucial to conduct detailed hydrogeological surveys, implement stricter regulations on fertilizer use and waste management in high-risk areas, develop targeted remediation strategies, and enhance public awareness about water quality issues and safe water practices. Further research should focus on identifying specific sources of nitrate contamination in affected areas and assessing their impacts.
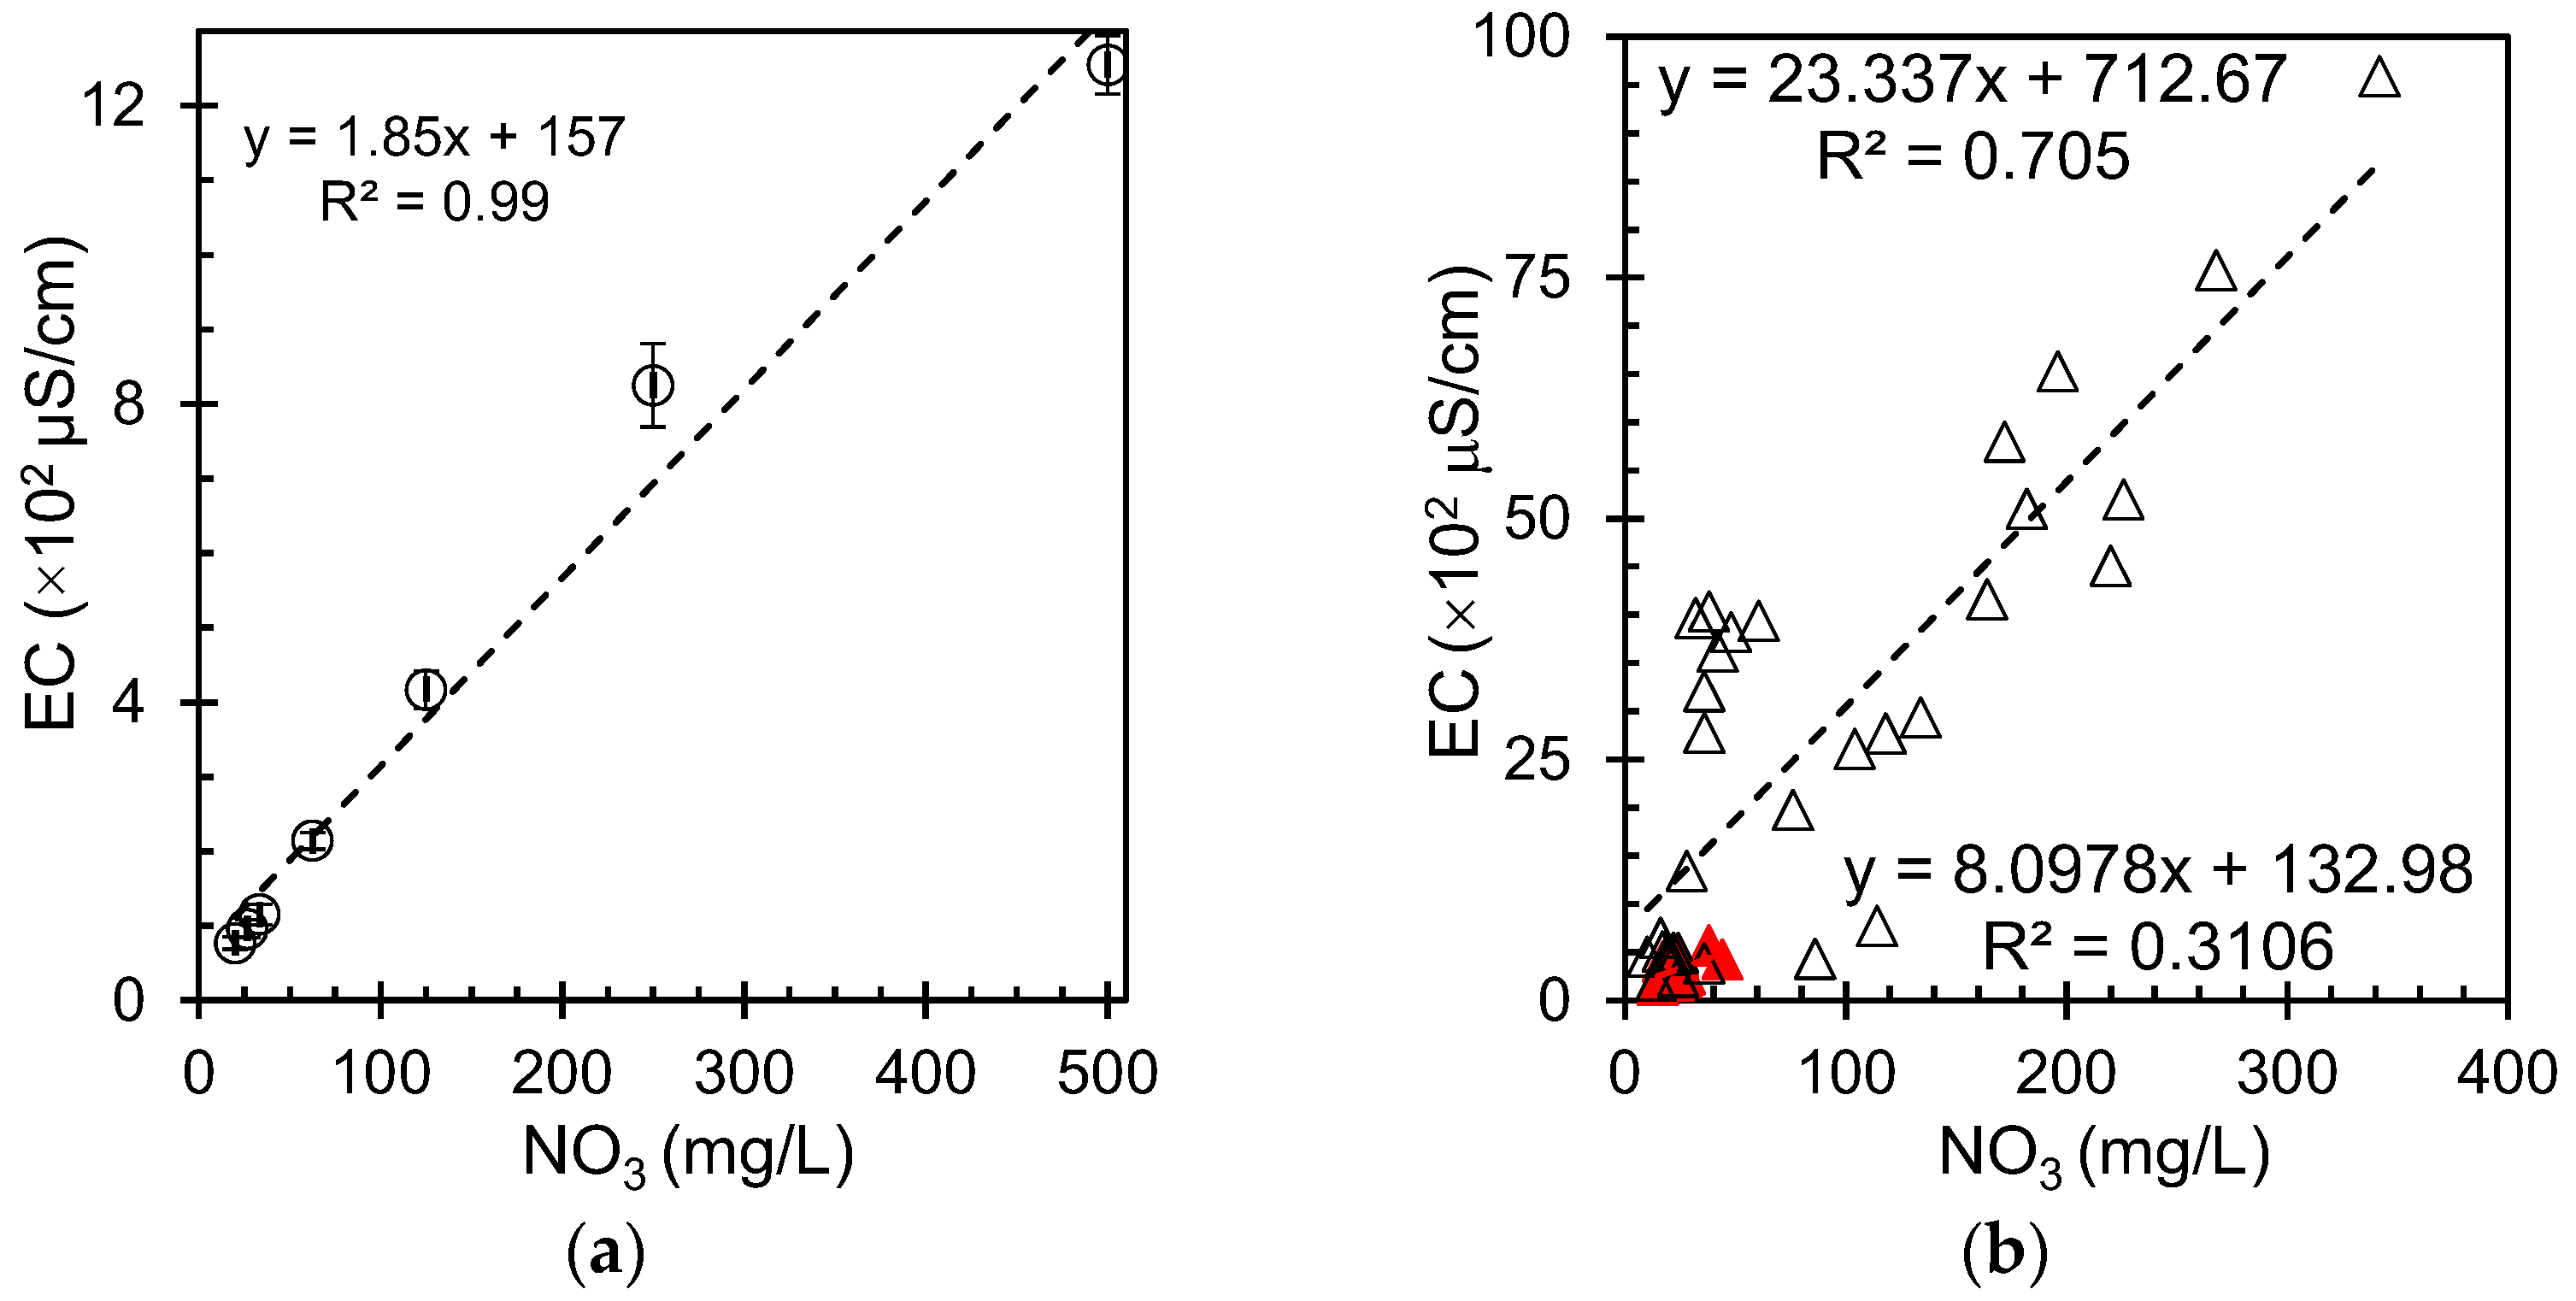
3.3. Electrical Conductivity in Groundwater and Correlation with Nitrate
The correlation between conductivity and nitrate can provide valuable information for monitoring water quality and pollution. Conductivity measures the ability of the water to conduct electricity.
Figure 3a shows the variation in the electrical conductivity with nitrate concentration for the reference samples with error bar. The measured nitrate and the corresponding conductivity curve showed a linear dependence in ultrapure water, indicating that nitrate ions contribute to the overall conductivity in this specific context. This finding has significant implications for ultra-pure water systems, as it provides insight into how even small amounts of nitrate can affect water properties. This could be particularly useful in situations where rapid assessments are needed, or resources for comprehensive chemical analyses are limited. However, it is important to note that while this correlation is strong, other factors can also influence the conductivity. Although conductivity measurements can provide a good indication of nitrate levels, they should be used in conjunction with other water quality parameters for comprehensive assessment of water quality.
Figure 3b shows the relationship between the electrical conductivity and nitrate concentration in the groundwater samples. The graph reveals a positive correlation between these two parameters, indicating that the electrical conductivity increases as the nitrate concentration increases. The data points in the graph show a scattered distribution, suggesting some variability in the relationship. However, a general upward trend was evident, supporting the positive correlation between nitrate concentration and electrical conductivity.
This relationship can be explained by the fact that nitrate ions contribute to the overall ionic content of the water, thereby increasing its ability to conduct electricity. As nitrate concentrations rise, they add to the total dissolved solids (TDS) in the water, which is directly related to electrical conductivity. The correlation for the groundwater samples was not consistent with the strong positive correlation (r2 = 0.99) found in the standard nitrate solution measurements described earlier. However, the groundwater samples showed more variability, likely because of the complex composition of natural groundwater systems. The observed correlation also provides insights into the potential sources of nitrate contamination in groundwater. High nitrate concentrations accompanied by high electrical conductivity values may indicate anthropogenic sources of pollution, such as agricultural runoff or wastewater infiltration, which often introduces other dissolved ions along with nitrates.
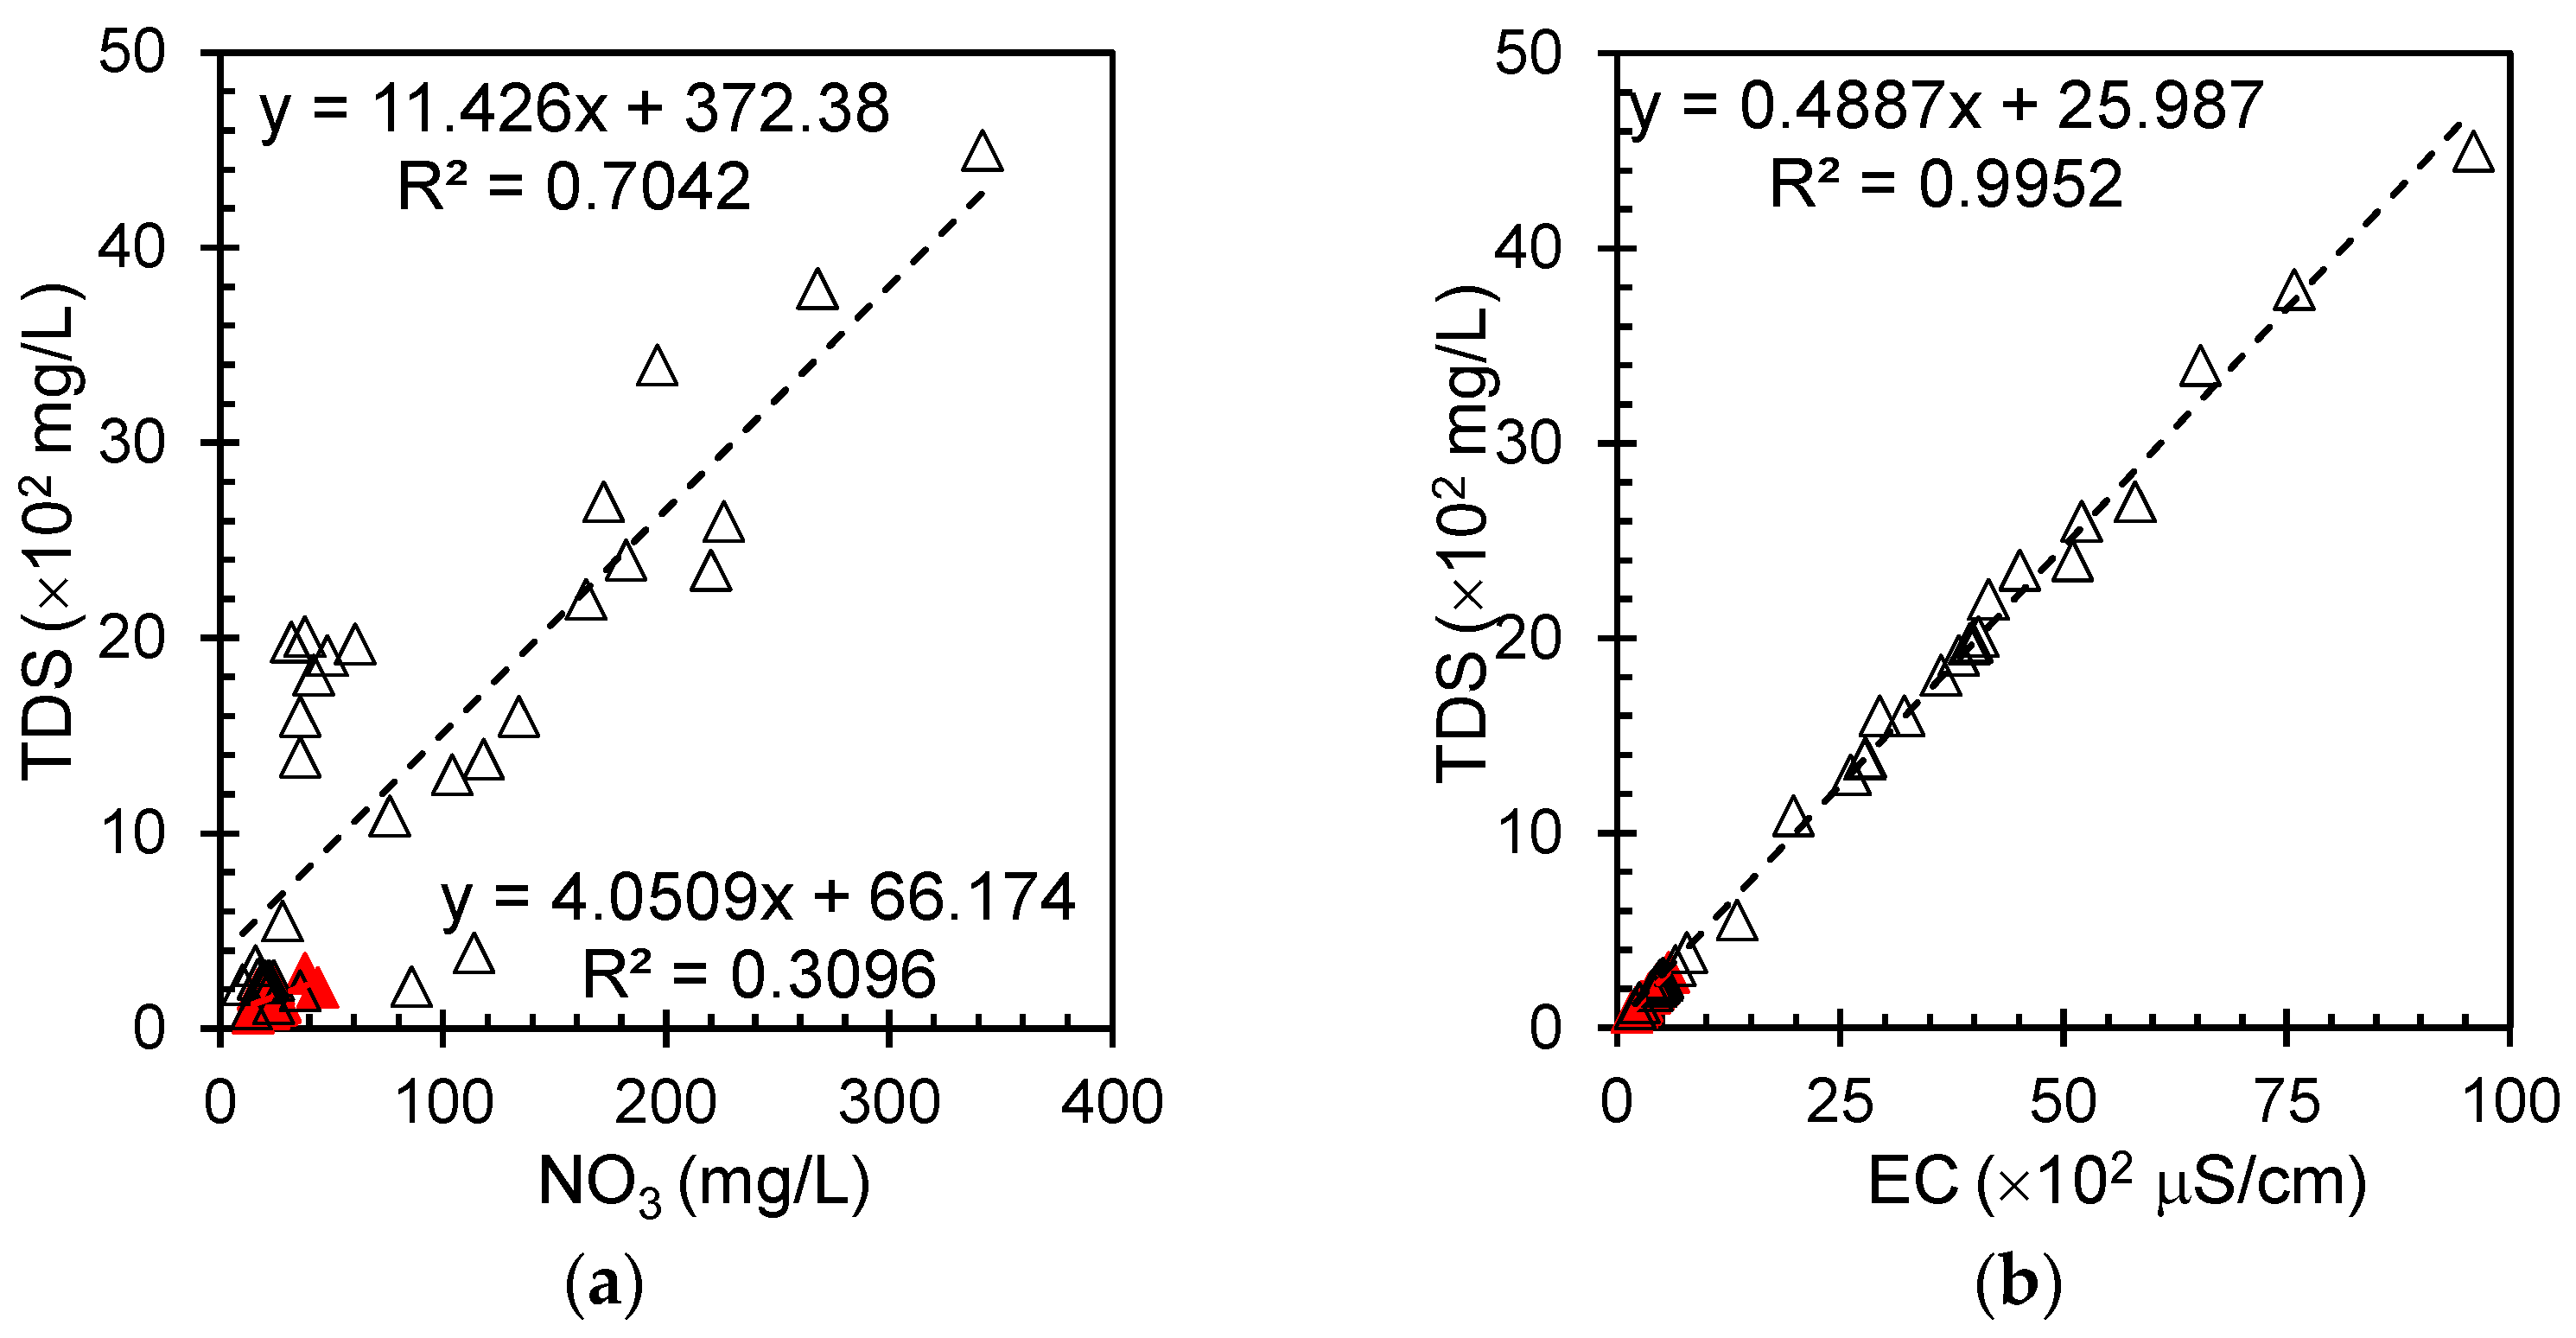
3.4. Total Dissolved Solids and Electrical Conductivity in Groundwater
The relationships between total dissolved solids (TDS), nitrate, and electrical conductivity are closely linked, providing valuable insights into groundwater quality, pollution sources, and potential health risks. The strong correlation between TDS and electrical conductivity enables a rapid and cost-effective water quality assessment. Understanding these interconnections is essential for comprehensive groundwater analysis.
Figure 4a shows a plot of total dissolved solids (TDS) and nitrate in the groundwater samples. The graph reveals a linear but scattered correlation between the two parameters. This relationship suggests that as nitrate levels increase in groundwater, there is a general tendency for the total dissolved solids to increase as well. However, the scattered nature of the data points indicates that this relationship is not perfect and that other factors may influence TDS levels. The presence of this correlation, albeit with some variability, implies that nitrate could be a significant contributor to the overall dissolved solid content in these groundwater samples.
Figure 4b presents the relationship between the total dissolved solids and electrical conductivity in groundwater. This relationship can be quantified by a regression slope of ~0.5, indicating that TDS increases by approximately 50 mg/L for every 100 μS/cm increase in EC. This strong correlation has significant practical implications for water quality monitoring. EC measurements, which are more expedient and straightforward than TDS determinations, can facilitate efficient indirect TDS estimations in both field and laboratory contexts. However, it is important to note that while highly reliable, minor deviations may occur owing to variations in ionic composition, temperature effects, or measurement precision, necessitating location-specific calibrations for enhanced accuracy.
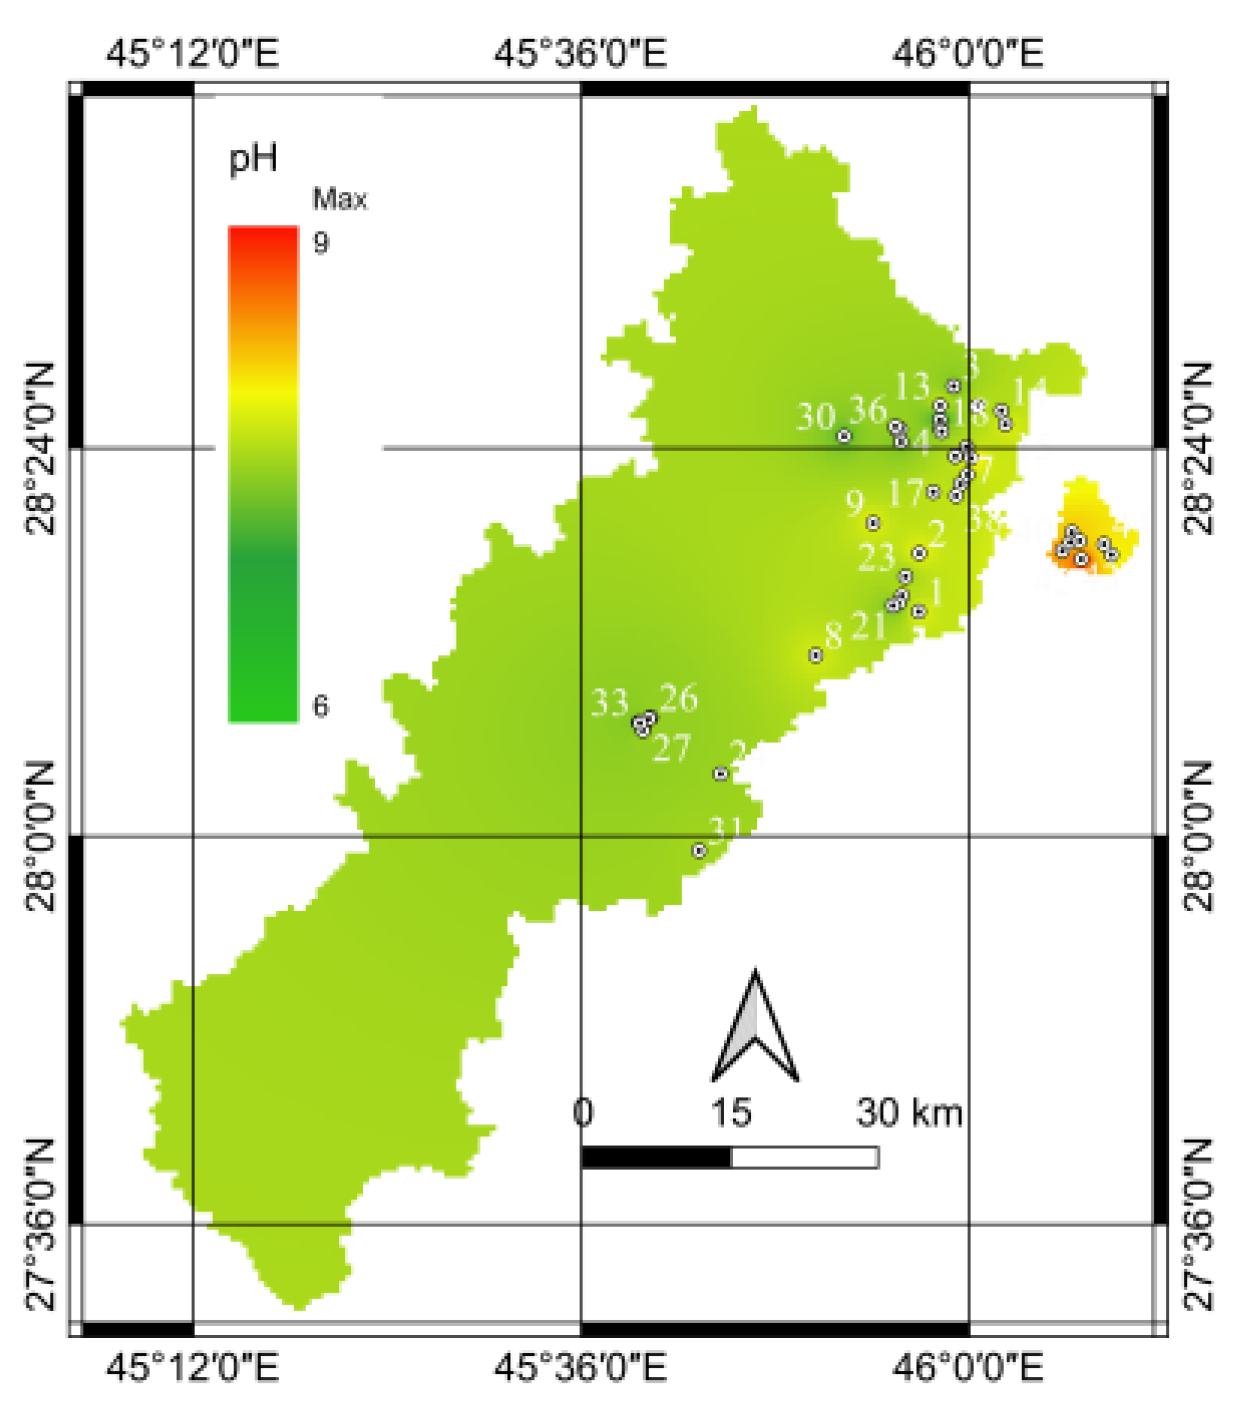
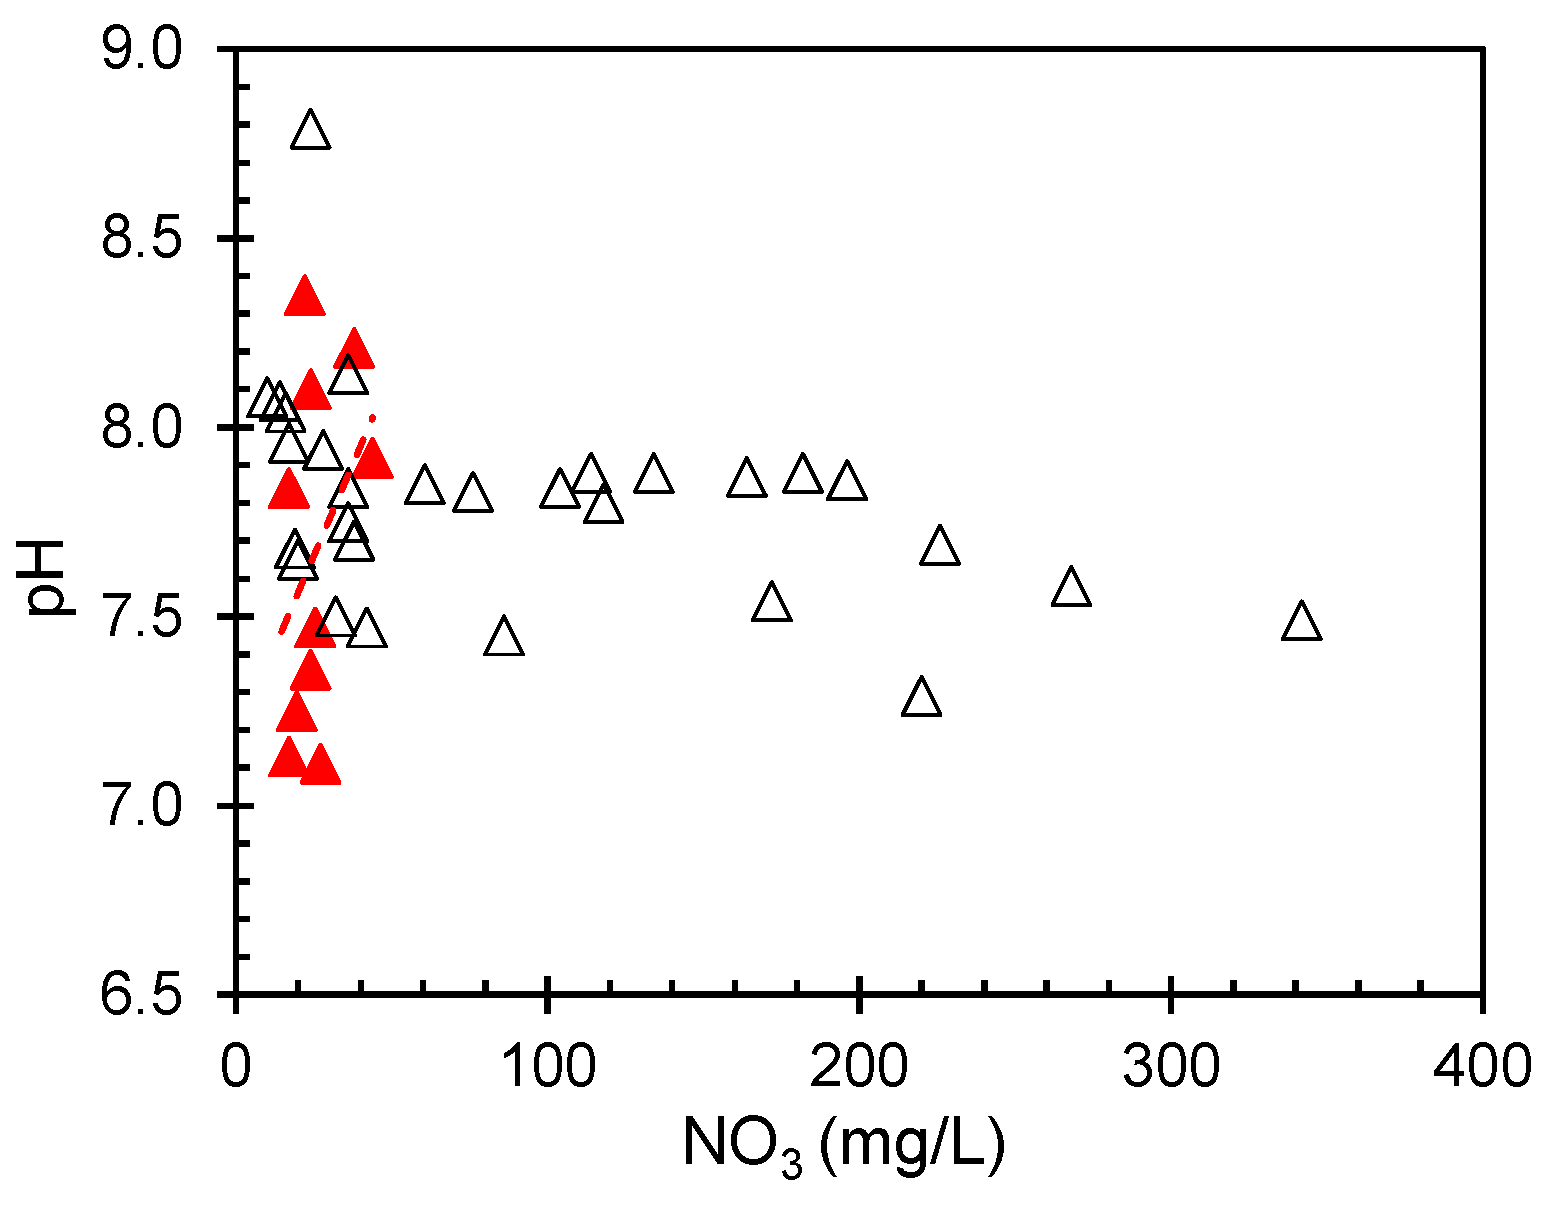
3.5. pH in Groundwater and Correlation with Nitrate
The pH, which measures the acidity or alkalinity of water, can significantly influence the behavior and mobility of nitrate in aqueous environments. In groundwater systems, the pH can affect the solubility and transport of nitrate ions, potentially affecting their distribution and concentration. The estimated pH values are plotted, and a special distribution is shown in
Figure 5. The spatial distribution showed that the eastern portion of the examined area had consistently higher pH values. This trend indicates distinct water chemistry characteristics in this region compared with other parts of the study area.
Multiple factors may be related to the higher pH levels in the eastern region. Geological structures such as limestone or dolomite formations can impart alkaline properties to water, leading to elevated pH values [
7]. The eastern region may exhibit geological features that promote alkaline conditions. Additional research is required to gain a comprehensive understanding of the root causes and possible implications of pH levels.
Although nitrate is typically considered a mild acid that can lower water pH, thereby increasing acidity, there are scenarios in which it may elevate groundwater pH. The estimated pH was analyzed as a function of the nitrate concentration (
Figure 6). The analysis indicated a weak negative correlation between these two variables with a correlation coefficient (r
2) of 0.022. This low value suggests a minimal link between nitrate content and pH in the examined groundwater samples. A similar trend was observed in surface water samples from the Indian coastal waters of the Arabian Sea, as reported by Gopinath et al. [
28]. However, in this dataset, the relationship between pH and nitrate concentration was statistically insignificant. The lack of a substantial correlation implies that other factors or variables may have a more pronounced impact on nitrate levels within this specific groundwater system.
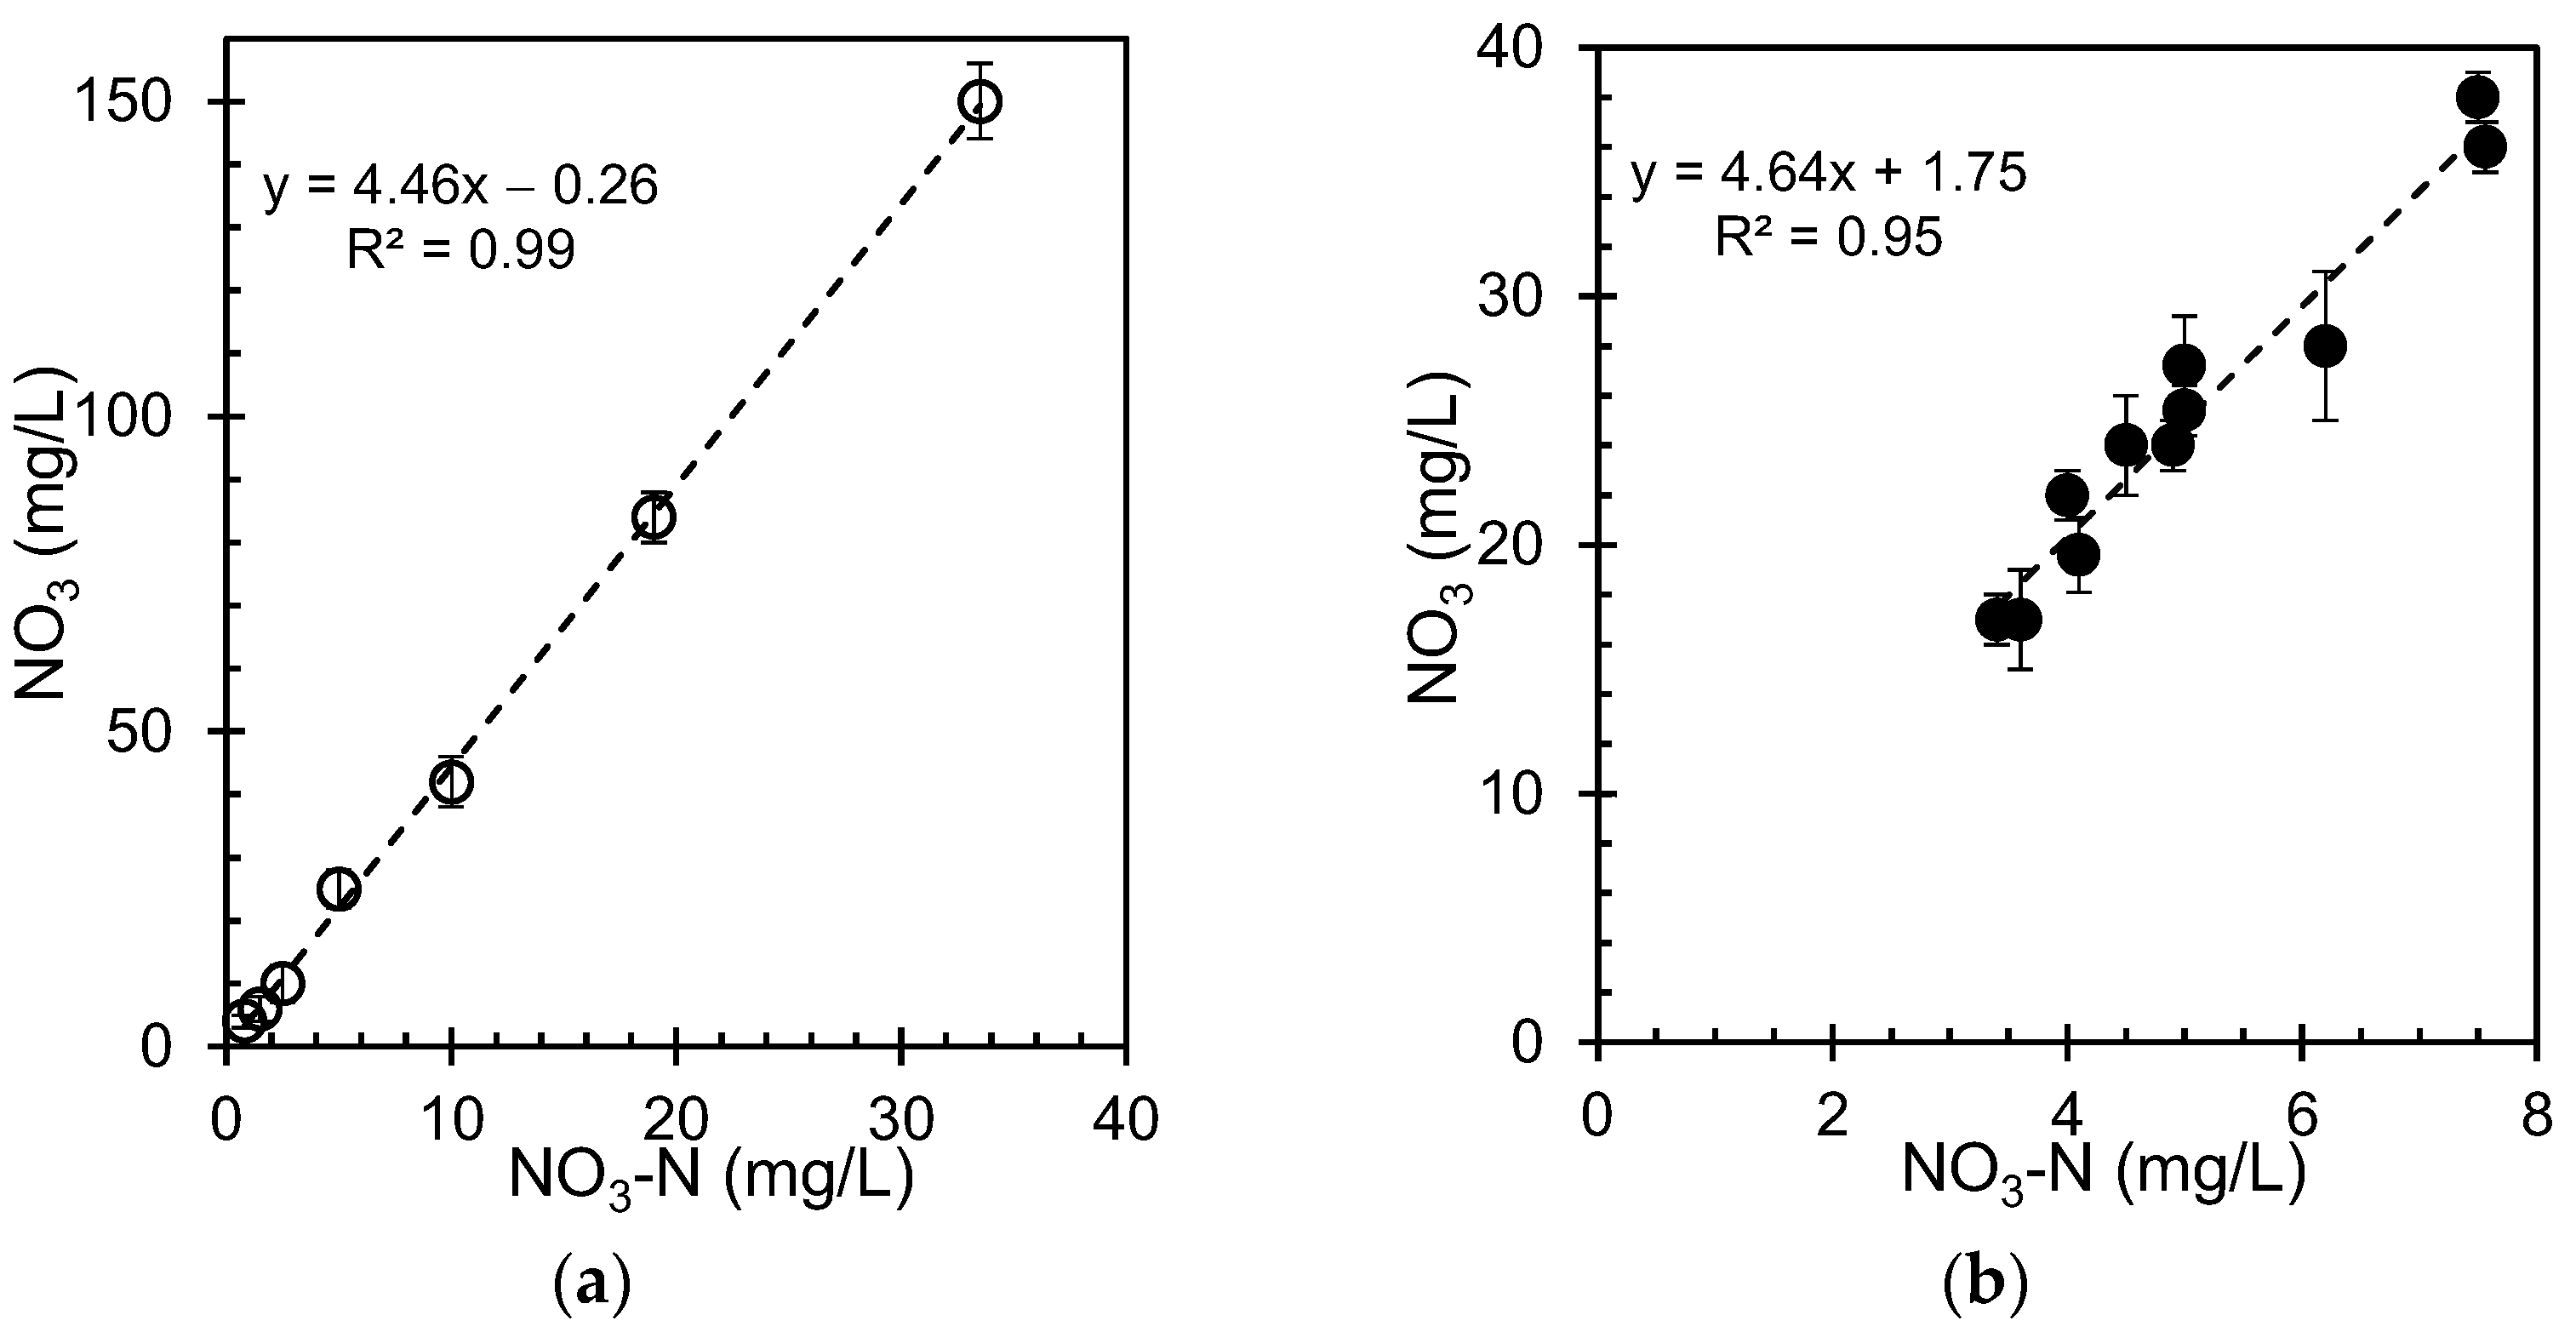
3.6. Correlation Between Nitrate and Nitrate-Nitrogen in Groundwater
Nitrate and nitrate-nitrogen are closely related chemical species found in groundwater, and nitrate-nitrogen is a component of nitrate. The correlation between these two forms is typically strong and positive, because nitrate-nitrogen is derived from nitrate. Nitrate (NO
3−) is commonly measured, and nitrate-nitrogen (NO
3-N) represents the nitrogen portion of the nitrate molecule. A plot of nitrate concentration versus nitrate-nitrogen in groundwater was determined using the YSI 9500 photometric method for the standard and groundwater samples, as shown in
Figure 7.
For the reference samples (
Figure 7a), there was a strong linear relationship between nitrate concentration and nitrate-nitrogen. This is expected because nitrate-nitrogen is derived from nitrate. The graph shows a clear positive correlation, with nitrate-nitrogen increasing proportionally with increasing nitrate concentrations. In the case of groundwater samples (
Figure 7b), a similar positive correlation was observed, but with more scatter in data points. This increased variability is likely due to the complex composition of natural groundwater systems, which can contain various other dissolved ions and compounds that may influence the measurements.
The strong correlation between nitrate and nitrate-nitrogen concentrations suggests that measurements can provide valuable information regarding the overall nitrogen content in water. However, deviations from the expected relationship may indicate the presence of other nitrogen-containing compounds, or potential measurement errors. This study highlights the importance of monitoring nitrogen pollution in groundwater, which can originate from various sources such as agricultural runoff, septic systems, and atmospheric deposition. High levels of these compounds in drinking water can pose health risks, particularly in vulnerable populations, such as infants and young children. Consequently, careful monitoring and management of nitrogen inputs is crucial in areas where groundwater is a significant source of drinking water. We acknowledge that a comprehensive analysis of all other water components, along with nitrate concentration, is essential for a more complete understanding of water quality. We are currently conducting an in-depth study to evaluate the potential correlations between nitrate and other water constituents. However, this research is time consuming and requires extensive data collection and analysis. Once we have established any significant correlations, we intend to publish our findings in a separate study.
4. Conclusions
This study investigated the relationship between nitrate concentration and various water quality parameters in groundwater. Multiple analytical techniques, including ion-selective electrodes, photometric analysis, and GIS-based spatial interpolation, have been used to examine the nitrate levels in groundwater. The key findings are as follows:
1. A strong linear correlation between electrical conductivity and dilution factor suggests the potential interchangeability of ion-selective electrode methods and conductivity meters for EC determination;
2. Spatial variations in nitrate concentrations were observed in both the deep and shallow wells, with distinct patterns emerging through GIS analysis. These variations highlight the influence of geological, hydrological, and anthropogenic factors on the nitrate distribution in groundwater;
3. A statistically significant correlation was observed between total dissolved solids (TDS), nitrate concentrations, and electrical conductivity in groundwater samples. The analysis revealed a linear, albeit dispersed, relationship between TDS and nitrate levels, indicating nitrate’s contribution to the overall dissolved solid content, while suggesting that additional factors may influence TDS concentrations. Furthermore, a strong positive correlation between TDS and electrical conductivity was identified, facilitating expeditious and economical estimation of TDS through electrical conductivity measurements;
4. A very weak negative correlation between nitrate concentration and pH in the groundwater samples indicates that other factors may have a more significant impact on the pH of the groundwater;
5. A positive correlation was found between the nitrate concentration and electrical conductivity in the groundwater samples, although there was more variability compared to the standard solutions. This relationship suggests that conductivity measurements can potentially serve as a proxy for estimating nitrate levels in natural groundwater.
6. The strong positive correlation between nitrate and nitrate-nitrogen concentrations, particularly in the reference and groundwater samples, reflects the close chemical connection between these two forms of nitrogen in water.
These findings contribute to our understanding of nitrate dynamics in groundwater and highlight the complex interactions between nitrate and other water quality parameters. Additionally, continued monitoring and management of nitrogen inputs in vulnerable areas remain crucial for protecting water resources and public health.


