Article

Maximum Potential Age of Pondcypress Hydrologic Indicators Using Diameter at Breast Height

by
Cortney R. Cameron
1,* and
Thomas J. Venning
2
1
SouthEco, LLC, Merrill, OR 97633, USA
2
Southwest Florida Water Management District, Brooksville, FL 34604, USA
*
Author to whom correspondence should be addressed.
Limnol. Rev. 2025, 25(1), 9; https://doi.org/10.3390/limnolrev25010009
Submission received: 18 February 2025 / Revised: 16 March 2025 / Accepted: 17 March 2025 / Published: 20 March 2025

Abstract

:
In the absence of long-term hydrologic records, field-measured hydrologic indicators are useful for inferring past wetland hydrologic conditions, which can support research, regulation, and restoration. Inflection points on the buttresses of pondcypress trees (Taxodium ascendens) are frequently used in west-central Florida to estimate cypress wetland high water levels, known as normal pool. However, little is known about how this indicator develops. A method to estimate tree age using diameter at breast height was developed for Florida pondcypress, which can be used by forested wetland managers to constrain the maximum potential age of hydrologic indicators in groups of cypress trees. This model was applied to a waterbody with a complex history of hydrologic alterations. The waterbody had two distinct populations of buttress inflection elevations, corresponding to historic versus current water level regimes. This represents one of the first documented instances in the literature where a waterbody showed multiple buttress inflection populations in the absence of soil subsidence. This work underscores the need to consider the development timelines when interpreting the hydrologic meaning of indicator elevations.

1. Introduction

In the absence of long-term hydrologic records, field-measured hydrologic indicators are useful for inferring past wetland hydrologic conditions, which can support research, regulatory, and restoration purposes [1,2,3]. These hydrologic indicators can include hydric soils, water marks, hydrophytic vegetation, and fluvial sediment deposits, among numerous others, and vary in the presence and relevance across environmental and regulatory settings, e.g., [1,2,3,4,5]. Depending on the indicator’s development period and lifespan, the indicator may reflect recent or historic hydrologic conditions, which is important to consider when interpreting the meaning of indicator elevations. Hydrologic indicators that predate major hydrologic impacts and have not been altered by post-development processes can be used to approximate baseline hydrologic conditions. However, the time of development for hydrologic indicators is not always known.
Baldcypress (Taxodium distichum) and pondcypress (T. ascendens or T. distichum var. imbricarium) are closely related obligate wetland conifers native to the southeastern United States and Mississippi Valley [6,7,8]. Cypress can live for centuries and, once established, can survive the total lack of inundation [6]. Thus, cypress-based indicators can serve as useful tools for inferring past hydrologic conditions in cypress wetlands [1,9,10,11].
Within west-central Florida cypress dome wetlands, “normal pool” (NP) elevations can be derived from the inflection or taper point on cypress tree buttressing, that is, the point where the buttress angle changes (Figure 1). This NP indicator is associated with the uppermost 1 to 5% of wetland water levels [1,11,12,13,14,15]. Water levels at many wetlands in this region were historically influenced by groundwater withdrawals [16]. However, cypress dome morphology and regional precipitation patterns can allow high water levels to achieve NP even when lower water levels are depressed [16,17]. Thus, NP can serve a useful indicator of baseline hydrology even in cypress domes that have been hydrologically impacted for decades.
Accordingly, NP is frequently utilized by Southwest Florida Water Management District (SWFWMD), a regional water management agency, and has been extensively employed in the literature [1,9,10,11,12,13,14,15,16,17,18,19,20,21,22,23,24,25,26,27,28,29]. While some work has explored cypress buttressing [6,30,31,32], the causes of NP inflection development are not understood. Additionally, it is unknown whether this morphologic feature appears throughout the range of the cypress species. NP is considered more reliable in palustrine and lacustrine wetlands compared to riparian wetlands, with the former typically dominated by T. ascendens. Furthermore, the persistence of the NP inflection has been inferred by its continuing presence for decades at wetlands with depressed hydrology. However, limited information is available regarding the time required for the NP inflection to develop.
During NP data collection at Lake Charles in Hillsborough County, Florida (Figure 2), SWFWMD staff noticed two distinct populations of cypress buttress inflection elevations, an unusual occurrence in the absence of soil subsidence. Lower NP corresponded to smaller trees located within a lake-fringing wetland, while the higher NP corresponded to larger trees located within lakefront yards. This led to interest in whether the two groups of NP could be explained by water level history at the lake, which has experienced time-varying structural alterations and groundwater impacts. To that end, this study evaluates Lake Charles as a case study, where cypress tree age estimates are assessed for correspondence to lake water level and structural history. This research explores how tree age data can help interpret hydrologic indicators in wetlands.
First, the study developed a generalized age–DBH relationship for T. ascendens, which can be readily applied by wetland managers to estimate the maximum potential age of hydrologic indicators. Second, the study described one of the first documented instances where a single waterbody exhibited two distinct NP populations without soil subsidence, showing how long-term hydrologic alterations can create multiple generations of indicators. Overall, the study demonstrates a methodological framework for using tree growth relationships to constrain the temporal relevance of biological hydrologic indicators, which can be applied to other forested wetland types. Collectively, these contributions enhance our understanding of reconstructing historical hydrologic conditions in wetland systems with complex histories of alterations.

1.1. Lake Charles

Lake Charles is an approximately 6-hectare lake in Hillsborough County, Florida (Figure 2). The lake’s history and hydrogeologic setting are detailed in Venning and Cameron [33] and summarized here. The lake is located within a karst landscape with flat terrain. Land use in the watershed is dominated by medium density residential development, mostly established by the 1970s. The lake shows a strong connection to the underlying Upper Floridan aquifer, a regional source for public water supply. Located less than 3 km from Section 21 wellfield, Lake Charles experienced a decreasing lake stage after intensive wellfield withdrawals began in the 1960s. In response to declining water levels, lakefront residents began augmenting the lake with groundwater in 1968. In the early 2000s, the lake showed significant recovery after wellfield reductions; augmentation quantities since have been minimal. Various conveyance systems have altered the lake’s channelized inflows and outflows since at least 1966. Under modern outlet elevations, channel outflow is not achieved, making the lake effectively a closed basin.
Lake stage data for Lake Charles are available since 1971 (Figure 3). Modeling work was previously completed to simulate “historic” lake levels (Figure 3) [33]. Historic lake levels represent the absence of regional groundwater withdrawals and lake augmentation but with modern structural and land development conditions present. Modeling suggests that upper decile water levels are currently about 0.2 m (m) lower than historic conditions. However, this value relies on current wellfield operations and structural conditions, which are less intensive relative to the 1960s–1990s [33]. Since 2010, structural, withdrawal, and augmentation conditions at the lake have been relatively stable [16,33]. Under modern withdrawal conditions, impacts on median water levels are relatively small [16,33].

1.2. Cypress Age–DBH Relationships

Tree growth or age–DBH relationships can be used to understand forest structure and inform lumber production [34,35,36,37,38,39,40,41,42,43]. Common growth models include both linear and nonlinear approaches [42,43,44]. Since environmental conditions and competition significantly influence tree growth, age–DBH curves may be varied by region or through inclusion of site-related predictor variables [35,44,45,46,47,48,49,50].
In the context of tree-based hydrologic indicators, age–DBH relationships can be used to gain a general understanding of tree age, providing the maximum potential age for the indicator. Tree age can be estimated using various methods, such as dendrochronology and knowledge of tree planting year. Advantages of the DBH approach include reduced requirements for specialized equipment and skills, minimal need for prior information about a specific tree, rapid results, and elimination of concerns about tree damage [44,45]. However, the method requires an age–DBH model that characterizes the population–level relationship and may be poorly representative of individuals.
For cypress trees, the development of a general age–DBH relationship is further complicated by growth variability. Cypress tree growth rates are well known to vary with environmental conditions, such as inundation depth and frequency, nutrients, soils, and light availability [51,52,53,54,55,56,57,58,59,60,61,62,63]. Thus, cypress tree growth varies from year to year, tree to tree, and wetland to wetland, and typically slows after 350–600 years [6,51,52,53,54,55,56,57,58,59,60,61,62,63]. Additionally, cypress trees frequently form false rings, which necessitates careful microscopy for ring analyses, as otherwise ages can be overestimated [7,8,64,65]. DBH measurement, on the other hand, is complicated by cypress buttressing variability. Although studies have shown that diameter measurements besides DBH are more useful for predicting some cypress tree attributes [66], DBH is the only diameter reported in most studies and datasets. However, DBH from cores and field measurements can vary slightly depending on how bark thickness is considered. Cypress bark thickness increases with diameter and can reach 4 cm (cm) or more [67].
Overall, a generalized age–DBH curve is unlikely to describe any individual tree well and may perform poorly for some wetlands. This limitation stems both from natural growth variability and from data constraints. Accordingly, age–DBH curves for cypress trees have been developed for a limited number of individual wetlands, e.g., [45,68]. Despite these challenges, an age–DBH relationship can provide valuable comparisons of relative tree ages within undated cypress stands. Recent literature and datasets have made more data available for developing such a relationship. Therefore, this study evaluates a general age–DBH curve for cypress trees that can be applied to Lake Charles and other cypress wetlands throughout Florida. The results can be used to provide an estimate of the maximum potential age of NP indicators observed on cypress trees.

2. Materials and Methods

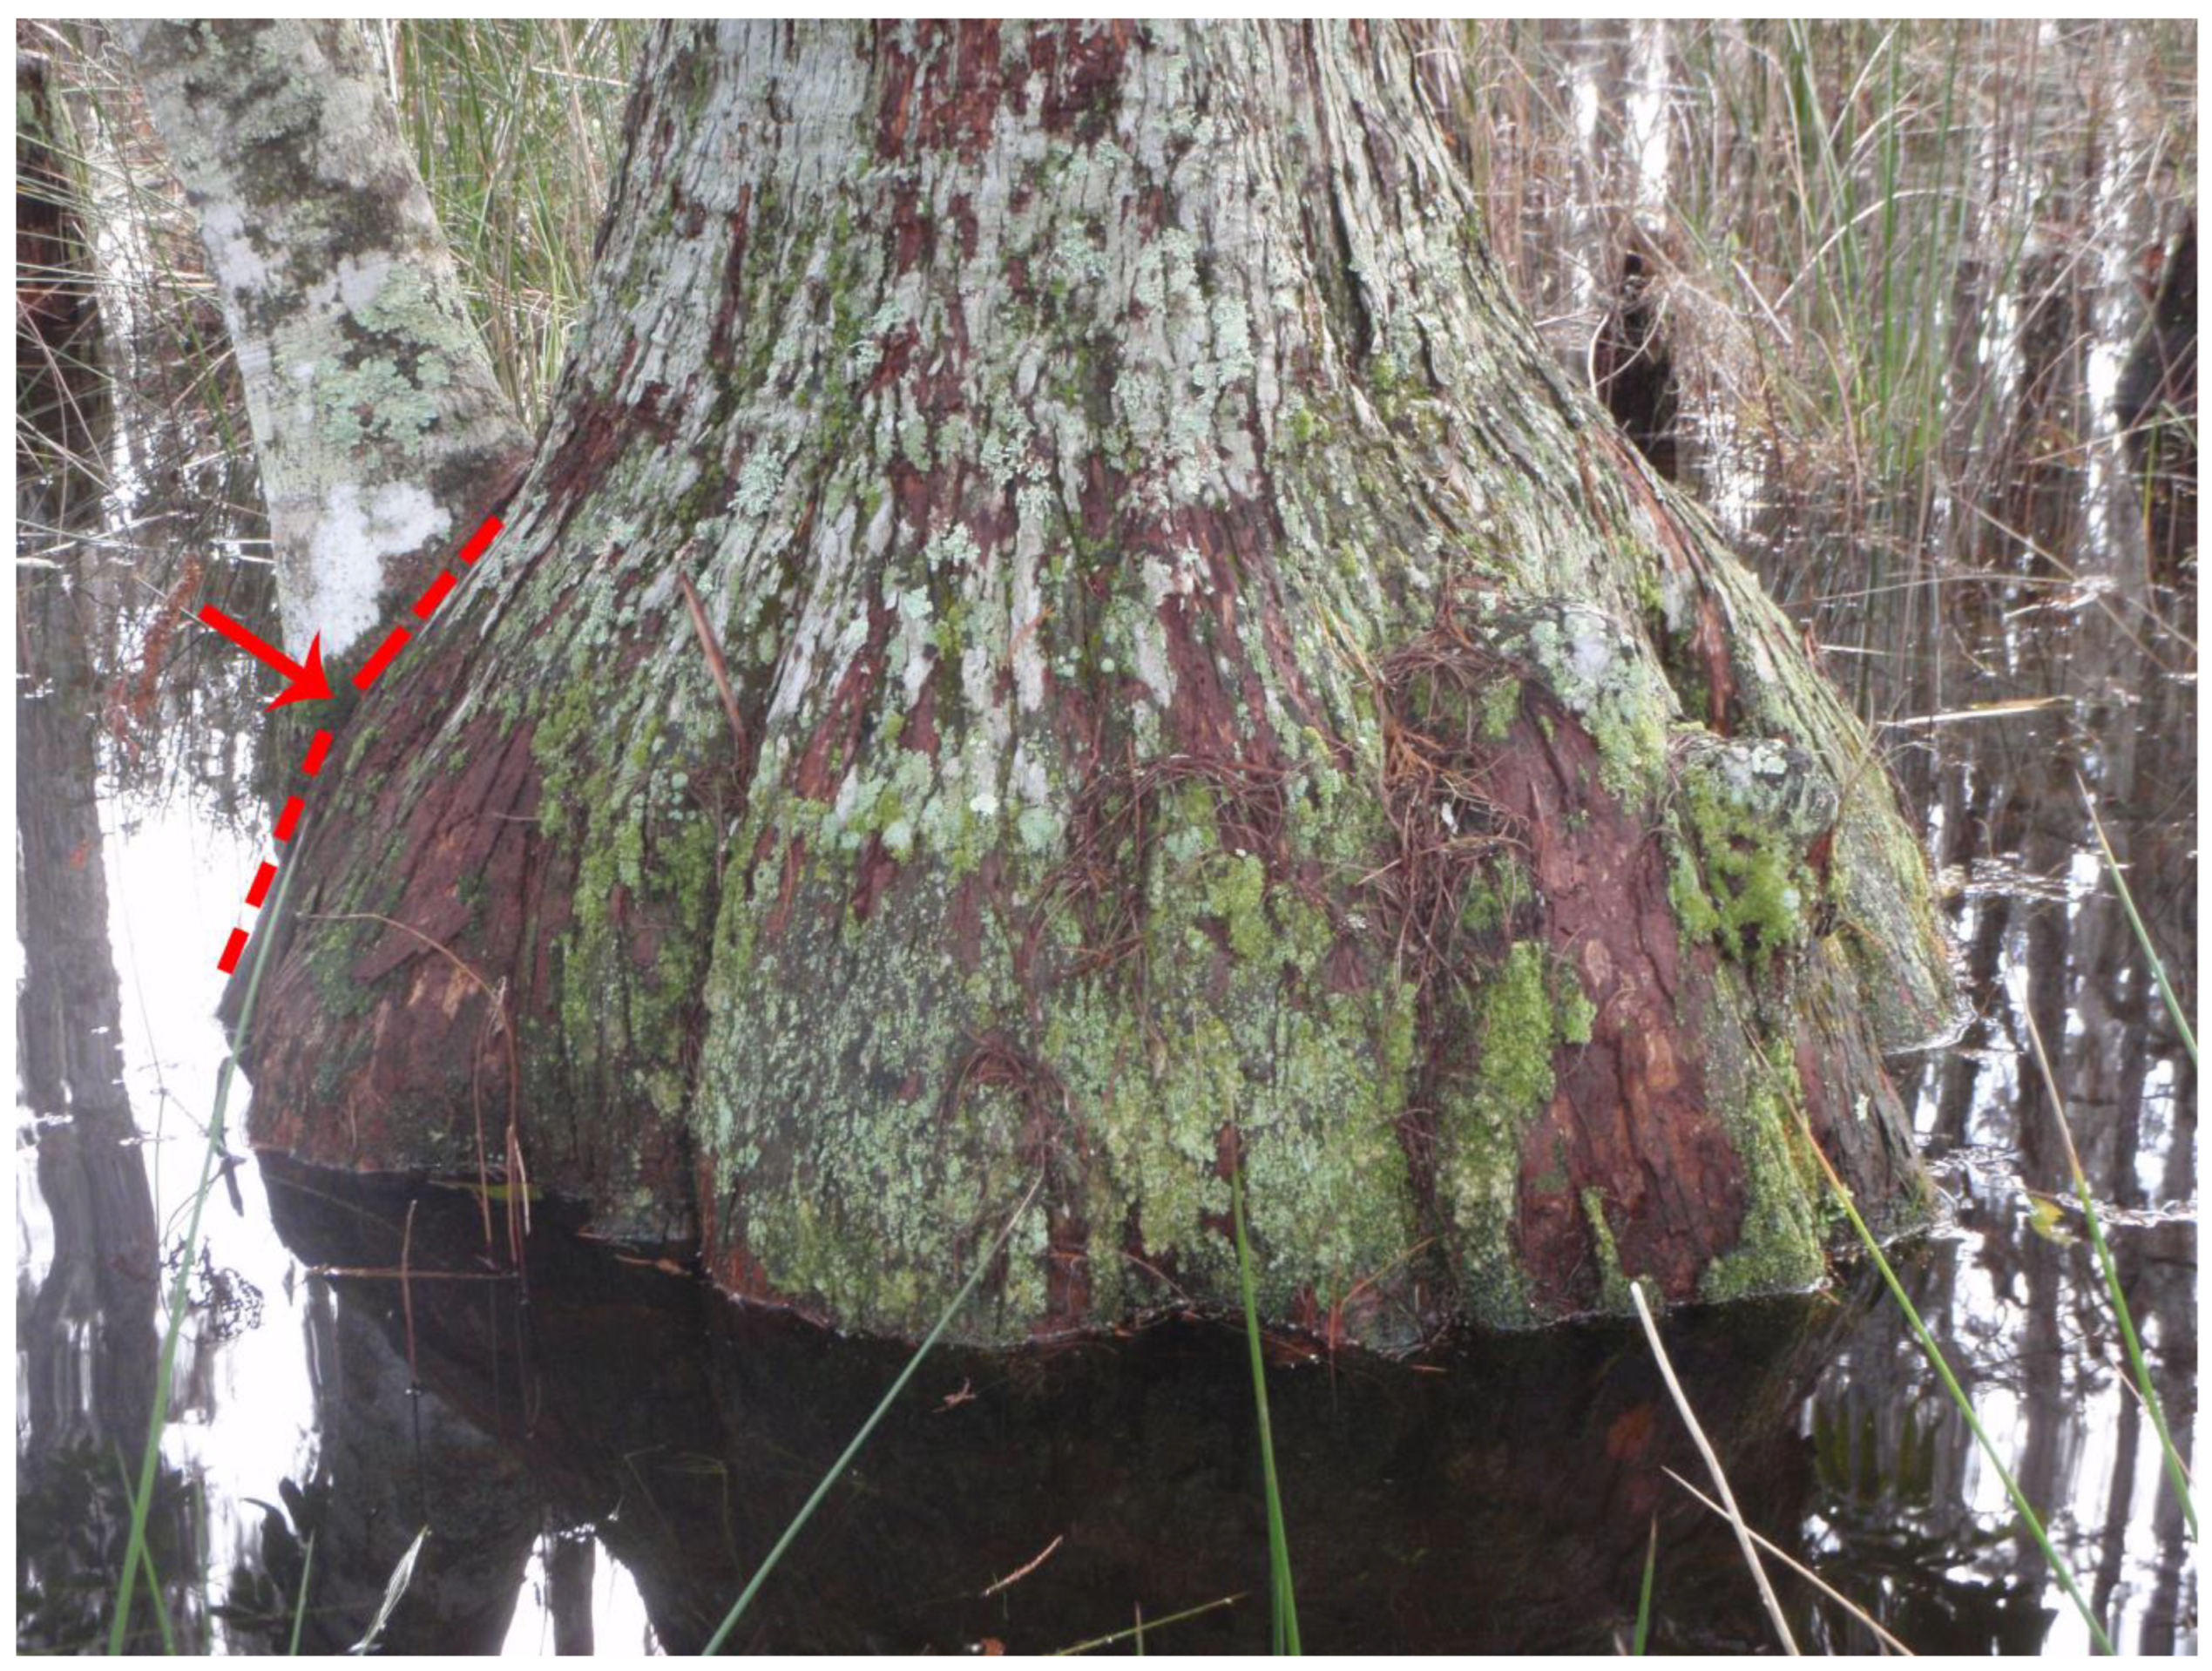
2.1. Lake Charles Buttress Inflections

NP elevations and DBH were measured at Lake Charles cypress trees on 7 June 2019 by SWFWMD environmental scientists. The assessed trees were located on the northern side of the lake, with one group in a large lake-fringing wetland and another group along the lake shoreline (general location shown in Figure 2). NP was only assessed for trees with clear buttress inflection points and at trees which could be accessed (e.g., not behind fencing). For trees inundated at the time of data collection, buttress inflection elevations were calculated as feet above water level based on a permanent staff gage. For trees not inundated at the time of data collection, standard surveying equipment and techniques were used to assess the inflection’s elevation with respect to the staff gage datum. NP and DBH were measured at 15 trees, including 8 in the lakeshore group and 7 in the wetland group (Figure 4). While buttress inflection elevations were also collected by SWFWMD staff in 2004, 2017, 2018, and various dates in 2019, DBH was not measured during these events.
During field visits, no evidence was found of substantial soil subsidence that could alter NP elevations at measured trees. Survey error was excluded by multiple site visits and by cross-checking the lake’s two staff gages (a discontinued gage remains in the lake); both gages displayed the same water level reading after applying the appropriate vertical datum shift. Observed and modeled historic water level records for Lake Charles were obtained from SWFWMD [33] (Figure 3). Data from 1946 to 2018 were analyzed based on the time period available for the historic model [33]. Post-2010 observed and historic data showed moderate correlation (R2 = 0.41, p < 0.1). These overlapping data were used to hindcast daily water levels that represent modern structural, withdrawal, and augmentation conditions at the lake.

2.2. Cypress Age–DBH Relationships

In order to develop an age–DBH relationship for cypress that could be applied to Lake Charles, a two-pronged approach was employed. First, data from the U.S. Department of Agriculture’s Forest Inventory and Analysis (FIA) were assessed. Second, age and DBH values for cypress trees were obtained from the literature. The FIA data include enough data to limit the analysis to T. ascendens within Florida. However, FIA data lack ages for individual cypress trees, requiring inference of tree age from stand ages. Data from the literature represent better estimates of ages for individual trees and cover a wider range of ages. However, data from the literature are more limited in number and include a mix of cypress species and geographies.
FIA data [69,70,71] have been used in various studies to develop age–DBH relationships [72,73,74]. Although “site tree” data are preferred due to higher quality tree-specific data, no cypress trees within the southeastern United States were site trees or had tree-specific ages in the FIA dataset. Therefore, plot stand age and mean DBH were used, following rationale similar to Odom and Ford [73]. In the FIA dataset, stand age reflects the average establishment time of non-overtopped trees and is determined using coring or time since the previous survey [70]. Data were obtained for Florida baldcypress/pondcypress plots containing over 50% T. ascendens by both count and basal area. Only living T. ascendens trees with a crown class of codominant or higher were assessed. Age and DBH were determined for 613 plots by averaging cypress DBH within each plot. Repeated measurements at the same plot (i.e., different inventory years) were retained as separate entries. Additionally, elevation [75], annual climate normals [75], depth to groundwater [76], groundwater recharge [77], and soils characteristics [78] were spatially joined to plot data for exploratory data analyses. Squared and cubed DBH were also evaluated. FIA coordinate accuracy is typically within about 1 km, and up to a fifth of private land plot locations may be swapped with similar plots [70].
The literature search identified various studies reporting values for cypress age and DBH (Table 1). Tree aging techniques in these studies include dendrochronology and year of stand initiation (e.g., year of planting or clearcutting). Most studies report central tendencies and ranges for samples of trees. Values are frequently aggregated by a treatment method or different wetland sites, although some studies report values for individual trees. Treatment and site groupings were retained as separate values. For data reported as medians and ranges, median age and DBH were paired, and range extremes were similarly paired. Due to limited data availability, values were compiled for both T. ascendens and T. distichum; some taxonomists consider these separate species, while others classify T. ascendens as a variety [17]. Growth rates and bark thickness between the two can differ, although this could relate to the differing environmental conditions that typify their occurrence [7,8,67]. Studies located outside of the cypress’ natural range were not included. Individual regressions were developed for studies with appropriate age data, excluding Rodgers et al. [45] and Degravelles [68], which already provided regressions.
The data compiled from the literature include better estimates of tree ages and are useful for understanding the variability of cypress tree growth, particularly for older trees. However, the studies include a mix of species, geographies, sample sizes, and methodologies. For estimates of Lake Charles tree ages, the FIA data cover the needed range of ages and DBH values and are more representative of relevant conditions. Therefore, FIA data were analyzed using simple linear regression (Figure 5). Linear regression, which performed comparably to more complex models, has previously been implemented in FIA-based age–DBH analyses, e.g., [73]. To assess model robustness, a 10-fold cross-validation was performed. The final model was compared to values from the literature (Figure 6).

3. Results

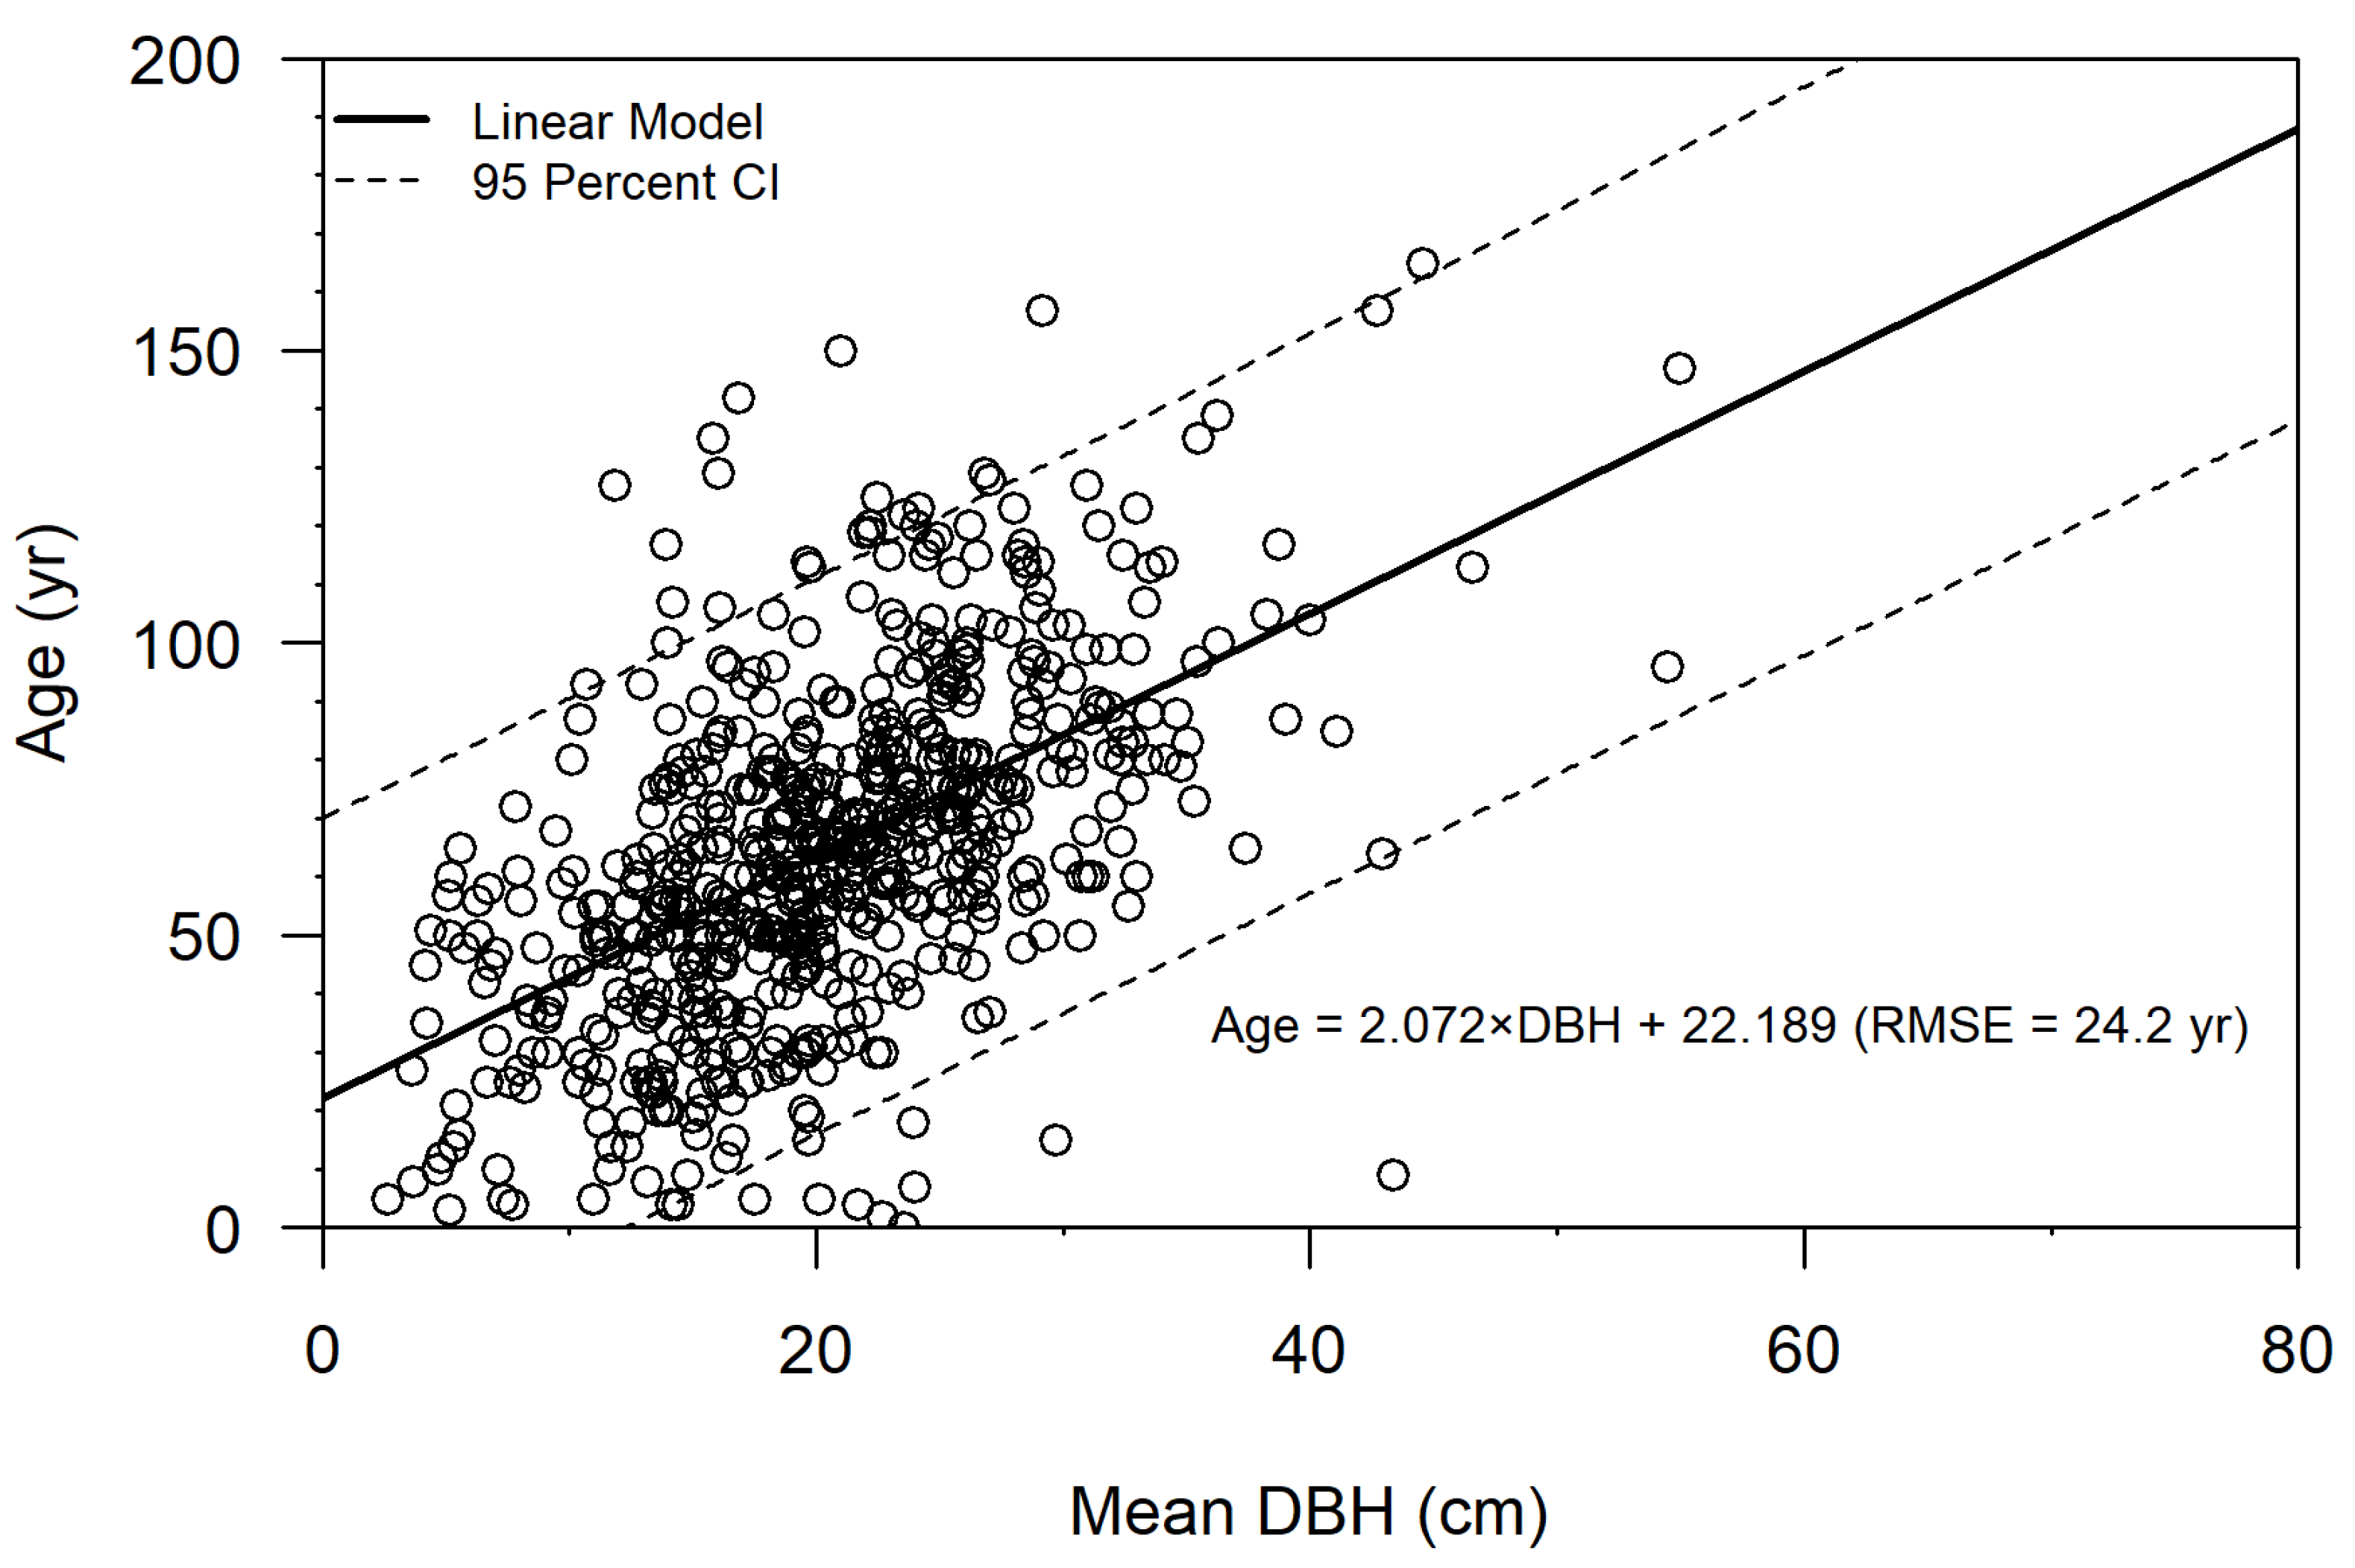
3.1. Cypress Age–DBH Relationships
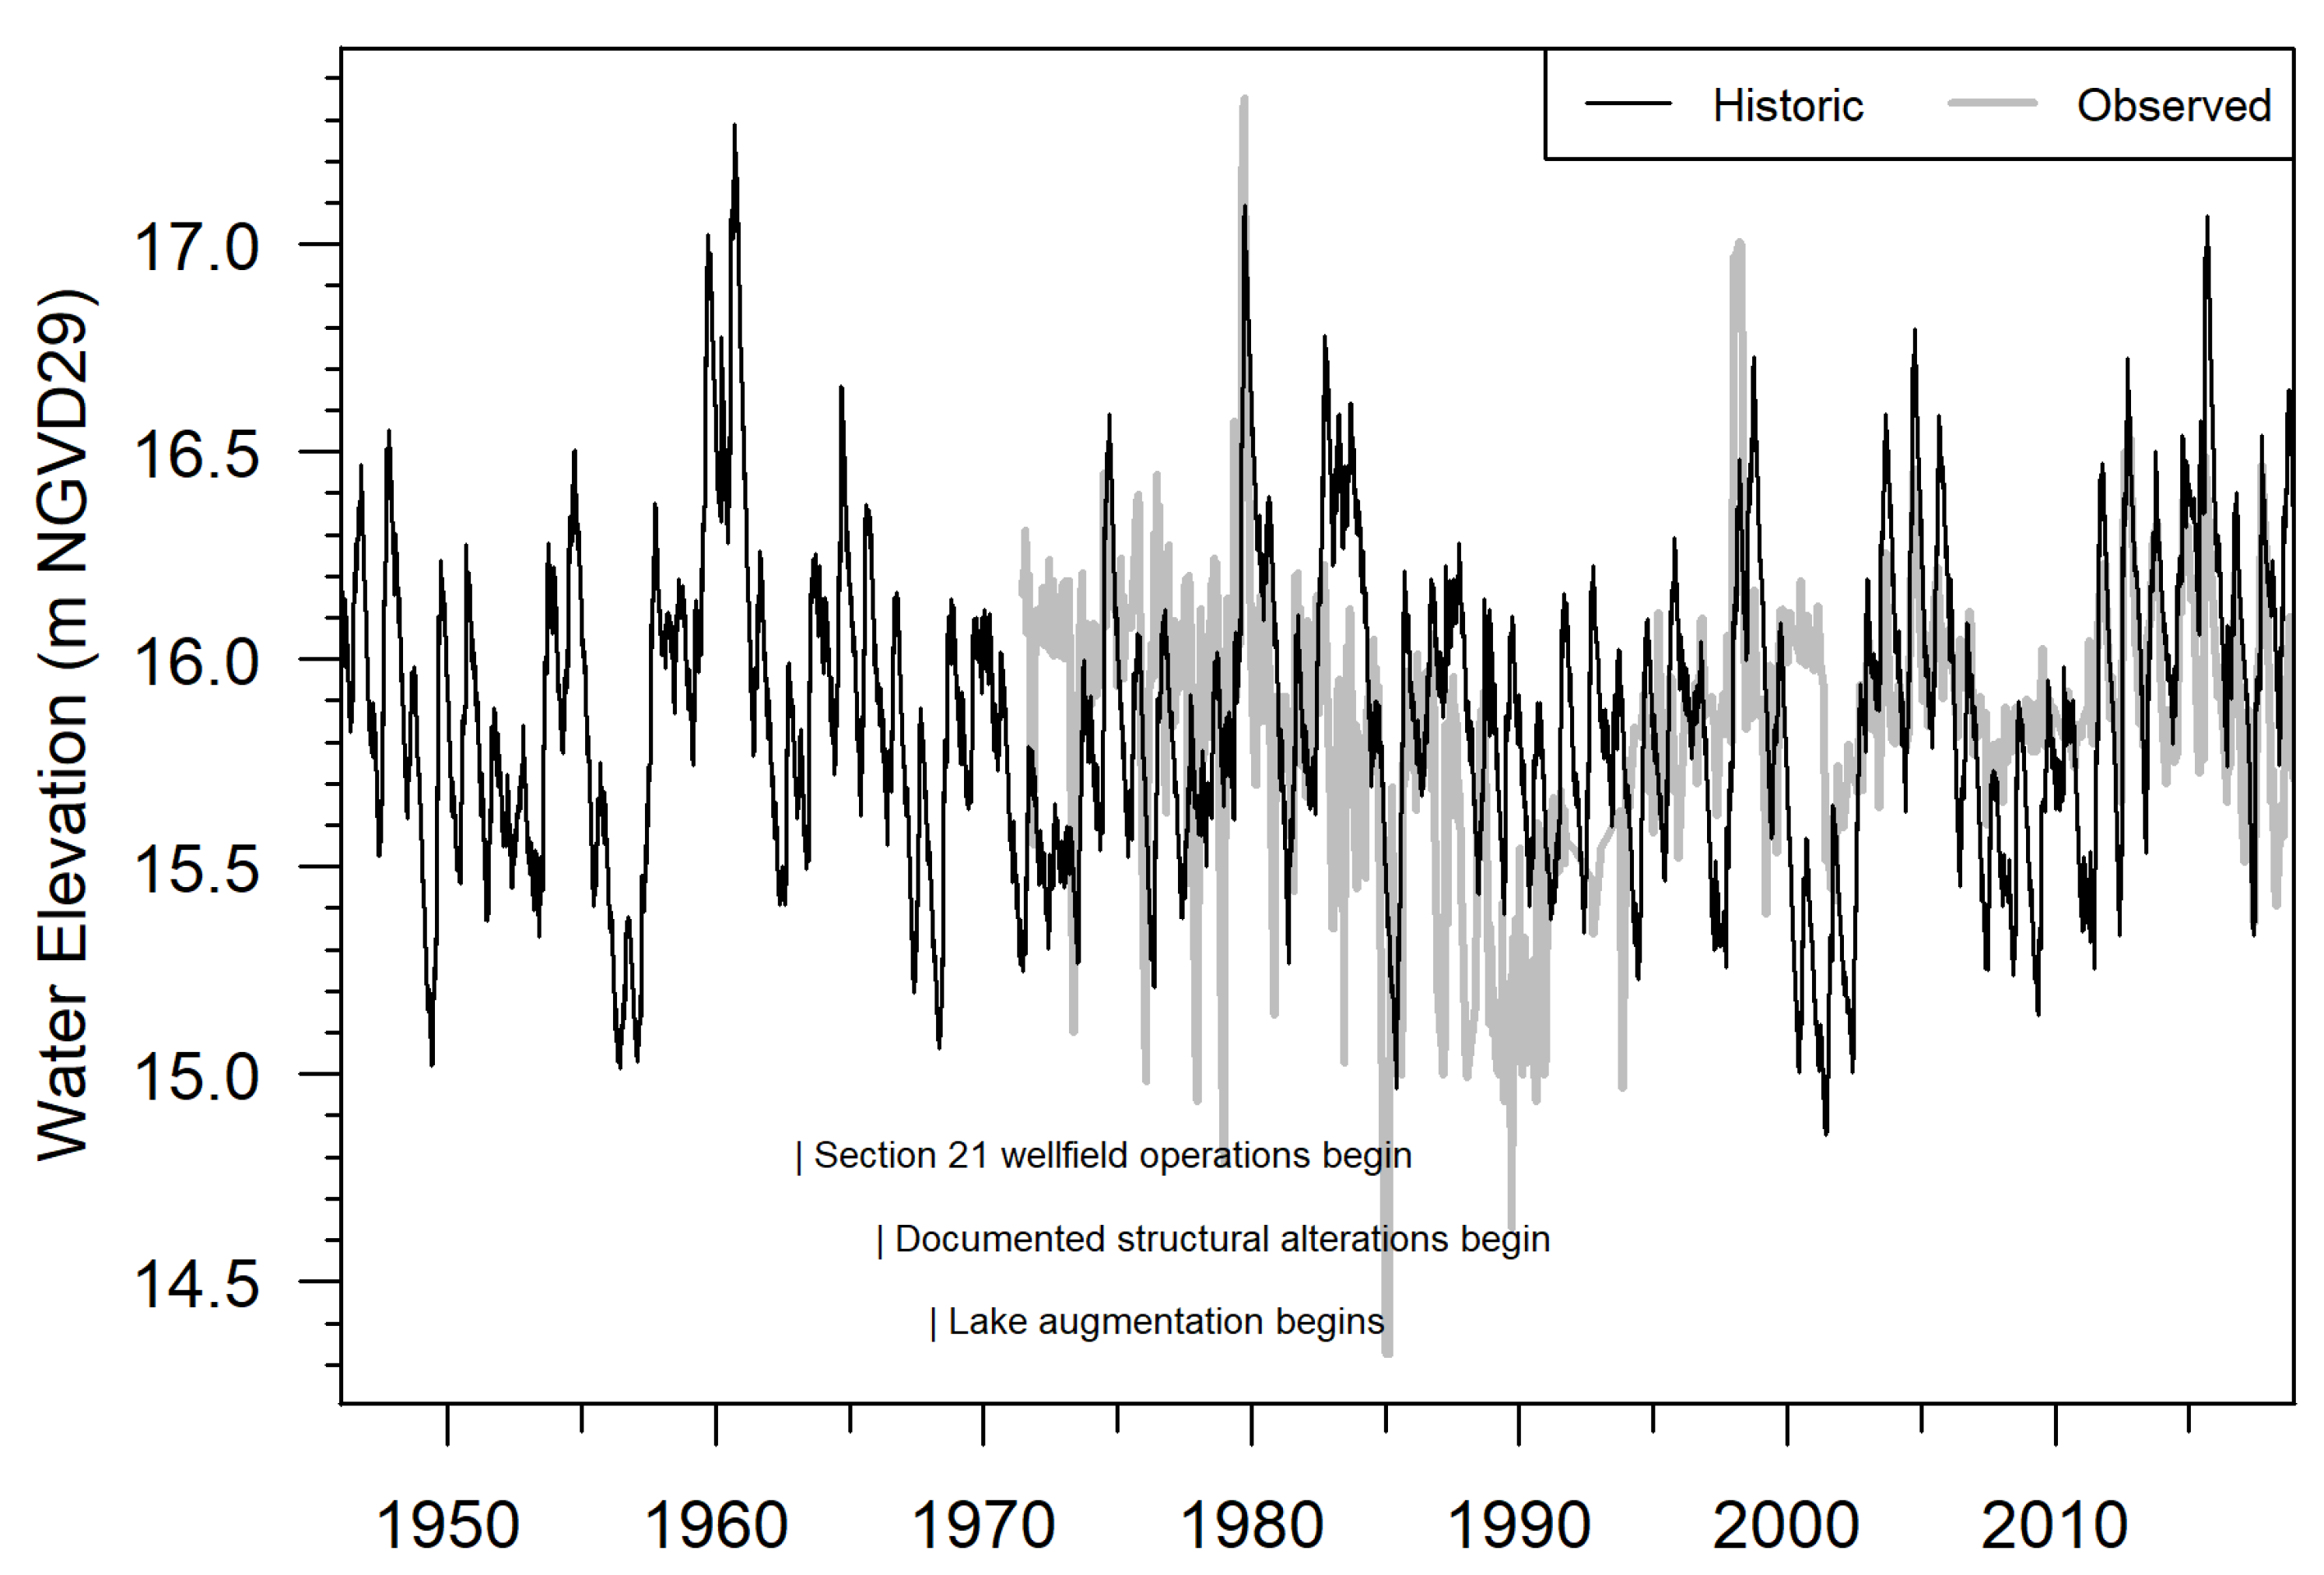
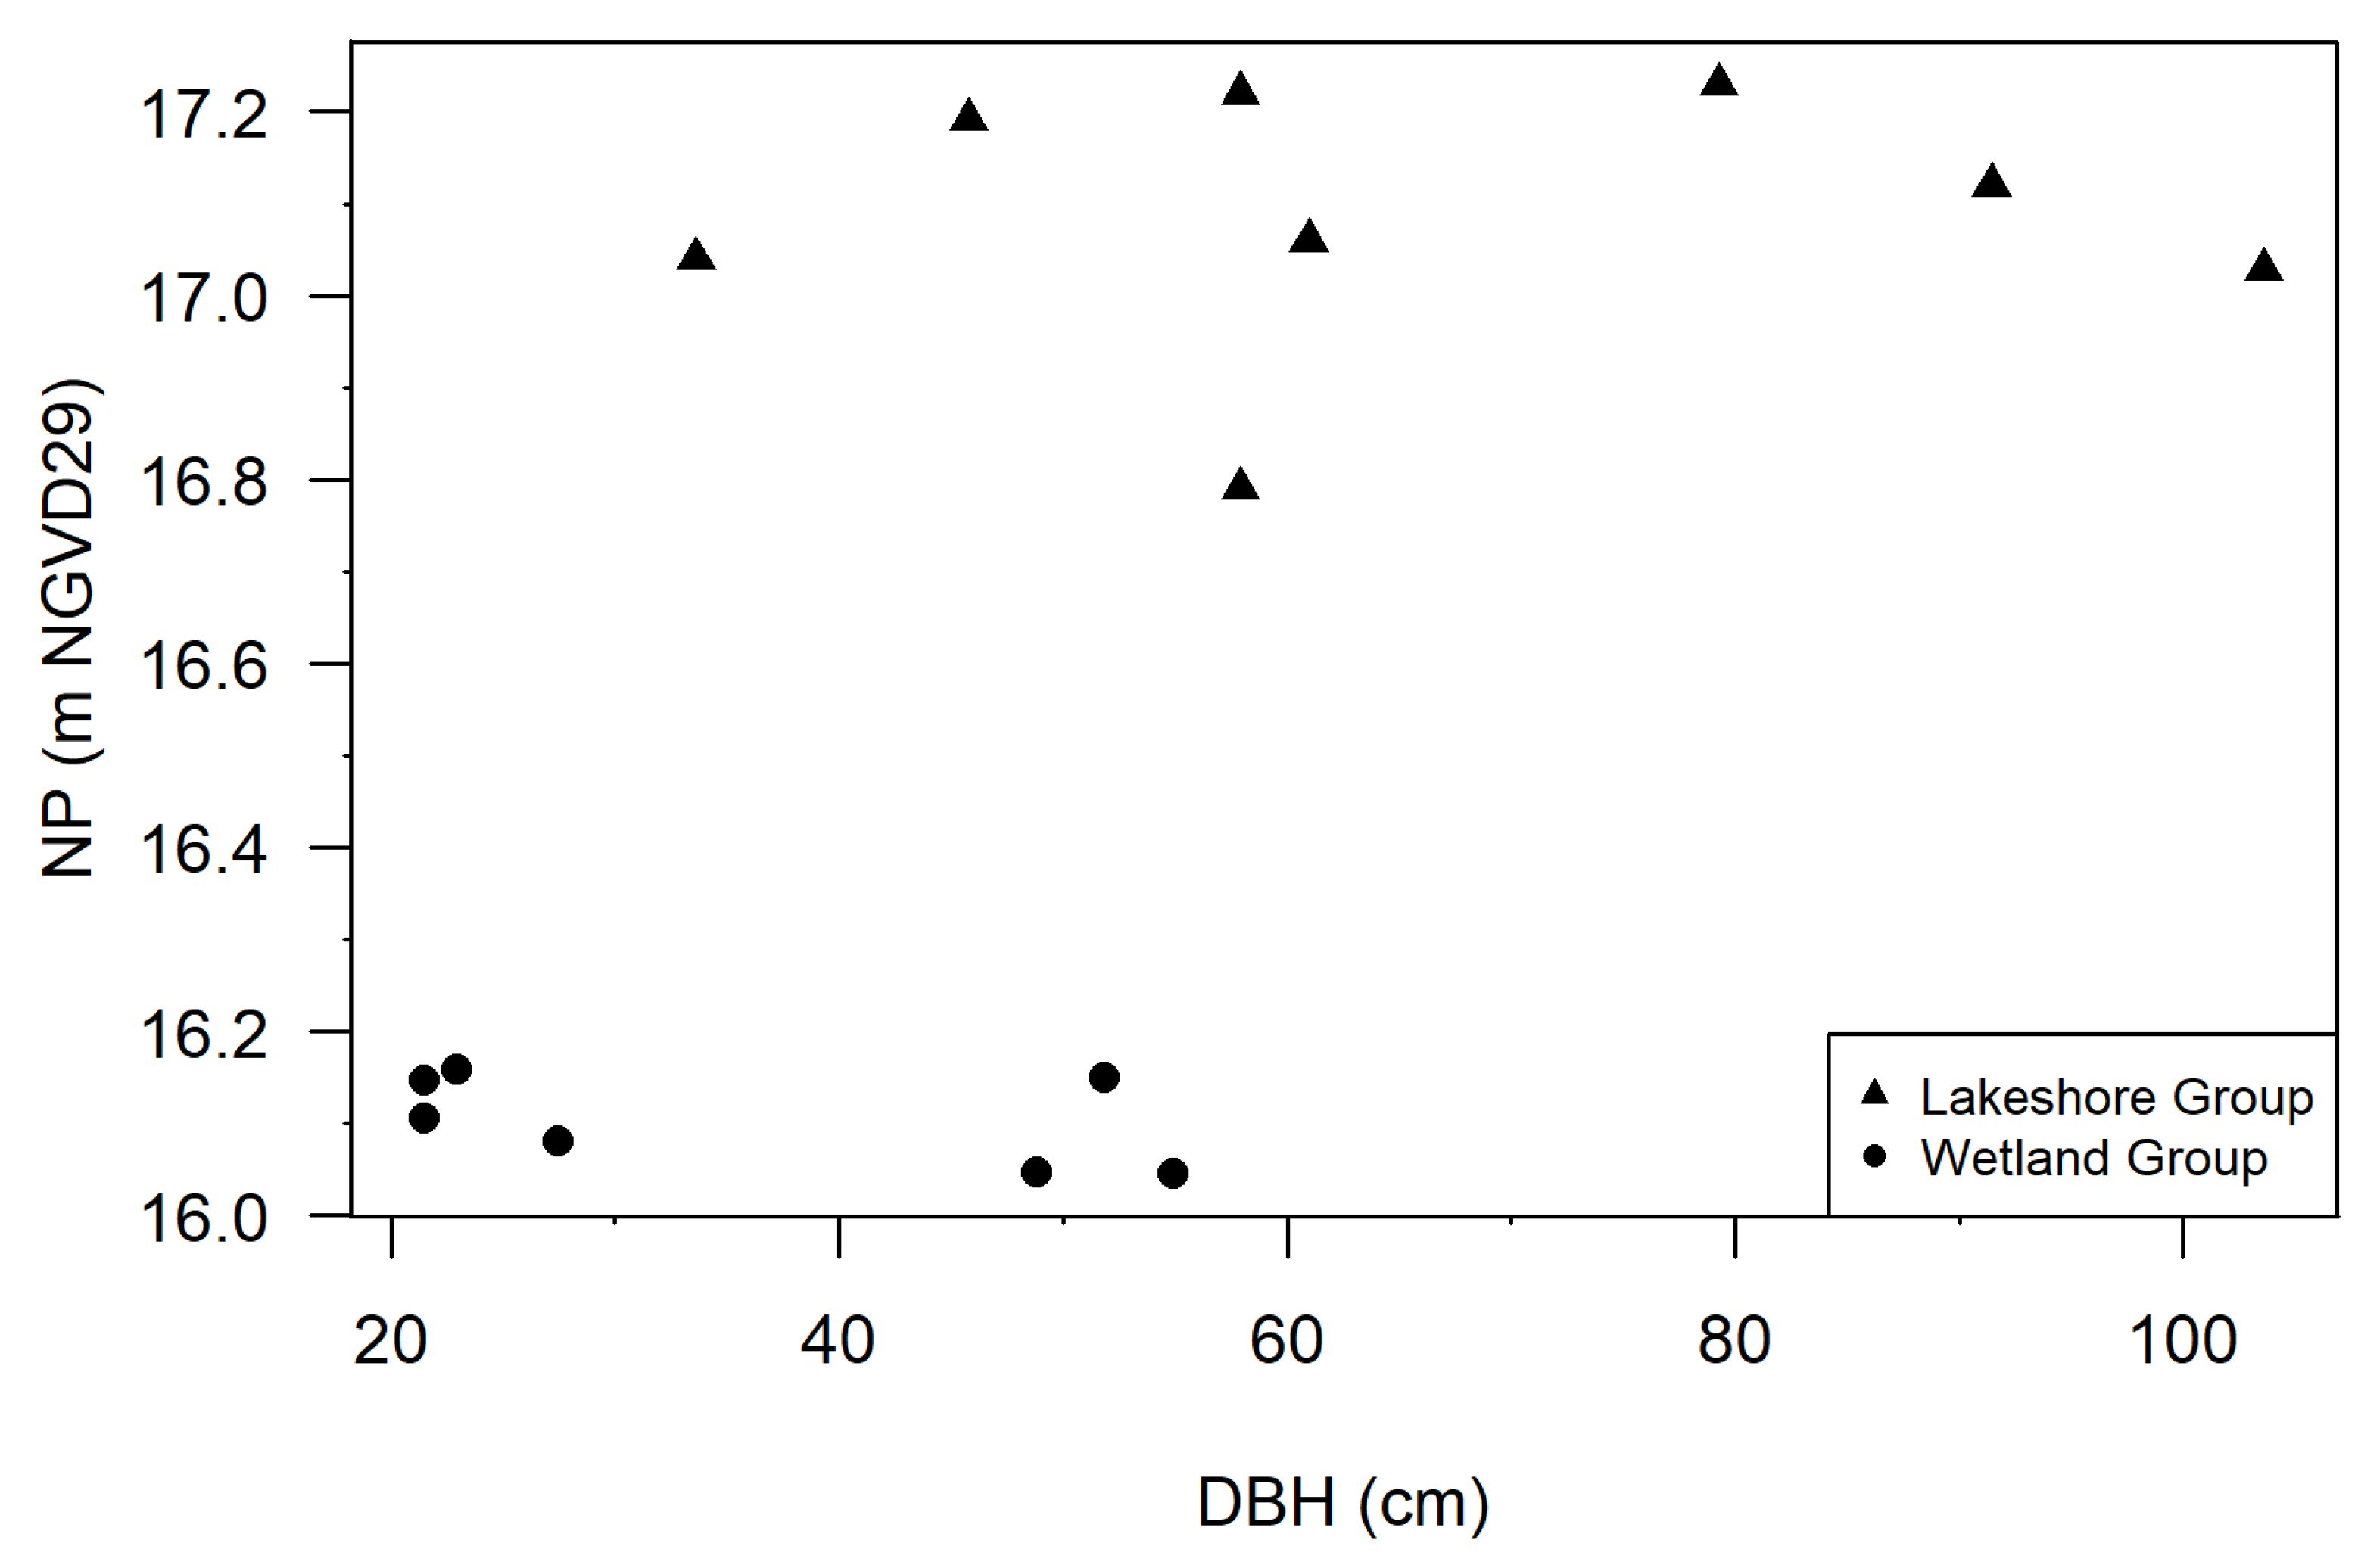
DBH explained 30% of the variability in estimated T. ascendens tree age using the FIA dataset (Figure 5). The linear model to predict cypress tree age is as follows:
A = 2.072 × D + 22.189,
where A is age in years and D is DBH in cm. The model’s root mean square error (RMSE) was 24.2 years. The regression fell within values from the literature (Figure 6). Cross-validation yielded similar results for slope (range 1.985–2.171, mean 2.072), intercept (range 20.546–24.071, mean 22.203), and RMSE (range 20.0–27.5, mean 24.1 years).
From exploratory data analyses, only annual precipitation offered notable improvement to age prediction in multiple linear regression. DBH and precipitation together explained 37% of variability in tree age, with an RMSE of 22.9 years.

3.2. Lake Charles

For the lakeshore group, the mean NP and DBH were 17.1 m and 66.3 cm, respectively. The mean NP elevation corresponded to the >99th exceedance percentiles of modeled historic, modeled current, and observed water levels.
For the northern wetland group, mean NP and DBH were 16.1 m and 35.5 cm, respectively. The mean NP elevation corresponded to the 76th exceedance percentile of modeled historic water levels, the 93rd exceedance percentile of modeled modern water levels, and the 87th exceedance percentile of observed water levels.
Applying the age–DBH model to Lake Charles, the estimated tree ages were 160 ± 48 years for the lakeshore group and 96 ± 48 years for the wetland group. This indicated an age difference of 64 years between the two groups.

4. Discussion

4.1. Cypress Age–DBH Relationships

The age–DBH relationship developed for T. ascendens in this work compares favorably with values from the literature (Figure 6). The variance explained (30%) is consistent with the range (15–63%) reported in prior FIA-based studies [72,73]. Cross-validation confirmed the model’s generalizability across the dataset. However, the RMSE is approximately twice as high as the values achieved by Odom and Ford [73], who were able to use site tree data for their regressions. The considerable scatter observed in the age–DBH relationship for T. ascendens reflects multiple sources of variability. These include natural variance in cypress growth, measurement error, and methodological error associated with inferring tree age from stand age. While the error achieved is acceptable for larger scale studies, it is suboptimal for application to individual trees or sites. Despite the relatively wide confidence interval, the model remains valuable for providing estimates of the maximum potential age of NP indicators observed on groups of cypress trees and for determining relative age differences between tree populations.
Site-specific hydrologic regimes likely strongly influence tree growth rates across wetlands. When environmental variables were incorporated into the model, annual precipitation somewhat improved age prediction (reducing RMSE by 1.3 years). This finding aligns with Rodgers et al. [45], who found good fits for site-specific regressions but considerably different slopes between sites, suggesting that tree growth variations are higher among wetlands than within wetlands. Supplementing DBH with variables about site conditions, such as typical annual inundation or crowding, e.g., [44,46,99], could improve tree age predictions, which should be explored in future work. However, as models become more complex, their accessibility to wetland managers may be reduced, requiring a balance between accuracy and ease-of-use. For the FIA data, the limited spatial resolution and location fuzzing challenge the integration of local site conditions. This could also explain why national-scale climate and soil products offered limited improvement to the age–DBH model, although some assessed variables were too similar among sites to offer predictive value. Therefore, studies conducted in cypress wetlands with documented tree ages and water level histories would provide clearer insights into how wetland hydrology influences age–DBH relationships. However, there is a scarcity of wetlands with both water level and tree age data. Cypress wetland morphology (e.g., depth) can estimate some aspects of hydrology [15,26,100,101], but digital model elevation data resolution and accuracy can sometimes be constraining. While the age–DBH model offers a valuable starting point for estimating cypress tree ages across Florida, for sensitive applications requiring narrower estimates, wetland managers will need to develop site-specific relationships.
While this study focuses primarily on age and DBH as predictors of buttress inflection development, various factors may influence buttress morphology. The mechanisms and timing of NP formation remain poorly understood. Research examining the physiological mechanisms of buttress inflection development would significantly advance the understanding of these valuable hydrological indicators. To help determine timelines and controlling factors for NP development, studies are needed to monitor young cypress trees for the appearance of NP, using multiple wetlands with differing hydrologic conditions. Additionally, post-development factors, such as soil subsidence, can alter NP indicator elevations. Thus, tree age can only estimate the maximum potential age of a hydrologic indicator. A better understanding of NP development would support more precise temporal constraints for hydropatterns reconstructed from these indicators.

4.2. Lake Charles

For Lake Charles, the age–DBH model predicted that the higher-NP lakeshore cypress trees are about 60 years older than lower-NP northern wetland trees. To the best of our knowledge, this work represents one of the first documented instances where a waterbody had differing NP populations in the absence of soil subsidence. For the smaller, younger trees, the mean NP elevation matched upper decile modern water levels. For the larger, older trees, the mean NP elevation matched upper decile historic water levels. Older, higher-NP trees are located in areas not experiencing cypress tree recruitment due to mowing and infrequent inundation; these trees likely reflect the lake’s historic hydrologic conditions. Conversely, in the northern wetland area, inundation occurs regularly, and vegetation is not managed; this allows the recruitment of trees under the lake’s modern hydrologic regime. Thus, two populations of NP could exist at Lake Charles, reflecting the long-term water level conditions prevalent during buttress inflection development.
However, based on the timeline of hydrologic changes at Lake Charles, the predicted tree ages may be too high. Aerial imagery of Lake Charles from 1938 to the present [33] shows the consistent presence of cypress trees in the northern wetland and lake perimeter. This suggests that widescale logging has not affected these trees since at least 1938, making tree ages in excess of 80 years plausible. However, as wellfield and structural alterations began in the 1960s, trees reflecting modern hydrologic conditions are expected to be younger than 60 years—assuming that NP inflection morphology develops relatively early in a tree’s life and cannot change over time. As previously discussed, little is known about the time required for buttress inflections to appear, and while there is no evidence of buttress inflections changing at individual trees, this merits further exploration. Anecdotally, older NP indicators tend to be weaker at hydrologically altered wetlands where water levels do not reach NP at typical near-annual frequencies. Indeed, at Lake Charles, inflections on larger, older trees were subjectively observed to be less distinct.
Alternatively, as the 95 percent confidence intervals overlap for the two tree groups at Lake Charles, actual age differences may be negligible. DBH differences could reflect differing environmental conditions experienced by the groups. Cypress trees can survive a total lack of inundation once established, but higher submergence has been associated with decreased cypress tree growth [57,58,61]. The wetland group is frequently inundated and experiences greater crowding, which could decrease growth rates. Conversely, the lakeshore group is rarely inundated and experiences little crowding. However, while growth differences can explain divergent DBH assuming similar age, they do not explain the differences in NP. While the authors’ opinion is that the two groups of trees represent distinct age cohorts, additional work is needed to develop more accurate age estimates for Lake Charles.
Ultimately, due to the differing buttress inflection elevation groups at Lake Charles, hydrologic modeling of the lake was used in lieu of NP indicators to estimate long-term historic water levels for minimum levels development [33]. Thus, the case of Lake Charles shows the value of implementing a multipronged approach to regulatory decision-making. Hydrologic indicators, water level data, lake history, modeling techniques, and other information were all leveraged to develop minimum levels for the lake [33].

5. Conclusions

Cypress buttress inflections are a useful indicator of high water levels in many cypress wetlands. These NP indicators often predate major hydrologic impacts; even at impacted wetlands, typical wetland morphology and heavy precipitation can sometimes support the near-normal achievement of NP despite depressed lower water levels [16,17]. To constrain the maximum potential age of hydrologic indicators in groups of cypress trees, an age–DBH model was developed for T. ascendens. The model was applied to a waterbody with differing populations of cypress-derived NP elevations and a complex history of hydrologic alterations, suggesting two age cohorts of trees representing differing hydrologic conditions. The work underscores the need to consider indicator development timelines when interpreting the hydrologic meaning of indicator elevations. Future studies should explore cypress buttress inflection development and refine age–DBH relationships for T. ascendens in varying environmental conditions. Forested wetland managers can benefit from accessible methods to predict cypress tree age, which can be used to estimate timelines for hydrologic indicators. Leveraging multiple lines of evidence to support regulatory decision-making can minimize the impacts of uncertainty present within individual data and methods.

Author Contributions

Conceptualization, C.R.C. and T.J.V.; methodology, C.R.C.; investigation, T.J.V.; formal analysis, C.R.C.; writing—original draft preparation, C.R.C.; writing—review and editing, T.J.V. All authors have read and agreed to the published version of the manuscript.

Funding

This research received no external funding.

Data Availability Statement

Observed lake water level data are available for download from SWFWMD’s Environmental Data Portal (https://www.swfwmd.state.fl.us/resources/data-maps/environmental-data-portal, accessed on 15 February 2025). Modeled historic lake water level and normal pool elevation data are available upon reasonable request from the authors or SWFWMD (https://www.swfwmd.state.fl.us, accessed on 15 February 2025). FIA data are available from the U.S. Forest Service’s FIA DataMart (https://research.fs.usda.gov/products/dataandtools/tools/fia-datamart, accessed on 15 February 2025).

Acknowledgments

The authors thank SWFWMD staff for assisting with data collection and for discussions about NP at Lake Charles.

Conflicts of Interest

Author Cortney Cameron is the sole owner and employee of SouthEco, LLC. The SouthEco, LLC company had no role in the design of the study; in the collection, analyses, or interpretation of data; in the writing of the manuscript, or in the decision to publish the results.

Abbreviations

The following abbreviations are used in this manuscript:
ALAlabama
cmcentimeters
DBHDiameter at breast height
FIAForest Inventory and Analysis
FLFlorida
KYKentucky
LALouisiana
mmeters
MDMaryland
MSMississippi
NCNorth Carolina
NGVD29National Geodetic Vertical Datum of 1929
NPNormal pool
pProbability value
R2Coefficient of determination
RMSERoot mean square error
SWFWMDSouthwest Florida Water Management District
T.Taxodium
T. asc.Taxodium ascendens
T. dis.Taxodium distichum
TNTennessee
USUnited States
VAVirginia

References

  1. Carr, D.W.; Leeper, D.A.; Rochow, T.F. Comparison of Six Biologic Indicators of Hydrology and the Landward Extent of Hydric Soils in West-Central Florida, USA Cypress Domes. Wetlands 2006, 26, 1012–1019. [Google Scholar] [CrossRef]
  2. Patterson, L.; Cooper, D.J. The Use of Hydrologic and Ecological Indicators for the Restoration of Drainage Ditches and Water Diversions in a Mountain Fen, Cascade Range, California. Wetlands 2007, 27, 290–304. [Google Scholar] [CrossRef]
  3. David, G.C.L.; Hamill, D. Is the Ordinary High Water Mark Ordinarily at Bankfull? Applying a Weight-of-evidence Approach to Stream Delineation. J. Am. Water Resour. Assoc. 2024, 60, 1029–1057. [Google Scholar] [CrossRef]
  4. Berkowitz, J.F.; Pietroski, J.P. Water-Stained Leaves: Formation and Application as a Field Indicator of Wetland Hydrology. Wetlands 2021, 41, 98. [Google Scholar] [CrossRef]
  5. U.S. Army Corps of Engineers. Regional Supplement to the Corps of Engineers Wetland Delineation Manual: Atlantic and Gulf Coastal Plain Region (Version 2.0); U.S. Army Corps of Engineers: Washington, DC, USA, 2010. [Google Scholar]
  6. Mattoon, W.R. The Southern Cypress; Bulletin/United States Department of Agriculture; no. 272; U.S. Department of Agriculture: Washington, DC, USA, 1915. [Google Scholar]
  7. Burns, R.M.; Honkala, B.H. Silvics of North America: Volume 1. Conifers; Agriculture Handbook 654; United States Department of Agriculture (USDA), Forest Service: Washington, DC, USA, 1990. [Google Scholar]
  8. Ewel, K.C. Pondcypress Swamps. In Southern Forested Wetlands: Ecology and Management; Messina, M.G., Conner, W.H., Eds.; Routledge: London, UK, 1998; ISBN 9780429342653. [Google Scholar]
  9. Hull, H.C., Jr.; Post, J.M., Jr.; Lopez, M.; Perry, R.G. Analysis of Water Level Indicators in Wetlands: Implications for the Design of Surface Water Management Systems; American Water Resources Association: Tampa, FL, USA, 1989; pp. 195–204. [Google Scholar]
  10. Southwest Florida Water Management District. Northern Tampa Bay Minimum Flows and Levels White Papers—Establishment of Minimum Levels in Palustrine Cypress Wetlands; Southwest Florida Water Management District: Brooksville, FL, USA, 1999. [Google Scholar]
  11. Southwest Florida Water Management District. Northern Tampa Bay Minimum Flows and Levels White Papers—Establishment of Minimum Levels for Category 1 and 2 Lakes; Southwest Florida Water Management District: Brooksville, FL, USA, 1999. [Google Scholar]
  12. Bedient, P.; Brinson, M.; Dierberg, F.; Gorelick, S.; Jenkins, K.; Ross, D.; Wagner, K.; Stephenson, D. Report of the Scientific Peer Review Panel on the Data, Theories, and Methodologies Supporting the Minimum Flows and Levels Rule for the Northern Tampa Bay Area, Florida; Prepared for the Southwest Florida Water Management District: Brooksville, FL, USA, 1999. [Google Scholar]
  13. Dierberg, F.; Wagner, K. A Review of “A Multiple-Parameter Approach for Establishing Minimum Levels for Category 3 Lakes of the Southwest Florida Water Management District” (June 2001 Draft) by D. Leeper, M. Kelly, A. Munson, and R. Gant; Prepared for the Southwest Florida Water Management District: Brooksville, FL, USA, 2001. [Google Scholar]
  14. Cameron, C.; Leeper, D.; Herrick, G.; Basso, R.; Venning, T.J. Validation of the Cypress Offset and Mesic Wetland Offset for Development of Minimum Wetland and Lake Levels; Southwest Florida Water Management District: Brooksville, FL, USA, 2022. [Google Scholar]
  15. Cameron, C.R.; Hancock, M.C.; Carr, D.W.; Hurst, M.K.; Campbell, D.E.; Venning, T.J.; Tara, P.D.; Holzwart, K.R. Hydroperiods of Cypress Domes in West-Central Florida, USA. Wetlands 2020, 40, 2225–2234. [Google Scholar] [CrossRef]
  16. Basso, R.; LeMond, L.; Leeper, D.; Cameron, C.; Qi, J.; Weinstein, D. Northern Tampa Bay Lake and Wetland Status Assessment; Southwest Florida Water Management District: Brooksville, FL, USA, 2020. [Google Scholar]
  17. Cameron, C.; Shea, C.; Nowicki, R.; Schmutz, D.; LaRoche, J.; Hancock, M. Hydrology of Cypress Domes: A Review. Wetlands Ecol. Manag. 2023, 31, 673–696. [Google Scholar] [CrossRef]
  18. Southwest Florida Water Management District. Tampa Bay Water Wetland Assessment Procedure (WAP) for Isolated Wetlands; Southwest Florida Water Management District: Brooksville, FL, USA, 2005. [Google Scholar]
  19. Haag, K.H.; Lee, T.M.; Herndon, D.C. Bathymetry and Vegetation in Isolated Marsh and Cypress Wetlands in the Northern Tampa Bay Area, 2000–2004; U.S. Geological Survey: Washington, DC, USA, 2005. [Google Scholar]
  20. Clewell, A.F.; Raymond, C.; Coultas, C.L.; Dennis, W.M.; Kelly, J.P. Spatially Narrow Wet Prairies. Castanea 2009, 74, 146–159. [Google Scholar] [CrossRef]
  21. Nilsson, K.A.; Rains, M.C.; Lewis, D.B.; Trout, K.E. Hydrologic Characterization of 56 Geographically Isolated Wetlands in West-Central Florida Using a Probabilistic Method. Wetl. Ecol. Manag. 2013, 21, 1–14. [Google Scholar] [CrossRef]
  22. Lewis, D.B.; Feit, S.J. Connecting Carbon and Nitrogen Storage in Rural Wetland Soil to Groundwater Abstraction for Urban Water Supply. Glob. Change Biol. 2015, 21, 1704–1714. [Google Scholar] [CrossRef]
  23. Bartholomew, M.K.; Anderson, C.J.; Berkowitz, J. Soil Conditions Following Hydrologic Restoration in Cypress Dome Wetlands. Wetlands 2019, 39, 185–196. [Google Scholar] [CrossRef]
  24. Bartholomew, M.K.; Anderson, C.J.; Berkowitz, J.F. Wetland Vegetation Response to Groundwater Pumping and Hydrologic Recovery. Wetlands 2020, 40, 2609–2619. [Google Scholar] [CrossRef]
  25. Powell, K.; Wynn, J.G.; Rains, M.C.; Stewart, M.T.; Emery, S. Soil Indicators of Hydrologic Health and Resilience in Cypress Domes of West-Central Florida. Ecol. Indic. 2019, 97, 269–279. [Google Scholar] [CrossRef]
  26. Alshehri, F.; Ross, M. Calibrating Complexity: A Comprehensive Approach to Developing Stage–Storage–Discharge Relationships for Geographically Isolated Wetlands (GIWs) in W-C Florida. Water 2023, 15, 3878. [Google Scholar] [CrossRef]
  27. Balerna, J.A.; Kramer, A.M.; Landry, S.M.; Rains, M.C.; Lewis, D.B. Wetland Hydrological Change and Recovery across Three Decades of Shifting Groundwater Management. J. Hydrol. 2024, 644, 132052. [Google Scholar] [CrossRef]
  28. Balerna, J.A.; Kramer, A.M.; Landry, S.M.; Rains, M.C.; Lewis, D.B. Synergistic Effects of Precipitation and Groundwater Extraction on Freshwater Wetland Inundation. J. Environ. Manag. 2023, 337, 117690. [Google Scholar] [CrossRef]
  29. Hogg, W.; Hayes, E.; Keesecker, D.; Kiehn, W.; Shea, C. Tampa Bay Water Recovery Assessment: Final Report of Findings; Tampa Bay Water: Clearwater, FL, USA, 2020. [Google Scholar]
  30. Kurz, H.; Demaree, D. Cypress Buttresses and Knees in Relation to Water and Air. Ecology 1934, 15, 36–41. [Google Scholar] [CrossRef]
  31. Varnell, L.M. The Relationship between Inundation History and Baldcypress Stem Form in a Virginia Floodplain Swamp. Wetlands 1998, 18, 176–183. [Google Scholar] [CrossRef]
  32. Walsh, C.; Dawson, J. Variation in Buttressing Form and Stem Volume Ratio of Baldcypress Trees. Trans. Ill. State Acad. Sci. 2014, 107, 5–11. [Google Scholar]
  33. Venning, T.J.; Cameron, C. Revised Minimum and Guidance Levels Based on Reevaluation of Levels Adopted for Lake Charles in Hillsborough County, Florida; Southwest Florida Water Management District: Brooksville, FL, USA, 2020. [Google Scholar]
  34. McCarthy, J.; Weetman, G. Age and Size Structure of Gap-Dynamic, Old-Growth Boreal Forest Stands in Newfoundland. Silva Fenn. 2006, 40, 209–230. [Google Scholar] [CrossRef]
  35. Hart, P.J. Tree Growth and Age in an Ancient Hawaiian Wet Forest: Vegetation Dynamics at Two Spatial Scales. J. Trop. Ecol. 2010, 26, 1–11. [Google Scholar] [CrossRef]
  36. Swetnam, T.L.; Brown, P.M. Comparing Selected Fire Regime Condition Class (FRCC) and LANDFIRE Vegetation Model Results with Tree-Ring Data. Int. J. Wildland Fire 2010, 19, 1–13. [Google Scholar] [CrossRef]
  37. Stevens, J.T.; Safford, H.D.; North, M.P.; Fried, J.S.; Gray, A.N.; Brown, P.M.; Dolanc, C.R.; Dobrowski, S.Z.; Falk, D.A.; Farris, C.A.; et al. Average Stand Age from Forest Inventory Plots Does Not Describe Historical Fire Regimes in Ponderosa Pine and Mixed-Conifer Forests of Western North America. PLoS ONE 2016, 11, e0147688. [Google Scholar] [CrossRef]
  38. Peper, P.J.; Alzate, C.P.; McNeil, J.W.; Hashemi, J. Allometric Equations for Urban Ash Trees (Fraxinus spp.) in Oakville, Southern Ontario, Canada. Urban For. Urban Green. 2014, 13, 175–183. [Google Scholar] [CrossRef]
  39. Dey, D.C.; Dwyer, J.; Wiedenbeck, J. Relationship between Tree Value, Diameter, and Age in High-Quality Sugar Maple (Acer Saccharum) on the Menominee Reservation, Wisconsin. J. For. 2017, 115, 397–405. [Google Scholar] [CrossRef]
  40. Seo, Y.; Lee, D.; Choi, J. Growth Pattern Analysis of Major Coniferous Tree Species in South Korea. For. Sci. Technol. 2018, 14, 1–6. [Google Scholar] [CrossRef]
  41. Su, R.; Wu, Q.; Yang, Y.; Hu, T. Relationship between Diameter at Breast Height and Tree Age in Populations of a Rare and Endangered Plant, Davidia involucrata. Pol. J. Ecol. 2021, 69, 84–95. [Google Scholar] [CrossRef]
  42. Sánchez-González, M.; Tomé, M.; Montero, G. Modelling Height and Diameter Growth of Dominant Cork Oak Trees in Spain. Ann. For. Sci. 2005, 62, 633–643. [Google Scholar] [CrossRef]
  43. Sharma, M. Modelling Climate Effects on Diameter Growth of Red Pine Trees in Boreal Ontario, Canada. Trees For. People 2021, 4, 100064. [Google Scholar] [CrossRef]
  44. Rohner, B.; Bugmann, H.; Bigler, C. Towards Non-Destructive Estimation of Tree Age. For. Ecol. Manag. 2013, 304, 286–295. [Google Scholar] [CrossRef]
  45. Rodgers, J.A.; Schwikert, S.T.; Shapiro-Wenner, A. Nesting Habitat of Wood Storks in North and Central Florida, USA. Colon. Waterbirds 1996, 19, 1–21. [Google Scholar] [CrossRef]
  46. Matsushita, M.; Takata, K.; Hitsuma, G.; Yagihashi, T.; Noguchi, M.; Shibata, M.; Masaki, T. A Novel Growth Model Evaluating Age–Size Effect on Long-term Trends in Tree Growth. Funct. Ecol. 2015, 29, 1250–1259. [Google Scholar] [CrossRef]
  47. McPherson, E.G.; van Doorn, N.S.; Peper, P.J. Urban Tree Database and Allometric Equations; Gen. Tech. Rep. PSW-GTR-253; U.S. Department of Agriculture, Forest Service, Pacific Southwest Research Station: Albany, CA, USA, 2016; 86p. [Google Scholar] [CrossRef]
  48. Kim, H.-J.; Kim, H.-S.; Park, S.-I.; Park, H.-J.; Lee, S.-H. Development of Site Index Curves and Height-DBH Growth Model of Larix kaempferi for Deogyu Mountain in South Korea. For. Sci. Technol. 2018, 14, 145–150. [Google Scholar] [CrossRef]
  49. Socha, J.; Tymińska-Czabańska, L.; Bronisz, K.; Zięba, S.; Hawryło, P. Regional Height Growth Models for Scots Pine in Poland. Sci. Rep. 2021, 11, 10330. [Google Scholar] [CrossRef]
  50. Zhang, W.; Wu, B.; Ren, Y.; Yang, G. Regionally Compatible Individual Tree Growth Model under the Combined Influence of Environment and Competition. Plants 2023, 12, 2697. [Google Scholar] [CrossRef] [PubMed]
  51. Mitsch, W.J.; Ewel, K.C. Comparative Biomass and Growth of Cypress in Florida Wetlands. Am. Midl. Nat. 1979, 101, 417. [Google Scholar] [CrossRef]
  52. Ewel, K.C.; Wickenheiser, L.P. Effect of Swamp Size on Growth Rates of Cypress (Taxodium distichum) Trees. Am. Midl. Nat. 1988, 120, 362. [Google Scholar] [CrossRef]
  53. Ewel, K.C.; Davis, H.T. Response of Pondcypress (Taxodium distichurn var. nutans) to Thinning. South. J. Appl. For. 1992, 16, 175–177. [Google Scholar] [CrossRef]
  54. Hesse, I.D.; Day, J.W., Jr.; Doyle, T.W. Long-Term Growth Enhancement of Baldcypress (Taxodium distichum) from Municipal Wastewater Application. Environ. Manag. 1998, 22, 119–127. [Google Scholar] [CrossRef]
  55. Keim, R.F.; Chambers, J.L.; Hughes, M.S.; Dimov, L.D.; Conner, W.H.; Shaffer, G.P.; Gardiner, E.S.; Day, J.W. Long-Term Success of Stump Sprouts in High-Graded Baldcypress–Water Tupelo Swamps in the Mississippi Delta. For. Ecol. Manag. 2006, 234, 24–33. [Google Scholar] [CrossRef]
  56. Keim, R.F.; Amos, J.B. Dendrochronological Analysis of Baldcypress (Taxodium distichum) Responses to Climate and Contrasting Flood Regimes. Can. J. For. Res. 2012, 42, 423–436. [Google Scholar] [CrossRef]
  57. Keim, R.F.; Dean, T.J.; Chambers, J.L. Flooding Effects on Stand Development in Cypress-Tupelo. In Proceedings of the 15th Biennial Southern Silvicultural Research Conference, Hot Springs, AR, USA, 17–20 November 2008; e-Gen. Tech. Rep., SRS-GTR-175. Guldin James, M., Ed.; U.S. Department of Agriculture, Forest Service, Southern Research Station: Asheville, NC, USA, 2013; Volume 175, pp. 431–437. [Google Scholar]
  58. Wang, C.; Li, C.; Wei, H.; Xie, Y.; Han, W. Effects of Long-Term Periodic Submergence on Photosynthesis and Growth of Taxodium distichum and Taxodium ascendens Saplings in the Hydro-Fluctuation Zone of the Three Gorges Reservoir of China. PLoS ONE 2016, 11, e0162867. [Google Scholar] [CrossRef]
  59. Allen, S.T.; Keim, R.F.; Dean, T.J. Contrasting Effects of Flooding on Tree Growth and Stand Density Determine Aboveground Production, in Baldcypress Forests. For. Ecol. Manag. 2019, 432, 345–355. [Google Scholar] [CrossRef]
  60. Lundberg, C.J.; Shaffer, G.P.; Wood, W.B.; Day, J.W. Growth Rates of Baldcypress (Taxodium distichum) Seedlings in a Treated Effluent Assimilation Marsh. Ecol. Eng. 2011, 37, 549–553. [Google Scholar] [CrossRef]
  61. Ding, D.; Liu, M.; Arif, M.; Yuan, Z.; Li, J.; Hu, X.; Zheng, J.; Li, C. Responses of Ecological Stoichiometric Characteristics of Carbon, Nitrogen, and Phosphorus to Periodic Submergence in Mega-Reservoir: Growth of Taxodium distichum and Taxodium ascendens. Plants 2021, 10, 2040. [Google Scholar] [CrossRef]
  62. Krinard, R.M.; Johnson, R.L. 21-Year Growth and Development of Baldcypress Planted on a Flood-Prone Site; Res. Note SO-217; U.S. Department of Agriculture, Forest Service, Southern Forest Experiment Station: New Orleans, LA, USA, 1976; Volume 217, 4p. [Google Scholar]
  63. Visser, J.M.; Sasser, C.E. Changes in Tree Species Composition, Structure and Growth in a Bald Cypress-Water Tupelo Swamp Forest, 1980–1990. For. Ecol. Manag. 1995, 72, 119–129. [Google Scholar] [CrossRef]
  64. Ewel, K.C.; Parendes, L.A. Usefulness of Annual Growth Rings of Cypress Trees (Taxodium distichum) for Impact Analysis. Tree-Ring Bull. 1984, 44, 39–43. [Google Scholar]
  65. Young, P.J.; Megonigal, J.P.; Sharitz, R.R.; Day, F.P. False Ring Formation in Baldcypress (Taxodium distichum) Saplings under Two Flooding Regimes. Wetlands 1993, 13, 293–298. [Google Scholar] [CrossRef]
  66. Parresol, B.R.; Hotvedt, J.E. Diameter Measurement in Bald Cypress. For. Ecol. Manag. 1990, 33–34, 509–515. [Google Scholar] [CrossRef]
  67. Lickey, E.B.; Watson, F.D.; Walker, G.L. Differences in Bark Thickness among Populations of Baldcypress [Taxodium distichum (L.) Rich. var. distichum] and Pondcypress [T. distichum var. imbricarium (Nuttall) Croom]. Castanea 2002, 67, 33–41. [Google Scholar]
  68. Degravelles, W. Two-Year Growth and Mortality of Sub-Canopy Baldcypress (Taxodium distichum [L.] Rich.) in Artificial Canopy Gaps in a North Carolina Swamp; Clemson University: Clemson, SC, USA, 2010. [Google Scholar]
  69. Bechtold, W.A.; Patterson, P.L. The Enhanced Forest Inventory and Analysis Program—National Sampling Design and Estimation Procedures; Gen. Tech. Rep. SRS-80; U.S. Department of Agriculture, Forest Service, Southern Research Station: Asheville, NC, USA, 2005; Volume 080, 85p. [Google Scholar] [CrossRef]
  70. U.S. Forest Service. Nationwide Forest Inventory Field Guide, Version 9.4; U.S. Department of Agriculture: Washington, DC, USA, 2024. [Google Scholar]
  71. U.S. Forest Service. The Forest Inventory and Analysis Database User Guide (NFI), Version 9.3; U.S. Department of Agriculture: Washington, DC, USA, 2024. [Google Scholar]
  72. Zhang, Y.; He, H.S.; Dijak, W.D.; Yang, J.; Shifley, S.R.; Palik, B.J. Integration of Satellite Imagery and Forest Inventory in Mapping Dominant and Associated Species at a Regional Scale. Environ. Manag. 2009, 44, 312–323. [Google Scholar] [CrossRef]
  73. Odom, R.H.; Ford, W.M. Developing Species-Age Cohorts from Forest Inventory and Analysis Data to Parameterize a Forest Landscape Model. Int. J. For. Res. 2021, 2021, 1–16. [Google Scholar] [CrossRef]
  74. Wang, W.J.; Thompson, F.R.; He, H.S.; Fraser, J.S.; Dijak, W.D.; Jones-Farrand, T. Climate Change and Tree Harvest Interact to Affect Future Tree Species Distribution Changes. J. Ecol. 2019, 107, 1901–1917. [Google Scholar] [CrossRef]
  75. PRISM. PRISM Climate Group, Oregon State University. Available online: https://prism.oregonstate.edu (accessed on 27 January 2025).
  76. Arthur, J.D.; Baker, A.E.; Cichon, J.R.; Wood, A.R.; Rudin, A. Florida Aquifer Vulnerability Assessment (FAVA): Contamination Potential of Florida’s Principal Aquifer Systems; Florida Geological Survey: Tallahassee, FL, USA, 2005. [Google Scholar]
  77. Wolock, D.M. Estimated Mean Annual Natural Ground-Water Recharge in the Conterminous United States: U.S. Geological Survey Data Release; U.S. Geological Survey: Washington, DC, USA, 2003. [Google Scholar] [CrossRef]
  78. Wieczorek, M. Area-and Depth-Weighted Averages of Selected SSURGO Variables for the Conterminous United States and District of Columbia; No. 866; U.S. Geological Survey: Washington, DC, USA, 2014. [Google Scholar] [CrossRef]
  79. Penfound, W.T.; Watkins, A.G. Phytosociological Studies in the Pinelands of Southeastern Louisiana. Am. Midl. Nat. 1937, 18, 661. [Google Scholar] [CrossRef]
  80. Mitsch, W.J.; Taylor, J.R.; Benson, K.B. Estimating Primary Productivity of Forested Wetland Communities in Different Hydrologic Landscapes. Landsc. Ecol. 1991, 5, 75–92. [Google Scholar] [CrossRef]
  81. Krinard, R.M.; Johnson, R.L. Growth of a 31-Year Old Baldcypress Plantation; USDA Forest Service Southern Forest Experiment Station: Asheville, NC, USA, 1987. [Google Scholar]
  82. Williston, H.L.; Shropshire, F.W.; Balmer, W.E. Cypress Management: A Forgotten Opportunity; USDA Forest Service, Southeastern Area State and Private Forestry: Fairbanks, AK, USA, 1980. [Google Scholar]
  83. Dicke, S.G.; Toliver, J.R. Effects of Crown Thinning on Baldcypress Height, Diameter, and Volume Growth. South. J. Appl. For. 1988, 12, 252–256. [Google Scholar] [CrossRef]
  84. Shankman, D. Forest Regeneration on Abandoned Meanders of a Coastal Plain River in Western Tennessee. Castanea 1991, 56, 157–167. [Google Scholar]
  85. Beaven, G.F.; Oosting, H.J. Pocomoke Swamp: A Study of a Cypress Swamp on the Eastern Shore of Maryland. Bull. Torrey Bot. Club 1939, 66, 367–389. [Google Scholar] [CrossRef]
  86. Huang, W. Influence of Different Taxodium Ascendens Stands on the Open Ranges and System Performance in Jiangsu Province, China. Agrofor. Syst. 1997, 37, 241–252. [Google Scholar] [CrossRef]
  87. Keeland, B.D.; Conner, W.H. Natural Regeneration and Growth of Taxodium distichum (L.) Rich. in Lake Chicot, Louisiana after 44 Years of Flooding. Wetlands 1999, 19, 149–155. [Google Scholar] [CrossRef]
  88. Oren, R.; Phillips, N.; Ewers, B.E.; Pataki, D.E.; Megonigal, J.P. Sap-Flux-Scaled Transpiration Responses to Light, Vapor Pressure Deficit, and Leaf Area Reduction in a Flooded Taxodium distichum Forest. Tree Physiol. 1999, 19, 337–347. [Google Scholar] [CrossRef]
  89. Popovic, V.; Ivetić, V.; Šijačić-Nikolić, M.; Knežević, R.; Matović, B.; Lavadinović, V. Effect of Pre-Treatments on Seed Germination Rate from Different Bald Cypress (Taxodium distichum Rich.) Trees. For. Ideas 2012, 18, 163–168. [Google Scholar]
  90. Powell, A.S. Response of Baldcypress (Taxodium distichum) at Different Life Stages to Flooding and Salinity; East Carolina University: Greenville, NC, USA, 2014. [Google Scholar]
  91. Pietrzykowski, M.; Daniels, W.L.; Koropchak, S.C. Microtopographic Effects on Growth of Young Bald Cypress (Taxodium distichum L.) in a Created Freshwater Forested Wetland in Southeastern Virginia. Ecol. Eng. 2015, 83, 135–143. [Google Scholar] [CrossRef]
  92. Carmichael, M.J.; Smith, W.K. Growing Season Ecophysiology of Taxodium distichum (L.) Rich. (Bald Cypress) Saplings in a Restored Wetland: A Baseline for Restoration Practice. Botany 2016, 94, 1115–1125. [Google Scholar] [CrossRef]
  93. Li, B.; Du, C.; Yuan, X.; Willison, J.H.M.; Xiao, H. Suitability of Taxodium distichum for Afforesting the Littoral Zone of the Three Gorges Reservoir. PLoS ONE 2016, 11, e0146664. [Google Scholar] [CrossRef]
  94. Zhu, Y.; Pan, B.; Yu, C.; Yin, Y.; Zhang, Y. Comparative Study on DBH Growth and Wood Density of Taxodium Hybrid ‘Zhongshanshan 118’ and Taxodium distichum. J. Nanjing For. Univ. 2019, 43, 201. [Google Scholar] [CrossRef]
  95. Qian, Z.; Wu, L.; Tang, L. Effects of Flooding and Endogenous Hormone on the Formation of Knee Roots in Taxodium ascendens. Front. Plant Sci. 2022, 13, 803619. [Google Scholar] [CrossRef]
  96. Every, C.; Aust, W.M.; Carter, D.R.; Coates, T.A.; Schilling, E.B. Thirty-Five-Year Timber Harvesting Disturbance Effects on Composition and Biomass of Tupelo-Cypress (Nyssa-Taxodium) Forested Wetlands, Southwest Alabama, USA. Wetlands 2023, 43, 106. [Google Scholar] [CrossRef]
  97. Ismail, M.F.; Bahnasy, M.I.; El-Etreby, M.A.; Abbaas, M.M. Biomass and Some Wood Properties of Taxodium distichum (L.) Rich. Grown in Two Provenances in Egypt. Hortic. Res. J. 2023, 1, 85–95. [Google Scholar] [CrossRef]
  98. Xu, Y.; He, N.; Li, Q.; Lin, H. Study on Variation of Wood Bending Properties among Trees of Taxodium Ascendens Plantation. J. Phys. Conf. Ser. 2024, 2920, 012014. [Google Scholar] [CrossRef]
  99. Lu, J.; Huang, C.; Schleeweis, K.; Zou, Z.; Gong, W. Derivation of Age Estimates for All Trees Surveyed by Field Crew Through the United States Forest Inventory and Analysis Program. SSRN 2024, 5063219. [Google Scholar] [CrossRef]
  100. Lee, T.M.; Fouad, G.; Rains, K. Ranking the Inundation Potential of Palustrine Wetlands in the Northern Tampa Bay Area; Prepared for Tampa Bay Water: Clearwater, FL, USA, 2022. [Google Scholar]
  101. Bertassello, L.E.; Rao, P.S.C.; Jawitz, J.W.; Aubeneau, A.F.; Botter, G. Wetlandscape hydrologic dynamics driven by shallow groundwater and landscape topography. Hydrol. Process. 2020, 34, 1460–1474. [Google Scholar] [CrossRef]
Figure 1. Photograph illustrating an inflection point (arrow) of tree buttress angle in Taxodium ascendens. The inflection point is used as an indicator of normal pool (NP), which reflects high water levels. (Photo: T.J. Venning.).
Limnolrev 25 00009 g001
Figure 2. Map showing the state of Florida with Forest Inventory and Analysis (FIA) plots used in this study, with an inset of Lake Charles.
Limnolrev 25 00009 g002
Figure 3. Daily water levels at Lake Charles, observed (1971–2018) and modeled historic (1946–2018). The historic scenario represents lake water levels that would occur with current structural conditions in place and with no withdrawal or augmentation influences. Text within the plot indicates start years for major anthropogenic influences on lake hydrology (wellfield operations in 1963, structural alterations in 1966, and lake augmentation in 1968).
Limnolrev 25 00009 g003
Figure 4. Relationship between normal pool (NP) elevation and diameter at breast height (DBH) at Lake Charles cypress trees (Taxodium ascendens). Two populations are shown: lakeshore trees (triangles) with larger DBH and higher NP elevations (mean NP: 17.1 m, mean DBH: 66.3 cm) and northern wetland trees (circles) with smaller DBH and lower NP elevations (mean NP: 16.1 m, mean DBH: 35.5 cm).
Limnolrev 25 00009 g004
Figure 5. Age as a function of diameter at breast height (DBH) for Taxodium ascendens using Forest Inventory and Analysis stand age data for Florida cypress swamps (n = 613). The linear regression model explained 30% of the variability in estimated tree age, with a root mean square error (RMSE) of 24.2 years. Dashed lines capture the 95% confidence interval (CI).
Limnolrev 25 00009 g005
Figure 6. Age as a function of diameter at breast height (DBH) for Taxodium ascendens and T. distichum from previous studies (see Table 1), with associated regressions (dashed and dotted lines). The model derived in this study (solid line) is shown for comparison.
Limnolrev 25 00009 g006
Table 1. Studies evaluated to assess age–DBH relationships for cypress.
StudyUS State 1Species 2MethodSampleData Points 3
Mattoon [6]MD, LAT. dis.RingsGroups, Individuals78
Rodgers et al. [45]FLT. dis.RingsGroups6
Mitsch and Ewel. [51]FLT. dis.RingsIndividuals10
Wang et al. [58]Outside UST. dis.Stand ageGroups-
Ding et al. [61]Outside UST. dis.Stand ageGroups-
Krinard and Johnson. [62]MST. dis.Stand ageGroups1
Ewel and Parendes [64]FLT. asc.RingsGroups2
Degravelles [68]NCT. dis.RingsIndividuals63
Penfound et al. [79]LAT. asc.RingsGroups1
Mitsch et al. [80]KYT. dis.RingsGroups1
Krinard and Johnson [81]MST. dis.Stand ageGroups1
Williston et al. [82]MST. dis.Stand ageGroups1
Dicke and Toliver [83]LAT. dis.Stand ageGroups1
Shankman [84]TNT. dis.RingsGroups24
Beaven et al. [85]MDT. dis.Stand ageIndividuals2
Huang et al. [86]Outside UST. asc.Stand ageGroups-
Keeland and Conner [87]LAT. dis.Stand ageGroups6
Oren et al. [88]NCT. dis.Stand ageGroups3
Popovic et al. [89]Outside UST. dis.Stand ageGroups-
Powell [90]NCT. dis.RingsGroups5
Pietrzykowski et al. [91]VAT. dis.Stand ageGroups5
Carmichael et al. [92]NCT. dis.Stand ageGroups1
Li et al. [93]Outside UST. dis.Stand ageGroups-
Yueha et al. [94]Outside UST. asc.RingsGroups-
Qian et al. [95]Outside UST. asc.Stand ageGroups-
Every et al. [96]ALT. dis.Stand ageGroups4
Ismail et al. [97]Outside UST. dis.Stand ageGroups-
Xu et al. [98]Outside UST. asc.RingsIndividuals-
1 US states: AL = Alabama, FL = Florida, KY = Kentucky, LA = Louisiana, MD = Maryland, MS = Mississippi, NC = North Carolina, TN = Tennessee, and VA = Virginia. 2 Taxodium distichum and T. ascendens. 3 Number of age–DBH data points extracted from study for analyses in current work. A dash indicates studies conducted outside of cypress’ natural range, which were not used.
Disclaimer/Publisher’s Note: The statements, opinions and data contained in all publications are solely those of the individual author(s) and contributor(s) and not of MDPI and/or the editor(s). MDPI and/or the editor(s) disclaim responsibility for any injury to people or property resulting from any ideas, methods, instructions or products referred to in the content.

