Abstract
Historical measurements of phosphate turnover and uptake confirm that bacterioplankton dominate phosphate dynamics at ambient steady state conditions in all but the most eutrophic samples, but phytoplankton exhibits increased control at phosphate additions as low as +10 nM. The results are consistent with the theory that uptake mechanisms of bacterioplankton become saturated as soon as phosphate concentrations are elevated above ambient levels. Uptake dynamics were consistent with multiphasic kinetics by bacterioplankton versus phytoplankton. Temperature dependence of phosphate turnover was demonstrated for Lake Superior but not for other Great Lakes in which temperatures were largely homogeneous. Ambient concentrations of orthophosphate were estimated by an inverse isotope dilution method that indicated concentrations ranged from roughly 1 to 7 nM across all the lakes surveyed.
1. Introduction
A recent report of widespread increases in soluble phosphate concentrations in streams across the Great Lakes region of North America from 2003 to 2019 implicates changing climate and land use practices for increasing frequencies and intensities of harmful algal blooms [1]. The authors suggest that even if total phosphorus concentrations remain constant, changes in phosphorus chemical speciation may exert strong ecological effects. Other reports suggest that the lower food webs of Lakes Michigan and Huron are experiencing oligotrophication and are exhibiting increased similarity to Lake Superior [2,3,4,5,6,7,8,9,10]. Whether or not these different observations and speculations can be reconciled remains to be seen, but they suggest the need for increased attention to historical datasets. I recently archived and published a dataset consisting of physical, chemical, and biological data collected from the North American Great Lakes from 1986 to 1997 [11,12]. Additional historical and more recent data about lower trophic level food web structure in those lakes using N-15 stable isotope analyses have likewise been published [13]. Here, I report experiments designed to measure kinetics and ambient concentrations of orthophosphate in several Great Lakes using carrier-free P-33. P-33 was the radioisotope of choice for long research cruises owing to its longer half-life and lower beta particle emission energy than P-32.
Methodological difficulties with measuring ambient phosphate concentrations in lakes have been known for decades [14,15,16]. Spectrophotometry is the principal method used to monitor phosphorus in lakes, but the chemical speciation of the multiple forms of P is typically operationally defined and is resultingly inexact [17]. As early as 1966, Frank Rigler proposed a radiobioassay method to estimate orthophosphate [18]. There has been decades-long controversy about the relative contributions of bacterioplankton, phytoplankton, and zooplankton to total phosphorus flux in lakes [19]. These relative contributions may differ between ambient steady-state conditions and experimentally perturbed concentrations.
Some authors have tried to reduce the detection limits for orthophosphate concentrations by spectrophotometric means by concentrating the phosphate by magnesium-induced coprecipitation [20,21,22], although others have reported unsatisfactorily high blank values with that method [23].
For the conceptual framework of this study, I adopted a conventional two-compartment model of P uptake and excretion [19]. Particulate cellular P is represented by a hypothetical small metabolic compartment that both acquires and releases phosphate from and to solution, as well as a larger structural compartment that is less labile. For concentrations at or near ambient, I assumed that phosphorus dynamics were at steady state and that first-order kinetics applied. An opportunity to test these assumptions against data arose during my research cruise from July to August 1997 on lakes Erie, St. Clair, Huron, Superior, and Michigan. The cruise had multiple investigative aims, but these results have not previously been published. They may now provide a baseline and reference for future investigations of changing phosphorus dynamics in the Great Lakes.
2. Materials and Methods
Preliminary experiments to test the feasibility of shipboard radiophosphorus-33 (P-33) kinetics measurements during long research cruises were performed at 23 stations in Lakes Erie, Huron, and Michigan from 24 August to 2 September 1993 (Table 1).

Table 1.
Station IDs, decimal Latitude (N), decimal Longitude (W), and station maximum depth z (m), 1993.
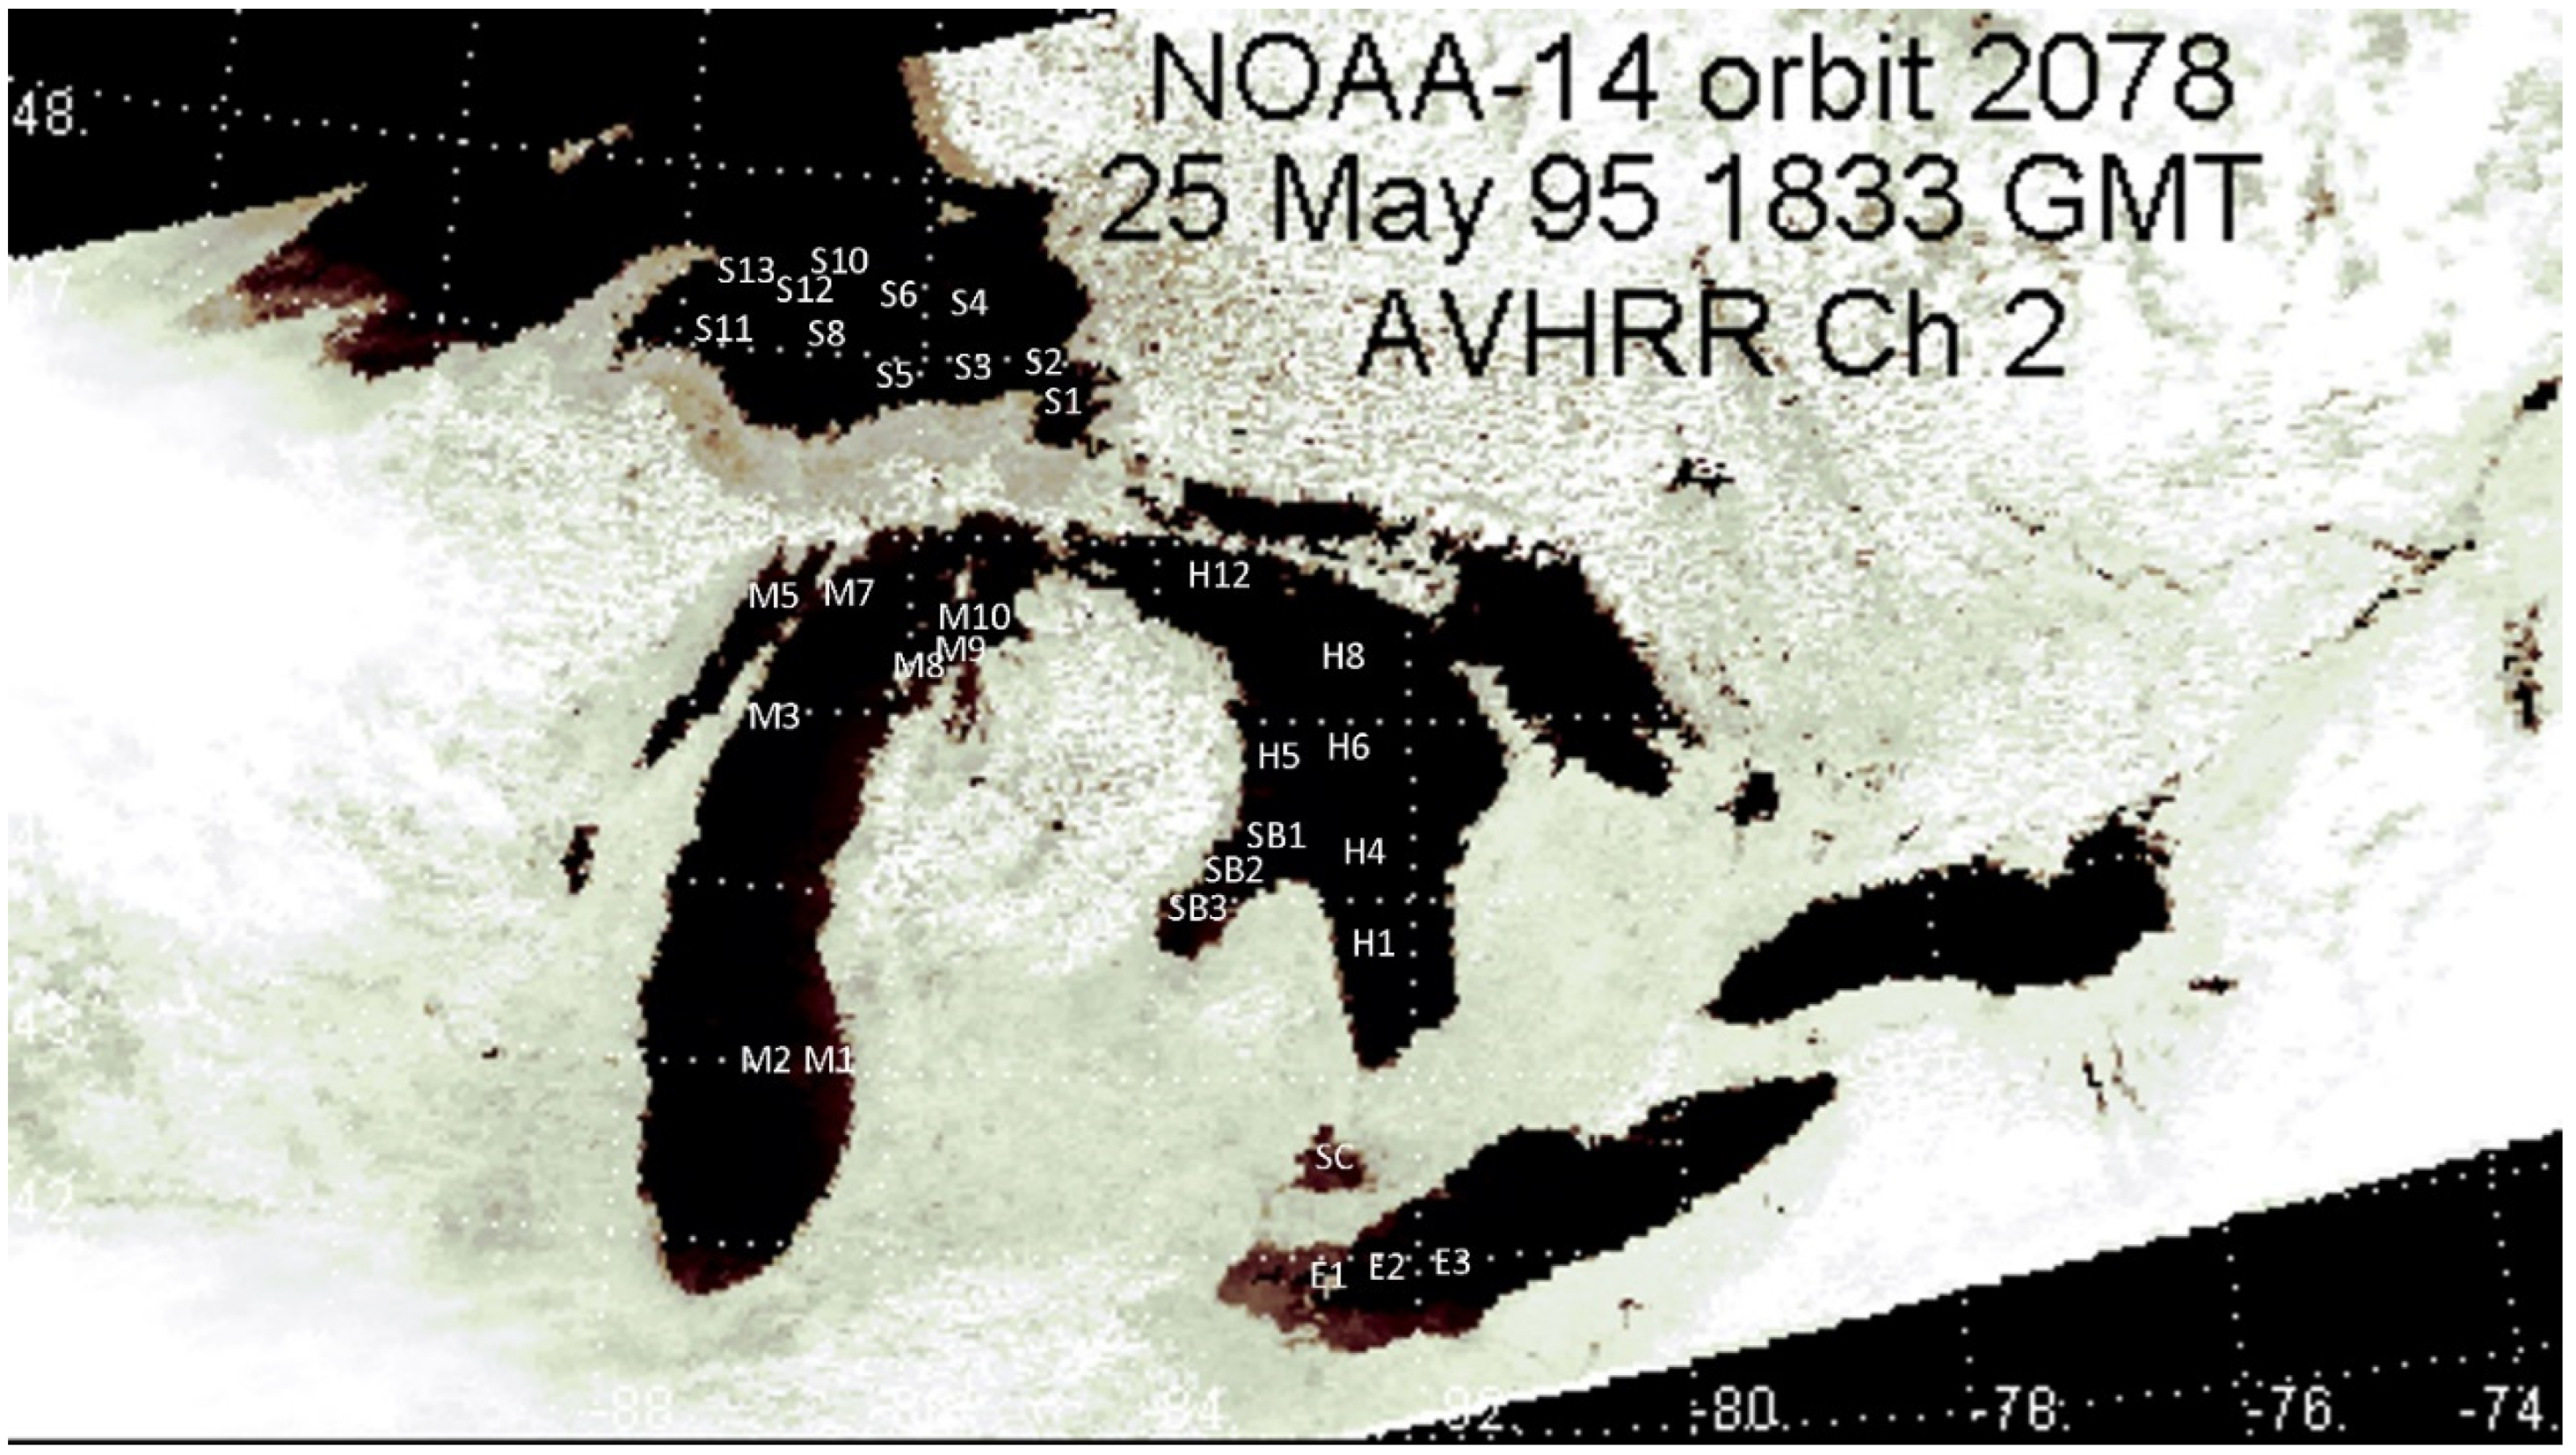
In 1997, 32 sampling stations were visited in western Lake Erie, St. Clair, Huron including Saginaw Bay, eastern Lake Superior, and Lake Michigan including outer Green Bay (Figure 1, Table 2).

Figure 1.
Sampling locations superimposed on a channel 2 (near-infrared) image obtained from Polar Orbiting Environmental Satellite NOAA-14 on a near-cloud-free day across the Great Lakes region.
Table 2.
Station IDs, decimal Latitude (N), decimal Longitude (W), and station maximum depth z (m), 1997.
Isotope dilution experiments in 1993 were conducted with 100 mL samples of lake water from 5, 10, or 15 m depth at ambient water temperature. All treatments involved additions of 100 μL carrier-free P-33 obtained from New England Nuclear, followed by time-series filtration of 10-mL subsamples through 0.2 μm Nucleopore filters. At seven of the sites, plankton samples were diluted by 50% using lake water filtrate from 0.2 μm filtration. In 1997, all samples were collected from 5 m depth except for Lake St. Clair, where the collection depth was 2 m. Treatments consisted of no addition, +10 nM PO4, and +20 nM PO4 together with either 50, 80, or 100 μL of carrier-free P-33 obtained from New England Nuclear. The solution for standard additions was prepared so that 1 mL contained 10 nmol P-31 as orthophosphate. At intervals from <1 to 20 min 5-mL, subsamples were removed and filtered through either 0.2 μm or 1.0 μm Nucleopore filters. Then, the filters were placed in glass scintillation vials and stored frozen pending return to my University of Michigan-Ann Arbor laboratory at cruise’s end for liquid scintillation counting. In addition to the filters, 0.5 mL of the 100 mL samples was placed in scintillation vials and likewise stored frozen until counted in parallel with the filters. Doing so provided internal standards for the decay of P-33 stock solution during the long cruise (16 July to 12 August 1997).
In some experiments, 0.1 mL formalin was added to 5-mL subsamples in parallel with uptake time series to determine how much of the sequestered P-33 was labile enough to leak from dead cells, representing a metabolic, non-structural pool. In other cases, 0.1 mL formalin was added to the time-series treatments after ca. 10 min to confirm whether further P-33 uptake ceased, demonstrating that the uptake was biological. In other experiments, time-series uptake measurements were interrupted by addition of ca. 500 nM PO4 to determine whether cellular P-33 could be chased into solution, representing metabolism and excretion of the structural phosphorus pool.
Upon return to the laboratory, time-series subsamples were analyzed within 36 h by liquid scintillation counting. Total P-33 cpm on each filter were divided by 10 times the P-33 cpm contained in the 0.5 mL control samples for each experiment. Resulting fractions of total P-33 on each filter were plotted versus time, and slopes plus standard errors were calculated by linear regression. A first estimate of ambient [PO4] was determined by inverse isotope dilution as follows:
P0 = ambient lake water [PO4]
P10 = lake water amended with +10 nM [PO4]
k0 = first order rate constant for carrier-free P-33 uptake in ambient lake water
k10 = first order rate constant for P-33 uptake in lake water amended with +10 nM [PO4]
P0 = [10]/(k0/k10 − 1)]
The coefficients k0 and k10 were obtained by empirical fit to the time-series data. Improved estimates of P0 were obtained by assuming that uptake was first-order linear with additions of both 10 nM and 20 nM PO4, using the Solver™ function of Microsoft Excel™ version 2502 to iterate to a P0 value for which uptake rates (nM/min) were linear (r2 = 1.000) for three points: no add = P0, P0 + 10 nM, and P0 + 20 nM treatments. This effectively permitted calculation of uptake rates of nM/min instead of simply the fraction of P-33 assimilated per minute.
Additional concentration-amended uptake kinetics were conducted using 10-mL lake water samples at ambient lake temperatures. Amendments were +100 and +300 nM P-31 together with 0.1 mL carrier-free P-33 stock solution. After ca. 15 min incubation, the entire samples were filtered through either 0.2 μm or 1.0 μm Nucleopore filters, placed in scintillation vials, and stored frozen until analysis. P-33 kinetics data were analyzed in the context of my archived Great Lakes dataset [12], including water temperature and concentrations of total P (TP), dissolved P (DP), and chlorophyll a (Chl a).
3. Results
3.1. P-33 Turnover Rates Under Ambient (No Add) Conditions in 1993
Turnover rates of P-33 phosphate exhibited statistically significant differences among Lakes Erie, Huron, and Michigan (one-way AOV p << 0.0001). The differences trace almost entirely to Lake Michigan; Lakes Huron and Erie exhibited no statistically significant differences (p > 0.08). These differences could not be ascribed to differences in Chl a (Figure 2), total dissolved P (Figure 3), or temperature.

Figure 2.
P-33 turnover rates of unamended lake water in 1993 plotted against Chl a concentrations.
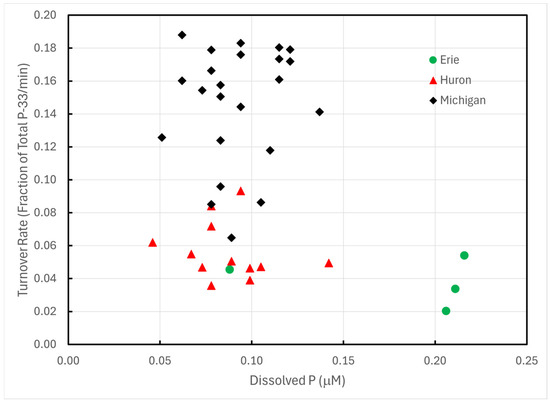
Figure 3.
P-33 turnover rates of unamended lake water in 1993 plotted against total dissolved P concentrations.
To ascertain whether the measured turnover rates were reliable and reproducible, rates calculated for undiluted samples were compared with rates calculated for samples that had been diluted by 50%. For the seven samples analyzed from the three lakes, the mean ratio of diluted sample (50%) turnover rate to undiluted samples was 0.462 (SE = 0.031, n = 7), which was not significantly different from the expected mean of 0.500.
3.2. P-33 Turnover Rates Under Ambient (No Add) Conditions in 1997
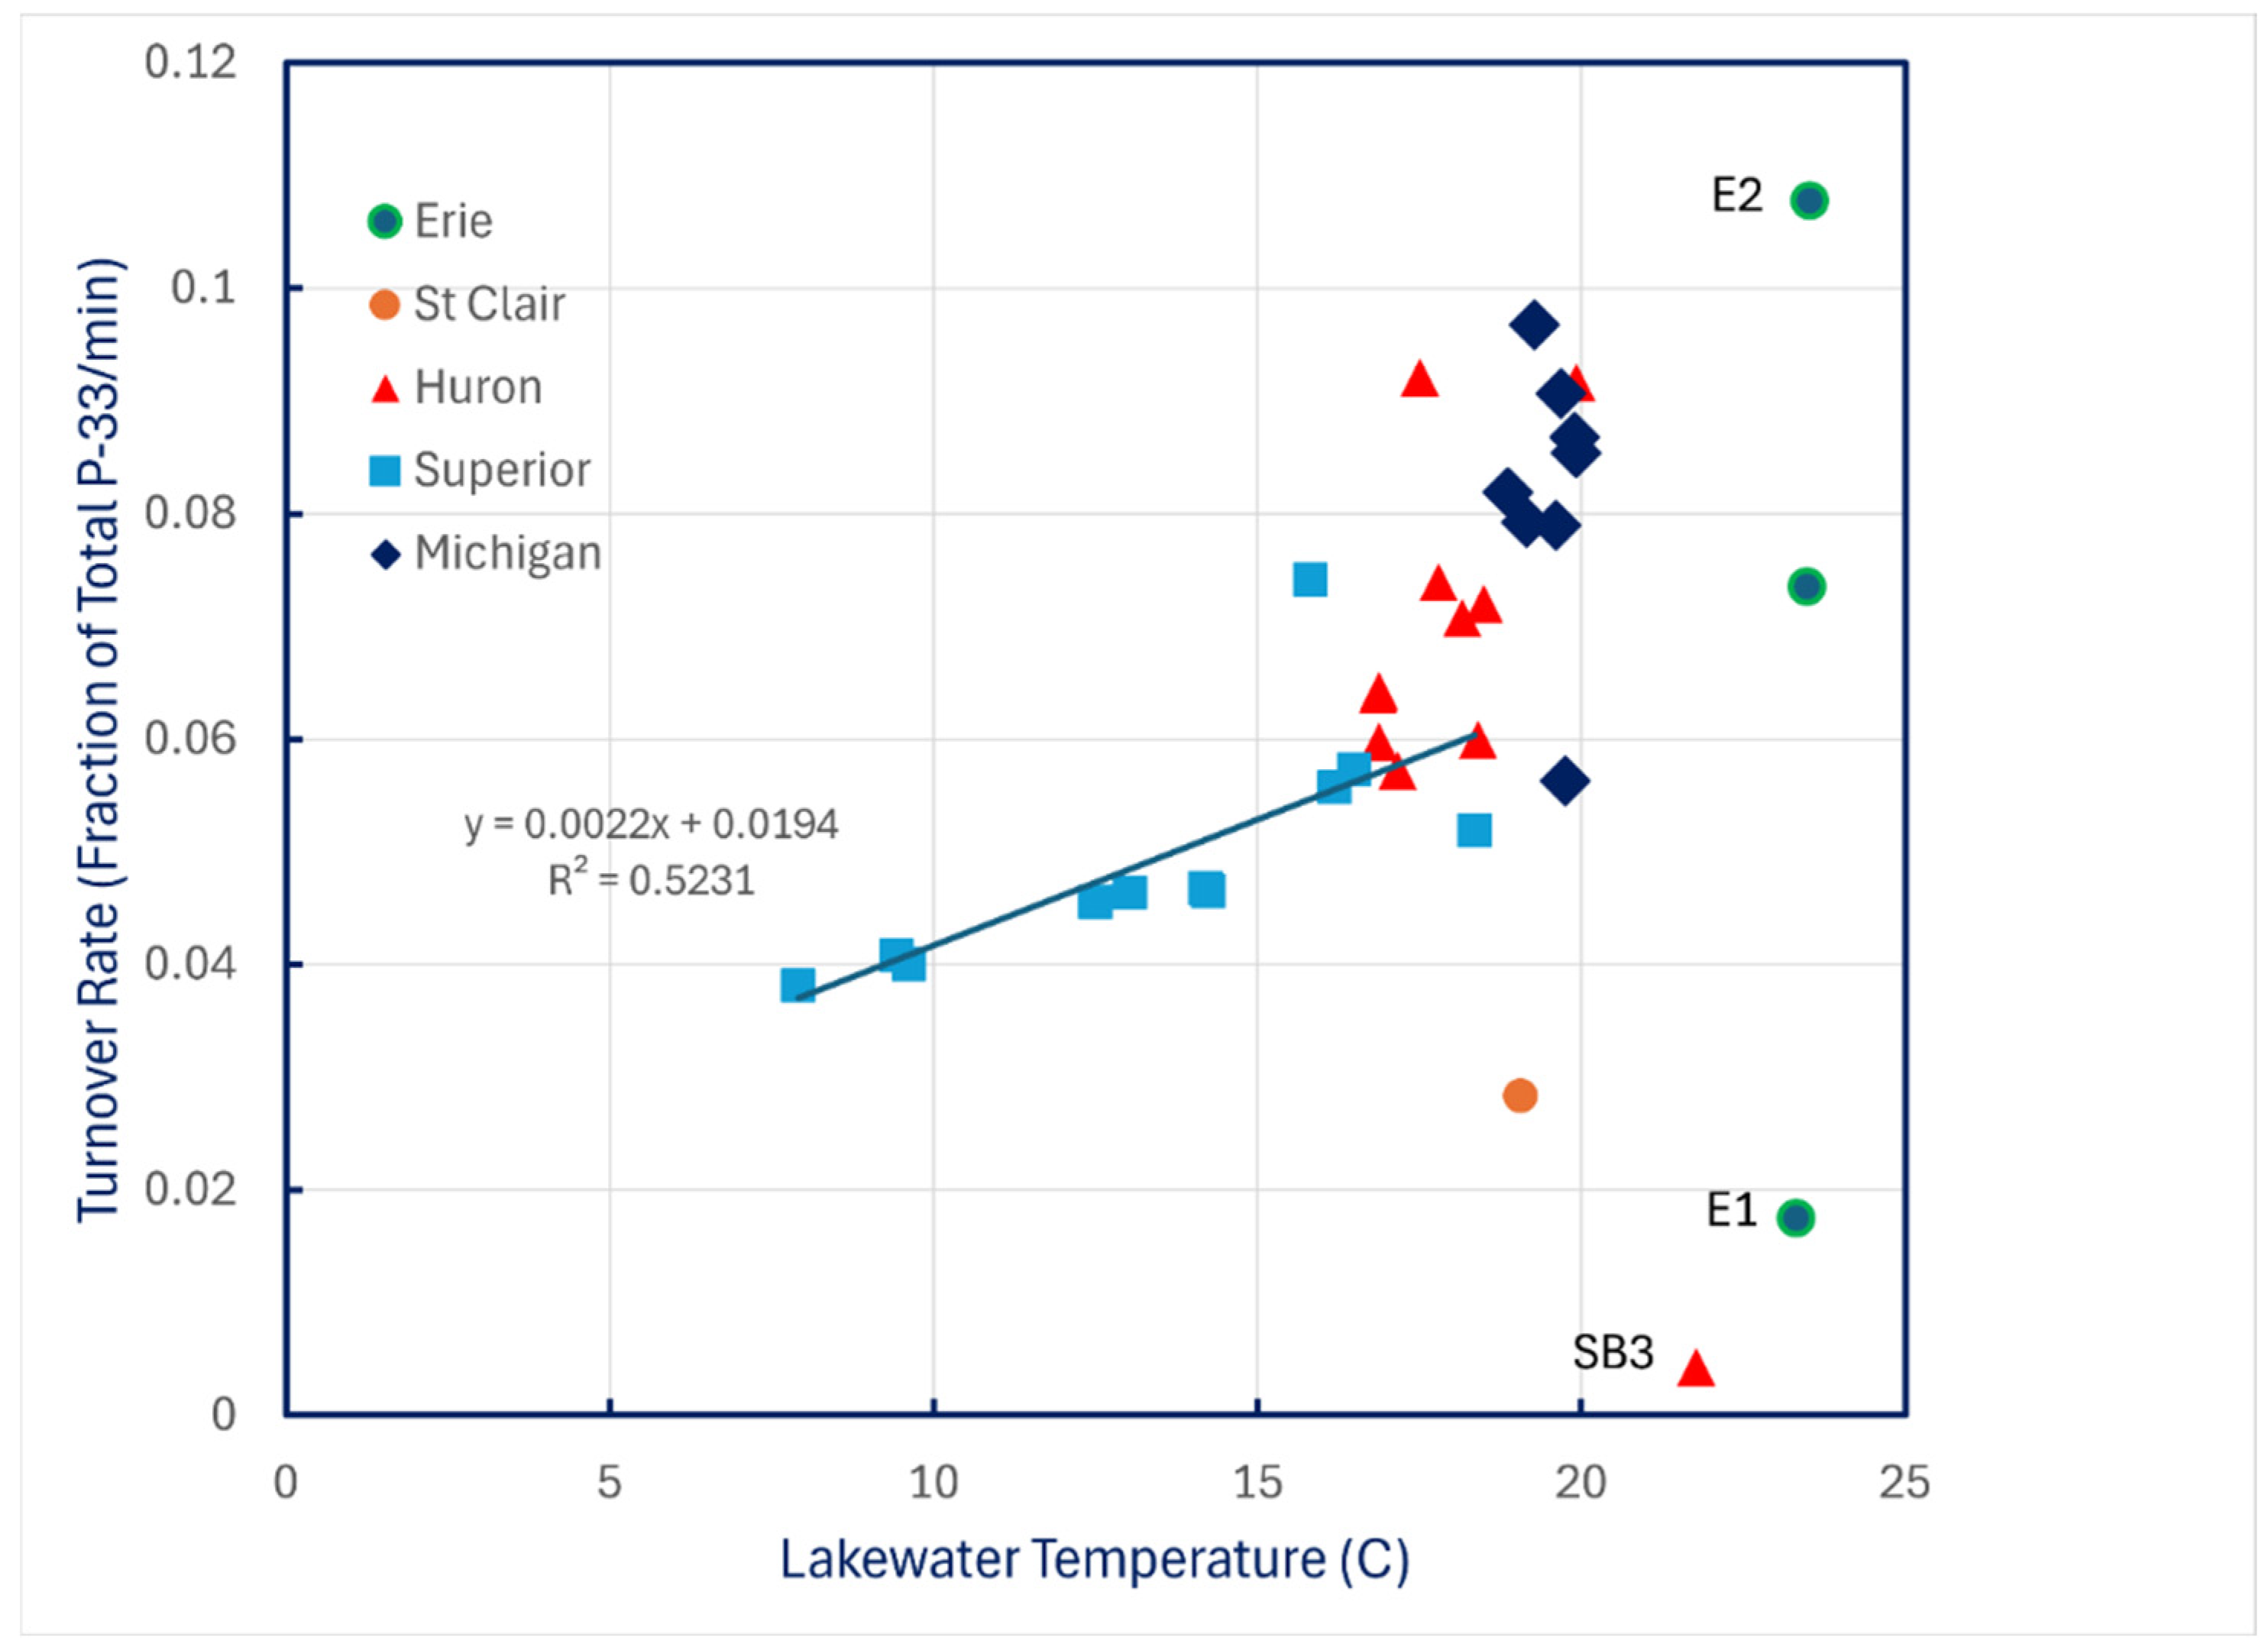
Turnover rates of carrier-free P-33 phosphate added to lake water at ambient temperature showed almost no relationship to water temperature except for the coldest conditions encountered in Lake Superior (Figure 4).
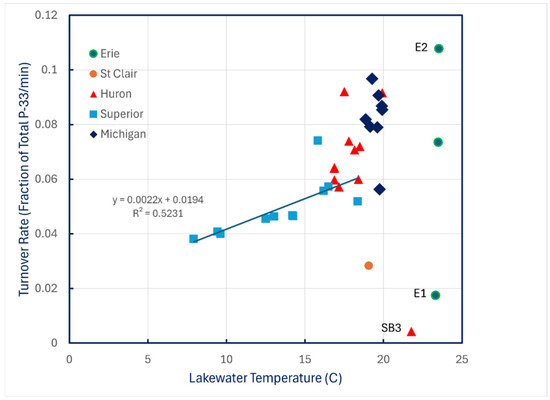
Figure 4.
P-33 turnover rates of unamended lake water in 1997 plotted against water temperature.
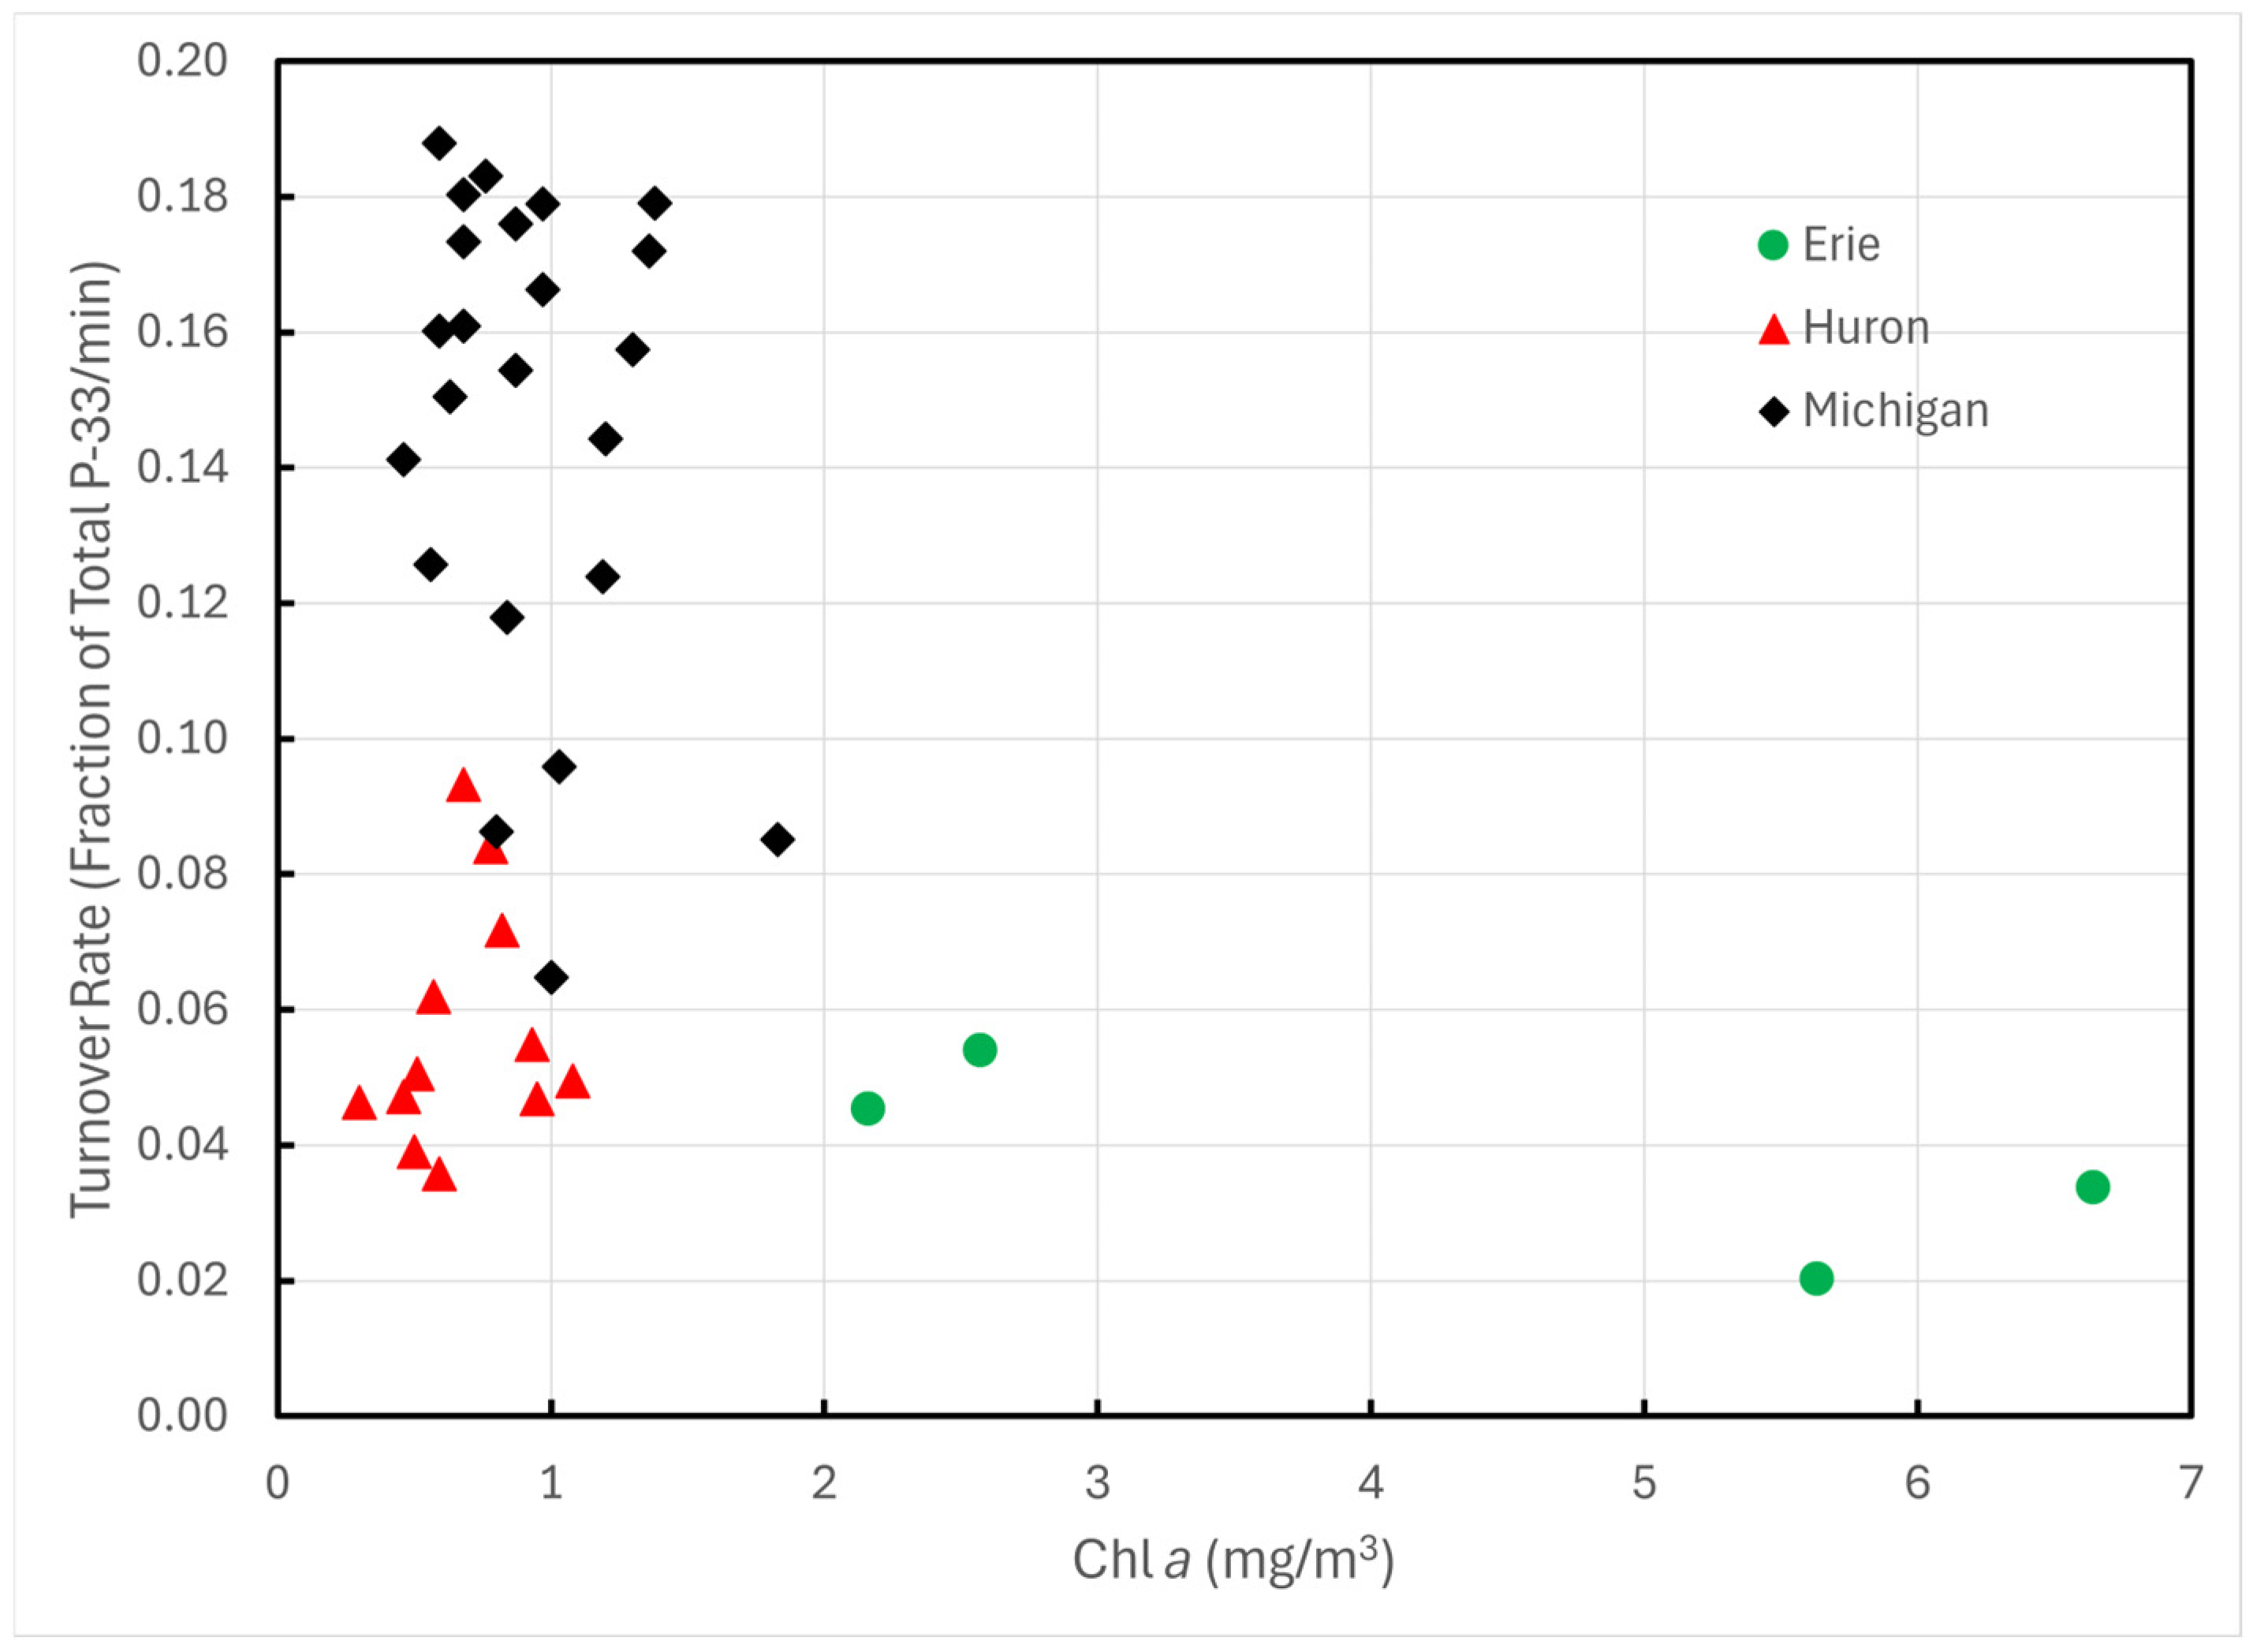
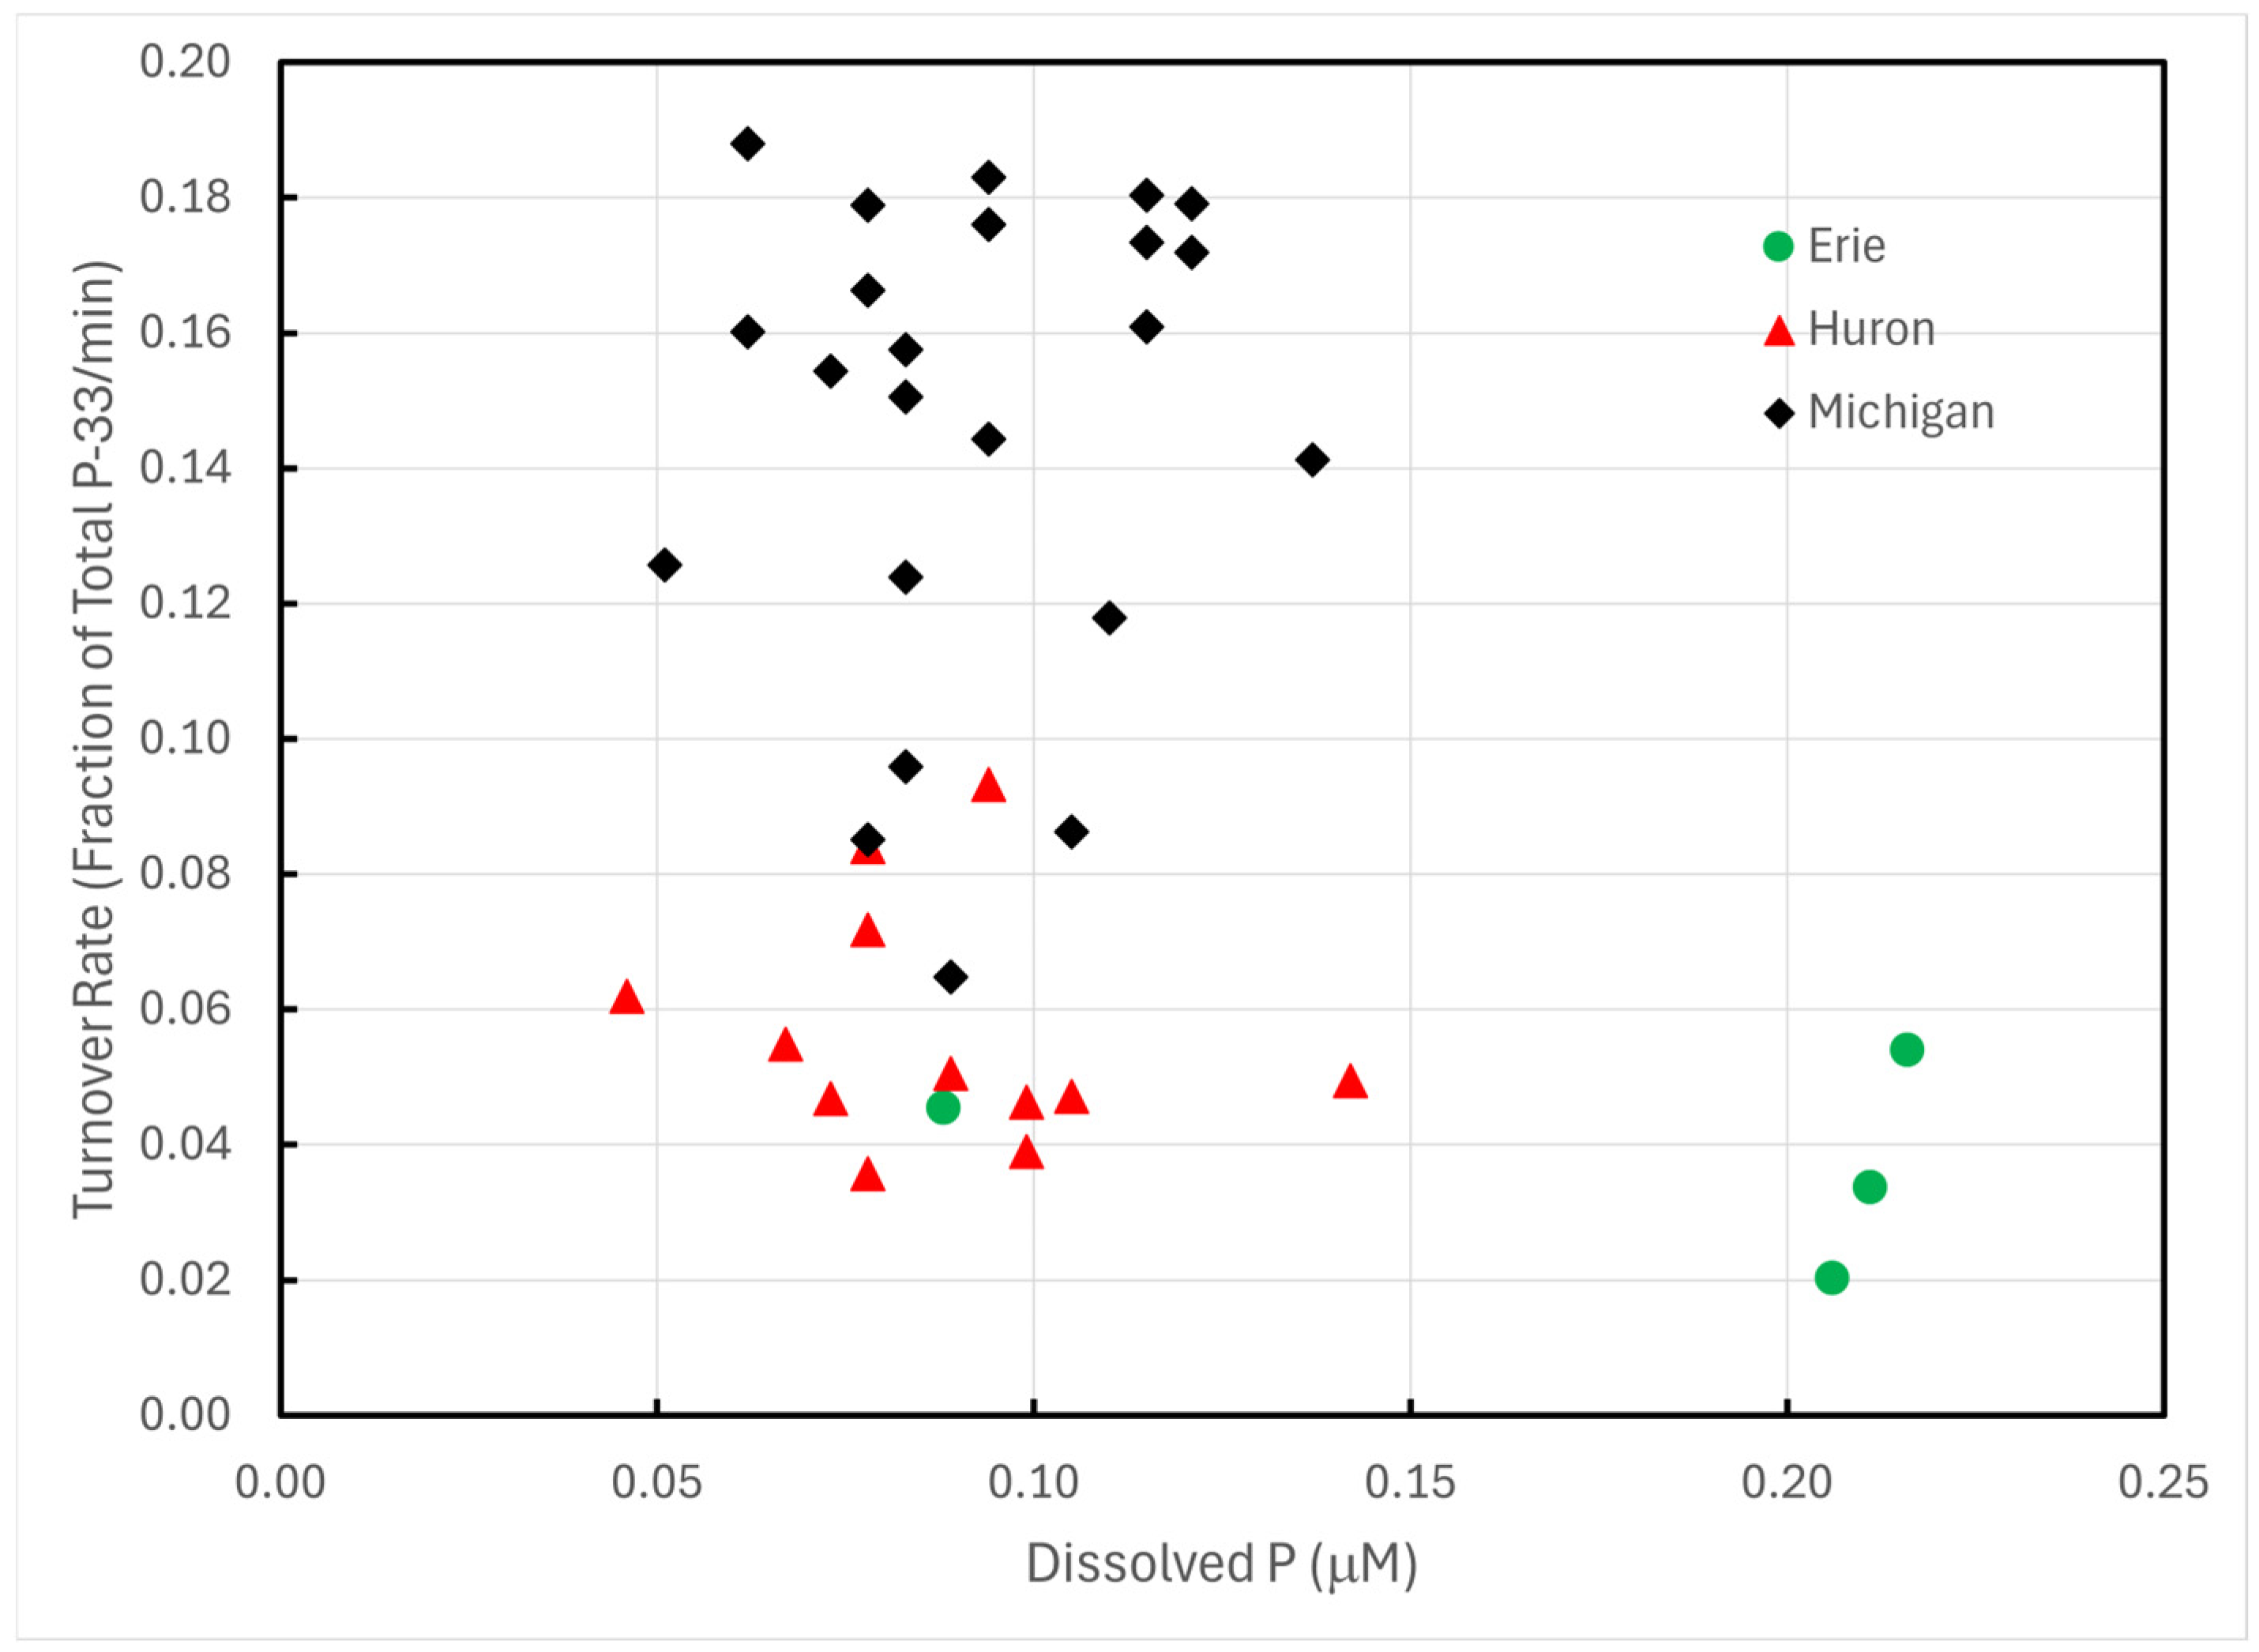
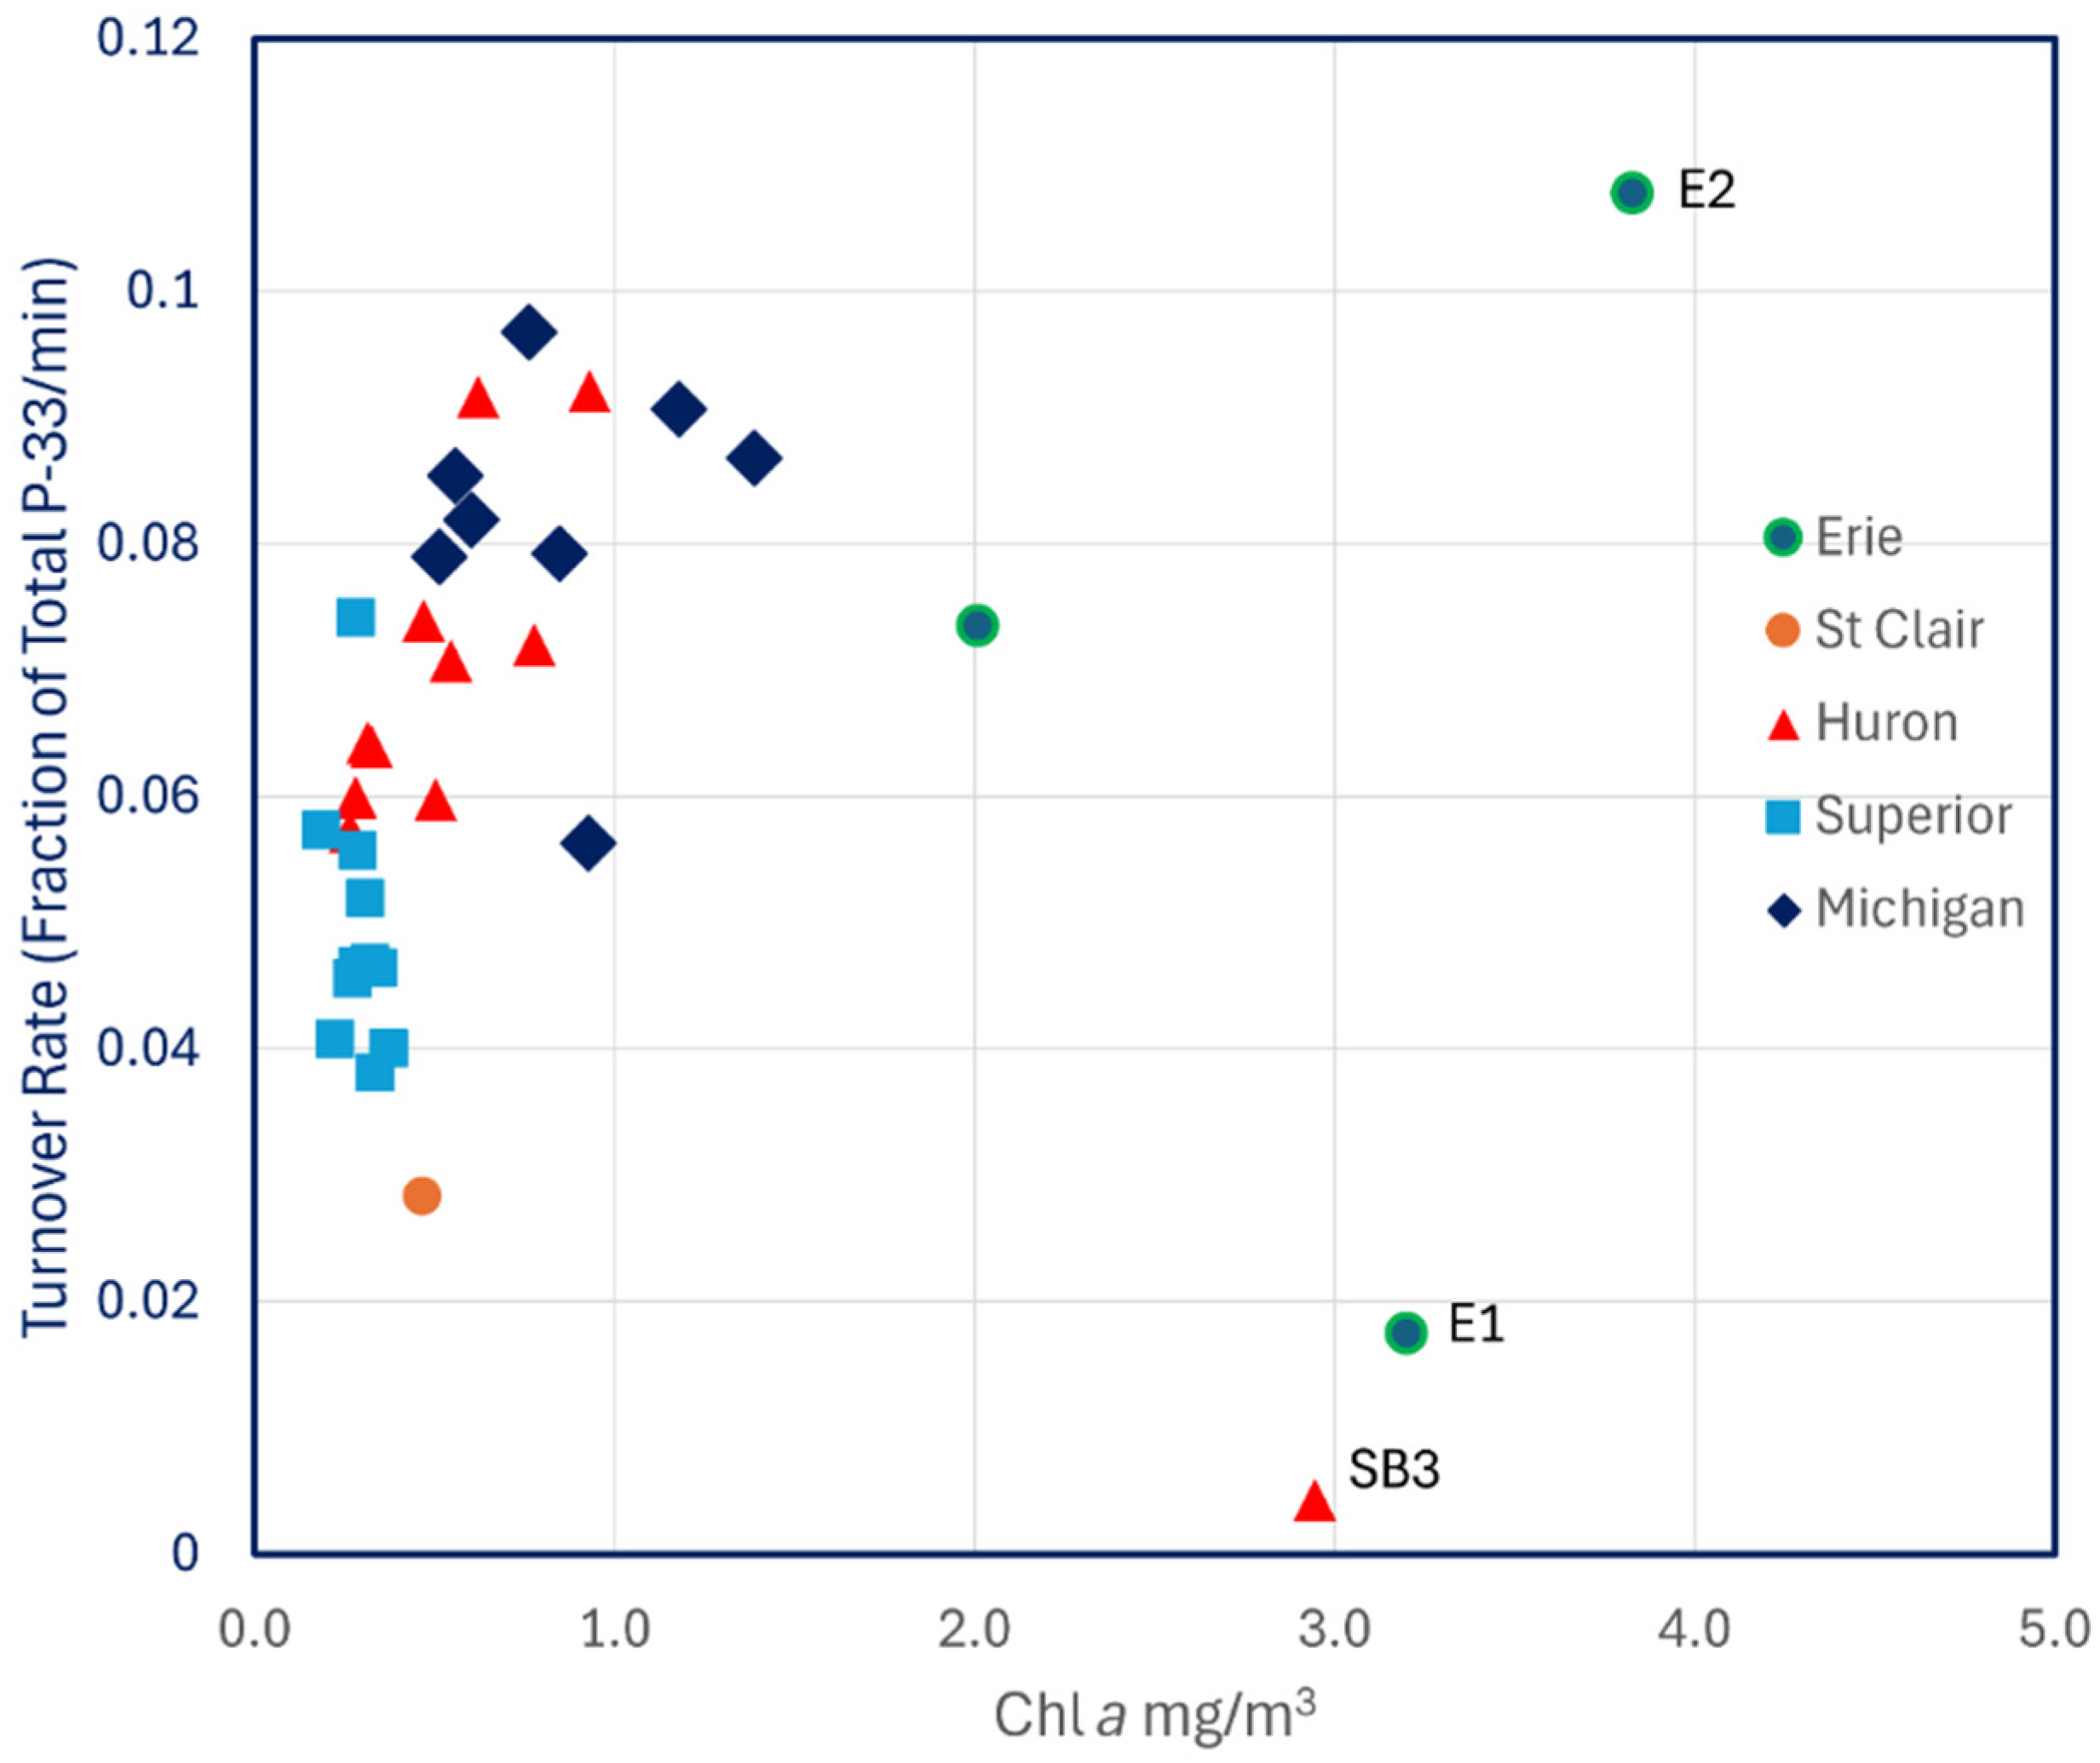
Likewise, there was no relationship between turnover rates and Chl a (Figure 5) nor with total dissolved P (r2 = 0.014, p > 0.1) or with particulate P (r2 = 0.033, p > 0.1). Turnover rates for Lake Michigan measured in 1997 were lower than those from 1993 and were more comparable to Lakes Huron and Erie.
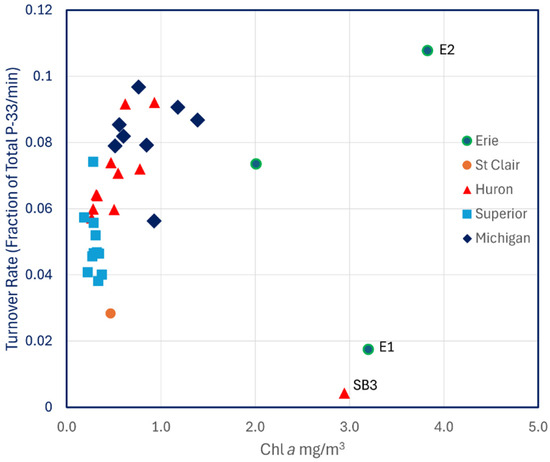
Figure 5.
P-33 turnover rates of unamended lake water across the Great Lakes plotted against Chl a.
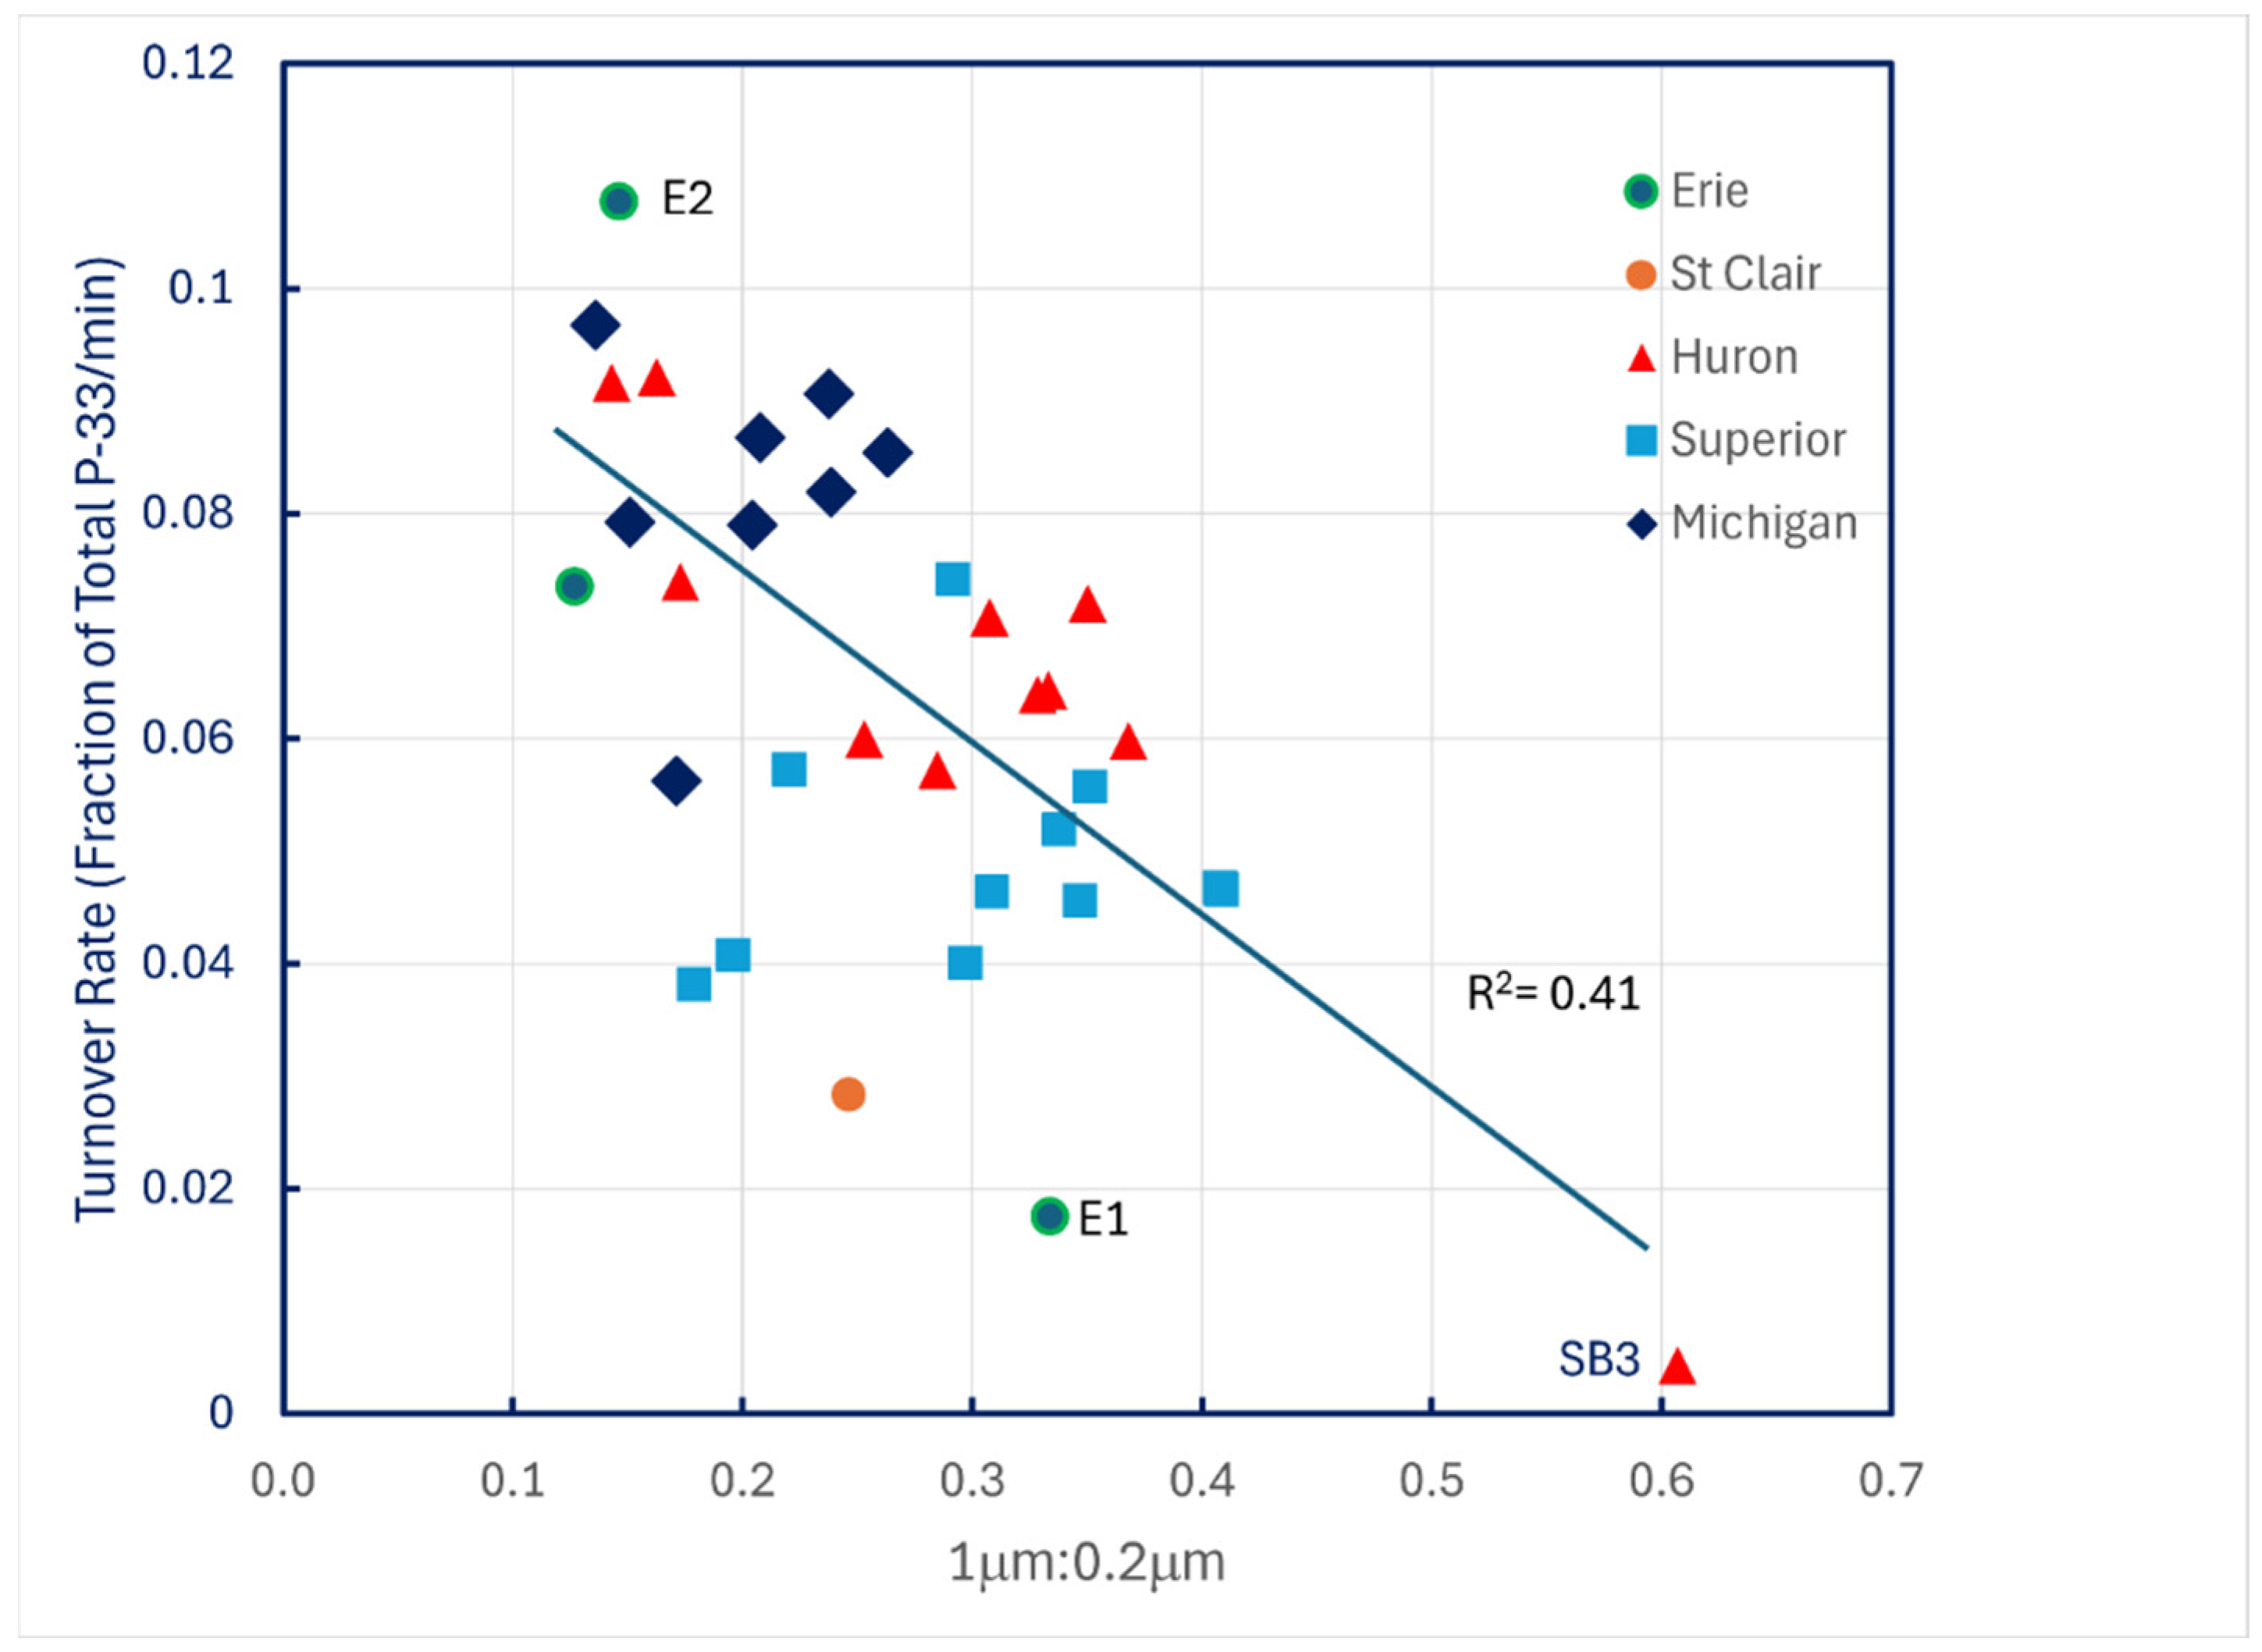
The only compelling predictor of turnover rates under ambient conditions was the ratio of particulate P-33 retained on 1.0 μm filters to that retained by 0.2 μm filters (Figure 6).
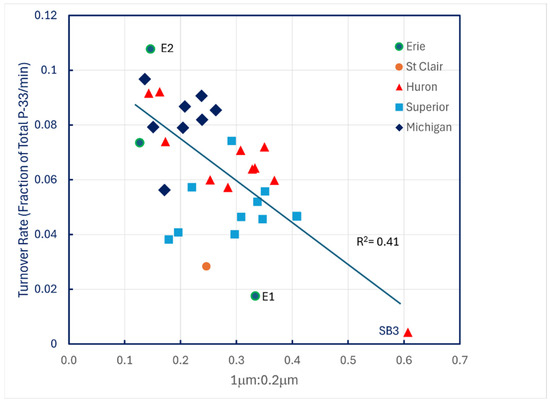
Figure 6.
P-33 turnover rates of unamended lake water across the Great Lakes plotted against the ratio of particulate P-33 retained on 1.0 μm filters to P-33 retained on 0.2 μm filters.
The pattern suggests that the smallest particles, bacterioplankton, with their high surface-to-volume ratios, play a larger role in phosphate turnover kinetics under ambient, steady-state conditions than do larger phytoplankton particles.
3.3. Kill Experiments
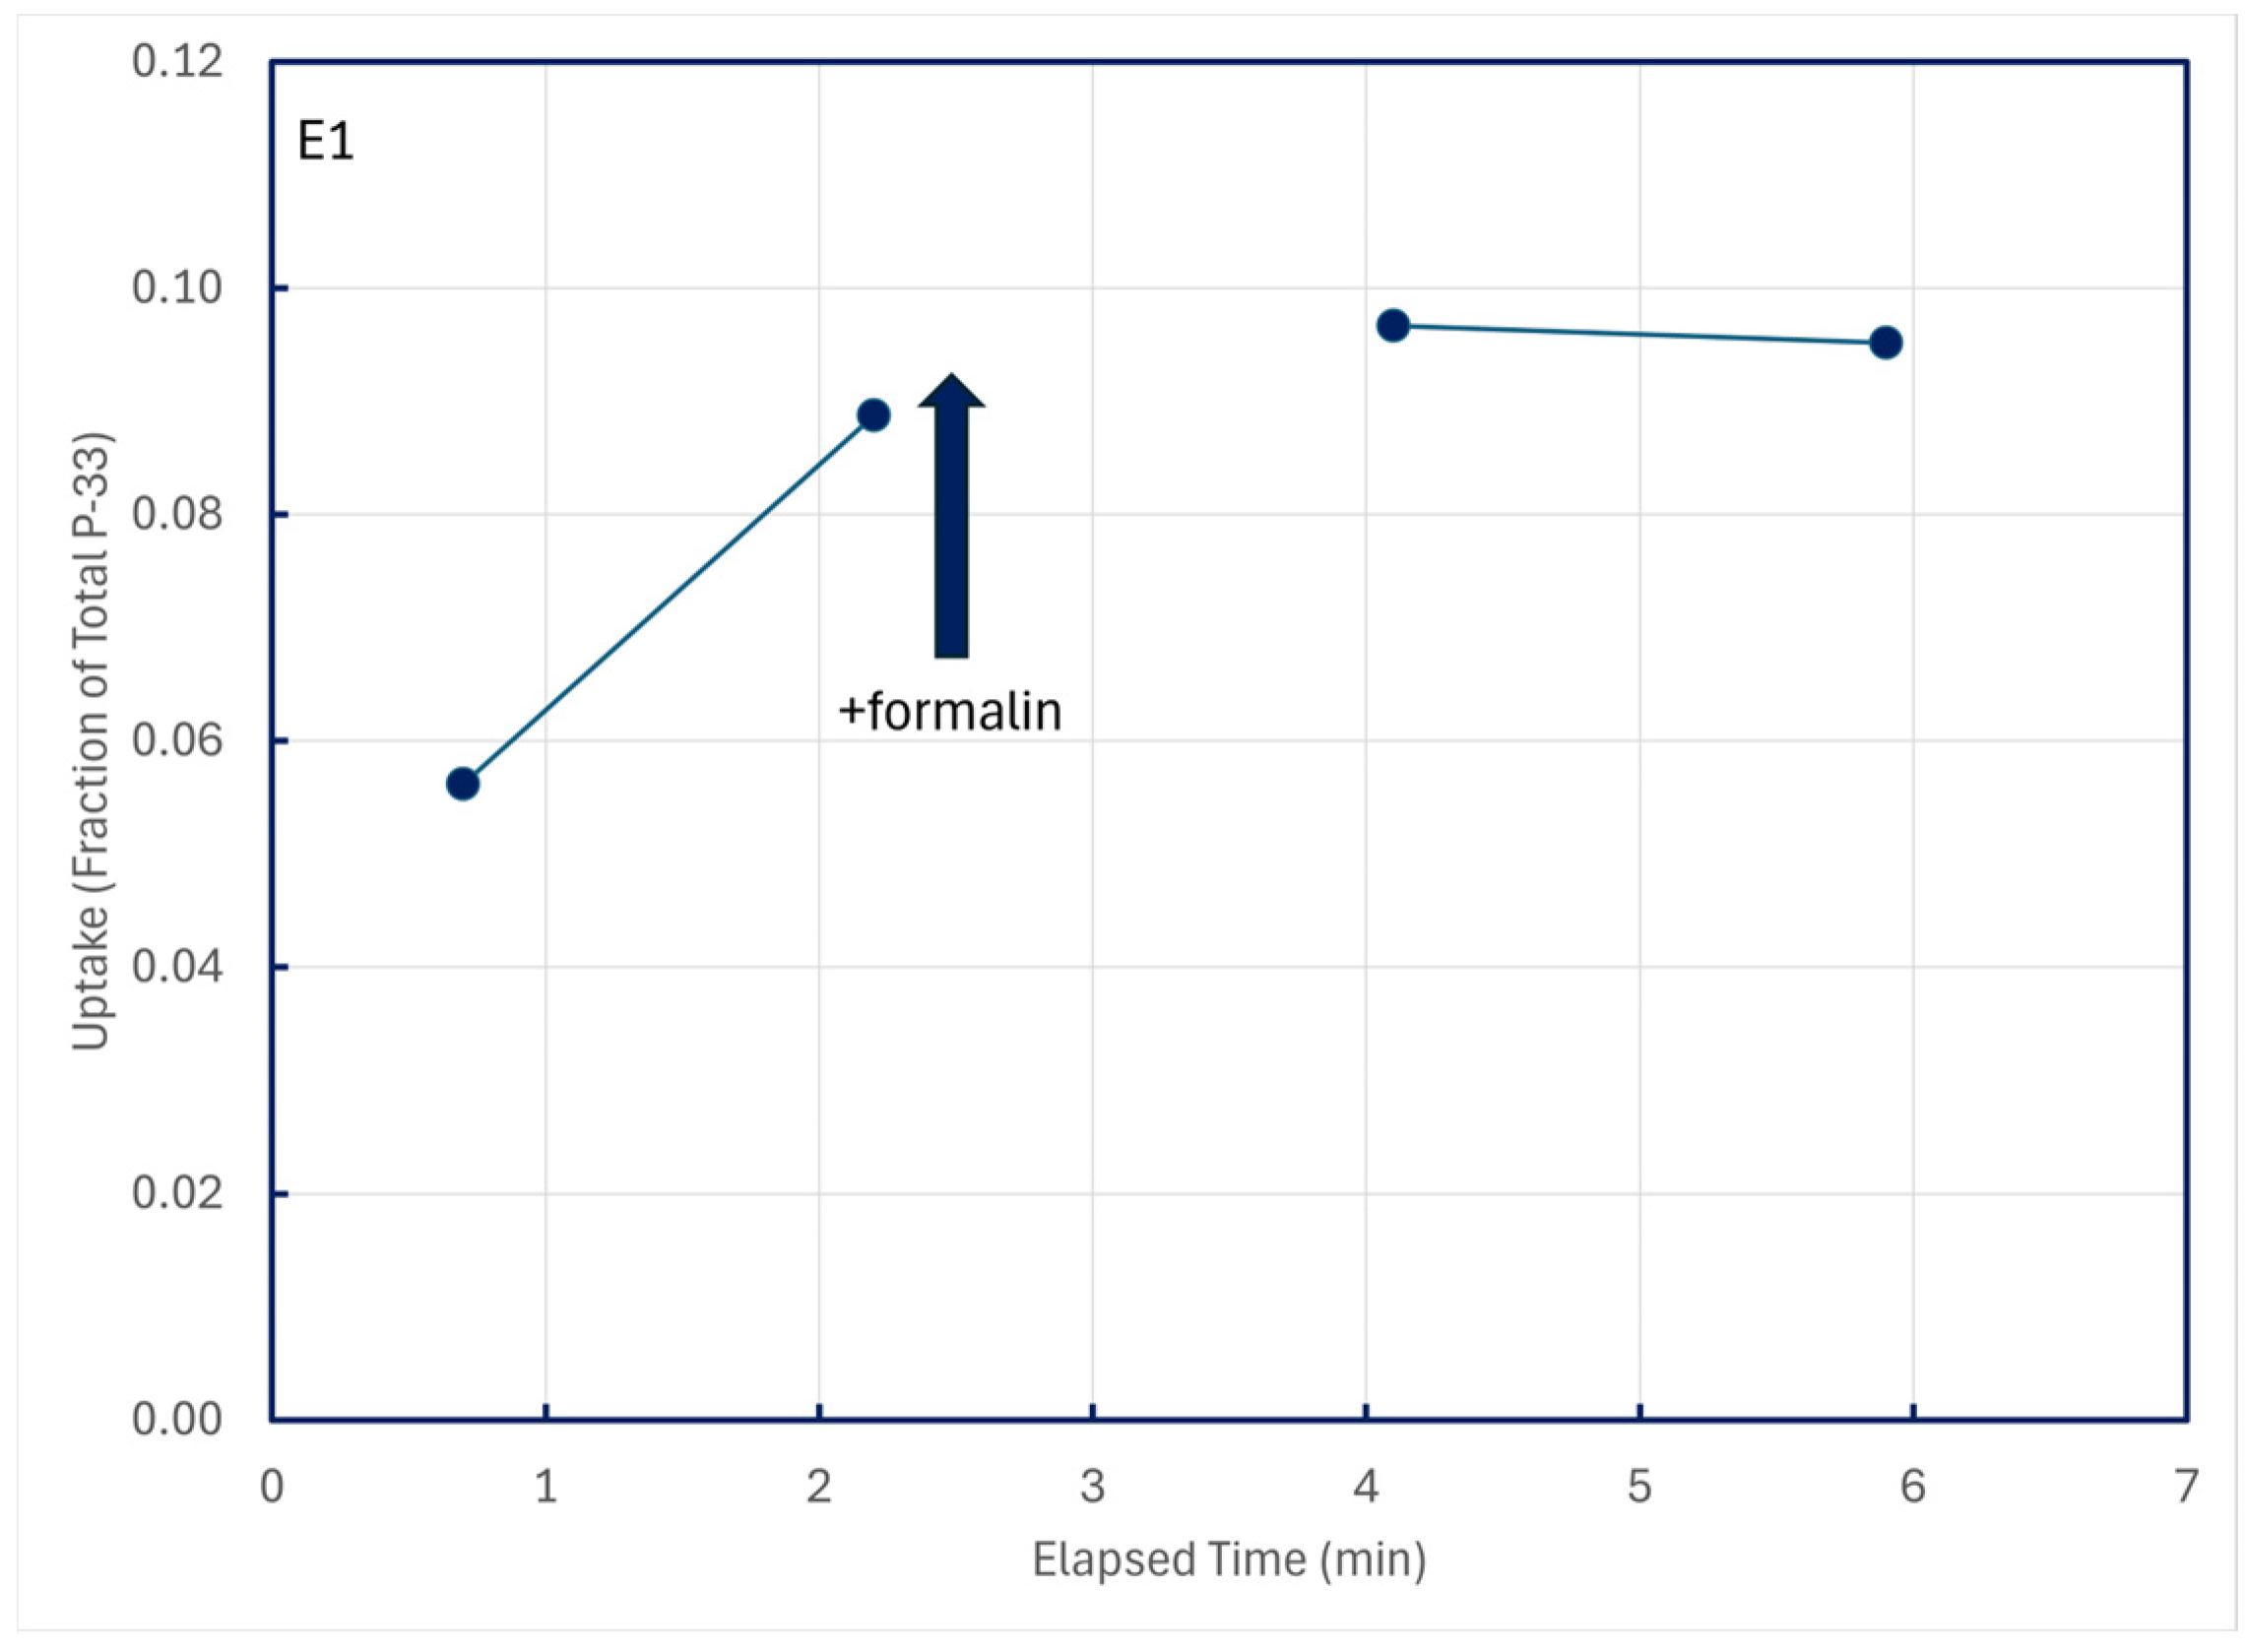
Uptake of P-33 promptly ceased in time-series trials when formalin was added (Figure 7), demonstrating that the uptake was biological in nature.
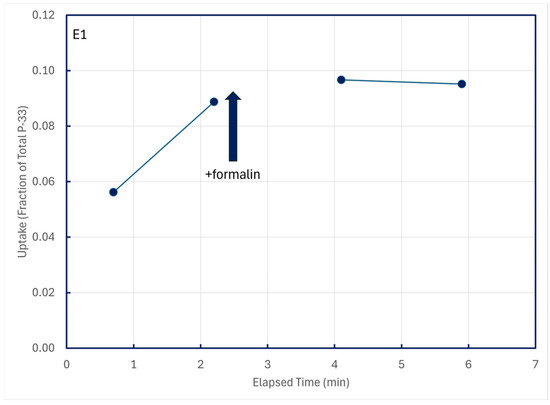
Figure 7.
Cessation of P-33 uptake following addition of 0.1 mL formalin to a 100-mL lake water sample at 2.4 min of elapsed time; particulates were retained on 0.2 μm filters.
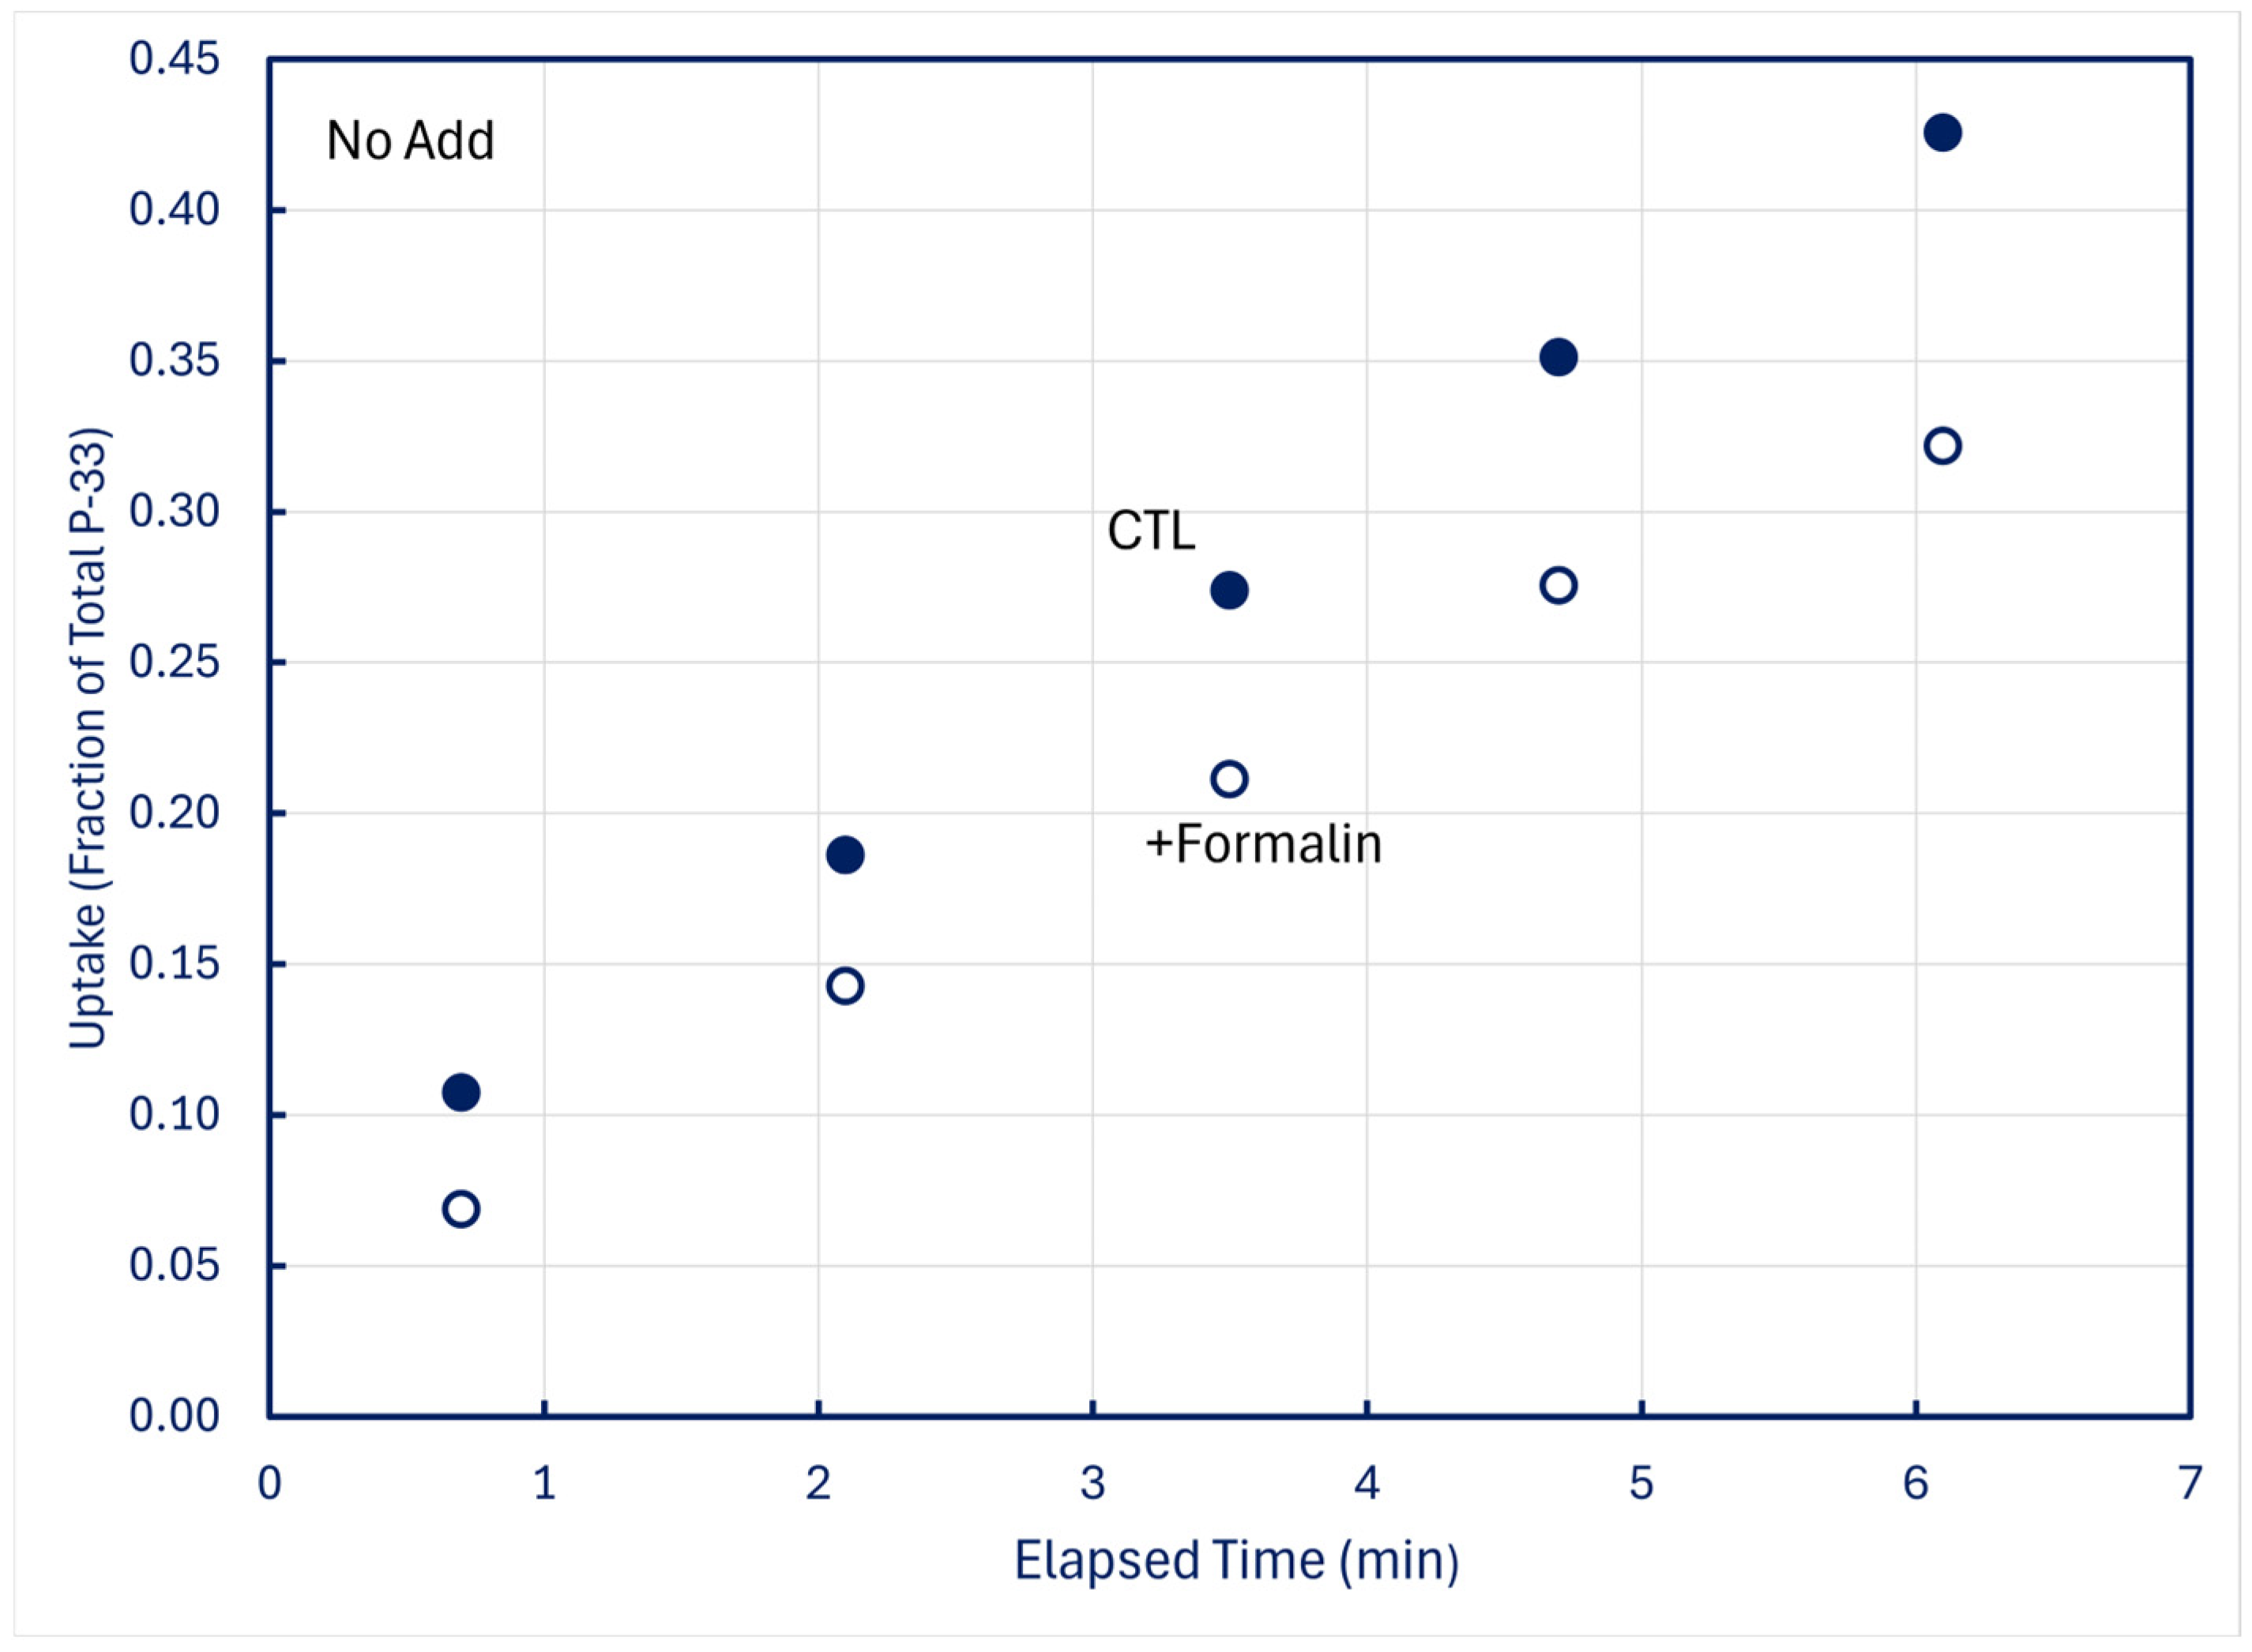
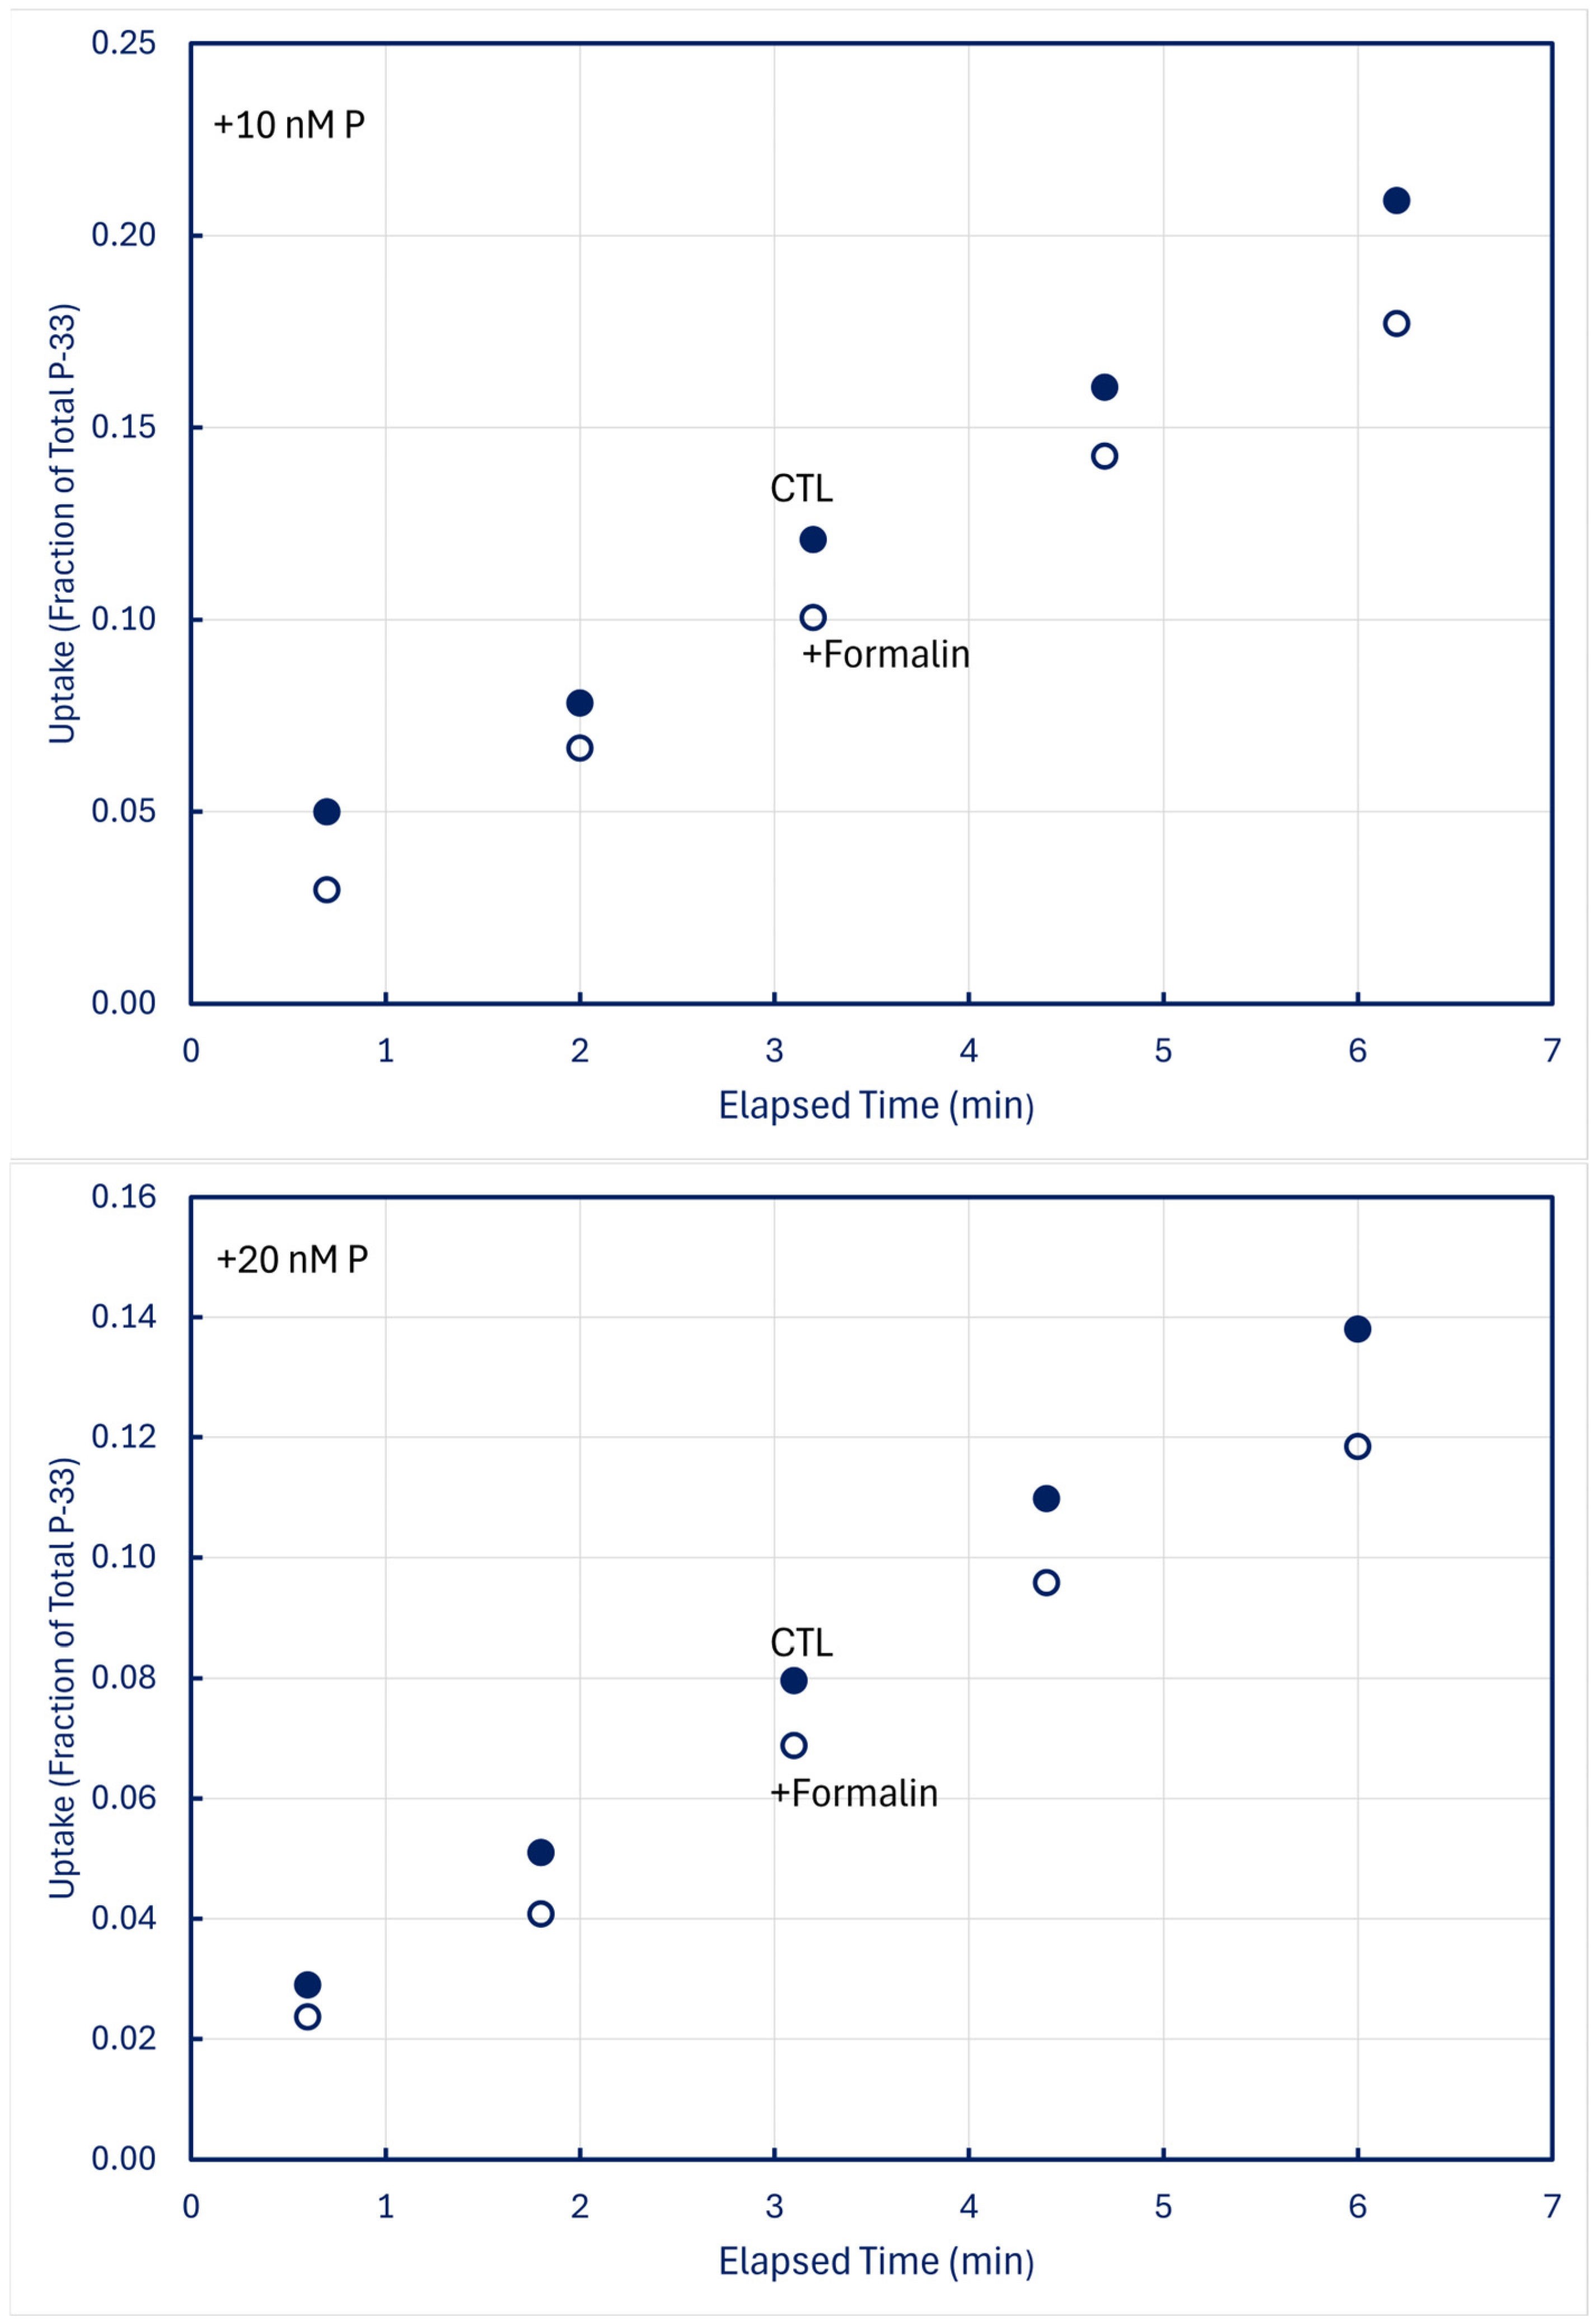
In time-series trials using 100-mL samples in which one 5 mL subsample was filtered live (CTL) and a second 5-mL subsample simultaneously received 0.1 mL formalin (+Formalin) before being filtered, measurable fractions of P-33 retained by CTL organisms were lost into solution when plankton was killed (Figure 8).

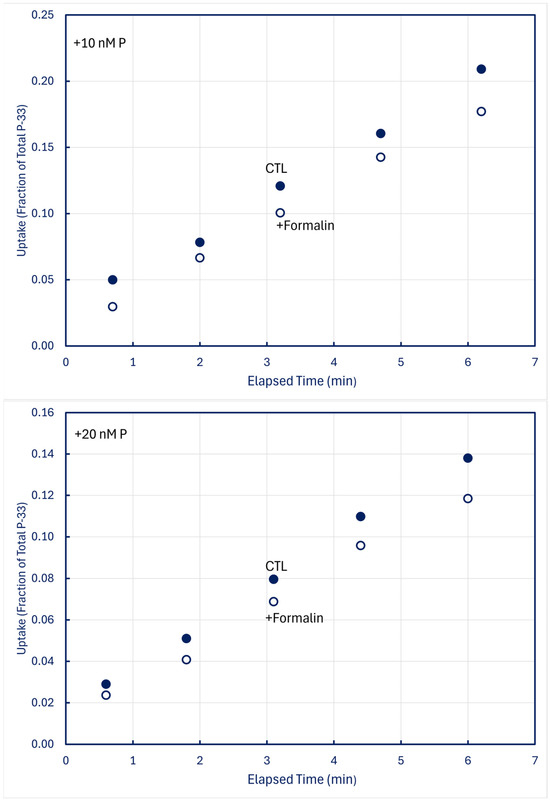
Figure 8.
Time-series uptake and retention of P-33 by particles collected on 0.2 μm filters at station H8; formalin was added to subsamples obtained simultaneously with CTL treatments. Upper panel: unamended (no add) lake water; middle panel: lake water amended with +10 nM P-31 phosphate; lower panel: lake water amended with +20 nM P-31 phosphate.
Formalin-treated reduced retention of P-33 by particles differed among Lakes Huron, Superior, and Michigan (Table 3). With 20 determinations for Lake Huron and 15 each for Lakes Superior and Michigan, one-way analysis of variance detected statistical significance at p < 0.0001. Post-hoc Tukey HSD and Bonferroni pairwise comparisons concurred in finding that Lake Superior differed from both Lake Huron and Lake Michigan (p < 0.01), and that Lakes Michigan and Huron likewise differed (p < 0.05). The differences could not be reliably ascribed to differences in Chl a concentrations (p > 0.06), but they could be ascribed to differences in lake temperature (p < 0.002). Given the working hypothesis that the losses traced to a labile metabolic pool that had not yet been assimilated into structural material by enzymatic processes, the apparent temperature dependence is unsurprising.
Table 3.
Mean and SE of the ratio of P-33 retained on 0.2 μm filters for formalin-killed vs. live subsamples during time-series uptake experiments as illustrated by Figure 8, together with ambient experimental temperatures (C) and Chl a (mg/m3).
3.4. Cold Chase Experiments
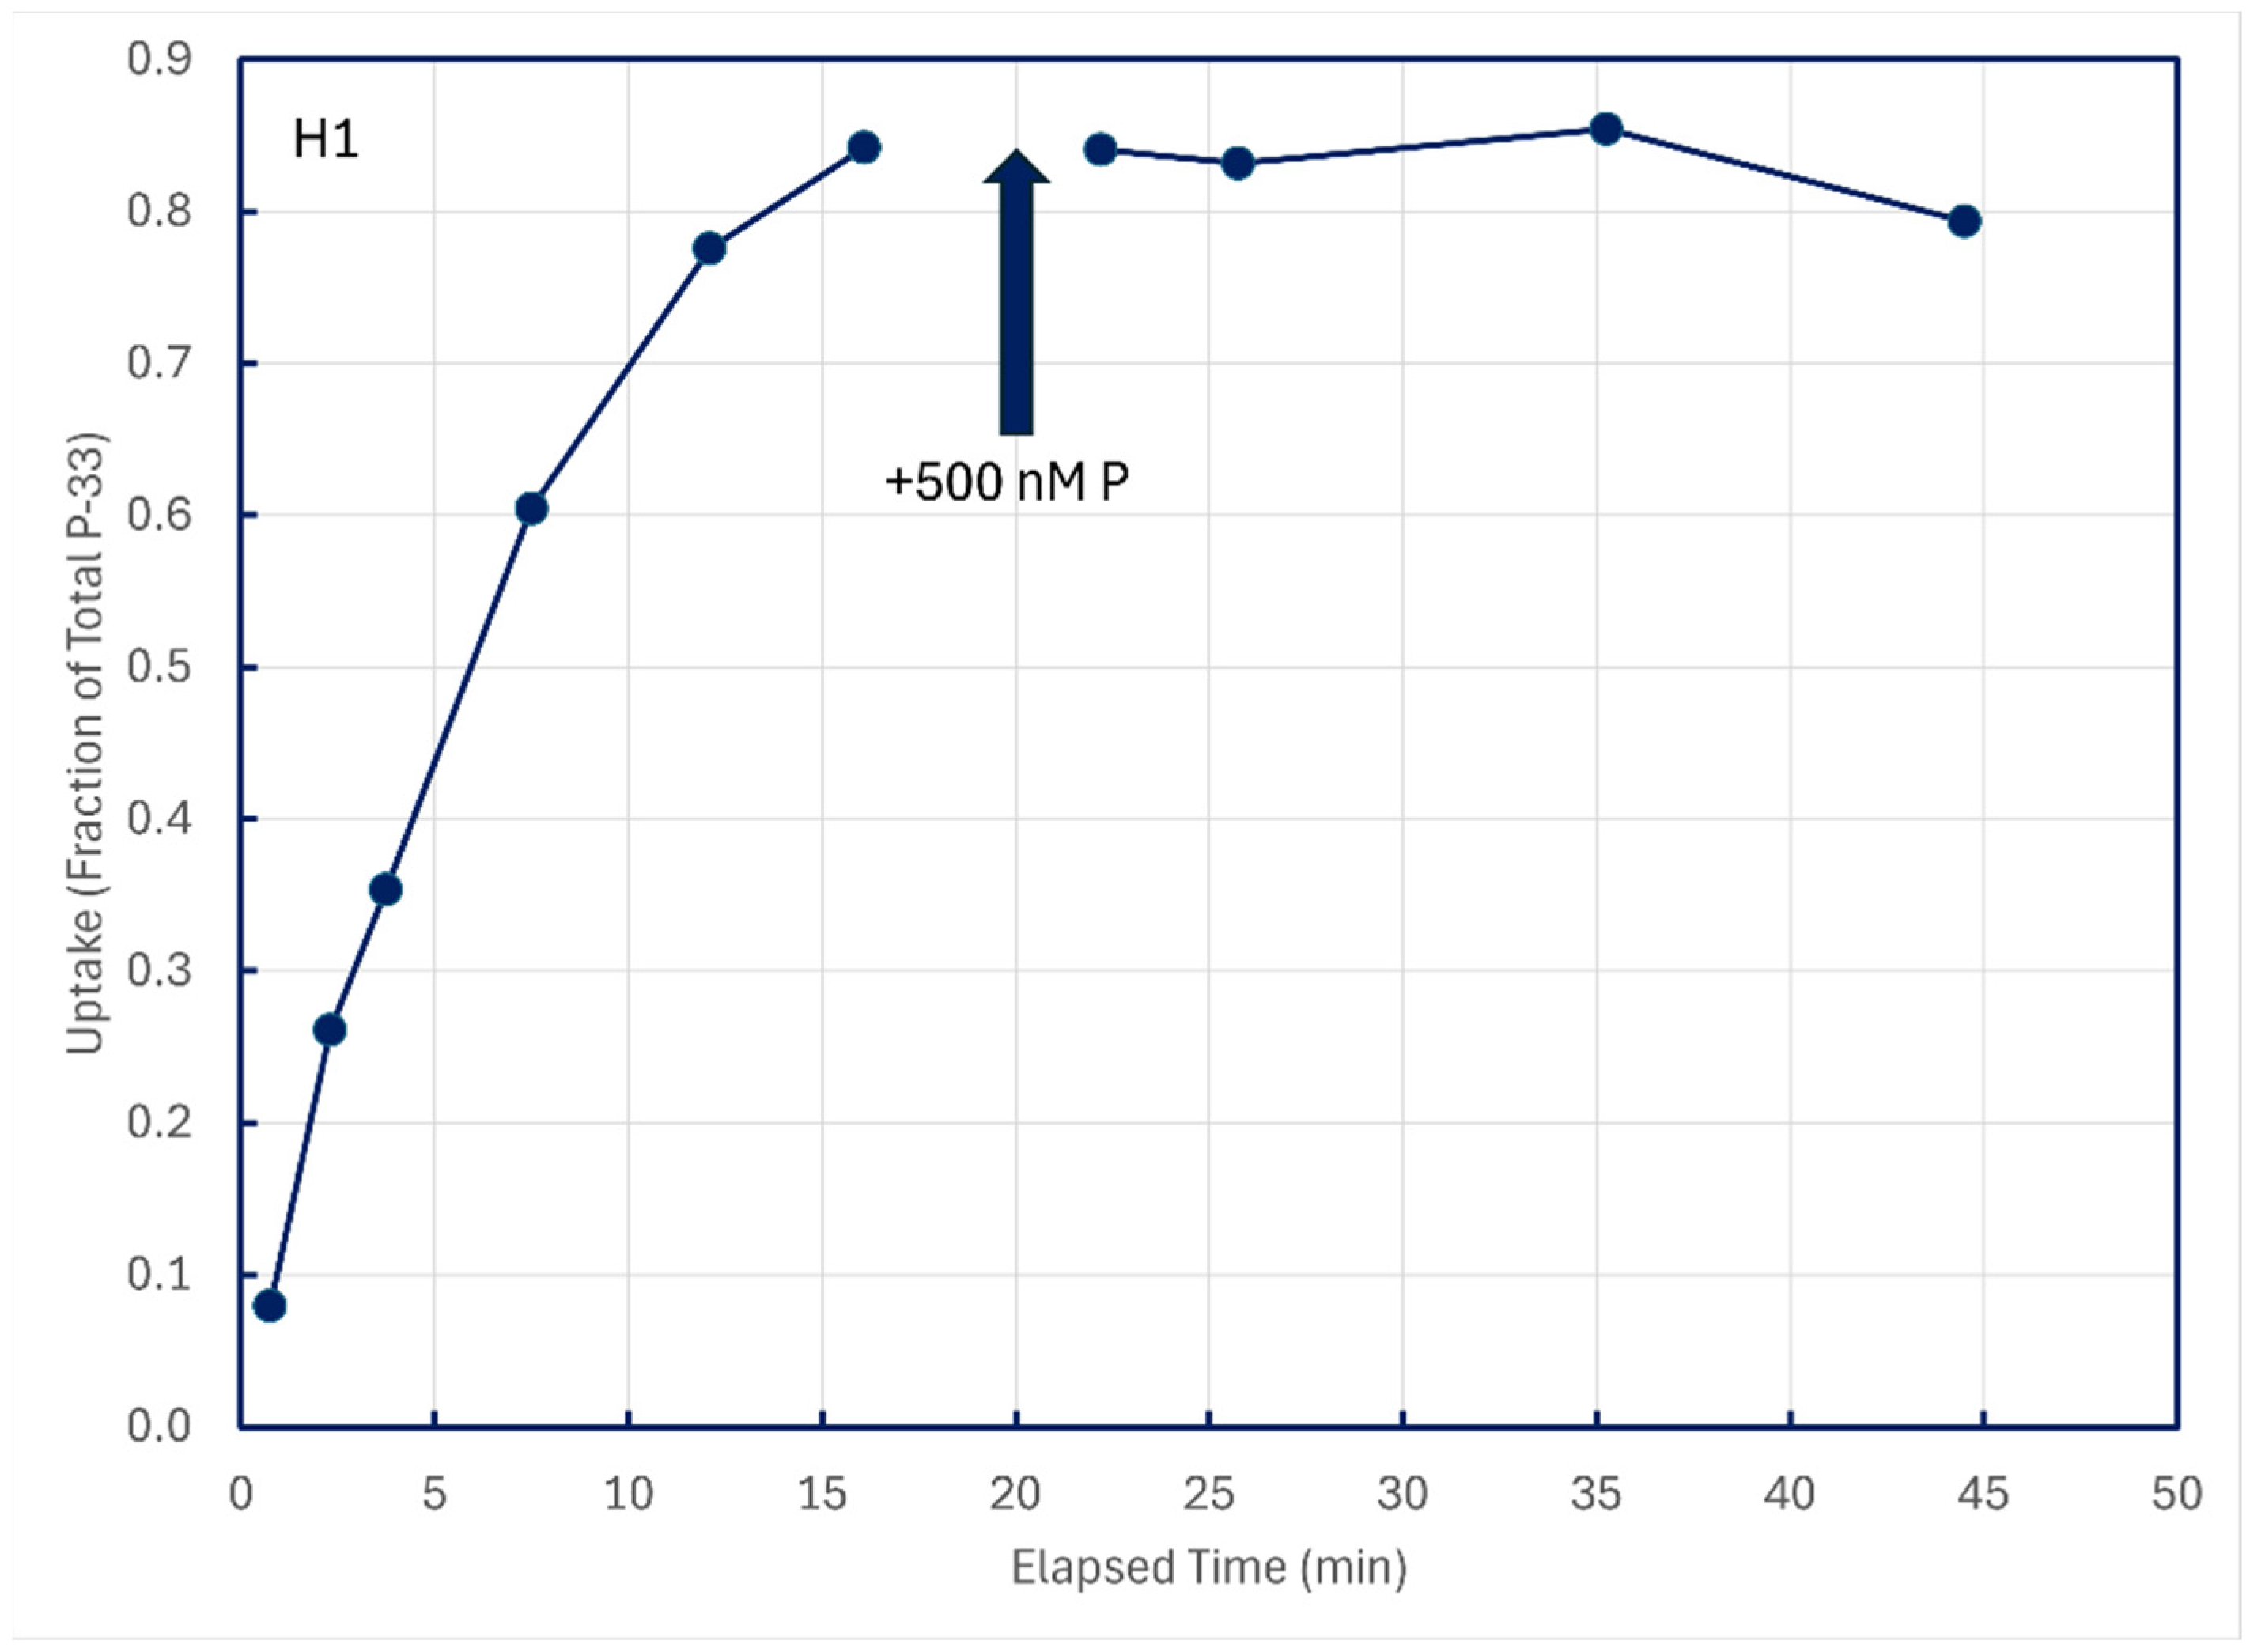
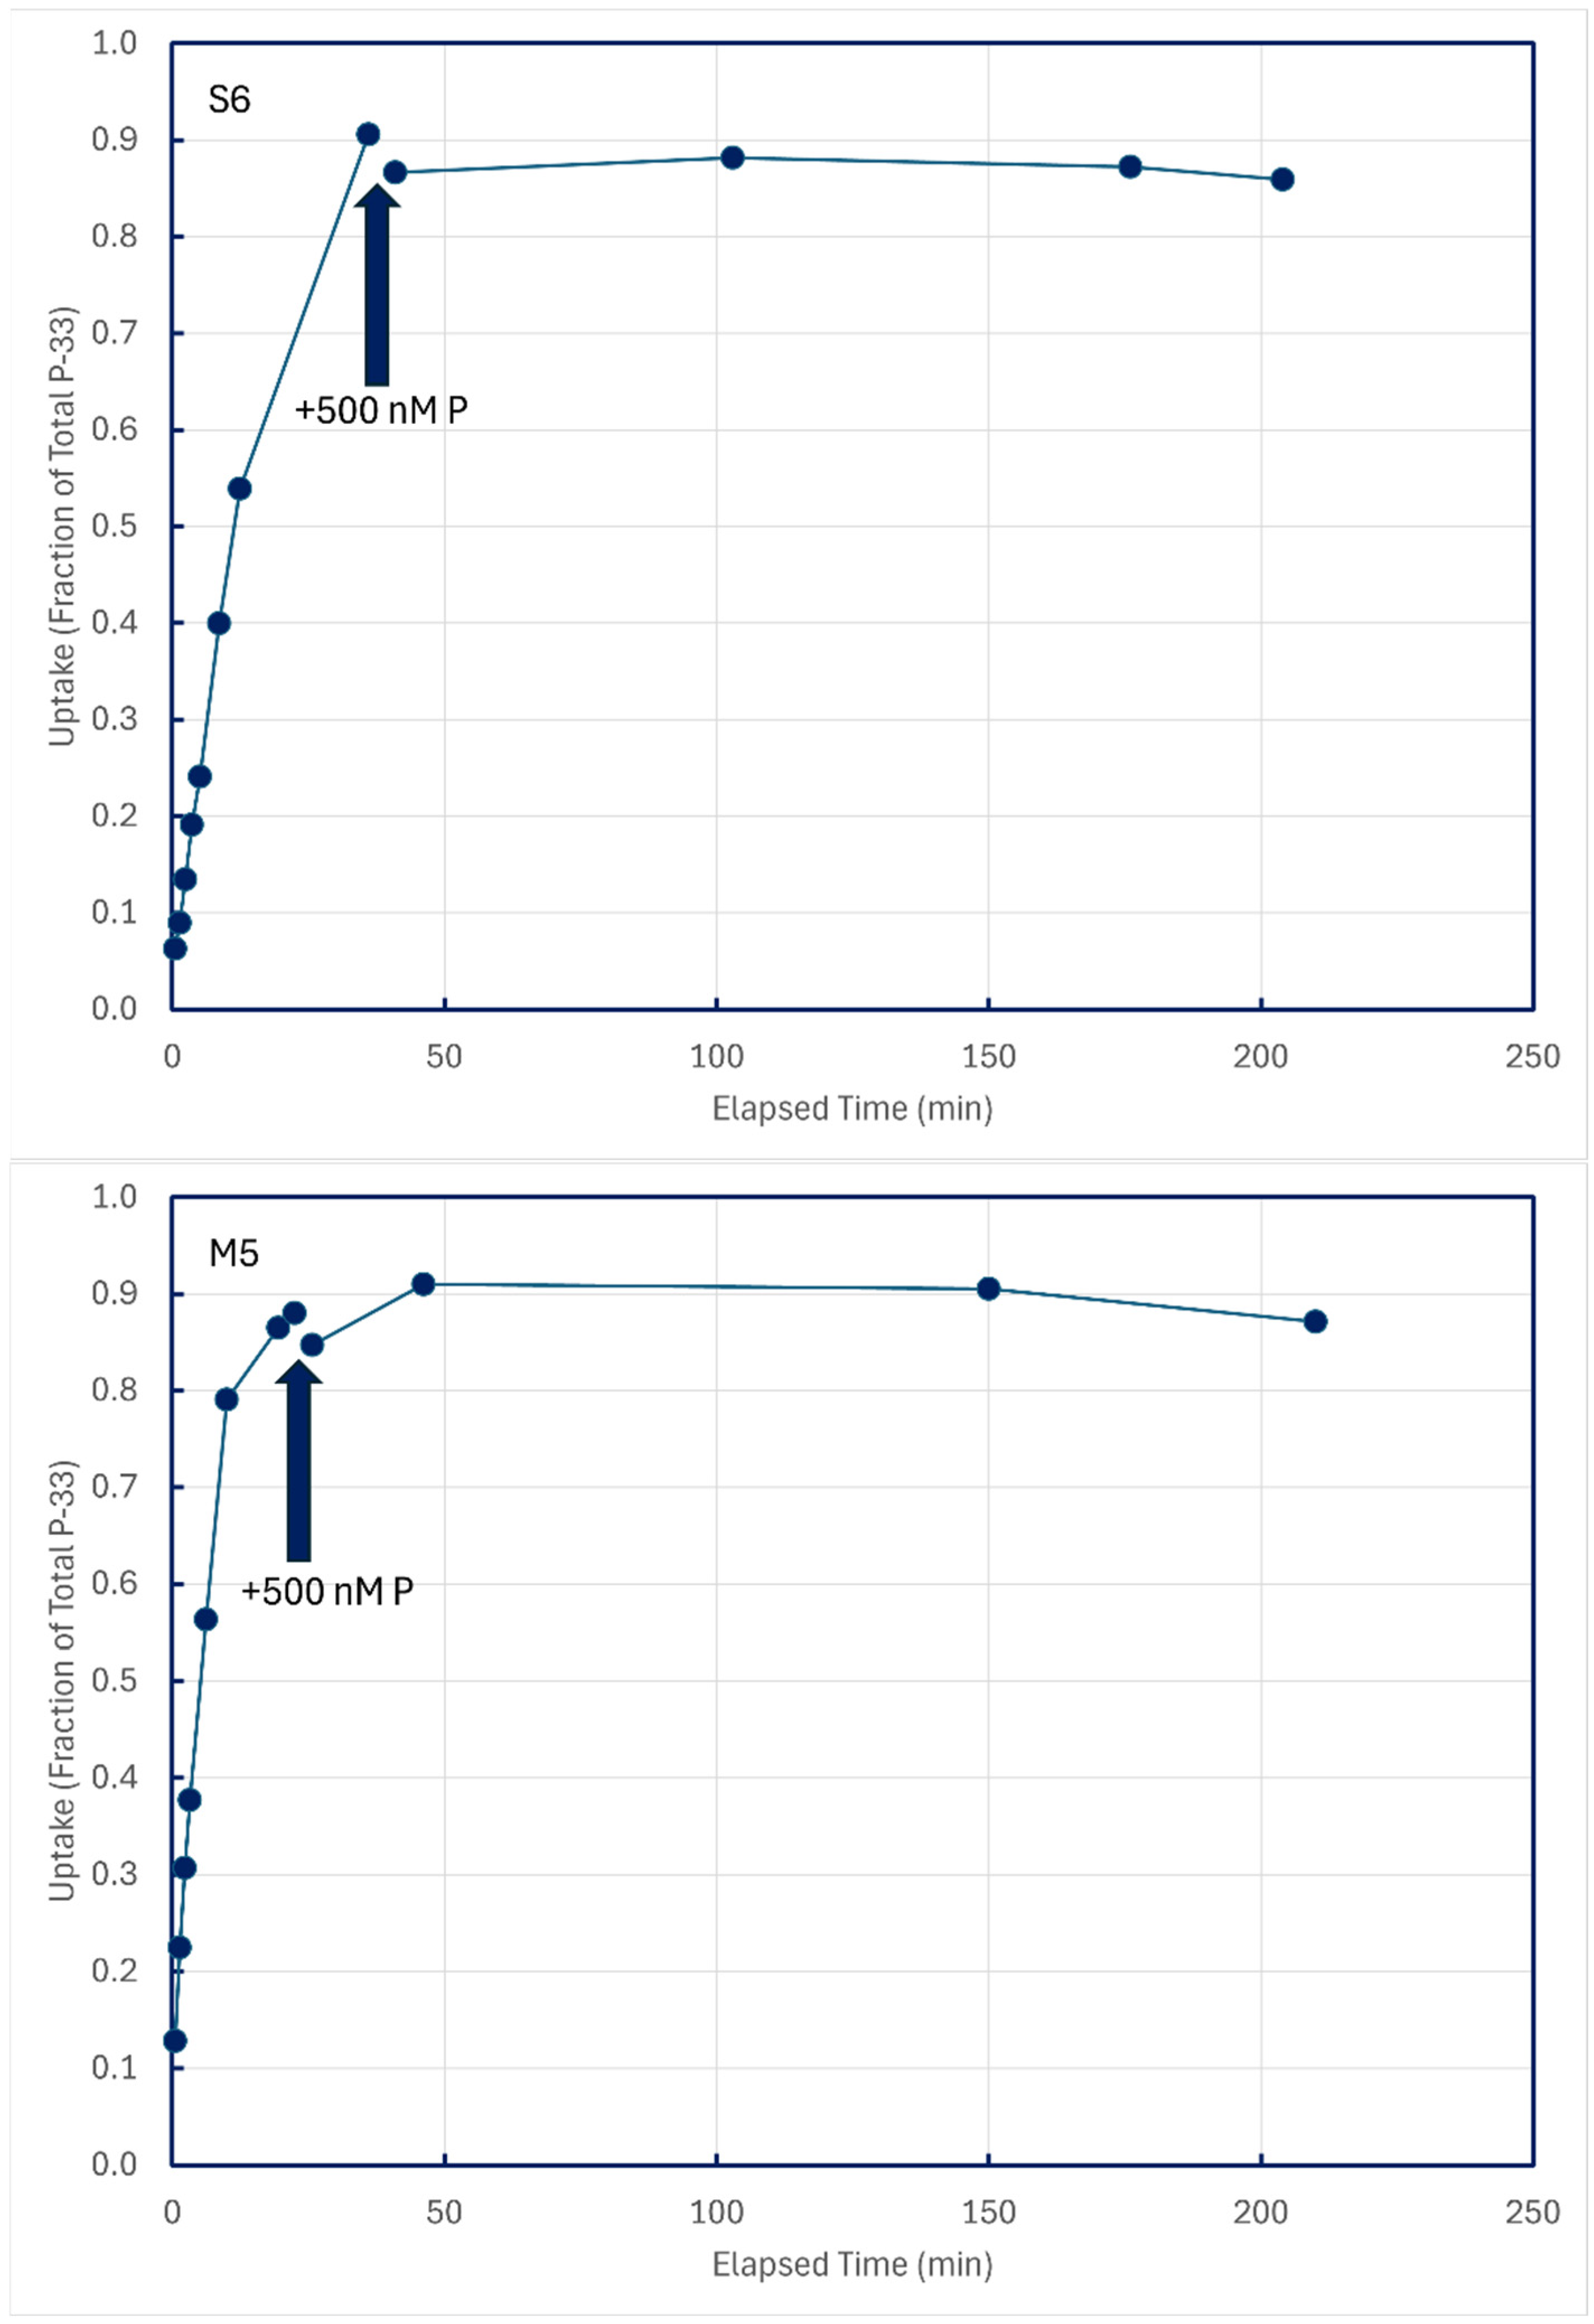
In some experiments with unamended lake water, P-33 isotope addition time series were permitted to approach equilibrium, and then 500 nM P-31 phosphate was added to dilute dissolved pools of P-33. Time-series samples after P-31 addition were collected to see if any P-33 compounds in structural components might be metabolized and excreted back into solution (Figure 9). These figures are illustrative of results from the five lakes summarized in Table 4.
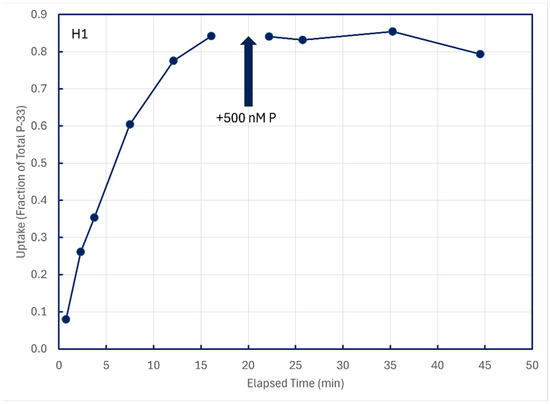
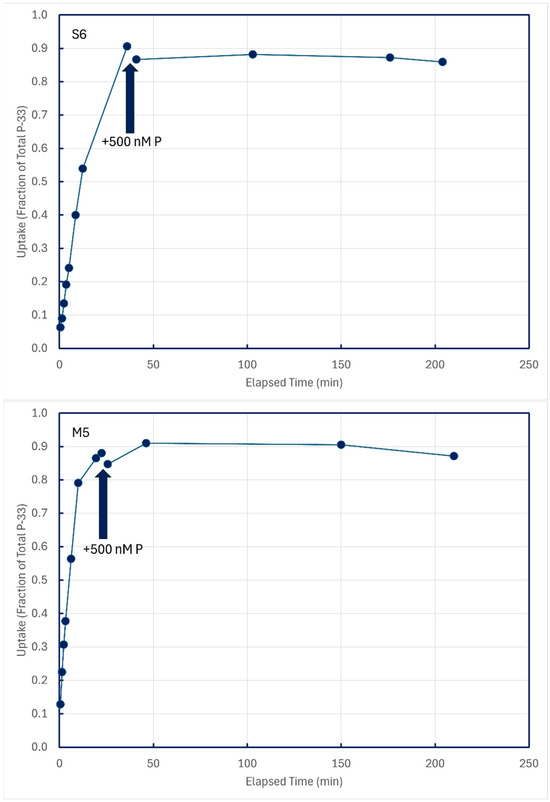
Figure 9.
Cold-chase experiments in which carrier-free P-33 was added to unamended ambient lake water, followed minutes later by addition of 500 nM P-31. All subsamples were filtered through 0.2 μm membranes.
Table 4.
Time-series change in P-33 content of particulates retained on 0.2 μm filters after addition of 500 nM P-31. Bold face denotes statistical significance.
Time-series subsamples collected post-chase addition were analyzed by linear regression to detect decreases in particulate P-33, which could be indicative of the metabolism and excretion of structurally assimilated P-33. Of 12 such experiments conducted on five lakes, statistically significant decreases in particulate P-33 could be detected for only two sampling sites, both in Lake Superior (Table 4).
In both cases, the implied excretion rate of assimilated P-33 was miniscule, about 0.01 percent of assimilated P per minute.
3.5. Estimation of Ambient P0 Concentrations
Experiments like the CTL series shown in Figure 8 provided rates of uptake of carrier-free P-33 added to samples unamended with P-31 as well as to samples that were amended by addition of either 10 nM or 20 nM P-31 phosphate. After obtaining initial approximations of P0 by applying Equations (1)–(5), refined estimates were obtained by iterating putative values for P0 such that the uptake rate constant k0 would be first-order linear for P0, P0 + 10 nM and P0 + 20 nM, as described in Section 2. P0 was determined implicitly by defining the initial slopes of CTL treatments, as shown in Figure 8, as k0, k10, and k20. Uptake rates in mass units were then defined as
nM P/min in no added P treatment = k0 × P0
nM P/min in +10 nM added P treatment = k10 × (P0 + 10)
nM P/min in +20 nM added P treatment = k20 × (P0 + 20)
These three equations were solved using the Excel™ Solver™ function to identify a value of P0 for which the three points defined a straight line (R2 = 1.000).
The P0 concentrations thus deduced are displayed in Table 5. All are within the nM range, but the available data (temperature, Chl a, as well as DP, TP, and PP by conventional acid-molybdate spectrophotometry after acid-persulfate oxidation [12]) do not identify a plausible correlate with their values.
Table 5.
P0 calculated from CTL (no add), +10 nM P, and +20 nM P treatments and calculated uptake rates (nM/min).
Inspection of the data revealed that particles retained on 1.0 µm filters assumed increased proportions of P-33 uptake with P-31 additions (Table 6).
Table 6.
Ratios of P-33 retained on 1.0 μm filters to P-33 retained on 0.2 μm filters for unamended and P-31 amended samples plus paired t-test probabilities comparing unamended ratios to each P-31 amended ratio.
These data imply that phytoplankton becomes increasingly responsible for P uptake as concentrations are elevated above ambient levels when the initial steady state is perturbed. Given the results shown in Figure 6, P0 values reported in Table 5 are probably just approximations, because steady state turnover rates decline with increasing ratios of 1.0 μm to 0.2 μm P-33 filter retention. The linear trendline displayed in Figure 6 accounts for only 41 percent of the data variation, and the SE of its slope is 21 percent of its mean value, so use of the trendline slope to correct P-33 turnover rates is unreliable, especially because there is also evidence of temperature dependence of turnover rates in Lake Superior (Figure 4).
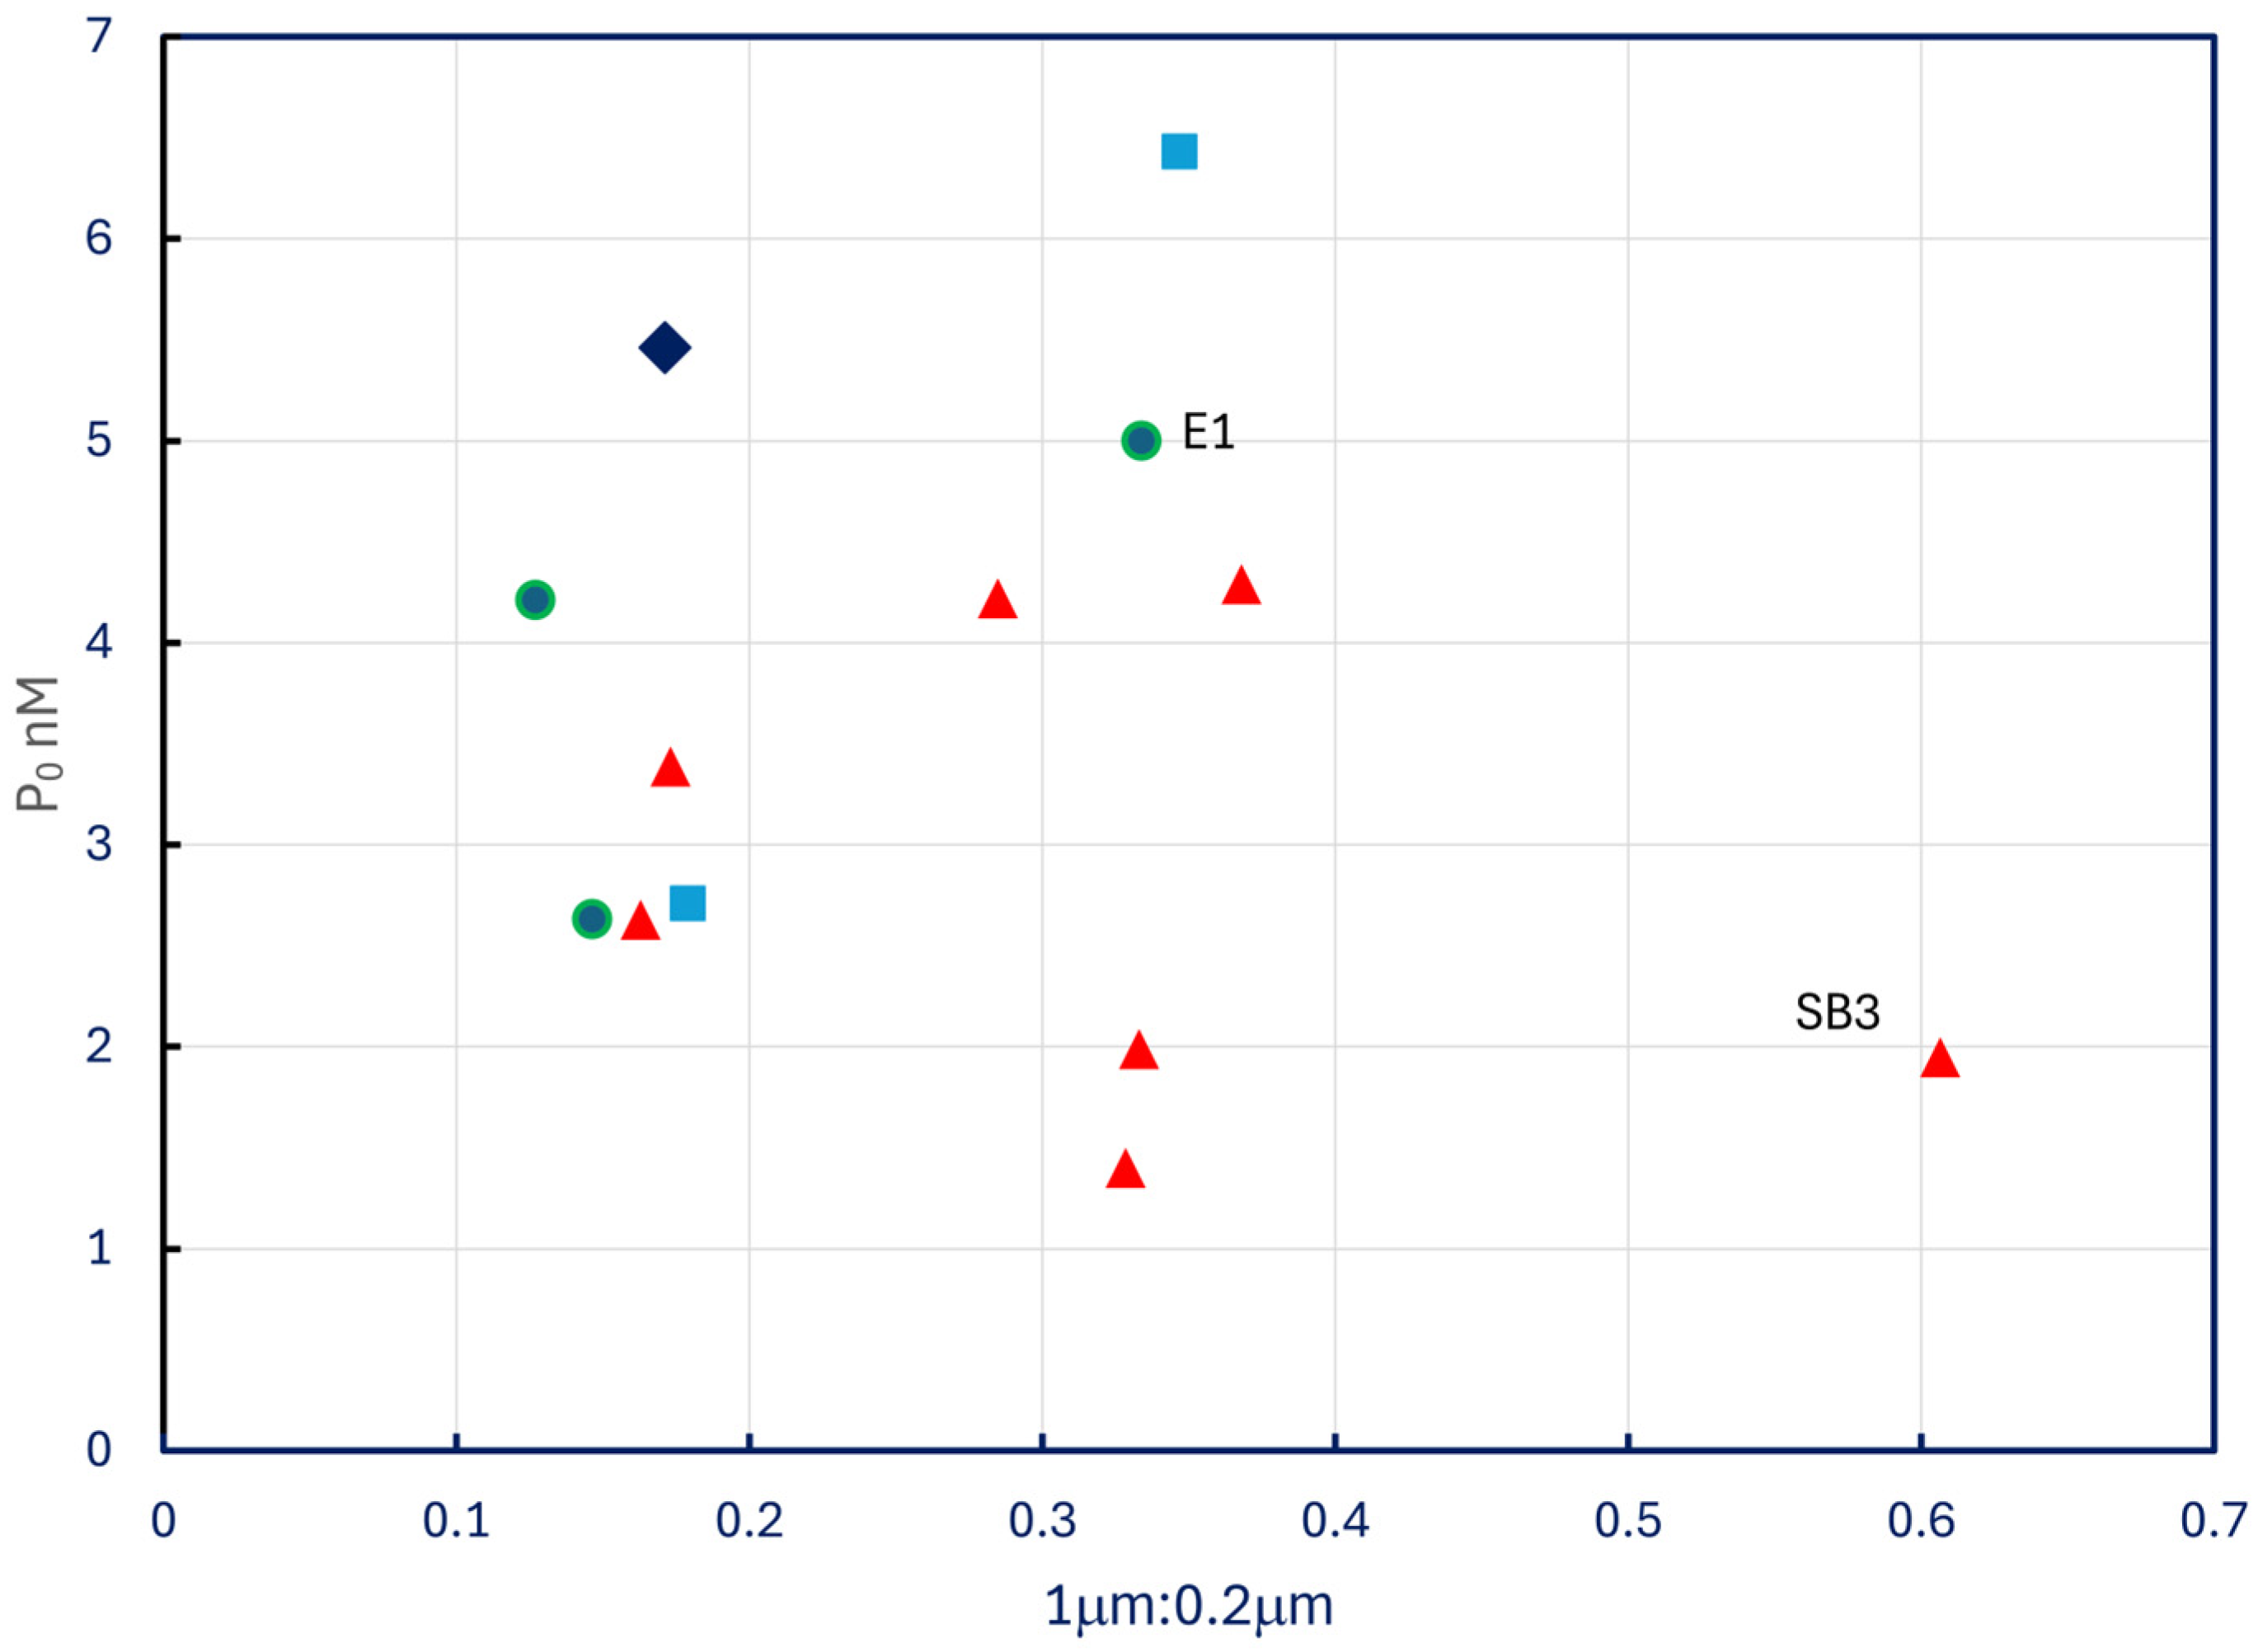
The P0 estimates reported in Table 5 do not display any pattern with respect to P-33 retention ratios in no add treatments (Figure 10), nor do they correlate with temperature (p = 0.8) or Chl a (p = 0.4). The two most eutrophic sites sampled, extreme western Lake Erie (E1) and lower Saginaw Bay (SB3), exhibited P0 values among the highest and the lowest in the dataset.
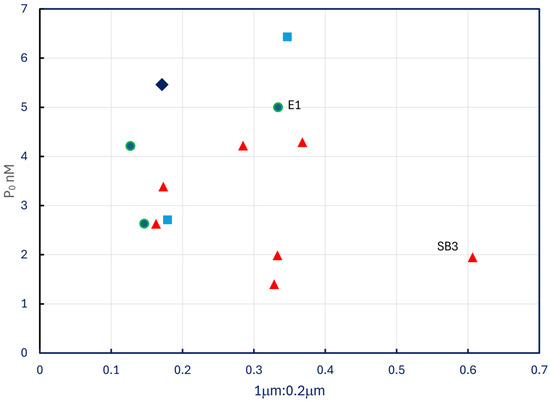
Figure 10.
Estimated P0 plotted against ratios of P-33 retained by 1.0 μm filters to P-33 retained by 0.2 μm filters. Symbols as in Figure 4.
4. Discussion
Ambient P0 concentrations measured by radiotracer in this study (2.7 and 6.4 nM) compare favorably with the most sensitive chemical analytical determinations performed more recently for Lake Superior [24], most notably results obtained by magnesium-induced coprecipitation [21], but they are lower than values reported for outer Green Bay and cited by the U.S. EPA for lakes Michigan, Superior, Huron, and Erie [22] (Table 1). The P0 value for offshore Lake Michigan (5.5 nM) is about one-half that of a more recent report for the offshore lake [25].
Most studies in mesotrophic and oligotrophic lakes, including the Great Lakes, conclude that bacteria sequester most available phosphate at ambient concentrations [26,27,28,29] owing to their higher surface-to-volume ratios compared to phytoplankton. Increased proportional uptake of phosphate by phytoplankton when ambient concentrations are elevated is a common observation, as demonstrated again in this study. Some authors have ascribed those observations to the fact that bacterial uptake of phosphate becomes saturated at low concentrations, possibly because their metabolism is limited by organic carbon [28]. Along a transect from inner Saginaw Bay to offshore Lake Huron in 2002, bacterioplankton productivity was higher relative to phytoplankton productivity in the oligotrophic offshore, although the highest rates of phosphate turnover were observed within Saginaw Bay [29]. Those results are contrary to the observations reported in this study (Figure 6), in that inner Saginaw Bay showed a lower rate of phosphate turnover than offshore Lake Huron. As in that previous report [29], however, phosphate uptake into phytoplankton (>1.0 μm particles) was highest in inner Saginaw Bay, where Chl a concentrations were elevated with respect to the rest of Lake Huron (Figure 5).
The fact that temperature dependence of P turnover rates was evident in Lake Superior and not in the other lakes may simply reflect the fact that the range of ambient temperatures encountered in Lake Superior was far greater than in any of the other lakes. Evidence that turnover is biological (Figure 7) and thus is enzymatic implies that temperature effects should be expected. Existence of those temperature effects is reinforced by the results in Table 3, which imply slower rates of assimilation of P from a labile pool into a more stable structural pool at the cooler temperatures of Lake Superior. The reason that experiments were conducted at ambient temperature rather than at a fixed temperature has precedence [29], and it avoids the potential problem of temperature shock and acclimation effects.
The range of P0 concentrations encountered in this study, roughly 1 to 7 nM, is within the range reported recently for Lake Superior [21,24], although the measurements were obtained by different methodologies. It would be instructive, therefore, if future studies could compare radiochemical and standard chemical assays to learn if the methodologies produce comparable results. The increased uptake into phytoplankton particles with even 10 nM P enrichment above ambient (Table 6) admittedly injects an unknown amount of uncertainty into the method used to estimate P0. The estimated values may thus be more analogous to what Rigler [18] called maximum likely phosphate concentrations.
If changing temperatures and land use are increasing the proportion of total phosphorus that enters the Great Lakes as inorganic phosphate [1], the results reported here reinforce concerns that phytoplankton may increasingly dominate phosphate metabolism at ambient concentrations, with the prospect of increasingly frequent and intense algal blooms in the future, as those authors suggest.
5. Conclusions
The historical data reported in this paper represent a baseline against which current and future phosphate dynamics by bacterioplankton and phytoplankton can be evaluated in the St. Lawrence Great Lakes. The results demonstrate that bacterioplankton generally dominated orthophosphate kinetics at ambient concentrations in the nanomolar range, but that phytoplankton exhibited increasing dominance with additions of as little as 10 nM P.
Funding
This research was supported by grants to J.T. Lehman from the U.S. National Science Foundation Biological Oceanography Program OCE92-07945 and OCE95-08087. The retrospective analyses performed in this publication were funded by the University of Michigan Office of the Provost.
Institutional Review Board Statement
Not applicable.
Informed Consent Statement
Not applicable.
Data Availability Statement
The data are contained within this article.
Acknowledgments
The author is grateful to the captain and crew of the R/V Laurentian for their assistance in sample collection.
Conflicts of Interest
The author declares no conflicts of interest. The funders had no role in the design of the study, in the collection, analyses or interpretation of data, in the writing of the manuscript, or in the decision to publish the results.
References
- Singh, N.K.; Van Meter, K.J.; Basu, N.B. Widespread increases in soluble phosphorus concentrations in streams across the transboundary Great Lakes Basin. Nat. Geosci. 2023, 16, 893–900. [Google Scholar] [CrossRef]
- Barbiero, R.P.; Lesht, B.M.; Warren, G.J. Convergence of trophic state and the lower food web in Lakes Huron, Michigan, and Superior. 2012. J. Great Lakes Res. 2012, 38, 368–380. [Google Scholar] [CrossRef]
- Barbiero, R.P.; Rudstam, L.G.; Watkins, J.M.; Lesht, B.M. A cross-lake comparison of crustacean zooplankton communities in the Laurentian Great Lakes, 1997–2016. J. Great Lakes Res. 2019, 45, 672–690. [Google Scholar] [CrossRef]
- Bunnell, D.B.; Barbiero, R.P.; Ludsin, S.A.; Madenjian, C.P.; Warren, G.J.; Dolan, D.M.; Brenden, T.O.; Briland, R.; Gorman, O.T.; He, J.X.; et al. Changing ecosystem dynamics in the Laurentian Great Lakes: Bottom-Up and Top-Down regulation. Bioscience 2014, 64, 26–39. [Google Scholar] [CrossRef]
- Pothoven, S.A.; Vanderploeg, H.A. Variable changes in zooplankton phenology associated with the disappearance of the spring phytoplankton bloom in Lake Michigan. Freshw. Biol. 2021, 67, 365–377. [Google Scholar] [CrossRef]
- Pothoven, S.A.; Fahnenstiel, G.L. Spatial and temporal trends in zooplankton assemblages along a nearshore to offshore transect in southeastern Lake Michigan from 2007 to 2012. J. Great Lakes Res. 2014, 41, 95–103. [Google Scholar] [CrossRef]
- Bunnell, D.B.; Keeler, K.M.; Puchala, E.A.; Davis, B.M.; Pothoven, S.A. Comparing seasonal dynamics of the Lake Huron zooplankton community between 1983–1984 and 2007 and revisiting the impact of Bythotrephes planktivory. J. Great Lakes Res. 2012, 38, 451–462. [Google Scholar] [CrossRef]
- Barbiero, R.P.; Bunnell, D.B.; Rockwell, D.C.; Tuchman, M.L. Recent increases in the large glacial-relict calanoid Limnocalanus macrurus in Lake Michigan. J. Great Lakes Res. 2009, 35, 285–292. [Google Scholar] [CrossRef]
- Barbiero, R.P.; Balcer, M.; Rockwell, D.C.; Tuchman, M.L. Recent shifts in the crustacean zooplankton community of Lake Huron. Can. J. Fish. Aquat. Sci. 2009, 66, 816–828. [Google Scholar] [CrossRef]
- Bunnell, D.B.; Davis, B.M.; Warner, D.M.; Chriscinske, M.A.; Roseman, E.F. Planktivory in the changing Lake Huron zooplankton community: Bythotrephes consumption exceeds that of Mysis and fish. Freshw. Biol. 2011, 56, 1281–1296. [Google Scholar] [CrossRef]
- Lehman, J.T. St. Lawrence Great Lakes Dataset [Data set], University of Michigan—Deep Blue Data 2024. Available online: https://deepblue.lib.umich.edu/data/concern/data_sets/fx719n39v (accessed on 26 February 2025).
- Lehman, J.T. Historical Upper Great Lakes dataset: Introduction and analyses. J. Great Lakes Res. 2025, 51, 102464. [Google Scholar] [CrossRef]
- Lehman, J.T.; Burgess, S. Stable isotope analysis of planktonic lower food webs of Lakes Erie, Huron, Michigan and Superior. Limnol. Rev. 2024, 24, 506–519. [Google Scholar] [CrossRef]
- Rigler, F.H. Further observations inconsistent with the hypothesis that the molybdenum blue method measures orthophosphate in lakewater. Limnol. Oceanogr. 1968, 13, 7–13. [Google Scholar] [CrossRef]
- Tarapchak, S.J.; Herche, L.R. Phosphate uptake by microorganisms in lake water: Deviations from simple Michaelis-Menten kinetics. Can. J. Fish. Aquat. Sci. 1986, 43, 319–328. [Google Scholar]
- Tarapchak, S.J.; Herche, L.R. Orthophosphate concentrations in lake water; Analysis of Rigler’s radiobioassay method. Can. J. Fish. Aquat. Sci. 1988, 45, 2230–2237. [Google Scholar] [CrossRef]
- Effler, S.W.; Prestigiacomo, A.R.; Hairston, N.G.; Auer, M.T.; Kuczynski, A.; Chapra, S.C. Dissolved phosphorus concentrations in Cayuga Lake system and differences from two analytical protocols. Lake Res. Manag. 2016, 32, 392–401. [Google Scholar] [CrossRef]
- Rigler, F.H. Radiobiological analysis of inorganic phosphorus in lakewater. Verh. Int. Ver. Limnol. 1966, 16, 486–489. [Google Scholar]
- Wen, Y.H.; Vezina, A.; Peters, R.H. Allometric scaling of compartmental fluxes of phosphorus in freshwater algae. Limnol. Oceanogr. 1997, 42, 45–56. [Google Scholar] [CrossRef]
- Karl, D.M.; Tien, G. MAGIC: A sensitive and precise method for measuring dissolved phosphorus in aquatic environments. Limnol. Oceanogr. 1992, 37, 105–116. [Google Scholar]
- Anagnostou, E.; Sherrell, R.M. MAGIC method for subnanomolar orthophosphate determination in freshwater. Limnol. Oceanogr. Methods 2008, 6, 64–74. [Google Scholar] [CrossRef]
- Lin, P.; Klump, J.V.; Guo, L. Dynamics of dissolved and particulate phosphorus influenced by seasonal hypoxia in Green Bay, Lake Michigan. Sci. Total Environ. 2016, 541, 1070–1082. [Google Scholar] [CrossRef]
- Baehr, M.M.; McManus, J. The measurement of phosphorus and its spatial and temporal variability in the western arm of Lake Superior. J. Great Lakes Res. 2003, 29, 479–487. [Google Scholar]
- Sterner, R.W. The Laurentian Great Lakes: A biochemical test bed. Annu. Rev. Earth Planet. Sci. 2021, 49, 201–229. [Google Scholar] [CrossRef]
- Lin, P.; Guo, L. Dynamic changes in the abundance and chemical speciation of dissolved and particulate phosphorus across the river-lake interface in southwest Lake Michigan. Limnol. Oceanogr. 2016, 61, 771–789. [Google Scholar] [CrossRef]
- Paerl, H.W.; Lean, D.R.S. Visual observations of phosphorus movement between algae, bacteria, and abiotic particles in lake water. J. Fish. Res. Board Can. 1976, 33, 2805–2813. [Google Scholar]
- Currie, D.J.; Kalff, J. The relative importance of bacterioplankton and phytoplankton in phosphorus uptake in freshwater. Limnol. Oceanogr. 1984, 29, 311–321. [Google Scholar] [CrossRef]
- Cotner, J.B.; Wetzel, R.G. Uptake of dissolved inorganic and organic phosphorus compounds by phytoplankton and bacterioplankton. Limnol. Oceanogr. 1992, 37, 232–243. [Google Scholar]
- Heath, R.T.; Munawar, M. Significance of the microbial food web to carbon and phosphorus dynamics in Lake Huron. Verh. Int. Ver. Limnol. 2006, 29, 1199–1202. [Google Scholar] [CrossRef]
Disclaimer/Publisher’s Note: The statements, opinions and data contained in all publications are solely those of the individual author(s) and contributor(s) and not of MDPI and/or the editor(s). MDPI and/or the editor(s) disclaim responsibility for any injury to people or property resulting from any ideas, methods, instructions or products referred to in the content. |
© 2025 by the author. Licensee MDPI, Basel, Switzerland. This article is an open access article distributed under the terms and conditions of the Creative Commons Attribution (CC BY) license (https://creativecommons.org/licenses/by/4.0/).