1. Introduction
Lake ecosystems are among the most important ecosystems on Earth, providing essential habitats for a wide range of flora and fauna and playing a crucial role in maintaining biodiversity and ecological balance. Additionally, lakes play an indispensable role in biogeochemical cycles [
1]. However, in recent years, due to intensified global climate change and human activities, lake ecosystems have been facing unprecedented pressure. The rising temperatures, changes in precipitation cycles, and extreme weather events induced by global climate change have had profound impacts on the hydrological characteristics of lakes [
2,
3]. Simultaneously, substantial nutrient loads from human activities have aggravated the problem of lake eutrophication. These combined factors make the ecological balance of lake ecosystems increasingly fragile, severely threatening their biodiversity.
The change in nutrient load is currently one of the major environmental problems commonly faced by lakes globally, which can have a serious impact on the health and functions of lake ecosystems [
4]. The massive accumulation of nutrients in water bodies, especially nitrogen and phosphorus, leads to an increase in the primary productivity of water bodies and can trigger a series of adverse ecological consequences [
5,
6]. In the early stage, research on the changes in lake nutrient load mainly focused on identifying the causes of eutrophication, especially the input pathways of nitrogen and phosphorus and their impacts on the primary productivity of lakes [
7]. In recent years, more research has focused on how to control lake eutrophication by adjusting watershed management and reducing nutrient inputs [
8]. The intensification of the eutrophication process is not only closely related to human activities, but climate change is also regarded as one of the important driving factors for the aggravation of eutrophication. Factors such as rising temperatures and changes in precipitation patterns can all alter the nutrient cycle in water bodies and affect the changes in lake nutrient load [
9,
10,
11]. In recent years, in response to the main problem of eutrophication, a large number of studies have proposed methods of ecological restoration, such as restoring aquatic plants and benthic invertebrates, to improve the self-purification capacity of lakes and thus slow down the process of eutrophication [
12,
13]. At the same time, an increasing number of researchers have begun to explore ecosystem-based methods to enhance the resilience of lake ecosystems and thus restore the health of lakes [
14,
15,
16]. Currently, the impact mechanism of climate change on eutrophication is one of the hotspots in current research. A large number of studies believe that rising temperatures and extreme weather events will increase the risk of lake nutrient fluctuations [
17,
18].
The occurrence of the El Niño phenomenon triggers a series of abnormal climate changes, which can affect the water quality of the bottom water in estuarine lakes through various channels. During the El Niño period, the water environment temperature will experience abnormal fluctuations. Generally, as the surface water temperature of the lake rises, the original thermal stratification structure will change, and the vertical mixing process of the lake water will be disrupted, thus hindering the circulation of nutrients. The El Niño phenomenon can also significantly alter the precipitation pattern. For example, in some areas, precipitation may increase abnormally, and a large amount of rainwater will flow into the lake, carrying terrestrial nutrients into the lake as well. This leads to fluctuations in the concentration of nutrients in the water body and disrupts the balance of the lake ecosystem. The El Niño phenomenon not only affects the hydrological characteristics of the lake but also further influences the distribution and population dynamics of aquatic organisms [
19,
20]. For instance, the rise in temperature will accelerate the water stratification and reduce the dissolved oxygen content, resulting in an aggravation of the hypoxia problem at the bottom of the lake. This poses a serious threat to the benthic organisms and fish in the lake [
21,
22].
Among various types of lakes, estuarine lakes are rather unique. Different from other types of lakes, their water bodies are influenced by both freshwater rivers and the ocean. The salinity of the water shows seasonal variations and spatial differences, which has formed a unique ecosystem in estuarine lakes. Due to the spatial differences in salinity, different habitats are formed between the bottom and the surface of estuarine lakes. As a crucial component of the bottom habitat of the lake, the bottom water is home to numerous organisms. The fluctuations in its water quality directly affect the stability of the benthic biological community in the lake.
Currently, with the intensification of extreme climate changes, it is necessary for people to understand as much as possible the possible connections between the changes in the lake ecological environment and climate change. If the possible connections are not well-understood, it will be difficult to comprehensively grasp the evolution laws of the estuarine lake ecosystem under the background of climate change. This will further increase the difficulty of the environmental management of estuarine lakes and affect the sustainable utilization of the ecological resources of this type of lake by humans.
Lake Nakaumi is located on the side of Honshu Island in Japan facing the Sea of Japan. It is a typical estuarine lake with a water area of 86.3 square kilometers, a maximum depth of 16 m, and an average water depth of 5.4 m. Lake Nakaumi is connected to the Sea of Japan through the Sakai Channel, and to the west, it is connected to Lake Shinji via the Ohhashi River. The Hii River, which is connected to Lake Shinji, is the main source of fresh water for Lake Nakaumi. The amount of water exchanged between Lake Nakaumi and the open sea is relatively small, and the vertical mixing of water bodies is most significantly restricted in summer. Affected by both seawater and fresh water, there is a difference in salinity in the vertical direction of Lake Nakaumi, forming a halocline. The salinity of the surface layer is about one-third that of seawater, while the bottom layer is closer to that of seawater. The average surface salinity is about 12–16 psu, and the bottom salinity is around 25–30 psu. The halocline stratification is most obvious in summer [
23,
24]. As one of the most important lake ecosystems along the coast of the Sea of Japan, it nurtures rich biological resources and is of great significance for maintaining regional ecological diversity. Taking Lake Nakaumi as an example, this paper aims to demonstrate the possible fluctuations in the nutrients of the bottom water of estuarine lakes during the occurrence of the El Niño phenomenon and propose feasible coping strategies based on this. It provides certain references for water resource management departments and policymakers. At the same time, it lays a foundation for maintaining the health and stability of the estuarine lake ecosystem and realizing the sustainable utilization of natural resources. Due to the extremely complex factors affecting the water quality changes in the bottom water of estuarine lakes, there are also many deficiencies in the analysis of this paper. It is hoped that this paper can attract the attention of researchers to the research on the response patterns of water nutrient load changes caused by extreme climate changes.
2. Materials and Methods
The data used in this study were obtained from the monitoring data of the Izumo River Office, Ministry of Land, Infrastructure, Transport and Tourism of Japan, spanning from 2013 to 2017. This period includes the most recent strong El Niño event (spring 2014 to spring 2016) [
25]. Data collection was conducted four times a year, covering winter, spring, summer and autumn seasons, with specific sampling months being February (winter), May (spring), August (summer), and November (autumn). The dataset includes Total Nitrogen (TN), TP, NH
4-N, NO
3-N, NO
2-N, and DPO
4-P from four sampling sites in Lake Nakaumi: the lake center, Yonago Bay center, Nagami-cho, and Kamiubeo-cho [
26]. The water depth at the observation points varies to some extent over time. The sampling depth is 1 m above the lake bottom at the water location of the observation points. Detailed information about the sampling depth can be obtained on the website of the Izumo River Office. Although the locations of the Nagami-cho and Kamiubeo-cho observation points are close to the estuary, there are dikes around the sampling points. The Yonago Bay center observation point is located in the center of Yonago Bay, far from rivers and the estuary. The lake center observation point is located in the center of the lake, at a certain distance from the river, and there are islands between it and the estuary so it is not directly affected by the river and seawater either. Judging from the data over the years, in terms of temperature and dissolved oxygen, there are no significant differences in temperature and dissolved oxygen conditions among the four observation points in the same season. As for the content analyzed in this paper, the sampling conditions of the four sampling points can be considered relatively similar. Therefore, for this study, it is appropriate to calculate the average value of a certain nutrient parameter at these four observation points at a certain time to represent the overall condition of this nutrient parameter in Lake Nakaumi at that time.
Based on the above data, this study conducted trend analysis and significance testing on sampling results from different times to explore the nutrient fluctuations in the lake’s bottom water under the influence of the El Niño phenomenon.
Trend analysis is a method used to identify patterns in data over time, revealing long-term directions and periodic characteristics of sampling results. Significant difference analysis is a statistical method used to determine whether differences between two or more data groups are statistically significant. In this study, the Kruskal–Wallis test was used, which is a non-parametric statistical method for comparing median differences between three or more independent samples to assess whether they originate from the same distribution. This method provides an intuitive understanding of the seasonal distribution of nutrient concentrations in the bottom waters of Lake Nakaumi in winter, spring, summer, and autumn.
The study assessed the nutrient load in the bottom water using the Water Quality Index (WQI) [
27,
28]. The
WQI is an indicator used to comprehensively evaluate water quality by integrating multiple water quality parameters into a single value to reflect the overall condition of the water body.
WQI helps managers and the public gain a more intuitive understanding of water quality and provides a scientific basis for water resource management and protection [
29,
30]. In this study, the
WQI method was employed to reflect the nutrient load situation in Nakaumi. Since the
WQI is a dimensionless indicator, the
Z-score method was first used to standardize the nutrient parameter data from 2013 to 2017.
The calculation method for the
Z-score is as follows:
where
X is the measured value,
μ is the sample mean, and
σ is the sample standard deviation.
The calculation formula for
WQI is as follows:
Wi represents the weight of each nutrient parameter. In this study, due to the lack of sufficient specific research or local data to support the differential weighting of different parameters, it is difficult to clearly distinguish the primary and secondary influence levels of different water quality parameters on the overall water quality. Equal weights were assigned to all nutrient parameters.
Set the ranges based on the statistical characteristics of the WQI distribution (such as mean and standard deviation). This approach avoids subjective interference and ensures that the classification better reflects the true characteristics of the data. The WQI is divided into four levels, which are as follows:
Low load;
Light load;
Moderate load;
High load.
3. Results and Discussion
3.1. Time-Series Trend Analysis
Table 1 shows the overall nutrient parameter values of the bottom water in Nakaumi, calculated by averaging the data from the sampling points for each season. The El Niño periods are bolded for easy identification and to facilitate observation and comparison with non-El Niño periods.
As shown in
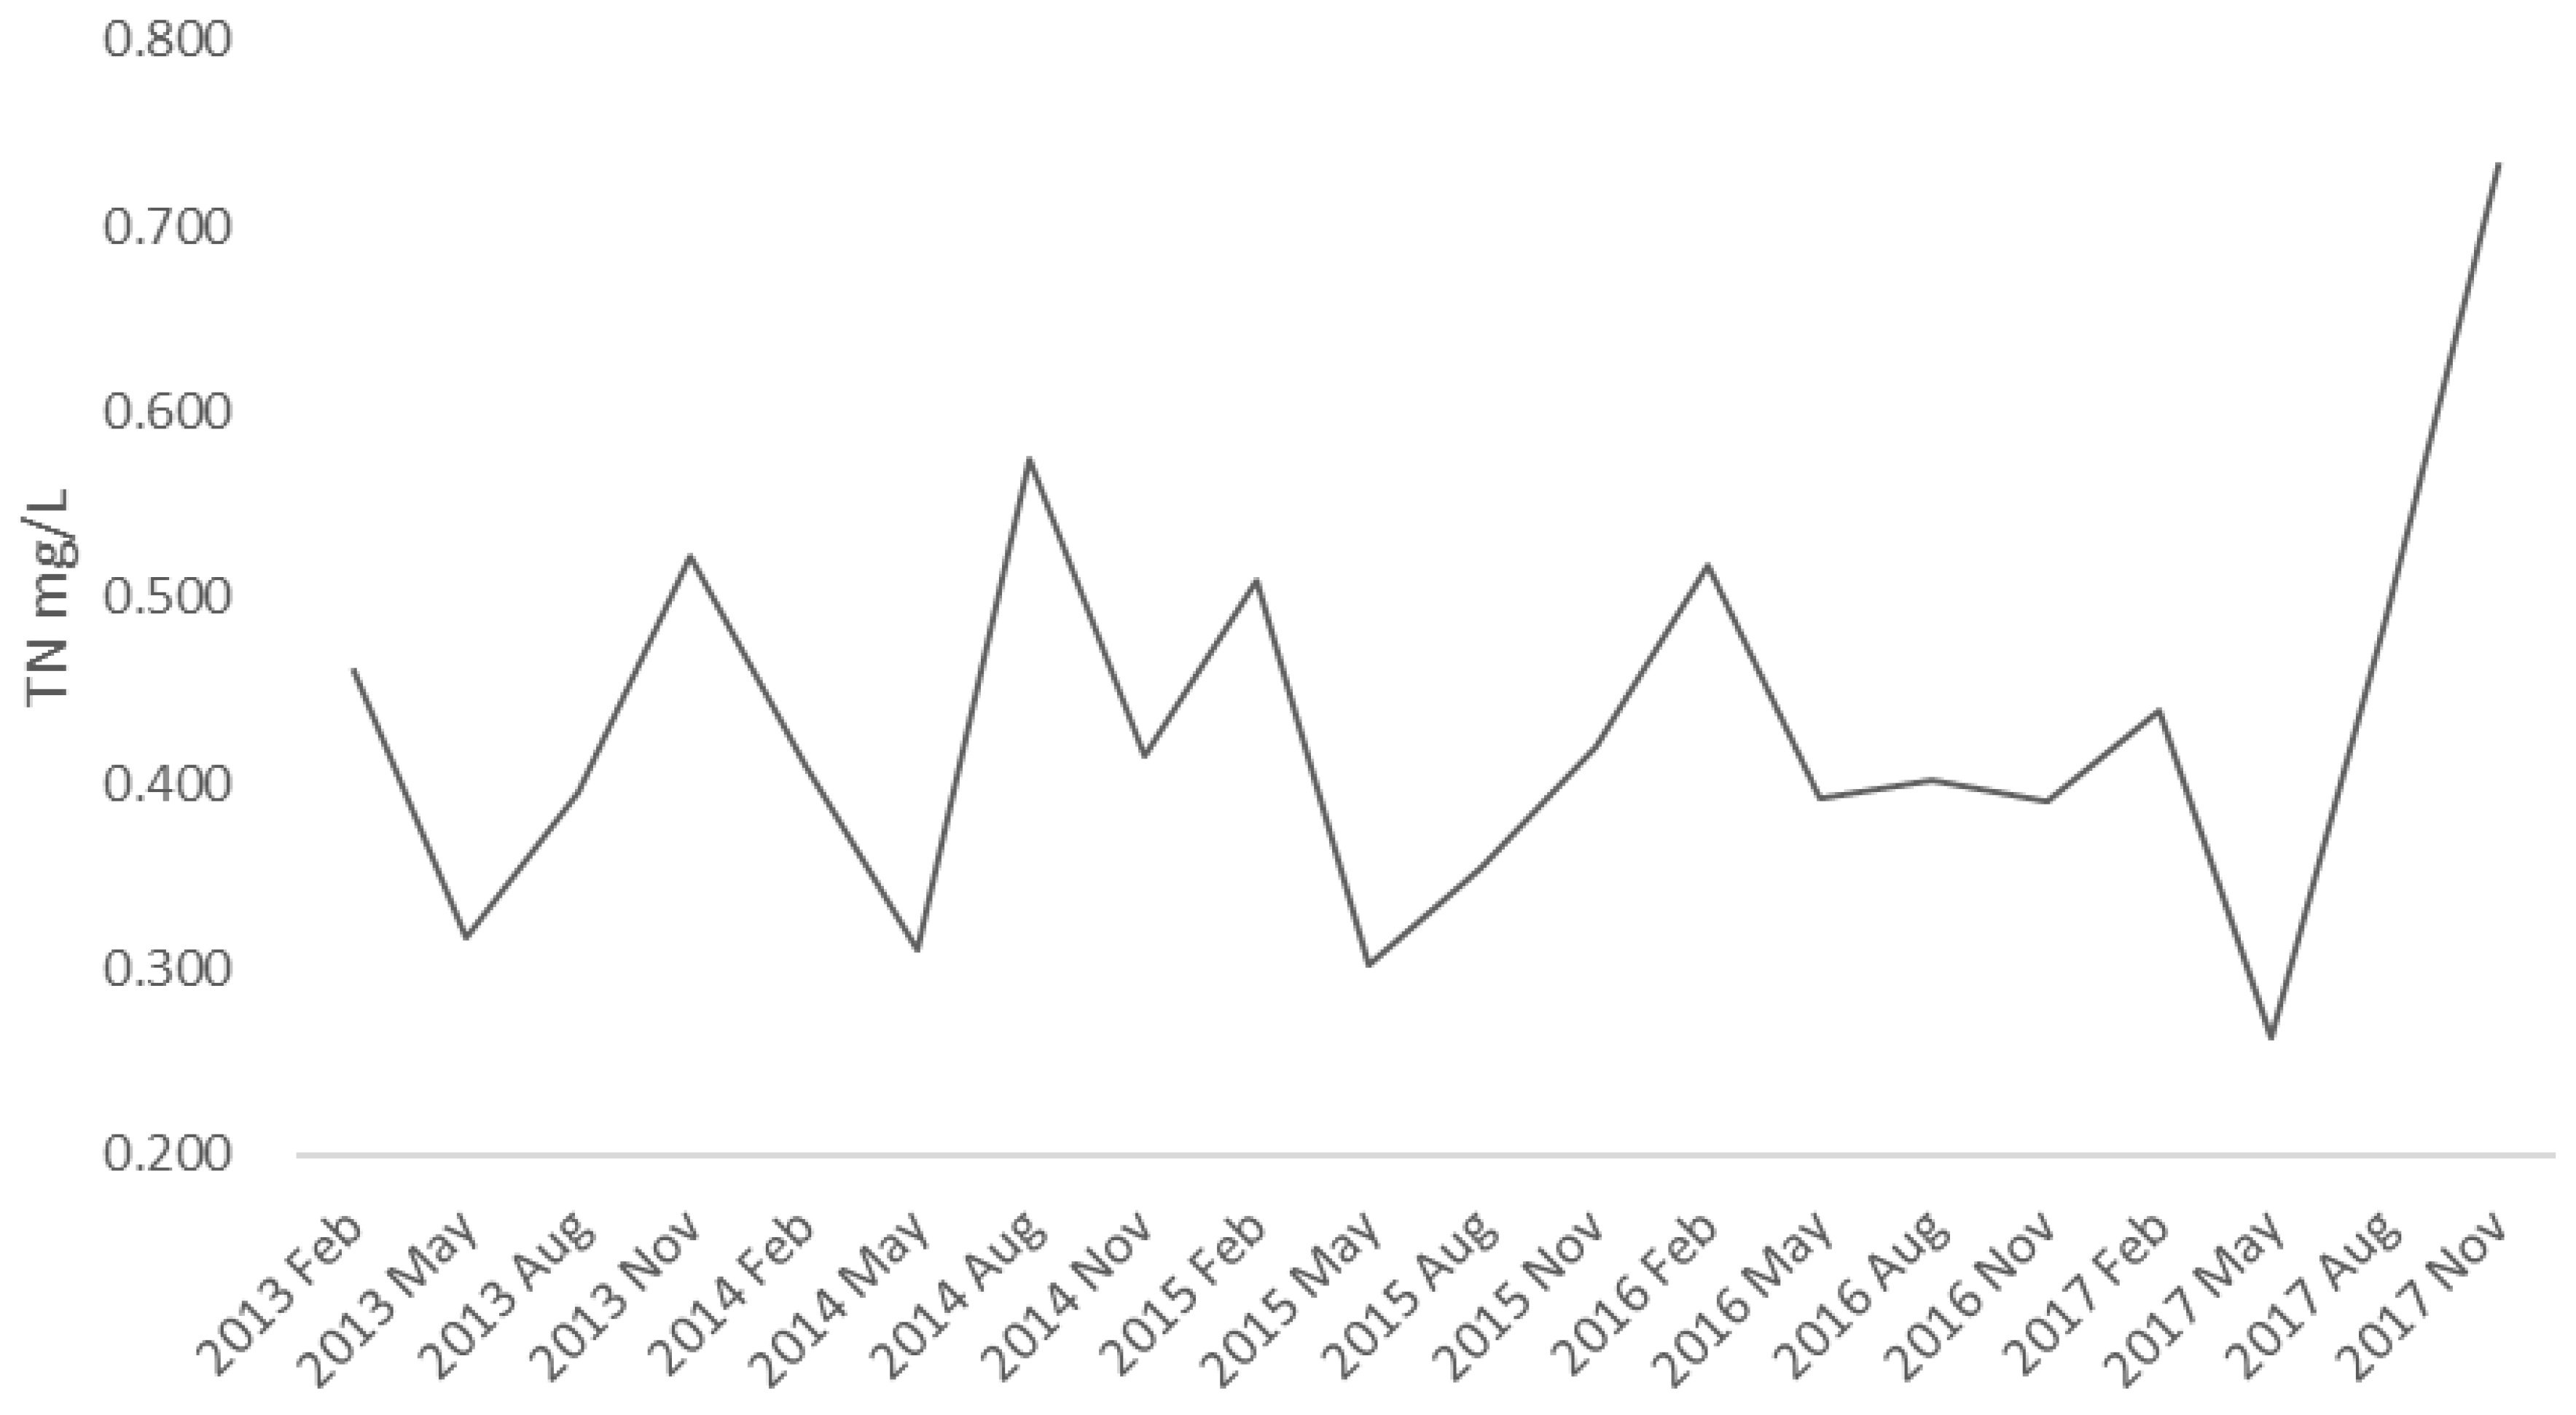
Table 2, it can be observed that the coefficient of variation for TP is 52.744%, indicating moderate fluctuations in total phosphorus, with some variation in concentration over different periods. The coefficient of variation for TN is 25.104%, the lowest among all parameters, suggesting that TN concentration is relatively stable with minimal fluctuations. The coefficients of variation for NH
4-N, NO
3-N, and DPO
4-P are all around 100%, indicating that their concentrations fluctuate significantly, likely influenced by various external factors, which may be related to water stratification, seasonal changes, and sediment release. The coefficient of variation for NO
2-N is as high as 128.806%, indicating that nitrite nitrogen concentration is extremely unstable and may undergo rapid transformation or accumulation under certain conditions.
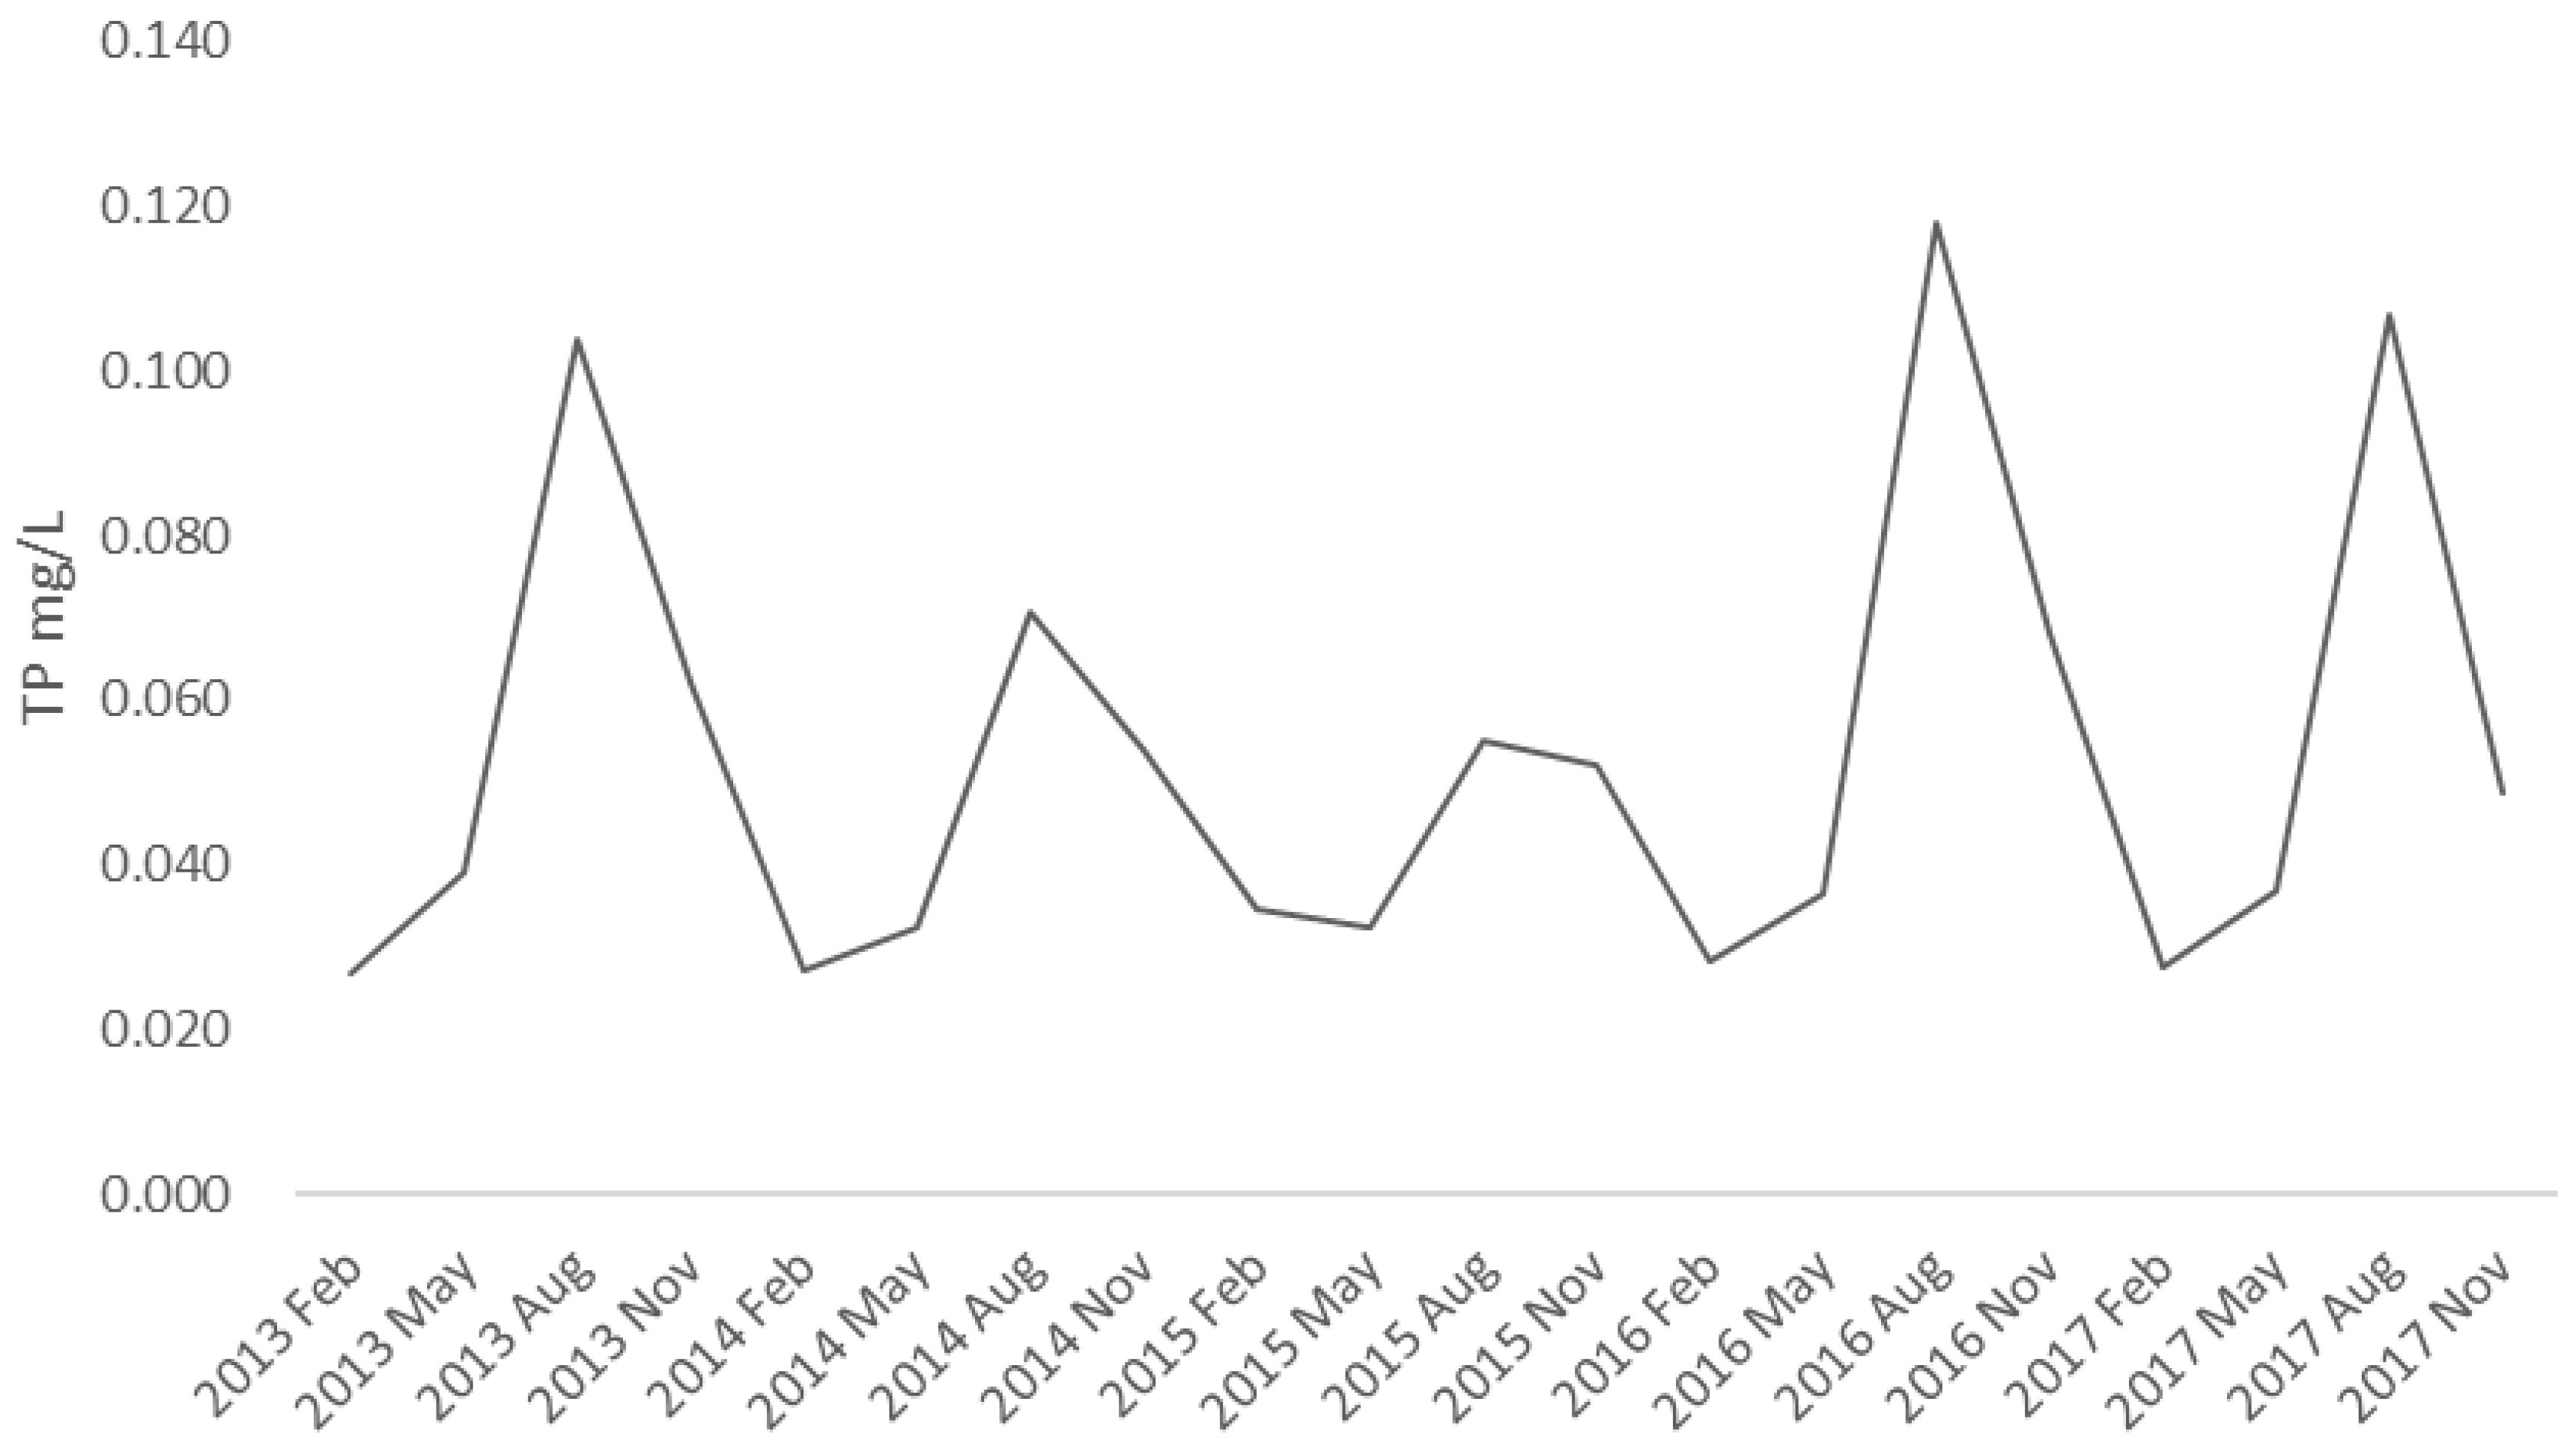
Figure A1,
Figure A2,
Figure A3,
Figure A4,
Figure A5 and
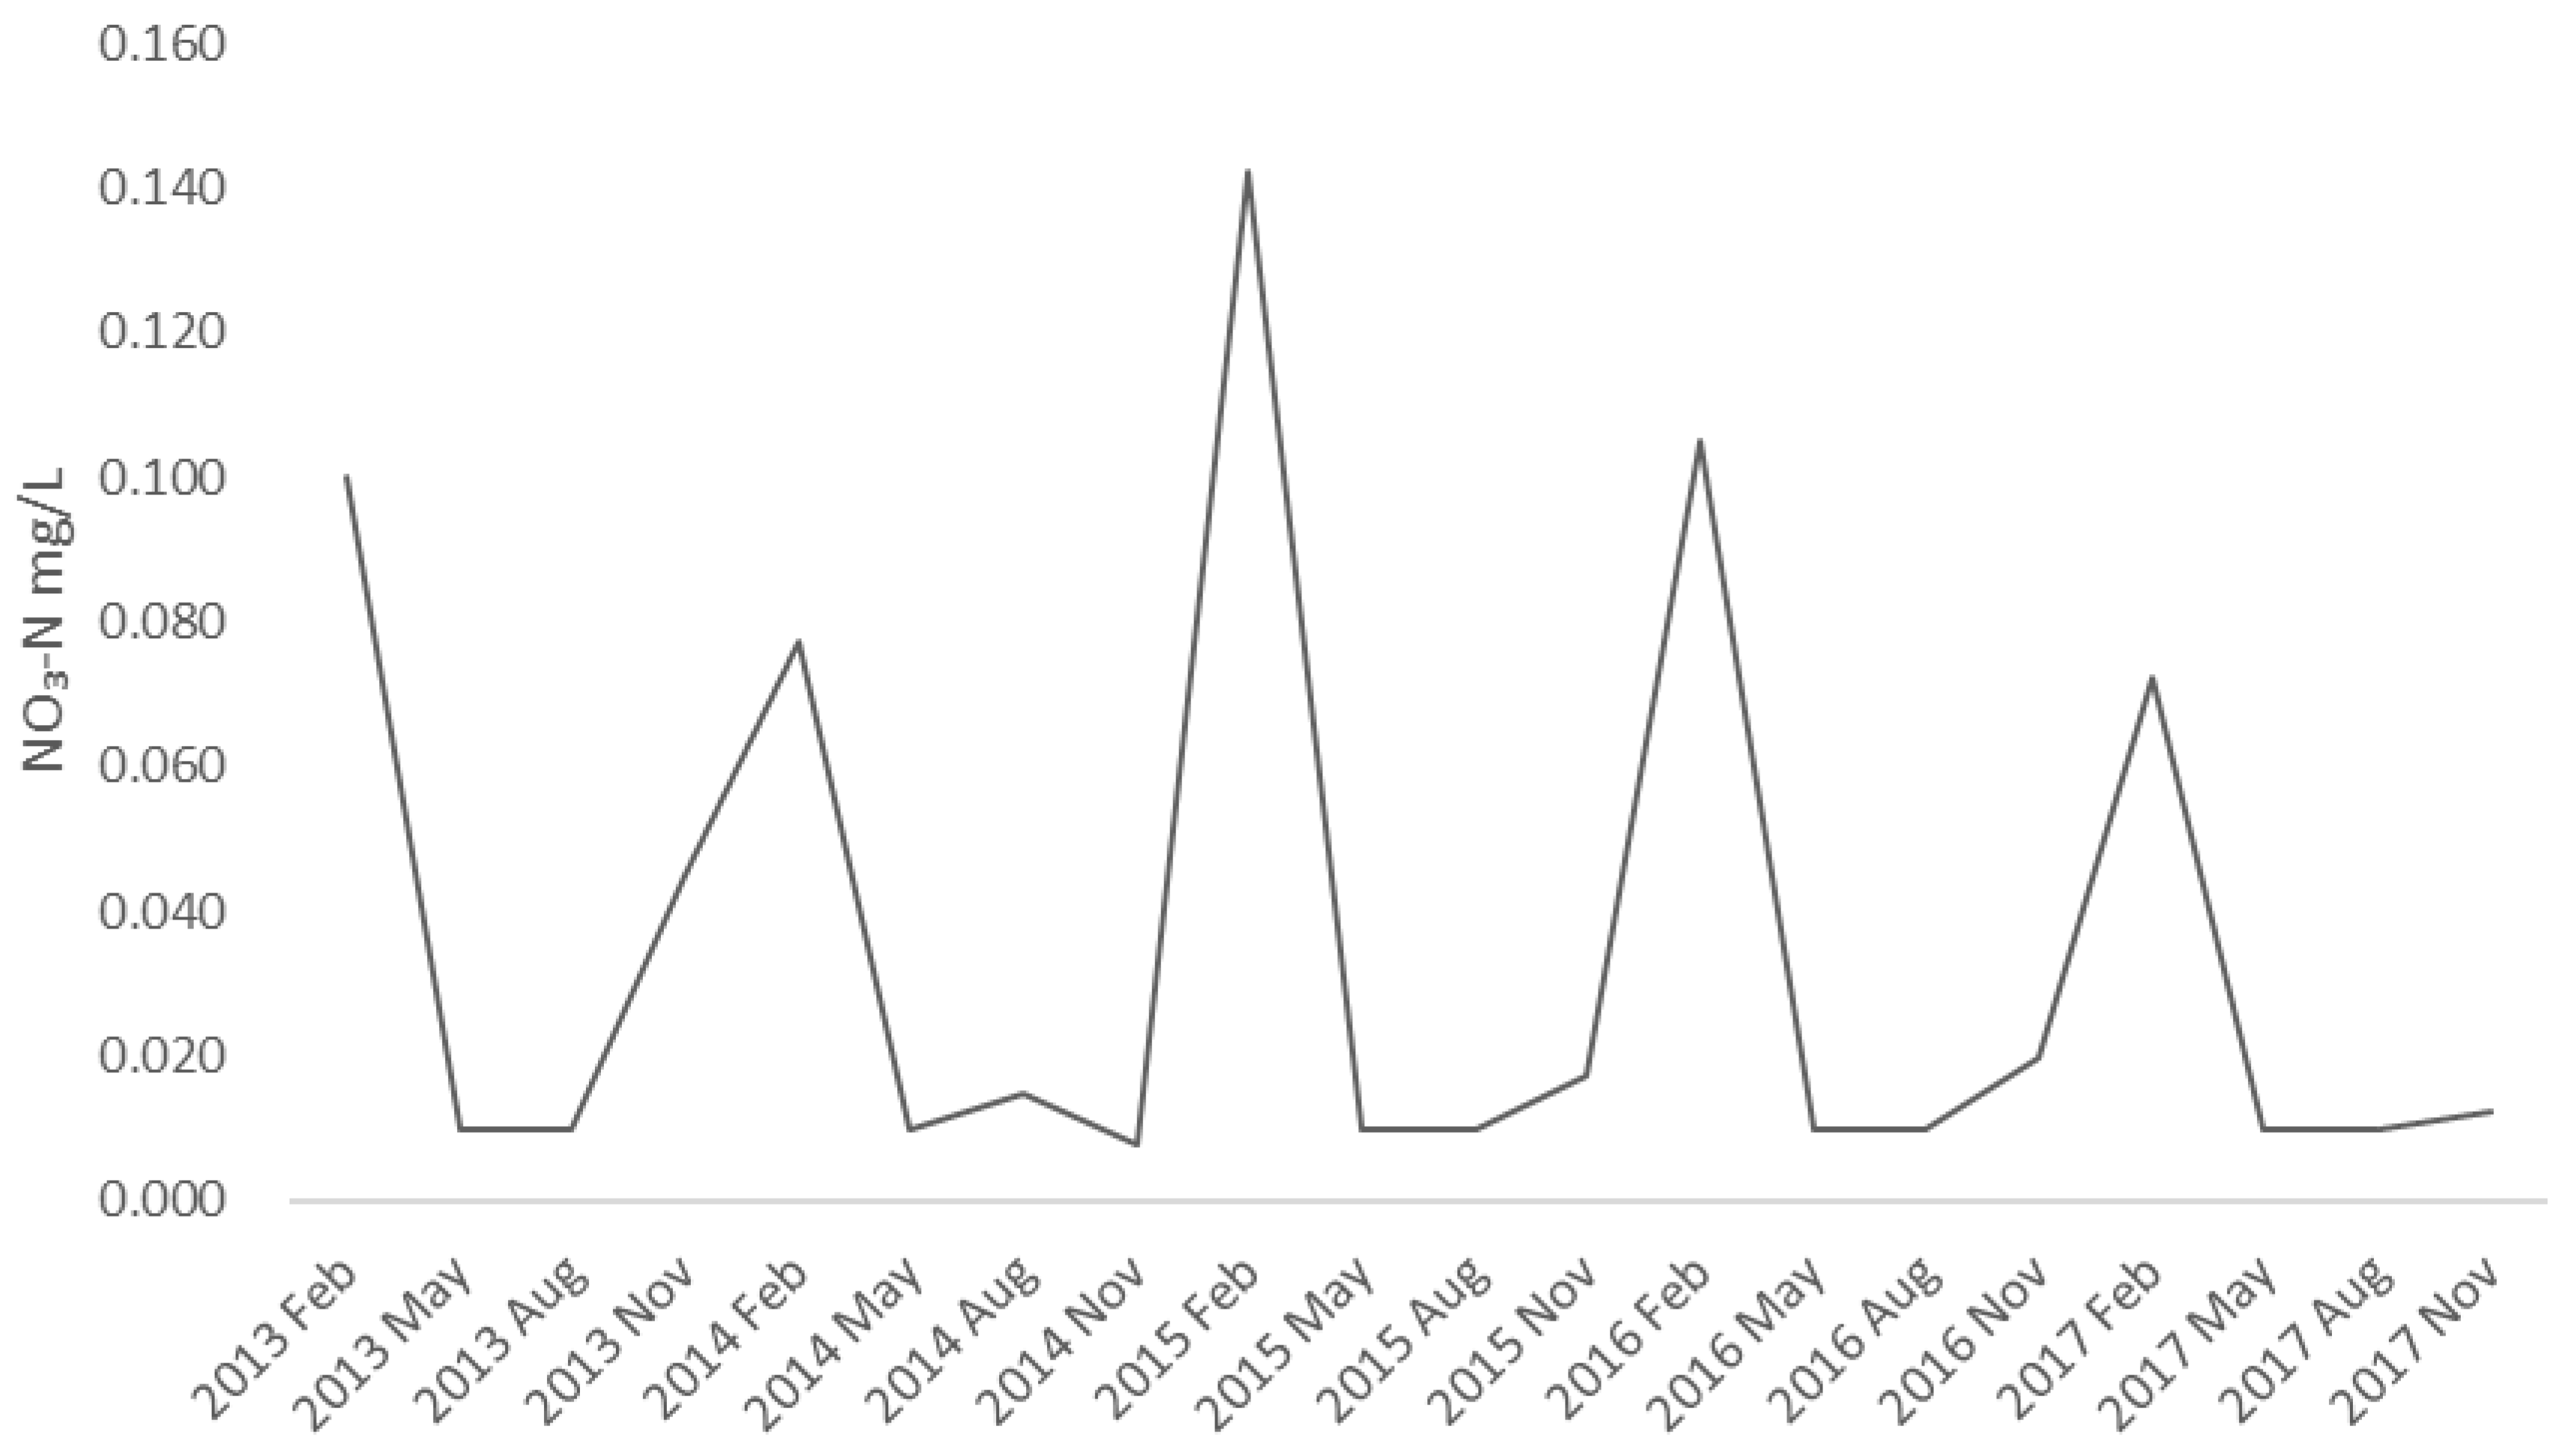
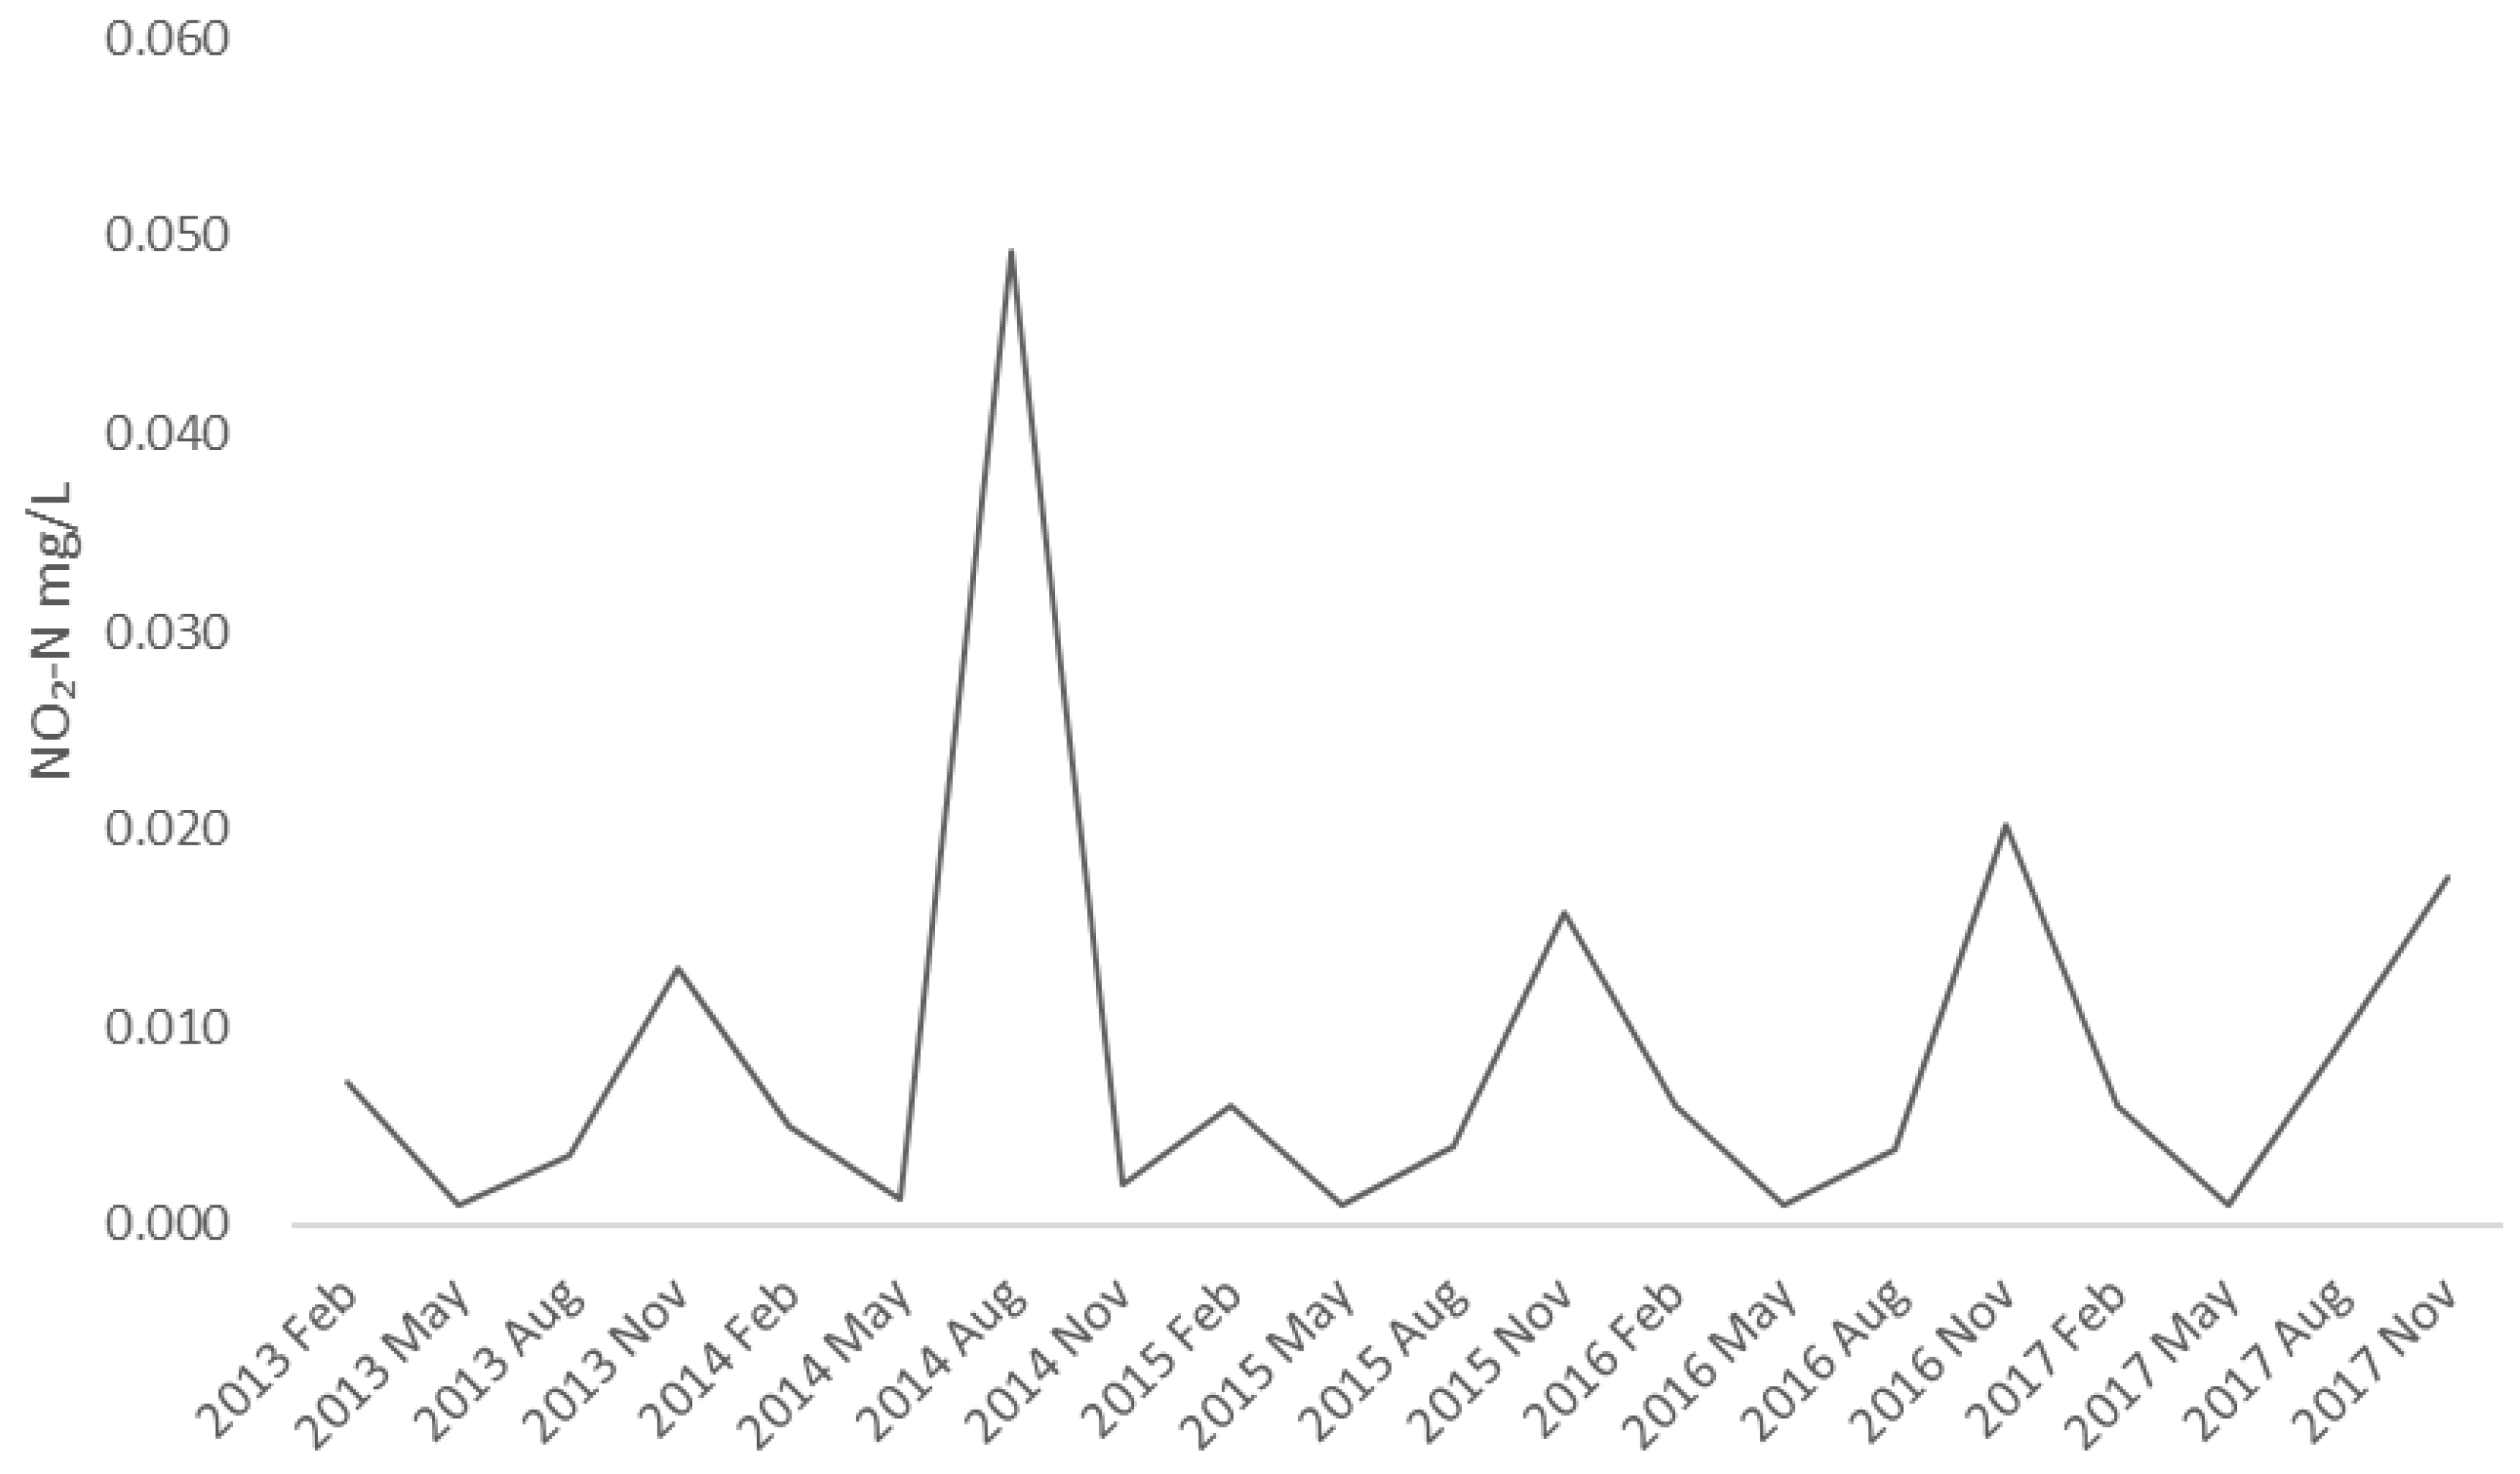
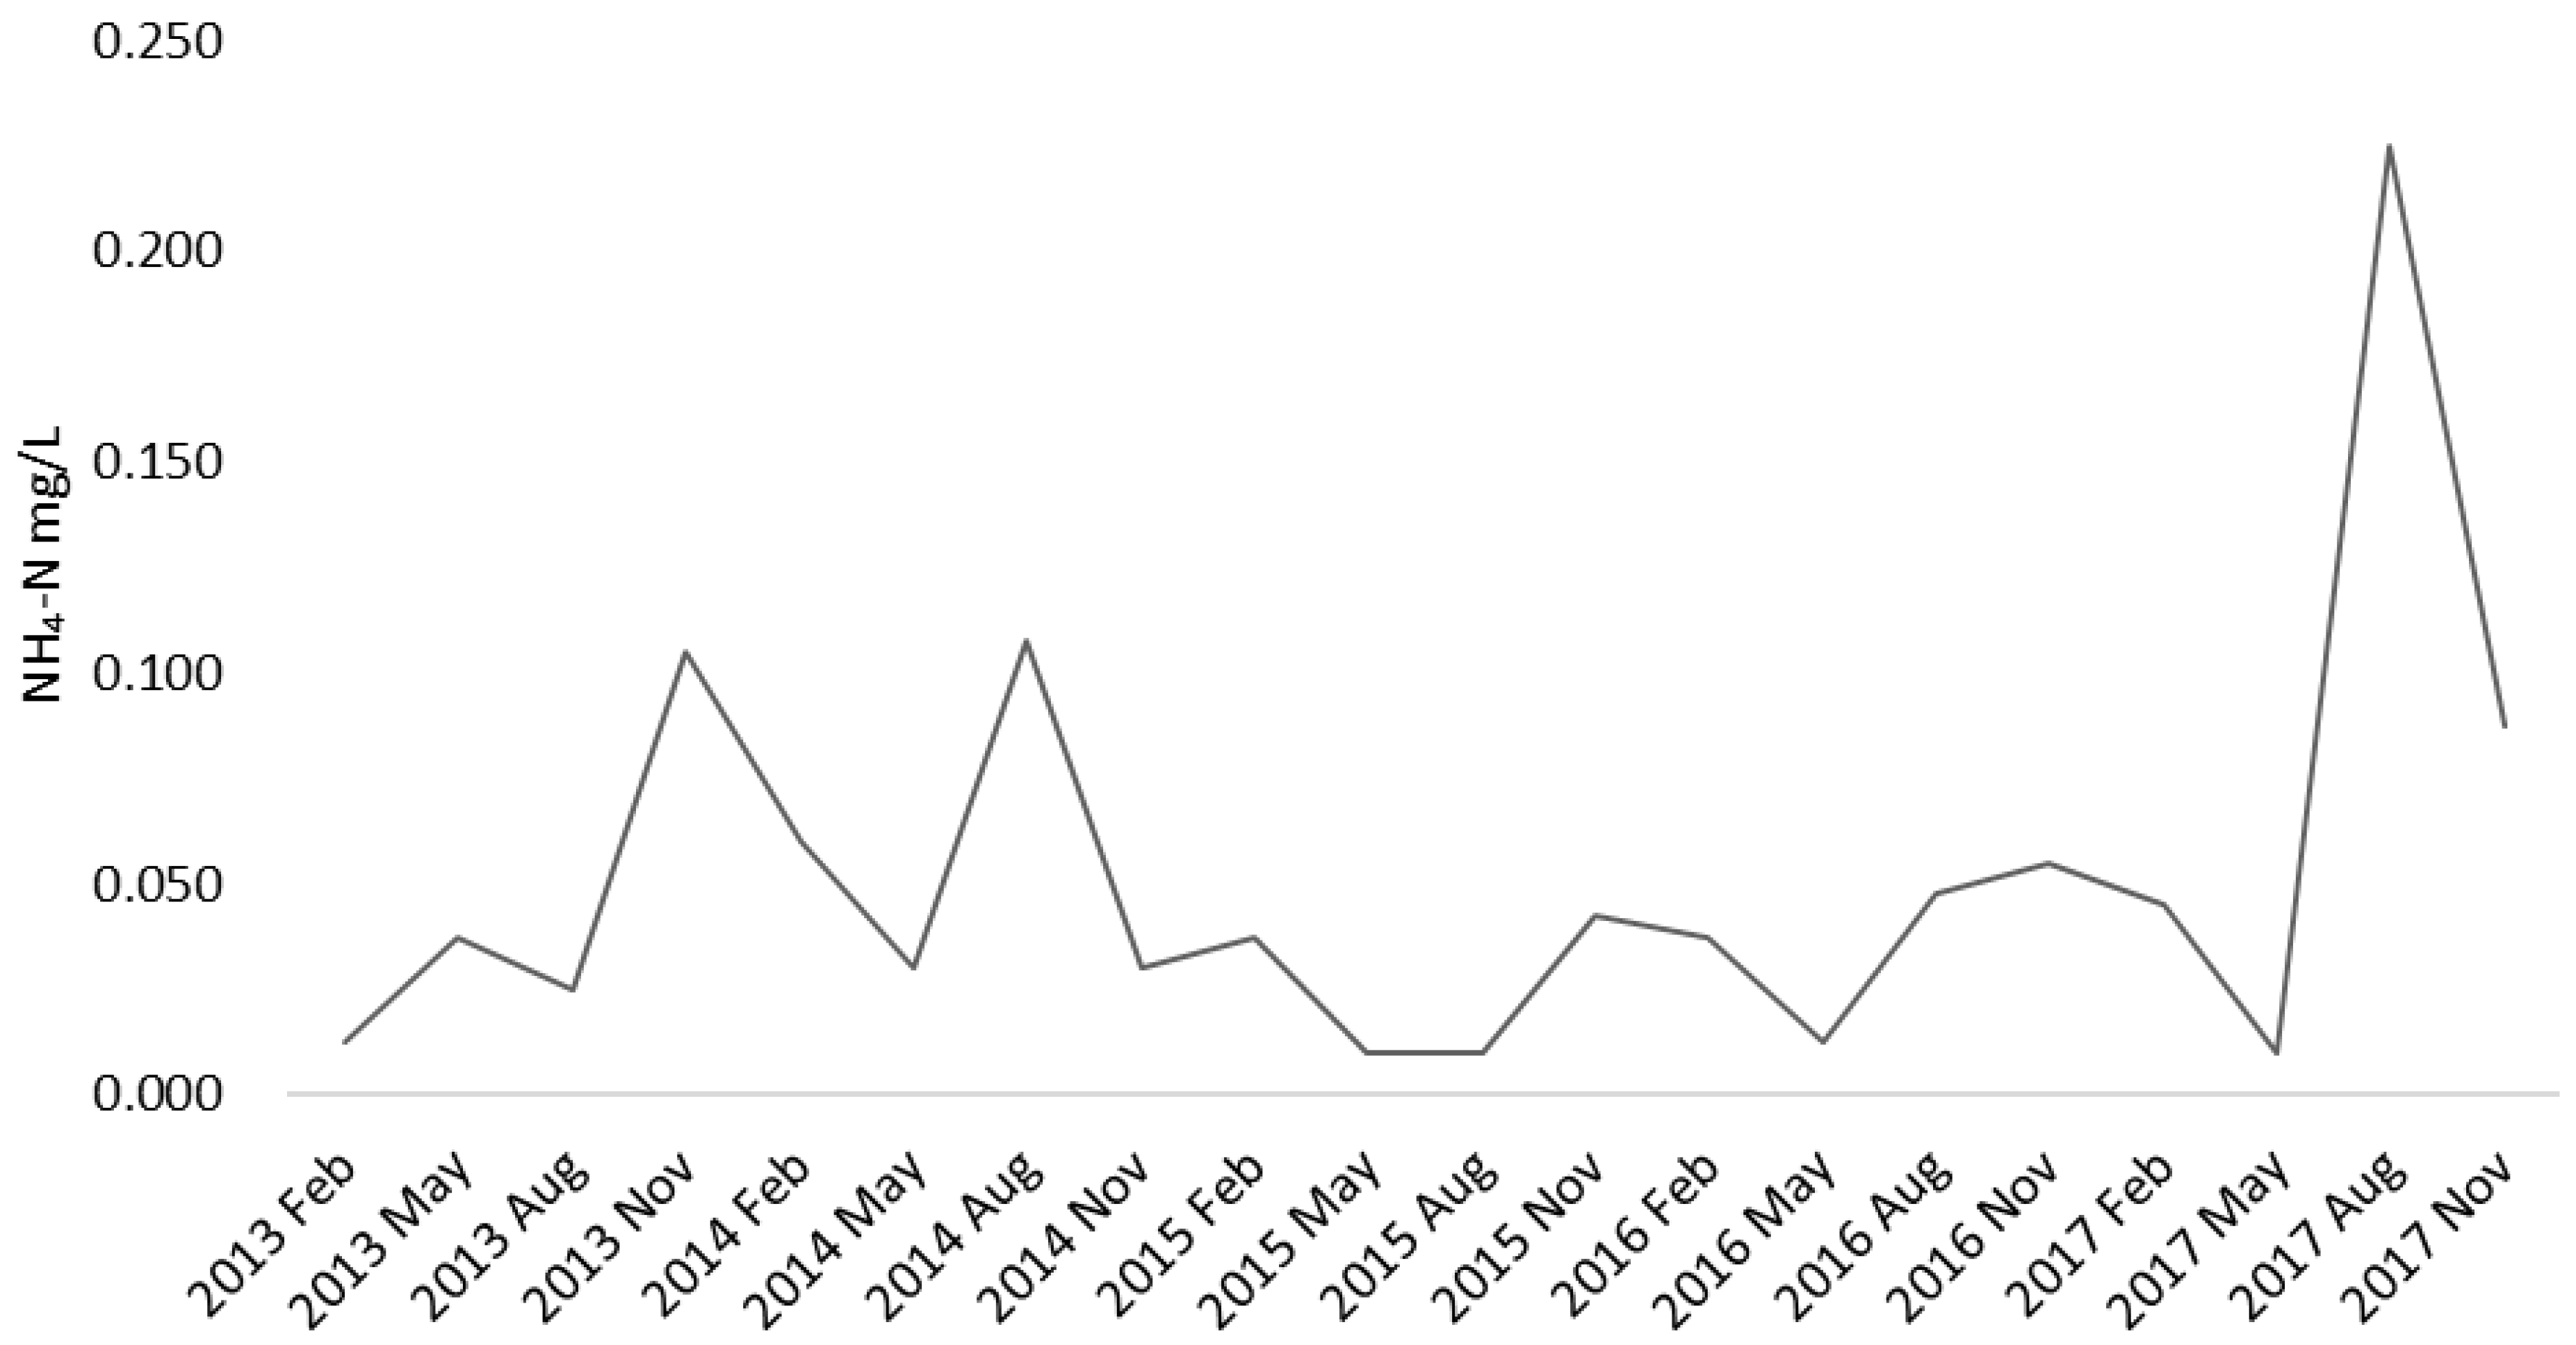
Figure A6 show the changes in various nutrient parameters over time. During non-El Niño periods, overall, TP is relatively higher in summer and autumn and lower in winter and spring. TN is higher in autumn and relatively lower in spring, though the variation is not entirely regular. NO
3-N is higher in winter and lower in summer. NO
2-N and NH
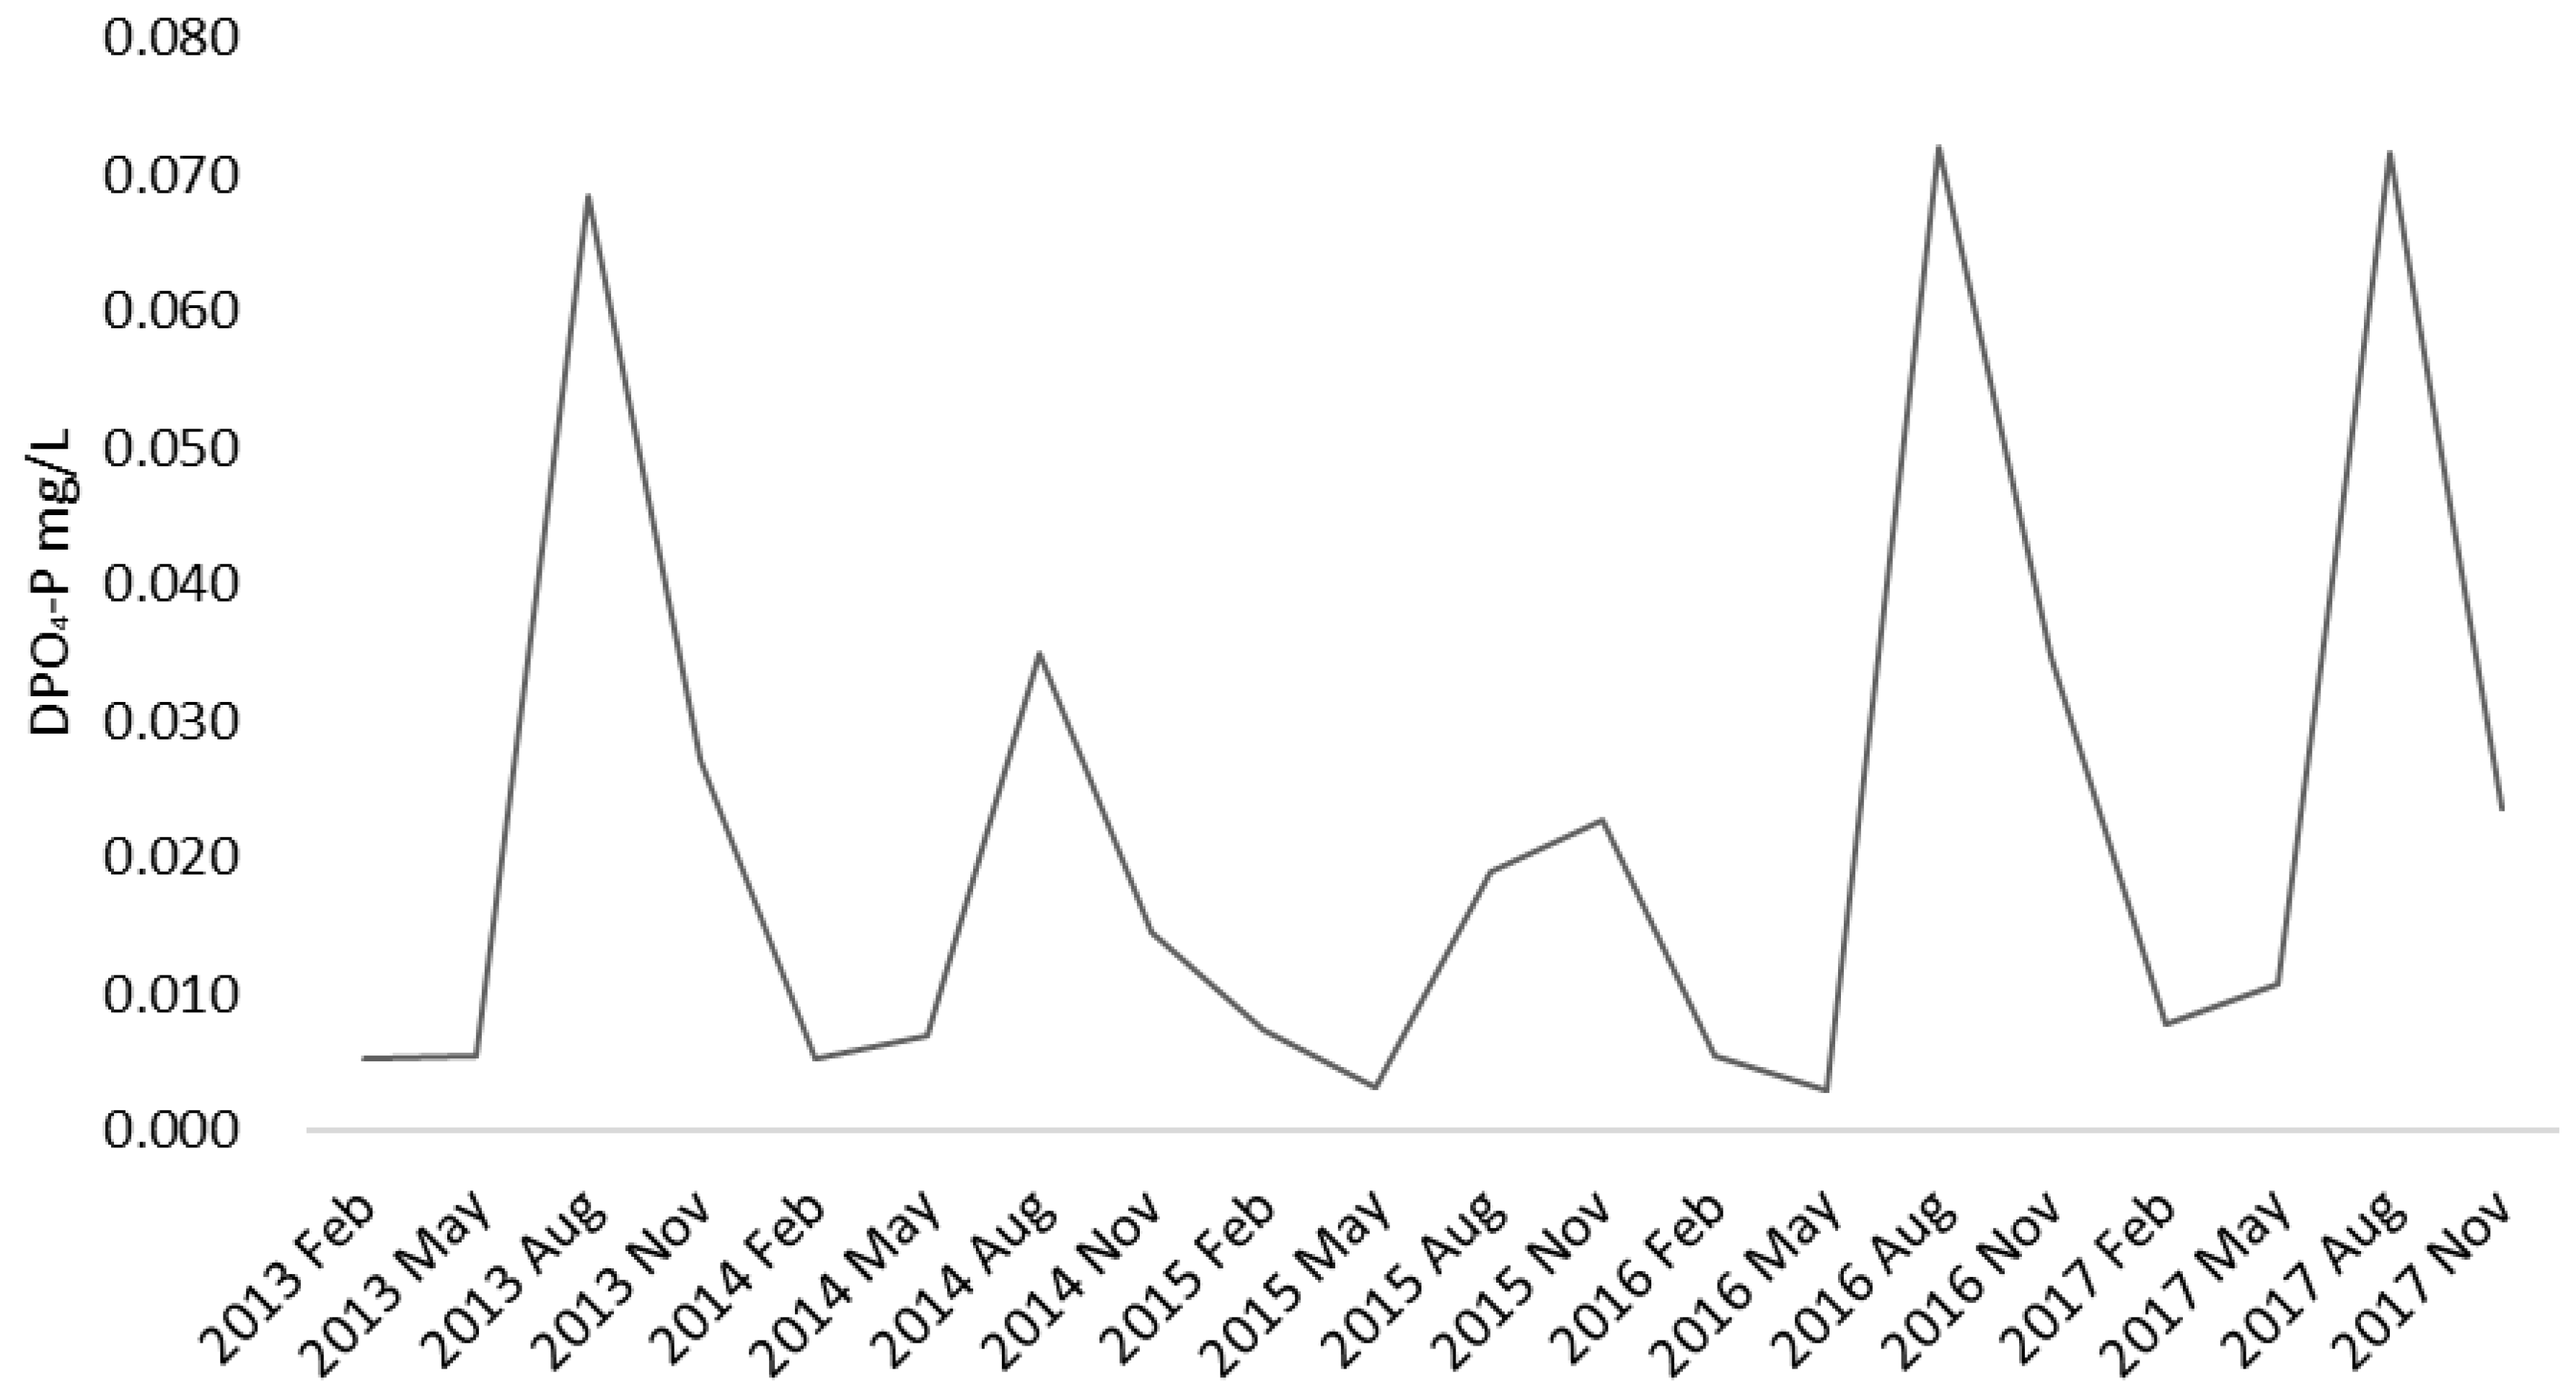
4-N fluctuate significantly between seasons, with higher concentrations in summer. DPO
4-P is relatively higher in summer and autumn and lower in winter and spring. During the El Niño period from spring 2014 to spring 2016, the changes in various nutrient parameters differed from those in non-El Niño periods. The TP, DPO
4-P, and NH
4-N levels showed an abnormal decrease, while NO
3-N and NO
2-N exhibited an abnormal increase. The impact of the El Niño event was strongest in the autumn of 2015 [
31]. At this time, the concentrations of all nutrient parameters reached their lowest levels for the same period within this El Niño cycle. Compared to non-El Niño years, the greatest deviation was observed in DPO
4-P, which was only 27% of the average value in non-El Niño years, indicating that DPO
4-P was the most sensitive to the peak intensity of the El Niño event. Combined with the coefficients of variation in
Table 2, it can be seen that the coefficients of variation for NO
3-N, NO
2-N, and DPO
4-P all exceeded 100%. NO
3-N showed relatively regular fluctuations, peaking in Feb 2015, while NO
2-N concentrations were generally low but peaked in Aug 2014. The peak value of DPO
4-P during this El Niño event occurred in Aug 2014, indicating that compared to NO
3-N, NO
2-N and DPO
4-P were more sensitive to the onset of the El Niño cycle.
Table 3 shows the mean values and coefficients of variation of different parameters during El Niño and non-El Niño periods. Through comparison, it can be found that during the El Niño period, TP, NH
4-N, and DPO4-P show obvious changes, indicating that the El Niño phenomenon may have a significant impact on the magnitude of their concentration changes. The concentration changes of TN, NO
3-N, and NO
2-N are relatively small. The slight changes may indicate that the El Niño phenomenon has a relatively light impact on their concentration changes. In terms of the coefficient of variation, the coefficients of variation of NO
3-N and NO
2-N both exceed 100% during the El Niño period, indicating that their concentration fluctuations are intense, reflecting that the El Niño phenomenon reduces the stability of these nutrients in the water body, and the ecosystem may have a weakened ability to regulate them. The coefficients of variation of NH
4-N and DPO4-P are relatively high in both periods, indicating that their concentrations may be more prone to large fluctuations. The decrease in the coefficient of variation compared with the non-El Niño period suggests that the El Niño phenomenon may reduce such fluctuations. The coefficients of variation of TP and TN are relatively small, indicating that the concentration stability of these two nutrient parameters is relatively good during both El Niño and non-El Niño periods, and they are less disturbed by the El Niño phenomenon. According to the data of dissolved oxygen and temperature in the bottom water body in
Appendix B Table A1 (the El Niño periods are presented in bold), the mean values of the two during the non-El Niño and El Niño periods can be calculated respectively. During the El Niño and non-El Niño periods, the average temperatures of the bottom water body are 17.9 °C and 19.1 °C, respectively, and the average dissolved oxygen contents are 6.5 mg/L and 4.9 mg/L, respectively. Combining the data of temperature and dissolved oxygen, the average temperature of the bottom water body during the El Niño period is relatively low. The lower water temperature will slow down the metabolic activities of microorganisms. For example, the activities of microorganisms involved in the transformation of nitrogen-containing and phosphorus-containing compounds decrease, which will slow down the nutrient cycling processes such as mineralization, nitrification, and denitrification. This may be one of the reasons for the changes in the concentrations of some nutrient parameters (such as NH
4-N, TP, etc.) during the El Niño period. For example, the decrease in the concentration of NH
4-N during the El Niño period may be due to the low temperature inhibiting the process of converting organic nitrogen into NH
4-N by related microorganisms. At the same time, there is also a possibility that the change in temperature will change the density of the water body, thereby affecting the water stratification. The lower water temperature during the El Niño period may make the water stratification more stable and limit the material exchange between the upper and lower water layers. Additionally, the dissolved oxygen content directly affects the survival of aquatic organisms. The relatively high dissolved oxygen during the El Niño period provides a better living condition for the bottom organisms. The metabolic and activities of organisms will have an impact on nutrients; the changes in biomass caused by different dissolved oxygen concentrations will also affect the nutrient cycle. For example, the decomposition of dead organisms will release nutrients and change the nutrient structure of the water body. Temperature and dissolved oxygen will also interact with each other. The change in temperature will affect the solubility of gases in water. The lower water temperature is conducive to the dissolution of dissolved oxygen in water, which is consistent with the higher dissolved oxygen in the bottom water body during the El Niño period in the data. The coordinated changes of temperature and DO will thus affect the cycling and changes of nitrogen and phosphorus substances in the entire water ecosystem.
3.2. Seasonal Difference Analysis
The results of the significance difference analysis of nutrient concentrations in the bottom waters of Lake Nakaumi across the four seasons—winter, spring, summer, and autumn—are shown in
Table 4.
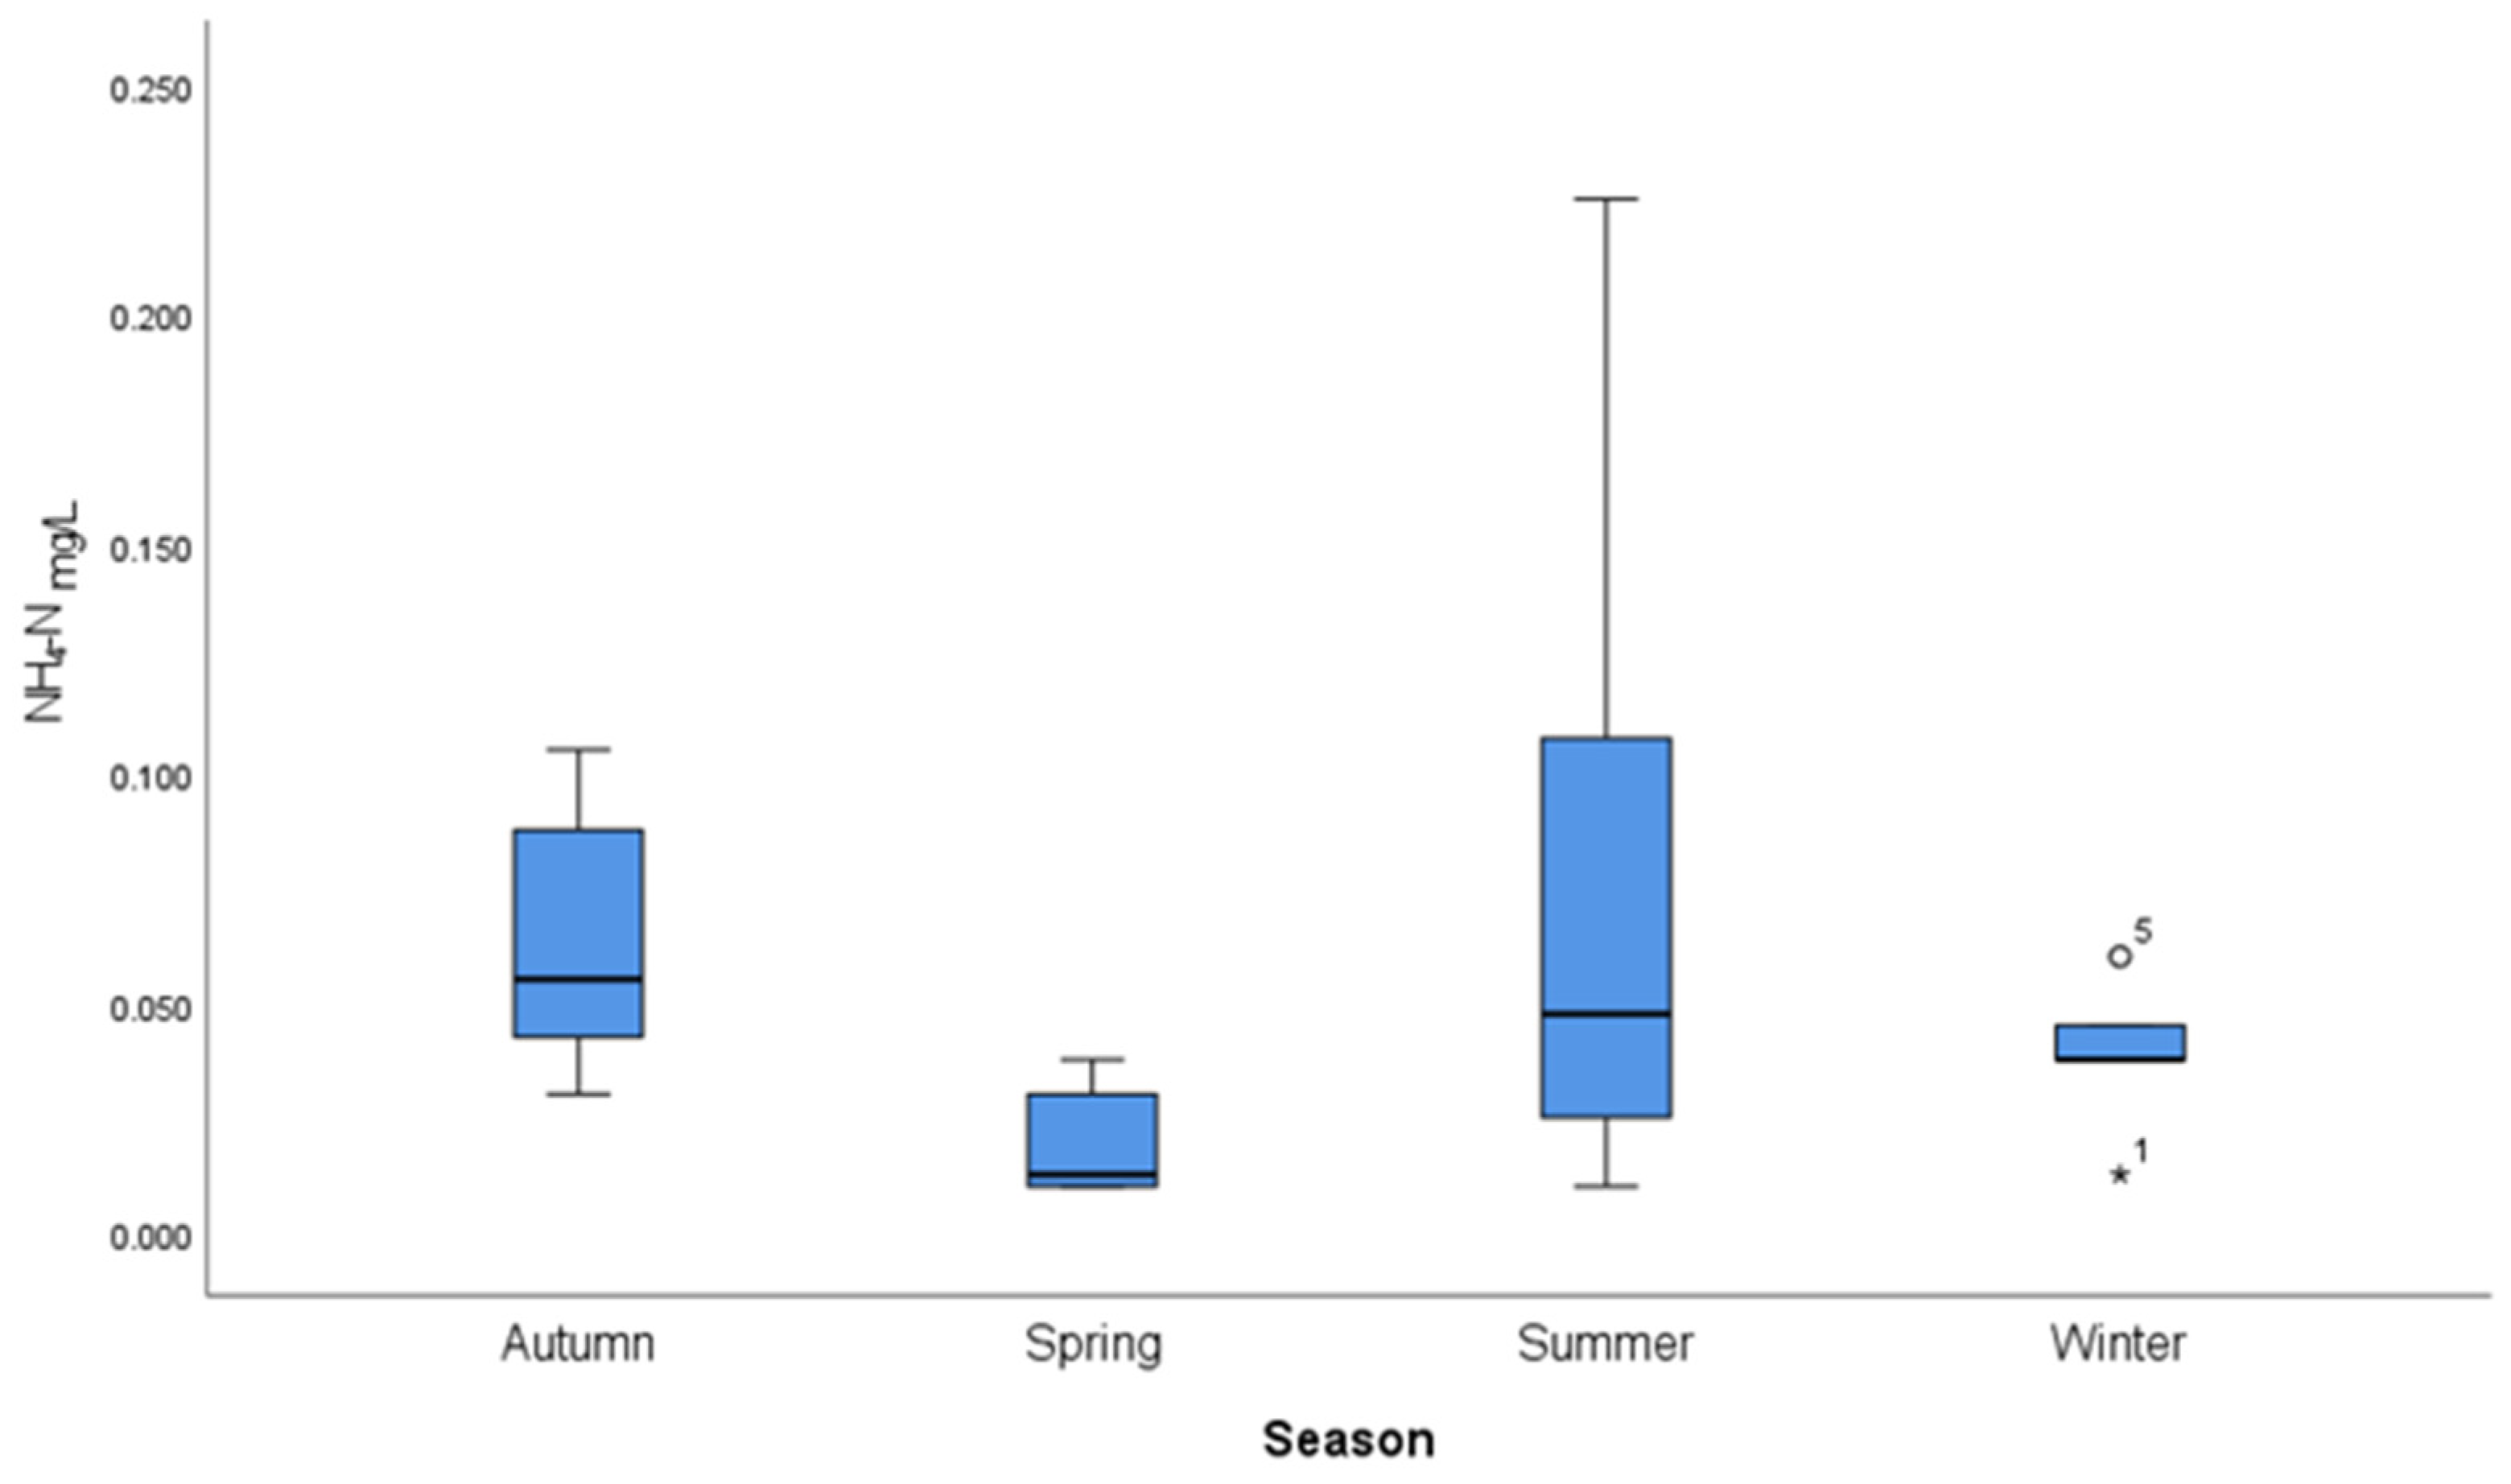
From the results in the table, it can be seen that, except for NH4-N, the p-values for all other nutrient parameters are less than 0.05, indicating that the differences in nutrient concentrations across different seasons are significant.
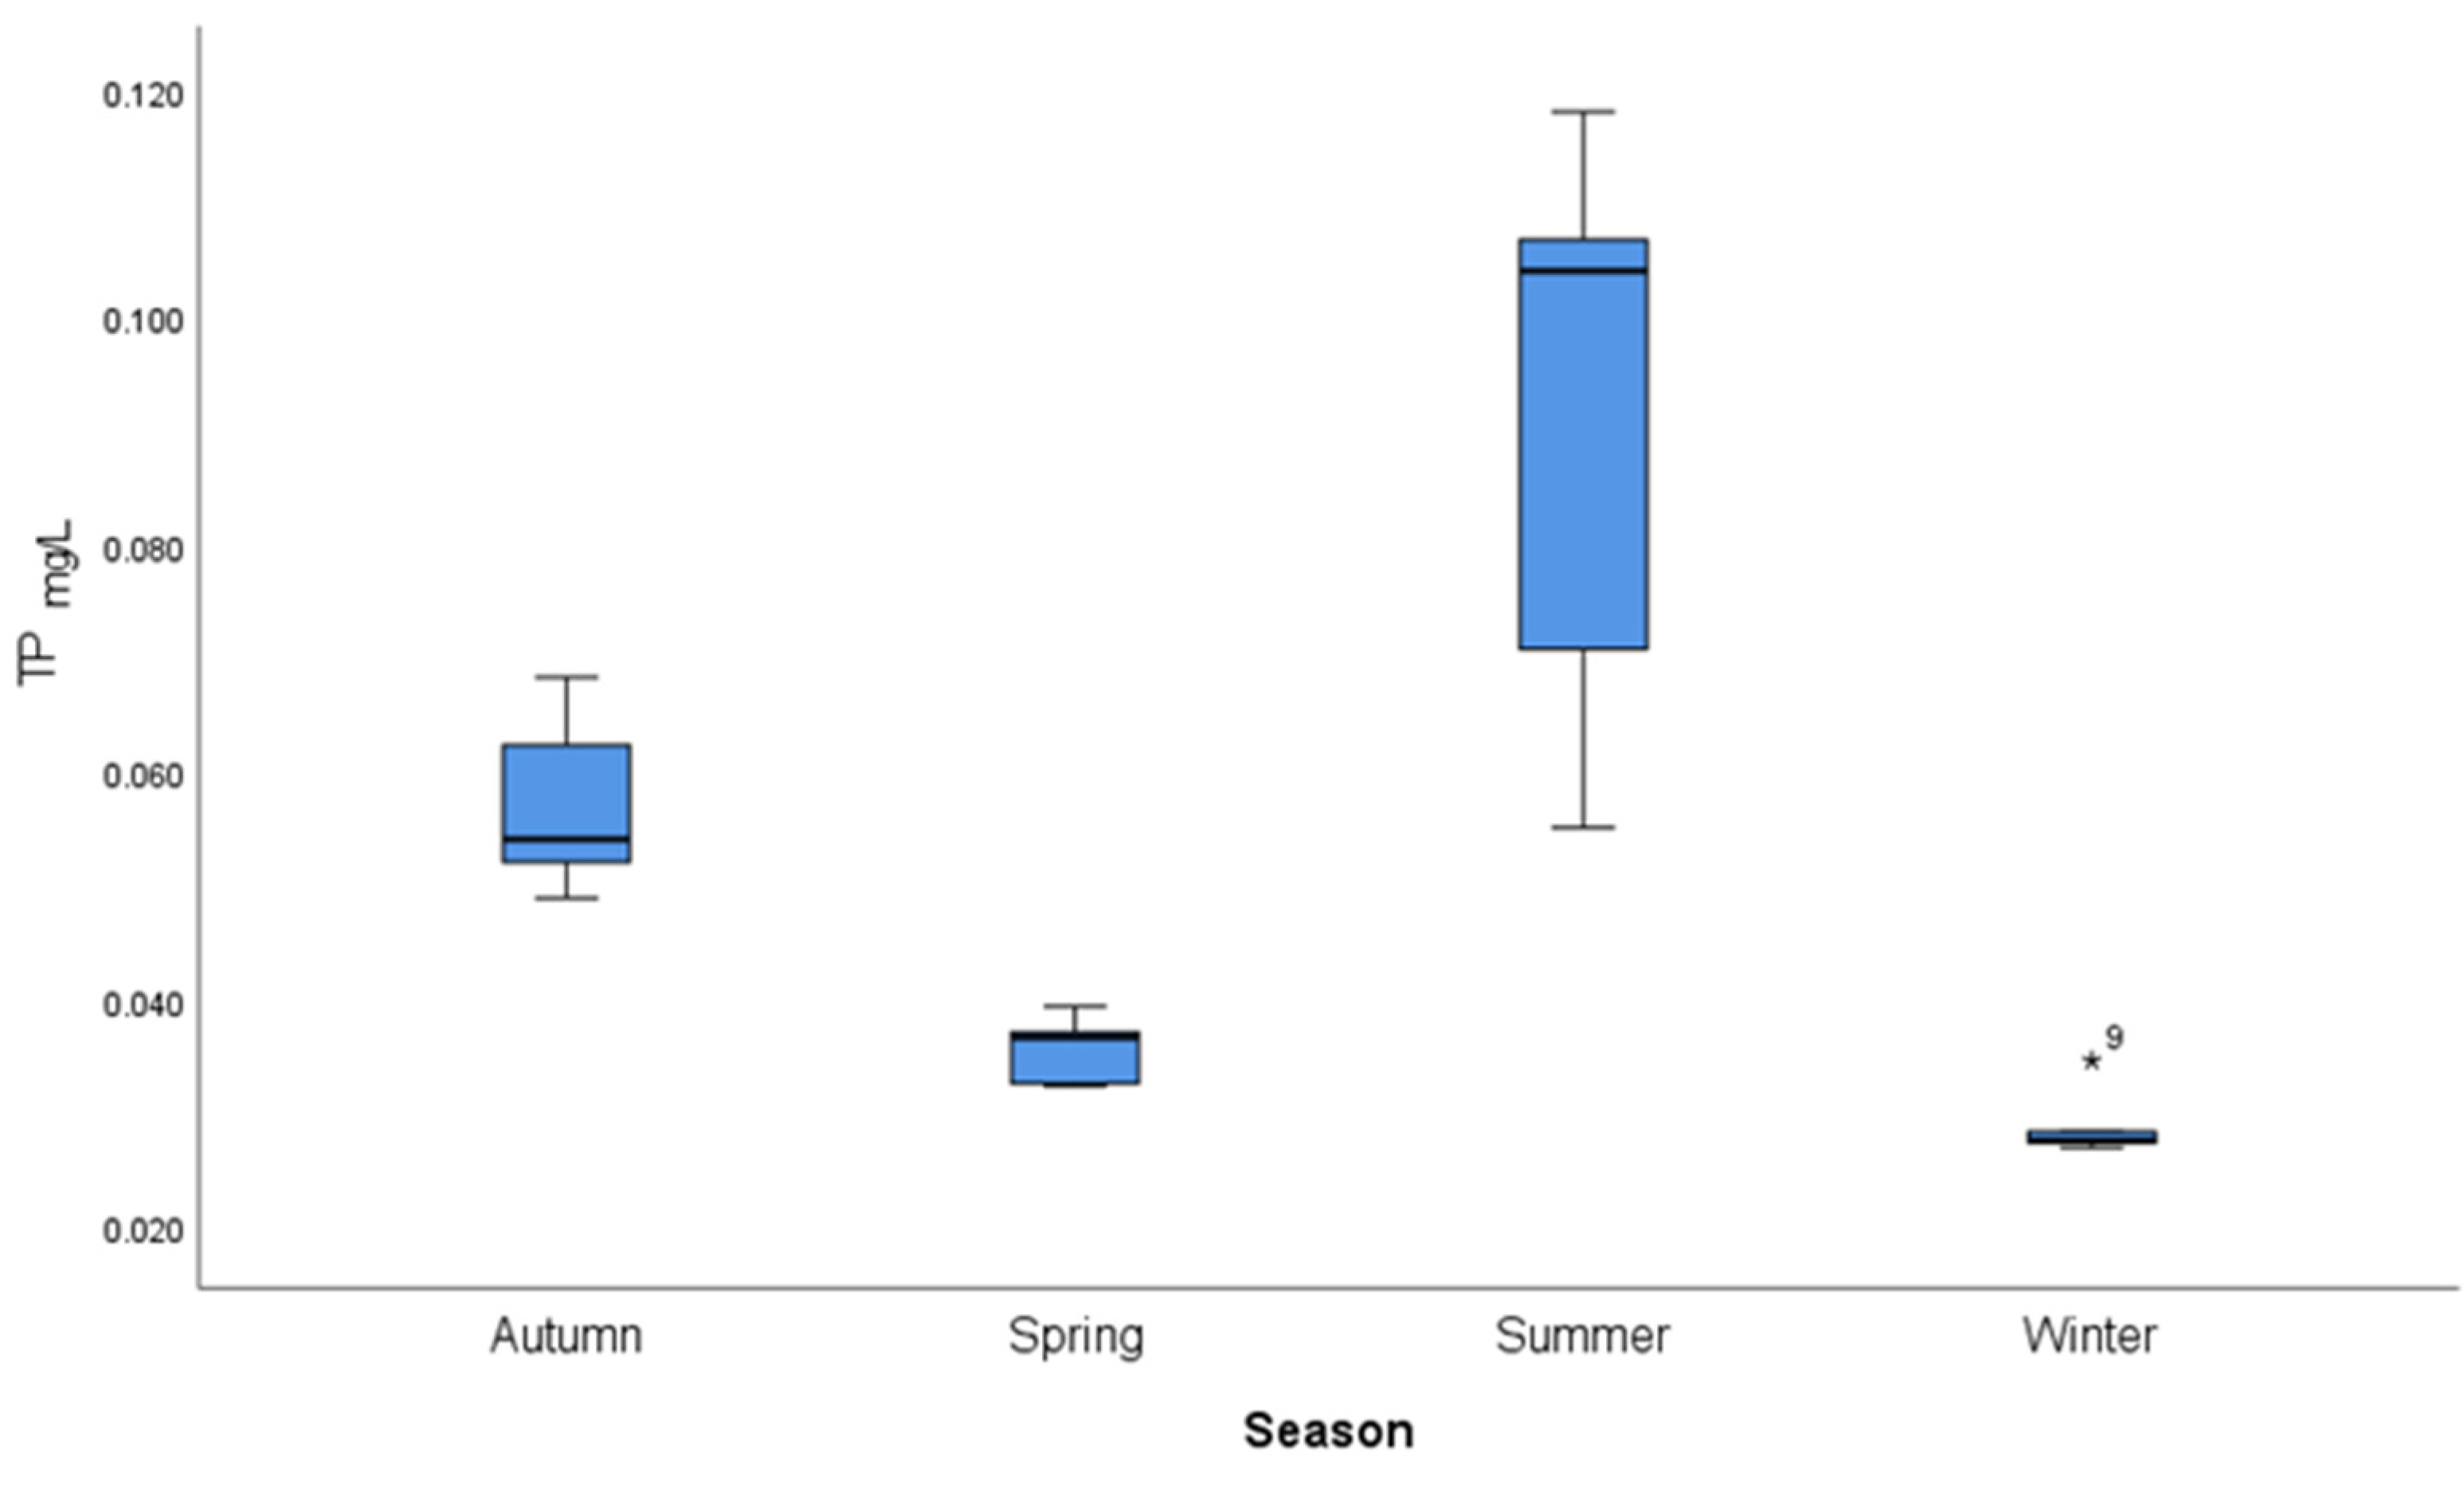
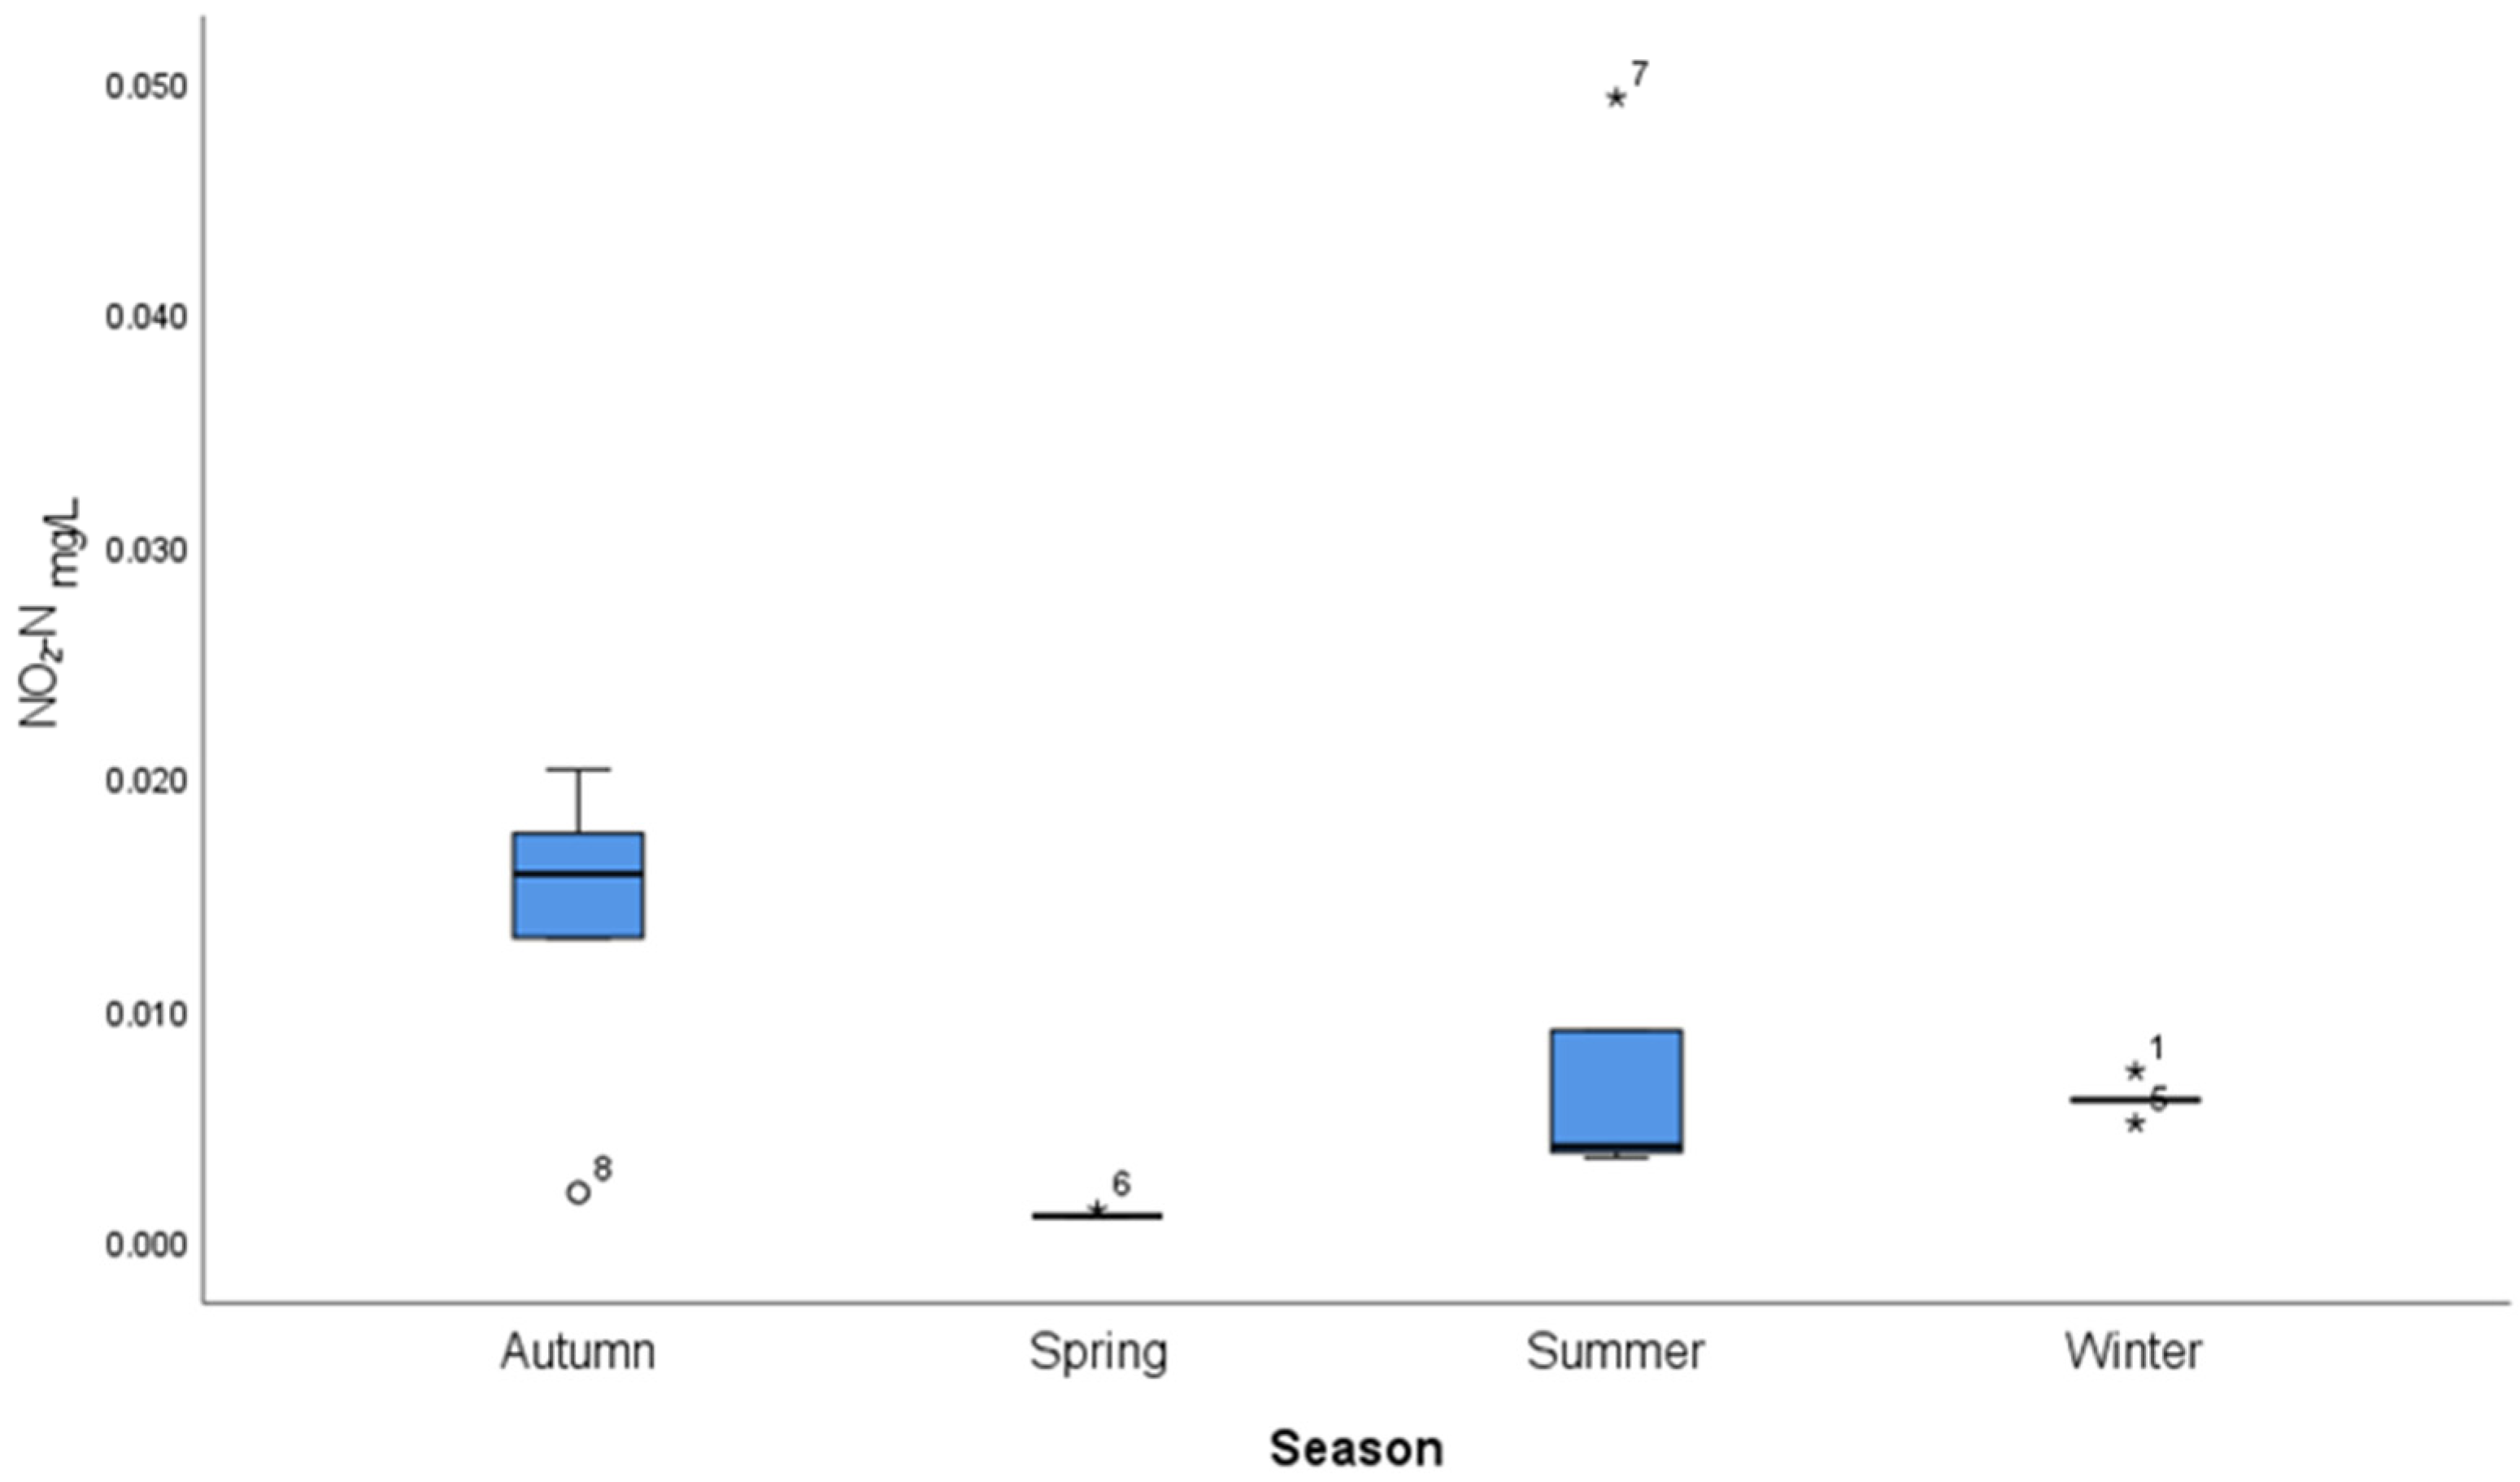
Figure A7,
Figure A8,
Figure A9,
Figure A10,
Figure A11 and
Figure A12 in the
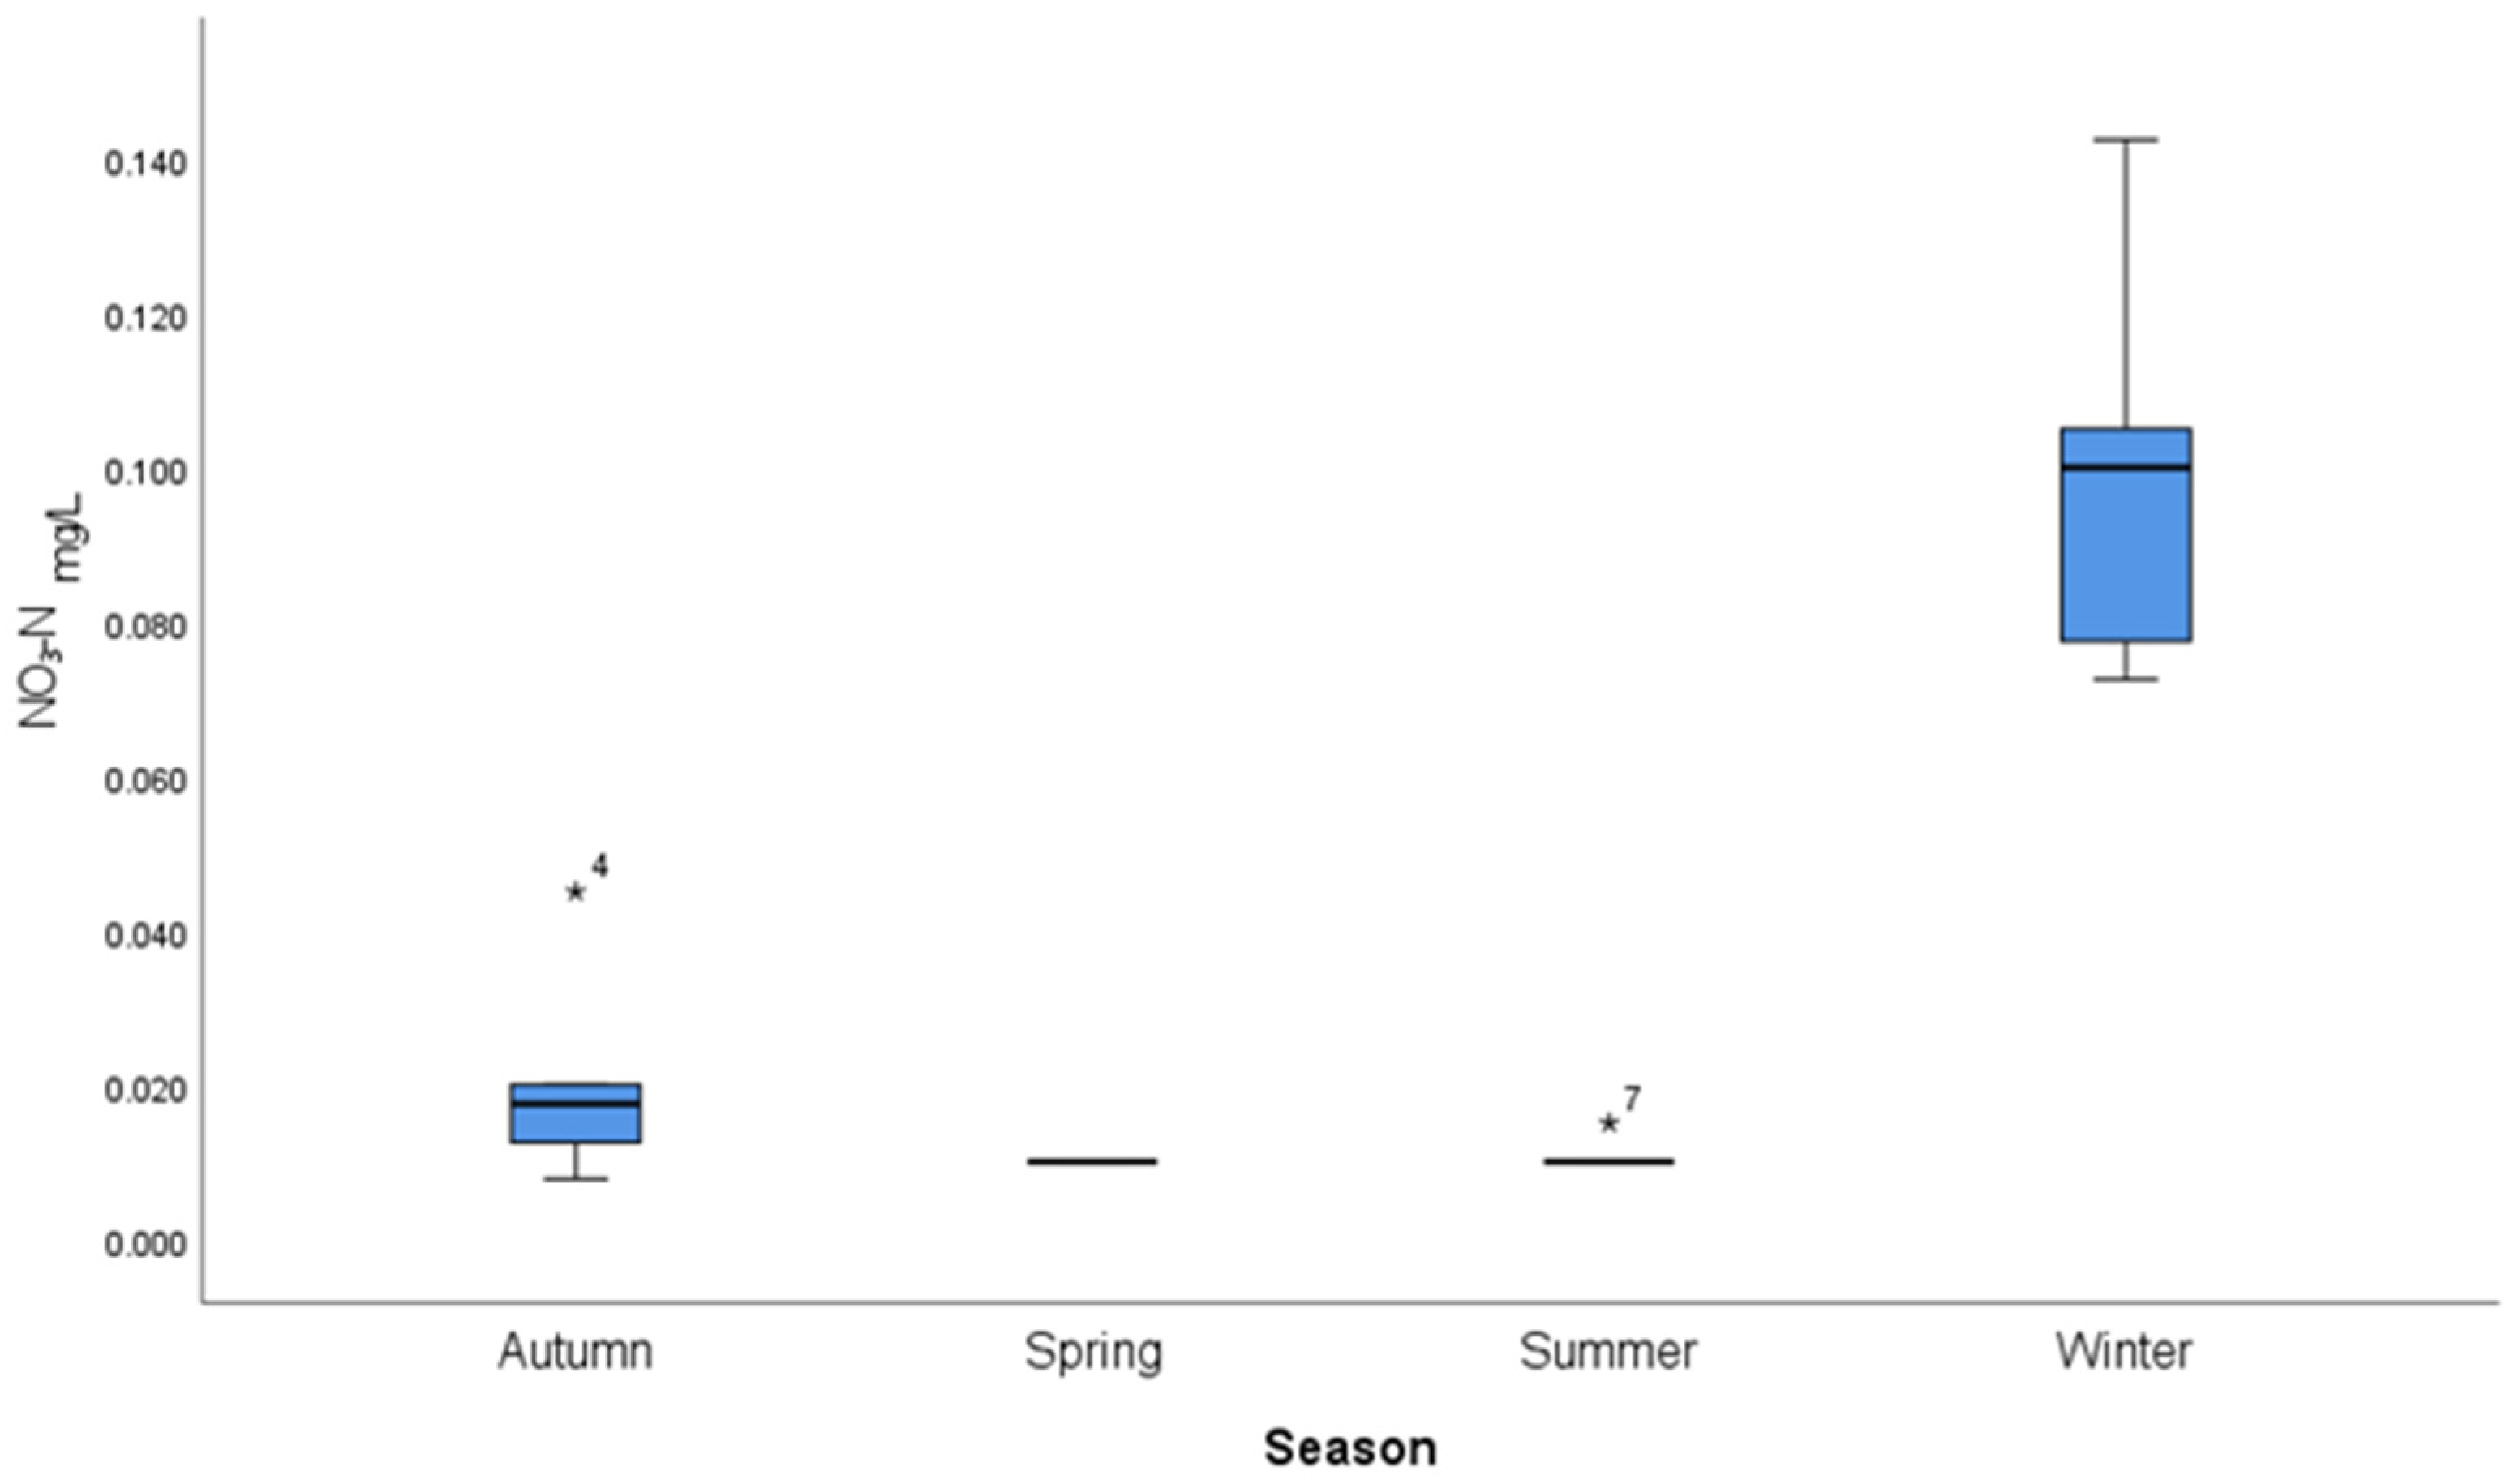
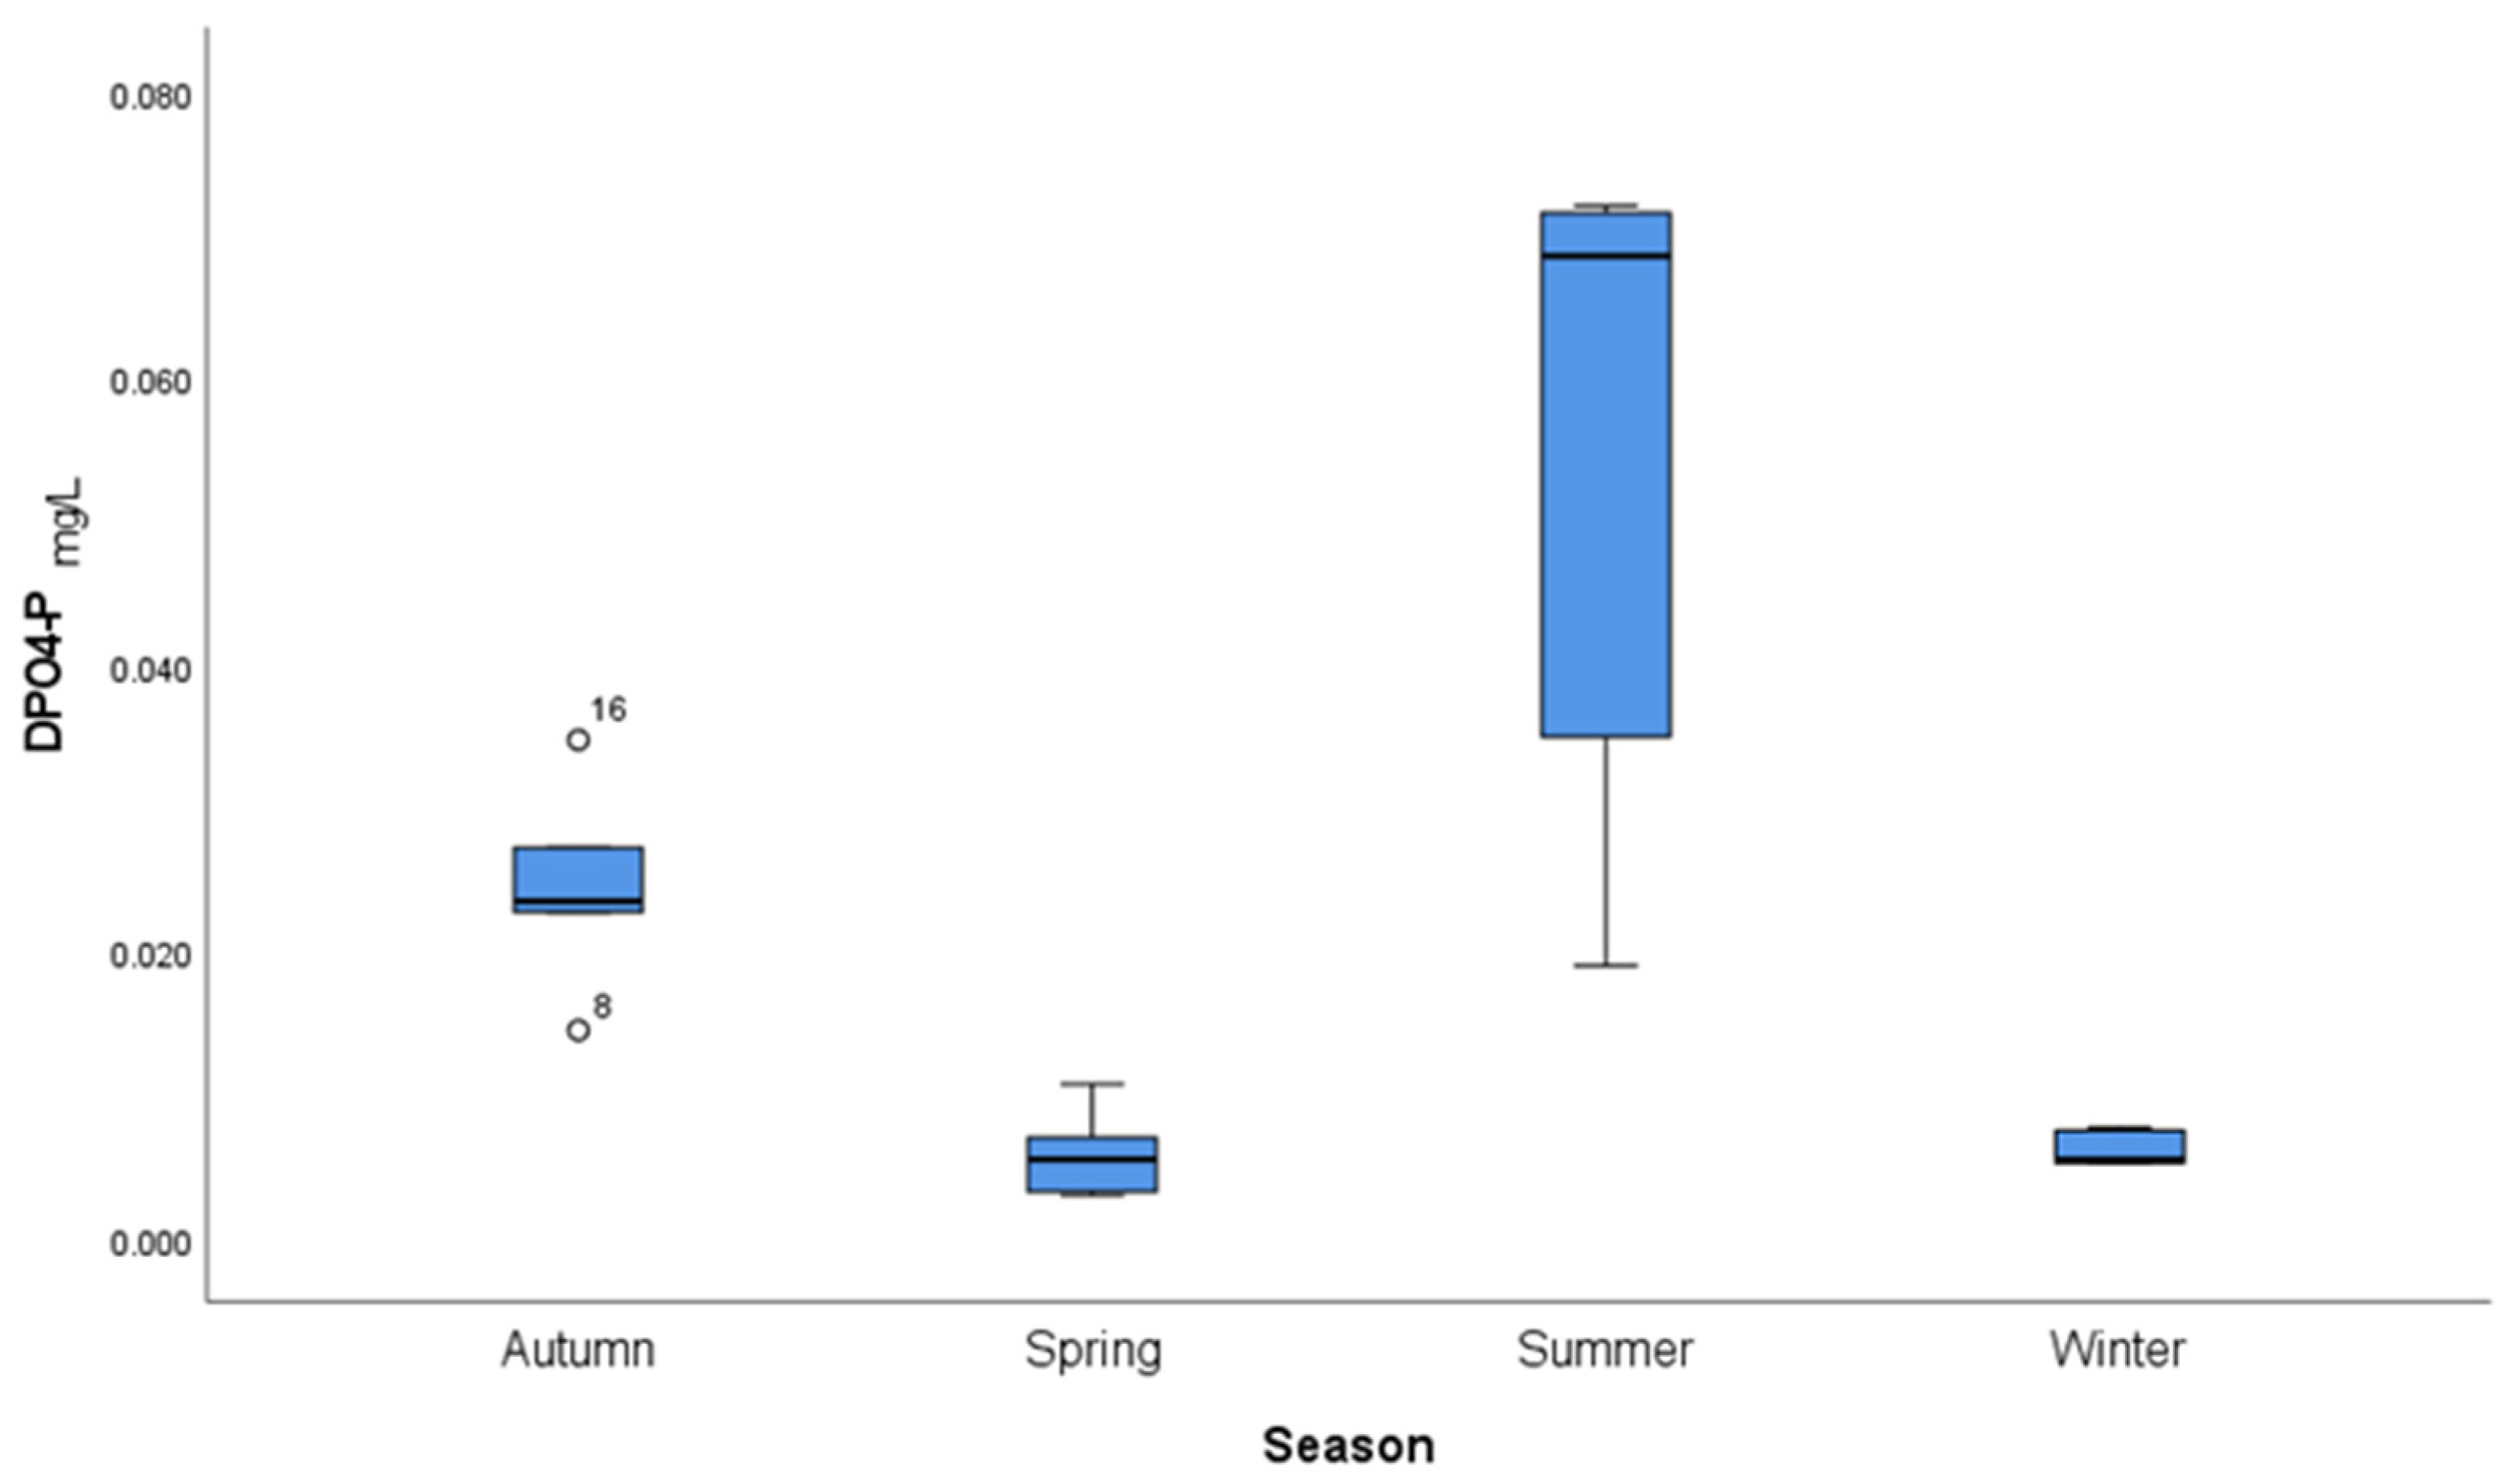
Appendix A show the distribution characteristics of the nutrient parameters in different seasons (autumn, spring, summer, and winter). Regarding the nutrient concentrations across different seasons, the TP concentration in summer is significantly higher than in other seasons, as shown by the box plot with a higher median and upper quartile and a larger range of fluctuations. This indicates that phosphorus release may be triggered by high temperatures in summer.
In the box plot for TN, the median concentration in autumn and winter is higher, indicating stronger variability in TN concentration during these seasons. The TN concentration in spring is the lowest and has a narrower distribution, suggesting smaller changes in TN during this season. NO3-N concentrations are lower in spring and summer with a narrow distribution range, indicating that its seasonal variation is less pronounced compared to autumn and winter. NO2-N shows minor seasonal variation, with higher concentrations in autumn. NH4-N concentrations are higher in summer and autumn, with a larger range of fluctuations in summer. DPO4-P concentrations are significantly higher in summer, indicating more active phosphorus release and eutrophication processes during this season.
Combined with the previously discussed sensitivity analysis of nutrient parameter changes to El Niño, it can be inferred that the occurrence of outliers for different nutrients in the figure may be related to their varying sensitivity to El Niño events.
3.3. Nutrient Load Analysis of the Bottom Water
During different periods before and after the El Niño phenomenon, the changing trend of the nutrient load can be clearly determined through the variation of the WQI (Water Quality Index). This serves as a crucial basis for choosing and formulating environmental management strategies. Based on the evaluation results of the WQI, the key issues of nutrient load can be accurately identified. Since different parameters contribute differently to the WQI, by analyzing the weights and influences of each parameter in the WQI calculation, it is possible to clarify which indicators are the main factors affecting the nutrient load in the bottom water. For example, if the WQI of the bottom water in an estuarine lake fluctuates, further analysis can reveal which nutrient salt content changes have led to the alteration of its proportion in the WQI calculation. Subsequently, the coping strategy can focus on controlling the input of certain nutrient salts, such as strengthening the control of pollutants from the surrounding production and daily life. This approach can avoid the waste of public resources and improve the efficiency of environmental management.
Low load;
Light load;
Moderate load;
High load.
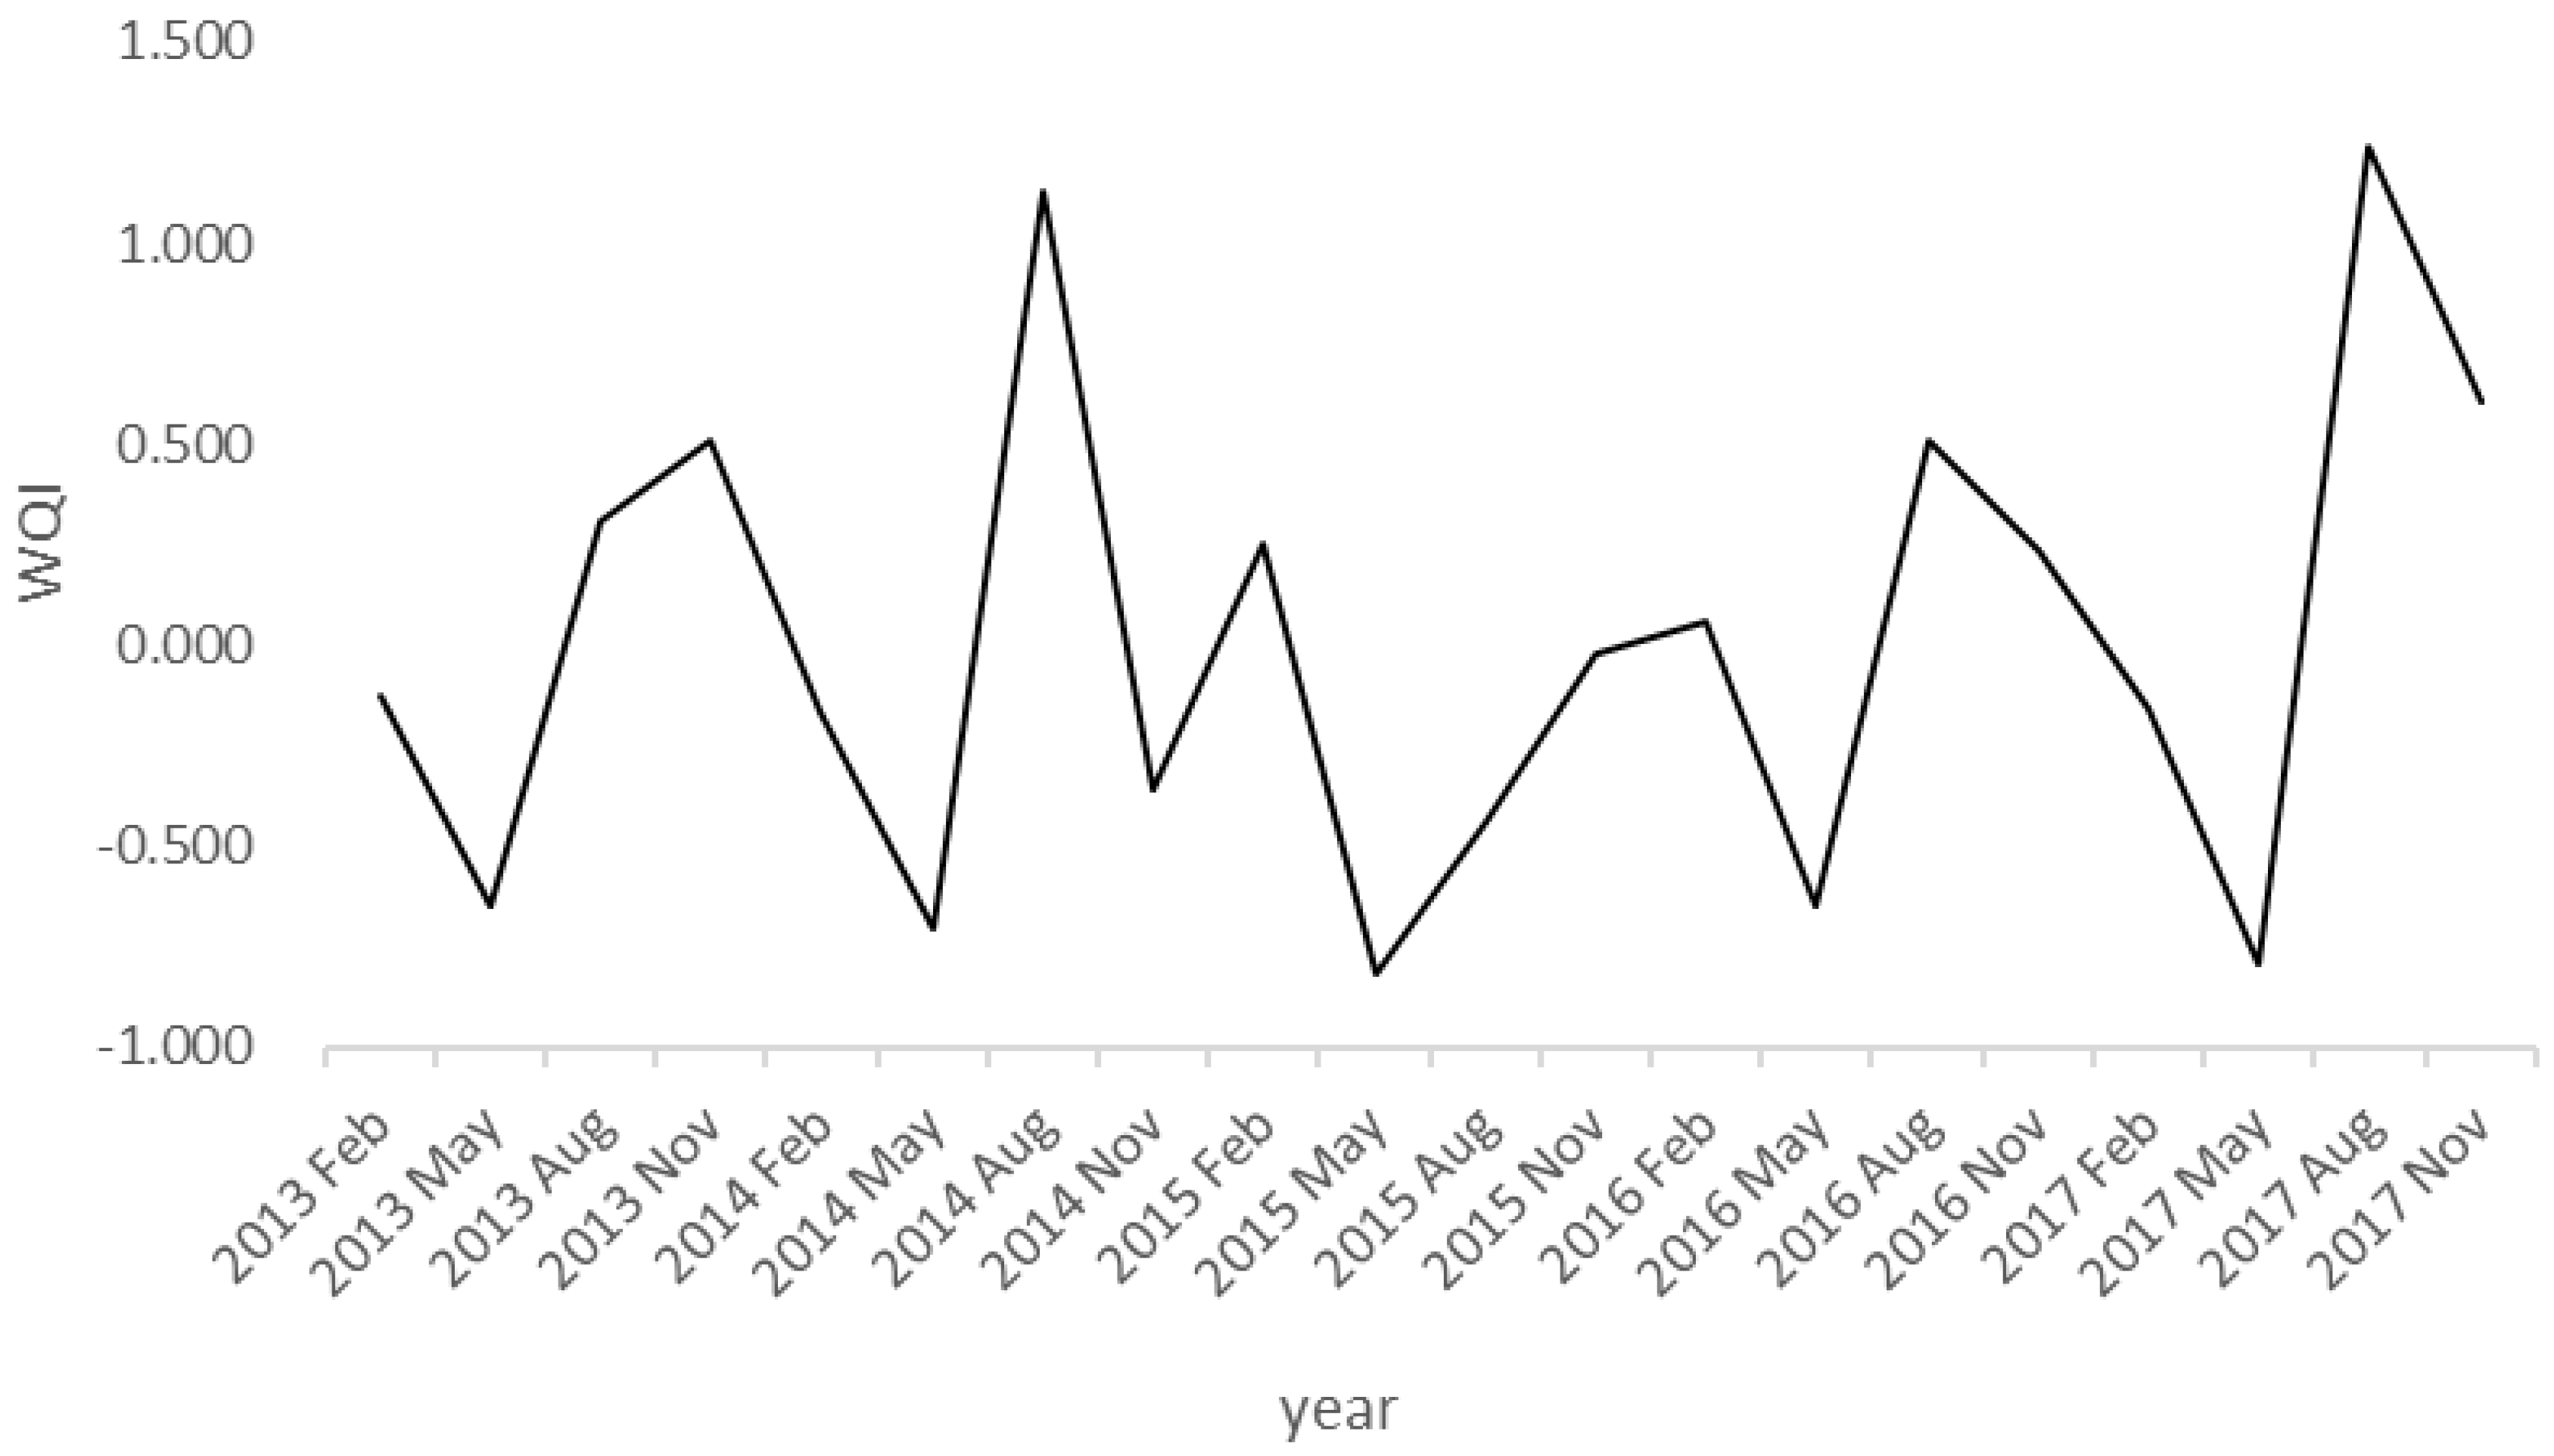
The calculation results of the WQI are shown in
Table 5 (the El Niño periods are presented in bold), and the trend is shown in
Figure A13. The nutrient load level of the bottom water in Lake Nakaumi generally remains at a relatively low level, but there were notable seasonal fluctuations and anomalies. These fluctuations may be closely related to the El Niño phenomenon and seasonal influences. It can be seen that, after the onset of the El Niño event, February 2015 and 2016 were in a moderate load state compared to 2013 when it should have been in a light load state, and this anomaly normalized in February 2017. For comparison during the same period, the WQI in May showed no significant change and remained in a light load state. Conducting a comparison of the data for each August across years, the WQI in August 2014 and 2017 had an anomalously high load (1.126 and 1.242, respectively), while the WQI in August 2015 had an anomalously light load (−0.441), which may be due to a combination of external factors (e.g., intense rainfall and temperature changes) and internal factors (e.g., changes in water circulation). The WQI in November 2014 showed an abnormally light load (−0.359) compared to that in November of 2013 (non-El Niño WQI 0.512). This anomaly began to recover in November 2015, though it remained in an abnormal light load state (WQI −0.018), and by November 2016, when the strong El Niño event ended, the WQI returned to a normal moderate load state for that quarter, albeit at a moderate level (0.238). The WQI in November 2017 (0.605) returned to the 2013 level. This suggests that the nutrient load of the water body gradually returned to normal after the El Niño event, indicating that the lake ecosystem might have been stabilizing.
3.4. Environmental Response Strategies and Suggestions
From the above-mentioned analysis, the El Niño phenomenon has a complex impact on the nutrient load of the bottom water in Lake Nakaumi. There may be a connection between the concentration fluctuations of nutrient salts and the El Niño phenomenon. In the long run, the fluctuating changes in nutrient salts will affect the biodiversity of the ecosystem in Lake Nakaumi and pose a threat to the local ecological security and the sustainable development of the social economy. Therefore, it is particularly necessary to implement corresponding environmental strategies.
Strengthen water quality monitoring and early warning. Based on the temporal variation characteristics of nutrient salts and their sensitivity to the El Niño phenomenon, establish a flexible water quality monitoring system. During the daily data analysis process, special attention should be paid to the parameters that are sensitive to the El Niño phenomenon and show large fluctuations. Combine historical data to build a mathematical prediction model suitable for local conditions, creating conditions for dealing with possible changes.
Appropriately optimize water resource management. For example, high temperatures in summer are likely to trigger the release of phosphorus. Before the arrival of summer, the fluctuation of the nutrient load caused by the increase in nutrient salts can be reduced by means of water replenishment, maintaining the fluidity of the water body and reducing the accumulation of nutrient salts caused by water stagnation.
Strengthen ecological restoration and protection. In view of the fluctuation and change rules of nutrient load, carry out appropriate artificial intervention. For example, supplement and release microbial flora in a timely manner to promote the transformation of nutrient salts. The wetlands around the lake and the aquatic plants in them are important barriers to buffer the inflow of terrestrial nutrient sources into the lake. Protect the wetland ecosystem around the estuarine lake well because wetlands can effectively intercept and purify nutrients, reducing their impact on the water quality of the lake.
Improve and refine policies and regulations. On the basis of considering the fluctuating changes in nutrient load, the management department can refine and clarify the emission standards and total emission limits of various pollutants during the El Niño period and in different seasons. Punish enterprises and individuals who violate the regulations. When carrying out development and construction within and around the water area, careful consideration should be given to minimize the impact on the vegetation on the shore and the wetland ecology.
The implementation of any environmental management strategy requires an assessment of its effectiveness. From the analysis of the changes in nutrient salt parameters of Lake Nakaumi in the previous text, it can be found that directly analyzing the changes in nutrient load is not very easy. Therefore, in the daily environmental management process, there is a need for an intuitive and comprehensive measurement standard that can integrate numerous complex parameters into an intuitive value. Currently, there is no particularly suitable method. Among the existing means, the Water Quality Index is a relatively appropriate alternative. There are many types of water quality indices. Judging from the WQI (Water Quality Index) used in this paper, to a certain extent, it can effectively describe the fluctuations in the nutrient load of water bodies. The accumulation of long-term WQI change data can not only present the fluctuation patterns of nutrient load but also reflect the effects after the implementation of environmental management measures. When analyzing the impact of the El Niño phenomenon on the changes in the nutrient load of estuarine lakes, the dynamic changes of the WQI can help managers promptly understand the response of nutrient load under different climatic conditions, thus enabling them to make rapid responses.
3.5. Comparative Analysis with Lakes at Similar Latitudes
At present, research on the response of lakes to the El Niño phenomenon is extremely scarce. In particular, studies related to brackish-water lakes are even more difficult to find. Considering factors such as year and latitude that must be taken into account in the comparison, this study refers to research on Zhoucun Reservoir in Zaozhuang, China, analyzing the differential changes in NH
4-N and the possible causes [
20]. Due to the lack of suitable literature for other parameters, no further elaboration will be made here.
During the El Niño year (2015), the NH4-N concentration in Lake Nakaumi was 0.010 in May and remained at 0.010 in August. The overall concentration was relatively low and showed no fluctuations. In the same year, the NH4-N concentration in Zhoucun Reservoir increased significantly at the beginning of May and rose to a maximum of 2.36 mg/L in August, showing a relatively large change. For non-El Niño years, since the research on Zhoucun used data from 2012, and due to data limitations, this paper uses data from 2013, a non-El Niño year in the vicinity, for comparison. In August, the NH4-N concentration in Lake Nakaumi was 0.025, with a significant change in concentration. In Zhoucun Reservoir, during July–August, the NH4-N concentration hovered around 1.90 mg/L, showing a significant decrease compared with the data in its El Niño year. The location of Lake Nakaumi is greatly influenced by the ocean, and it has a certain amount of water exchange with the open sea. Compared with Zhoucun Reservoir, during the El Niño year, although there are climate anomalies, the ocean’s huge regulatory effect makes the changes in its water temperature, salinity, etc., relatively mild, thus affecting the change in the NH4-N concentration. Zhoucun Reservoir, on the other hand, is an inland freshwater lake, relatively isolated, and is more affected by the terrestrial climate. During the El Niño year, the abnormal terrestrial climate leads to drastic changes in precipitation, temperature, etc., which in turn has a relatively large impact on the water volume of the reservoir, causing a significant change in the NH4-N concentration. The brackish-water environment of Lake Nakaumi also makes its ecosystem somewhat similar to that of the ocean. The relatively rich species and quantity of organisms have a relatively strong effect on the absorption and transformation of nutrients such as NH4-N, which can buffer the change in the NH4-N concentration to a certain extent. The relatively high water salinity also affects the existing form and chemical equilibrium of NH4-N, making its concentration relatively stable. In contrast, the freshwater environment of Zhoucun Reservoir has a relatively simple ecosystem and a relatively weak buffering capacity for NH4-N. Moreover, the reservoir may be significantly affected by human activities such as surrounding agriculture and industry. During the El Niño year, climate anomalies may lead to more nitrogen-containing pollutants entering the reservoir along with runoff, etc., causing an increase in the NH4-N concentration.
Overall, the reason for the differences in their changes is likely that Lake Nakaumi is restricted by the marine environment. The El Niño phenomenon mainly affects the water exchange and biological activities indirectly by changing the ocean circulation, water temperature, etc., thus affecting the NH4-N concentration. Zhoucun Reservoir, being greatly influenced by the terrestrial climate and human activities, is mainly affected by changing terrestrial climate conditions such as precipitation and temperature, which directly affect the physical conditions of the reservoir and the input of surrounding pollutants, thereby affecting the NH4-N concentration.
4. Conclusions
This study analyzed the nutrient data of the bottom water of Lake Nakaumi from 2013 to 2017 to evaluate the possible connection between the El Niño phenomenon and the changes in nutrient load in the bottom water of Lake Nakaumi. The WQI method was used to present the complex changes in water nutrient load in a simpler way. As far as the bottom water of Lake Nakaumi is concerned, there may be the following connections between the changes in its nutrient load and the El Niño phenomenon:
DPO4-P was most sensitive to the peak intensity of the El Niño phenomenon.
Compared with NO3-N, the changes in NO2-N and DPO4-P were more sensitive to the onset of the El Niño cycle.
The El Niño phenomenon had differential impacts on various forms of nitrogen and phosphorus in Lake Nakaumi.
This paper is an exploration of the relationship between the El Niño phenomenon and changes in water nutrient load. Due to limitations in available data, there are many deficiencies that need to be further improved in the future:
The data for case analysis only cover one El Niño cycle, with a limited time coverage.
Only the main nutrient indicators were analyzed and discussed, without involving the analysis of biological factors such as benthic animals and fish. These biological factors also play important roles in the assessment of lake ecosystems and may have more complex responses to the El Niño phenomenon.
There are many interfering factors affecting the nutrient load of the bottom water. The currently used data cannot confirm with certainty whether these changes are caused by sediment release, bioturbation, or meteorological factors.
The evidence for the correlation between the fluctuating changes in nutrient load in the bottom water and climate change still needs to be further strengthened.
The differences among monitoring stations still need to be further clarified.
The frequent occurrence of extreme climates has become a major challenge for human survival and development. In the future, it is necessary to further strengthen lake monitoring, especially in the periods before and after the El Niño cycle, and collect data at a higher frequency to capture the response process of lake ecosystems to climate events. In addition, experimental methods can be used to simulate the lake thermal stratification and nutrient release processes under the El Niño phenomenon in order to better understand the direct impacts of rising water temperatures and extreme climate events on lake water quality. These will all be important supports for future lake ecological environment management.
In conclusion, this paper, to a certain extent, provides a speculation on the possible impacts of the El Niño phenomenon on the nutrient load of the bottom water of lakes. As a beneficial attempt, it is hoped that this can attract the attention of researchers from all over the world to this research field.
Finally, it should still be emphasized that this research is preliminary.


