1. Introduction
Cucurbita ficifolia Bouché, more commonly referred to in Mexico as chilacayote, is a fruit cultivated in Mexico that belongs to the Cucurbitaceae family. Recent studies have highlighted the comprehensive nutritional and health-promoting properties of various parts of Cucurbitaceae plants, emphasizing their potential as functional ingredients in the food industry [
1]. In particular, chilacayote has been shown to contain a wide range of beneficial components, including carbohydrates, vitamins, minerals, and phenolic compounds. These bioactive constituents have been associated with the prevention and/or treatment of chronic and cardiovascular diseases, exhibiting antioxidant, anti-inflammatory, and hypoglycemic effects [
2].
In the realm of fruit utilization, ripe fruit can undergo a processing procedure that transforms it into a powder. This transformation signifies a pragmatic solution for its application in food-related contexts. Several studies have demonstrated that the administration of chilacayote powder results in several additional metabolic benefits, including reductions in blood triacylglyceride and insulin levels, as well as improvements in insulin resistance. Consequently, the development of new food products incorporating chilacayote, in its ripe or powdered form, is imperative, as it may contribute to current governmental strategies aimed at improving public health.
One promising application of chilacayote powder is its use in fortifying corn tortillas, a strategy that aligns with the food-to-food fortification framework, which seeks to improve the nutritional profile of staple foods through the inclusion of nutrient-dense whole foods rather than synthetic fortificants [
3]. In this sense, with the fortification process, nutrients or bioactive compounds are incorporated into a food matrix [
4], enabling the delivery of the nutritional benefits of chilacayote powder through widely consumed foods. In this context, tortillas were selected as the food vehicle due to their high consumption rate among the Mexican population, with approximately 94% of individuals including tortillas in their daily diet, making them an ideal carrier for functional ingredients. However, fortification not only modifies the nutritional profile of tortillas but also affects their structural properties, including appearance, flavor, and texture, which can significantly influence consumer satisfaction and, in some cases, result in low market acceptance [
5]. Consequently, conducting sensory analyses is imperative to identify, compare, and enhance the desirable attributes of fortified tortillas.
Although a wide range of tortilla fortification strategies has been reported in the literature, relatively few studies have systematically evaluated the sensory attributes of tortillas fortified with functional ingredients. In this context, in [
6,
7] the appearance, flavor, odor, texture, and overall acceptability of tortillas fortified with soy flour and its by-products are assessed using 5- and 7-point hedonic scales, respectively. Furthermore, multivariate statistical techniques such as Principal Component Analysis (PCA) [
8] and Generalized Procrustes Analysis (GPA) [
9,
10] have been widely used to characterize and differentiate sensory attributes among tortilla formulations.
Despite the well-documented health benefits of
Cucurbita ficifolia and the growing interest in functional foods, its application as a fortifying agent in corn tortillas remains limited, particularly in terms of sensory perception and consumer acceptance. Most previous works on fortified tortillas have focused on nutritional enhancement, while sensory differences have been examined using hedonic scales combined with multivariate feature extraction techniques, such as Principal Component Analysis (PCA), Linear Discriminant Analysis (LDA), and hybrid PCA+LDA approaches [
11]. Among these, LDA stands out due to its ability to reduce data dimensionality and identify relevant sensory attributes, thereby facilitating the interpretation of consumer responses. Nevertheless, several studies have reported methodological limitations associated with LDA, especially when handling complex sensory data. In this context, innovative computational methods, including evolutionary strategies, are increasingly being adopted to address the complexities of food classification and authentication, often providing more reliable results than conventional linear approaches [
12,
13]. Consequently, in this research we propose an alternative approach with an evolutionary algorithm-based feature extraction method, which aims to overcome these limitations and provide a more robust framework for the sensory analysis of tortillas fortified with chilacayote powder.
2. Materials and Methods
The materials and methods employed in this study were designed to evaluate the sensory characteristics of corn tortillas fortified with chilacayote powder. This section describes the preparation of the biological material, the formulation and processing of fortified and non-fortified tortillas, and the sensory evaluation protocol applied to assess consumer perception. In addition, the feature extraction techniques applied in the analysis are described to clarify the experimental procedures and ensure methodological transparency and reproducibility.
2.1. Materials
2.1.1. Biological Material
Chilacayote powder was obtained from ripe Cucurbita ficifolia Bouché fruits. The fruits were sliced and dehydrated using an electric dehydrator (LÉQUIP, model 918) at 60 °C for 8 h, after which the dried material was ground to obtain a fine powder. The particle size of the chilacayote powder was not sieved or measured, as it was obtained as a fine and visually homogeneous powder and was not a variable within the scope of this study. Nixtamalized maize dough was purchased from a local dough distribution center, and commercial maize flour was obtained from a supermarket, both located in Xalapa, Veracruz, Mexico.
2.1.2. Tortilla Preparation and Treatments
Four types of tortillas were prepared: (i) nixtamalized dough tortilla, (ii) nixtamalized dough tortilla fortified with chilacayote powder, (iii) commercial flour tortilla, and (iv) commercial flour tortilla fortified with chilacayote powder. Each tortilla was prepared using 30 g of nixtamalized dough or commercial flour. For fortified tortillas, 1 g of chilacayote powder replaced 1 g of the base material, resulting in a formulation of 29 g of dough or flour and 1 g of chilacayote powder. Tortillas were cooked on a digital electric griddle (comal) maintained at a constant temperature of 200 °C. Surface temperatures were monitored with a digital infrared thermometer; the tortillas were cooked for 1 min on the first side, with the surface temperature ranging between 60 and 75 °C. They were then flipped and cooked for 30 s on the opposite side, followed by an additional 15 s on the first side to ensure uniform cooking.
2.1.3. Sensory Analysis
Sensory evaluation was conducted with a total of 150 untrained consumers who were regular tortilla consumers, aged between 18 and 25 years. No exclusion criteria were applied; participation was limited to individuals who expressed willingness to undergo the testing.
The evaluation was carried out at two locations: the Tulancingo de Bravo campus of the Universidad Autónoma del Estado de Hidalgo (75 judges: 48 women and 27 men) and the Faculty of Agronomy of the Universidad Veracruzana, Xalapa campus (75 judges: 33 women and 42 men). The samples evaluated included nixtamalized dough tortillas, commercial flour tortillas, and their respective formulations fortified with chilacayote powder. Tortilla samples were served at an average temperature of 35 °C and presented four times in randomized order. Each judge completed a Check-All-That-Apply (CATA) questionnaire for each sample, evaluating attributes related to color (cream, beige, sand, brown, yellow, camel, coffee, other), smell (nixtamal, corn, acidic, sour, burnt, earthy, humid, sweet, piloncillo, other), texture (porous, soft, smooth, hot, rough, chewy, sandy, thick, elastic, rigid, moldable, spongy, other), taste (salty, sour, acidic, lime, corn, nixtamal, earthy, burnt, doughy, toasted, piloncillo, other), mouthfeel (elastic, rigid, hard, rough, moist, creamy, pasty, spongy, chewy, dry, gummy, other), and aftertaste (sweet, salty, corn, nixtamal, lime, piloncillo, other), following the methodology described in [
14]. The use of these established descriptors is critical for enabling robust comparisons of sensory profiles and for validating the consistency between consumer perceptions and trained panel evaluations, as highlighted in recent studies on methodological terms development [
15]. The ‘other’ responses were analyzed by collecting terms not included in the original questionnaire, provided they represented characteristics different from those established.
The sensory data analysis in this study primarily focuses on multivariate projection and the evaluation of class separability in a reduced-dimensional space. Consequently, traditional univariate inferential tests, such as Cochran’s Q for CATA data, were bypassed in this phase of the research to prioritize the development and validation of the evolutionary framework. This approach allows a direct assessment of how the algorithm captures the global structure of consumer perception by optimizing the projection matrix.
2.2. Feature Extraction Methods
This section describes four linear dimensionality reduction techniques: Principal Components Analysis (PCA), Linear Discriminant Analysis (LDA), their combination (PCA+LDA), and an evolutionary approach known as Differential Evolutionary Linear Discriminant Analysis for Feature Extraction and Visualization (DE-).
Throughout this section, scalars are denoted by standard italic letters (e.g., ), vectors by bold lowercase letters (e.g., ), and matrices by bold uppercase letters (e.g., ). The i-th element of a vector is written as , and the -th entry of a matrix as .
Under this notation, the dataset is represented by a matrix
. The four aforementioned dimensionality reduction techniques aim to transform this representation into a lower-dimensional space
, with
. This transformation is achieved through linear combinations of the original variables
, for
, as presented in Equation (
1) [
16,
17].
This transformation can be expressed as the matrix multiplication shown in Equation (
2), where
is the projection matrix composed of the weights of the linear combinations as columns.
Different projection matrices yield distinct representations of the dataset
. Therefore, the following sections describe the techniques employed by the four methods to obtain these projection matrices. The computation of the projection matrices differs across methods, as each technique is designed to achieve a specific objective.
2.2.1. Principal Components Analysis (PCA)
Principal Components Analysis (PCA) is an
unsupervised dimensional reduction technique that identifies orthogonal directions of
maximum variance in the data, known as principal components [
18]. These directions are obtained by solving the eigenvalue problem associated with the empirical covariance matrix of the dataset. Given a centered dataset
, the covariance matrix is computed as in Equation (
3).
PCA then solves the eigenvalue problem presented in Equation (
4), where
and
denote the
i-th eigenvalue and its corresponding eigenvector, respectively.
The eigenvalues represent the amount of variance captured by each principal component and are ranked in descending order such that
.
Then, the projection matrix
is constructed by selecting the
d eigenvectors associated with the largest eigenvalues, as in Equation (
5).
The reduced representation of the data is obtained by projecting the original dataset onto the lower-dimensional subspace with the matrix multiplication presented on Equation (
6).
This transformation preserves most of the variance presented in the original data while reducing dimensionality.
2.2.2. Linear Discriminant Analysis (LDA)
Linear Discriminant Analysis (LDA) is a
supervised dimensionality reduction technique that seeks to project a dataset to maximize
class separability [
19]. The process is intended to achieve this objective by simultaneously maximizing between-class variance and minimizing within-class variance. Given a labeled dataset
composed of
C classes, let
be the mean vector of class
c, and let
be the global mean vector of the dataset. The within-class scatter matrix
and the between-class scatter matrix
are defined as the Equations (
7) and (
8), respectively, where
is the number of samples in class
c.
LDA is based on Fisher’s criterion, which seeks a projection matrix
that maximizes the ratio of between-class variance to within-class variance in the projected space. The optimization problem can be formulated as in Equation (
9).
The optimal projection matrix
is obtained by solving the generalized eigenvalue problem presented in Equation (
10), where
and
are the generalized eigenvalues and eigenvectors, respectively.
The eigenvectors corresponding to the largest eigenvalues define the directions that maximize class separation. The projection matrix
is formed by selecting the
d eigenvectors associated with the highest eigenvalues, as shown in Equation (
11).
The low-dimensional representation of the dataset is obtained with the matrix multiplication on Equation (
12).
LDA provides a feature space that enhances class separability by incorporating class labels, making it suitable for data classification and interpretation.
In practice, LDA may suffer from the Small Sample Size problem (SSS problem), in which the within-class scatter matrix
becomes singular or ill-conditioned when the number of features exceeds the number of samples [
20]. To address this limitation, a common strategy is to apply the PCA+LDA method, which is described in the following section.
2.2.3. PCA+LDA
The combined PCA+LDA approach is employed to overcome the limitations of LDA when applied to high-dimensional datasets with a limited number of samples [
21]. In this strategy, PCA is first used as a preprocessing step to reduce the dimensionality of the original data while preserving most of its variance. Then the reduced dataset is used as input for LDA. By operating in this lower-dimensional space, the within-class scatter matrix becomes nonsingular, allowing the LDA optimization problem to be properly defined and enabling class separability in the transformed space.
The projection matrix of the PCA+LDA method is then obtained as the product of the individual projection matrices presented in Equation (
13), and the low-dimensional representation of the original dataset is computed as in Equation (
14).
By integrating PCA and LDA, this approach combines variance preservation and discriminative feature extraction, resulting in a more stable and effective data projection.
2.2.4. Differential Evolutionary Linear Discriminant Analysis for Feature Extraction and Visualization (DE-)
In this study, the Differential Evolutionary Linear Discriminant Analysis for Feature Extraction and Visualization (DE-) method is utilized to reduce the dimensionality of the analyzed dataset. This process facilitates class separability and visualization. This method employs the Differential Evolution (DE) algorithm for optimization. The subsequent sections will thus provide a concise exposition of both methods.
Differential Evolution (DE)
Differential Evolution (DE) is a population-based stochastic search strategy for optimization [
22]. It iteratively improves a population of candidate solutions using mutation, crossover, and selection operators. In the context of high-dimensional, non-convex search spaces, DE has been shown to be particularly effective because it does not require gradient information. Instead, it relies exclusively on objective function evaluations, a strategy shown to be advantageous in such environments. There are several DE strategies [
23,
24], but the DE/best/1/bin strategy is described in detail next.
In generation
g, the population comprises
N candidate solutions (individuals) randomly generated in the domain of a given function
f, called
fitness function. The elements in the population are denoted by vectors
as in Equation (
15), where
d is the dimensionality of the problem.
Each vector is evaluated using the fitness function, in order to proceed with the following operators:
Mutation
For each target vector
, a mutant vector
is generated by adding the weighted difference of two randomly selected population vectors to a third vector, according to the strategy. Equation (
16) describes this process, where
is the index of the individual in the population with the highest fitness value, and
and
are indices randomly chosen from
, and different from both
and each other. The parameter
F is the mutation factor, which controls the amplification of differential variation. The value of
F is specified by the user and constrained to the interval
.
Crossover
To increase population diversity, the mutant vector
is combined with the target vector
to form a trial vector
. In this process, a coordinate-wise selection is performed between the mutant vector
and the target vector
to form a trial vector
. If a randomly generated value
is lower than the user-defined crossover rate
, or if the coordinate index
j corresponds to a randomly selected position
, the corresponding component is inherited from
. Otherwise, the component is taken from
. This process is implemented through the binomial crossover, as delineated in Equation (
17).
Selection
The trial vector
competes with the target vector
for survival into the next generation. The selection is performed in a greedy manner as outlined in Equation (
18), where
denotes the objective function to be maximized.
These steps are repeated until a stopping criterion is met, such as reaching a maximum number of generations or population convergence.
The parameters
N,
G,
, and
F employed for the DE algorithm are problem-dependent and significantly influence the performance of the process [
25].
Differential Evolution (DE) remains a powerful and versatile population-baed metaheuristic, particularly efective in solving complex, non-convex optimization problems across various engineering domains [
26]. Due to its simple structure, limited number of control parameters, and robust global search capability, Differential Evolution has been successfully applied to optimization problems, rendering it a suitable approach for identifying optimal projection matrices for feature extraction techniques, as will be described in the following section.
DE-
The DE- method is proposed to obtain a projection matrix that enhances class separability while enabling low-dimensional visualization. Unlike classical Linear Discriminant Analysis (LDA), which relies on inverting scatter matrices and may become unstable under singularity or small-sample-size (SSS) conditions, this approach reformulates dimensionality reduction as a global optimization problem. Specifically, the Differential Evolution (DE/best/1/bin variant) is used to explore the space of orthonormal projection matrices and directly maximize the Fisher criterion without requiring matrix inversion. This formulation ensures that the objective function remains well-defined while providing robustness against multicollinearity and SSS scenarios, preserving the discriminative structure of the sensory data.
The projection space is restricted to two dimensions to facilitate graphical representation and interpretation, a common practice in sensory science where 2D discriminant plots enable direct geometric visualization of the relationships between sensory attributes and product formulations. Within this framework, each candidate projection matrix is encoded as a vector by concatenating its columns, as described in Equation (
19), and represents an individual within a population of size
N. These individuals evolve through mutation, crossover, and selection operators, and after crossover, a repair mechanism is applied to enforce the orthonormality constraint, ensuring that all candidate solutions remain valid projection matrices throughout the optimization process.
This formulation not only ensures robustness under non-ideal data conditions but also provides a flexible, data-agnostic framework. The effectiveness of this evolutionary strategy has been demonstrated in other high-dimensional contexts [
27], highlighting its ability to handle multicollinearity and complex class structures beyond the sensory application considered in this study.
2.3. Class Separability Metrics
The effectiveness of a dimensionality-reduction method can be evaluated by the extent to which the projected feature space preserves class discrimination. In supervised settings, this is typically evaluated by assessing how well samples remain grouped by class label after projection. To quantitatively assess the quality of the resulting feature space, several class-separability metrics can be employed.
In this study, three complementary measures are considered: the Davies–Bouldin Index (DBI), the Silhouette Coefficient (SC), and the KNN Overlap Score (KNN-OS). These metrics evaluate distinct geometric properties of the projected space. DBI provides a global assessment by relating cluster compactness to centroid separation. SC provides a semi-local evaluation by integrating intra-class cohesion and nearest-cluster separation at the sample level. In contrast, the KNN-OS measures strictly local class mixing by quantifying label inconsistency within neighborhoods. Consequently, while DBI emphasizes global structural separation, SC and KNN-OS capture local overlap effects, which are particularly relevant when analyzing low-dimensional visualizations. This complementary assessment reduces reliance on a single notion of cluster geometry and leads to a more robust and reliable evaluation of separability.
In this section, a brief explanation of these metrics is presented.
2.3.1. Davies–Bouldin Index (DBI)
The Davies–Bouldin Index (DBI) evaluates the relative similarity between clusters by quantifying the trade-off between intra-class dispersion and inter-class separation [
28].
For a dataset consisting of samples from
C classes, the
intra-class dispersion, defined in Equation (
20), is calculated as the average distance between the samples belonging to class
i and their corresponding centroid, denoted by
. Here,
represents the number of samples in class
i, and
denotes the Euclidean distance used to measure pairwise distances.
The
inter-class separation between two classes
i and
j, denoted by
, is defined as the distance between their respective centroids, as shown in Equation (
21).
The similarity measure between classes
i and
j, denoted as
, is defined as in Equation (
22).
For each class
i, the maximum similarity with respect to all other classes is determined, yielding the worst-case similarity value
, as defined in Equation (
23).
Finally, the Davies–Bouldin Index (DBI) is computed as the average of the worst-case similarity values across all classes, as shown in Equation (
24).
Lower DBI values indicate better class separability, as they reflect clusters that exhibit low intra-class dispersion and large inter-class separation. In other words, a small DBI corresponds to compact classes whose centroids are well separated from one another, thereby reducing cluster overlap.
2.3.2. Silhouette Coefficient (SC)
The Silhouette Coefficient (SC) evaluates how well each sample is assigned to its corresponding class compared to other classes, and is widely recognized as a robust internal validation metric for assessing both the cohesion and separation of clusters in high-dimensional datasets [
29,
30].
For sample
, the mean distance between it and all other samples belonging to the same class is defined as the average intra-class distance, denoted by
, and presented in Equation (
25).
quantifies the extent to which the sample
is embedded within its designated class, thereby measuring its compactness.
On the other hand, the minimum average inter-class distance is defined as the smallest average distance between the sample
and all the samples belonging to any other class
, with
, as presented in Equation (
26).
is responsible for evaluating the distance between the sample and the nearest neighboring class, thus providing an indication of its separation.
Then, the Silhouette Coefficient (SC) for a sample
is defined as in Equation (
27), where
represents the average intra-class distance, and
the minimum average inter-class distance.
The SC ranges from −1 to 1. Values close to 1 indicate well-separated and compact classes, while values near 0 suggest class overlap.
The average Silhouette score over all samples is commonly considered to provide a global measure of geometric class separation.
2.3.3. KNN Overlap Score (KNN-OS)
The K-Nearest Neighbours Overlap Score (KNN-OS) is a local separability metric that evaluates the degree of class overlap in a projected feature space by analyzing neighborhood consistency. Unlike global dispersion-based measures, KNN-OS quantifies the frequency with which samples are surrounded by neighbors from different classes, thereby providing a local assessment of class mixing [
31,
32].
Given a dataset with labeled samples, let
denote the set of
k nearest neighbours of sample
, computed using the Euclidean distance
. For each sample
, the local overlap score is defined as the proportion of neighbours that belong to a different class
, defined in Equation (
28), where
and
denote the class labels of samples
and
, respectively, and
is the indicator function, which equals to 1 if the condition is true and 0 otherwise.
The global KNN Overlap Score (KNN-OS) is then computed as the average over all samples, as in Equation (
29), where
m is the number of samples in the dataset.
The KNN-OS takes values in the interval . Lower values indicate better class separability, as they imply that most samples are surrounded by neighbours of the same class. Conversely, higher values suggest significant class overlap in the projected space.
Because KNN-OS evaluates local neighbourhood structure, it is particularly suitable for assessing class separation in low-dimensional visualizations, where local mixing may not be fully captured by global metrics such as the Davies–Bouldin Index.
2.3.4. Comparative Interpretation of Class Separability Metrics
To ensure a consistent interpretation of the separability results, it is important to analyze the range and optimization direction of each metric considered in this study. The Davies–Bouldin Index (DBI), the Silhouette Coefficient (SC), and the KNN Overlap Score (KNN-OS) evaluate complementary geometric properties of the projected feature space; however, their numerical scales and optimization criteria differ.
The DBI is a non-negative and unbounded metric defined on the interval . Lower values indicate better separability, as they correspond to compact clusters with large inter-class distances. In contrast, the Silhouette Coefficient is bounded in the interval , where values close to 1 indicate well-clustered samples, values near 0 suggest overlapping clusters, and negative values reflect potential misclassification. The KNN-OS metric lies in the interval , with lower values indicating reduced local class mixing and, therefore, better separability.
Table 1 summarizes the numerical ranges and optimization criteria for the evaluated metrics. The structural level indicates the geometric scope at which each metric evaluates class separability. Global structure refers to measures based on overall cluster dispersion and centroid separation; semi-global structure denotes metrics computed at the sample level but influenced by neighboring cluster relationships; and local structure corresponds to strictly neighborhood-based measures that quantify label consistency within local regions of the projected space.
2.4. General Experiment Design
This section describes the experiments conducted to compare dimensionality-reduction methods. The analysis aims to assess the discriminative quality of the projected feature spaces obtained by each method. To this end, the class separability metrics described in
Section 2.3 were employed as quantitative evaluation criteria.
In these experiments the dataset was not partitioned into training and testing subsets. This decision was made because the primary objective of the study is not to evaluate classification accuracy or predictive generalization performance, but rather to compare the intrinsic discriminative capacity of different feature representations. Accordingly, the evaluation focuses exclusively on geometric and structural separability properties of the projected data.
The PCA, LDA, and PCA+LDA methods are analytical and deterministic approaches. Given the same dataset, these methods yield unique projection matrices; therefore, a single execution suffices to obtain their corresponding results.
In contrast, the DE- method is a stochastic, population-based metaheuristic algorithm. Due to its evolutionary search mechanism, different runs may yield distinct projection matrices and separability values. To ensure statistical reliability, the DE- algorithm was executed 10 times under the same parameter configuration. The reported separability metrics correspond to the mean values obtained across these runs. Furthermore, to provide a fair and meaningful comparison with the deterministic analytical methods, the best solution identified among the 10 executions is reported and used for direct comparison. This evaluation framework allows a consistent comparison between deterministic and stochastic approaches while accounting for the inherent variability of evolutionary optimization methods.
For the experimental evaluation, two strategies were considered. First, a global analysis was conducted using all variables in the dataset simultaneously, thereby enabling assessment of overall class separability across the full feature space. Second, an attribute-based analysis was performed, in which only the subset of variables corresponding to each sensory attribute was considered independently (color, smell, texture, taste, mouthfeel, and aftertaste, as described in
Section 2.1.3). This dual evaluation framework enables the examination of both the collective discriminative power of all sensory variables and the individual contribution of each attribute to class separation.
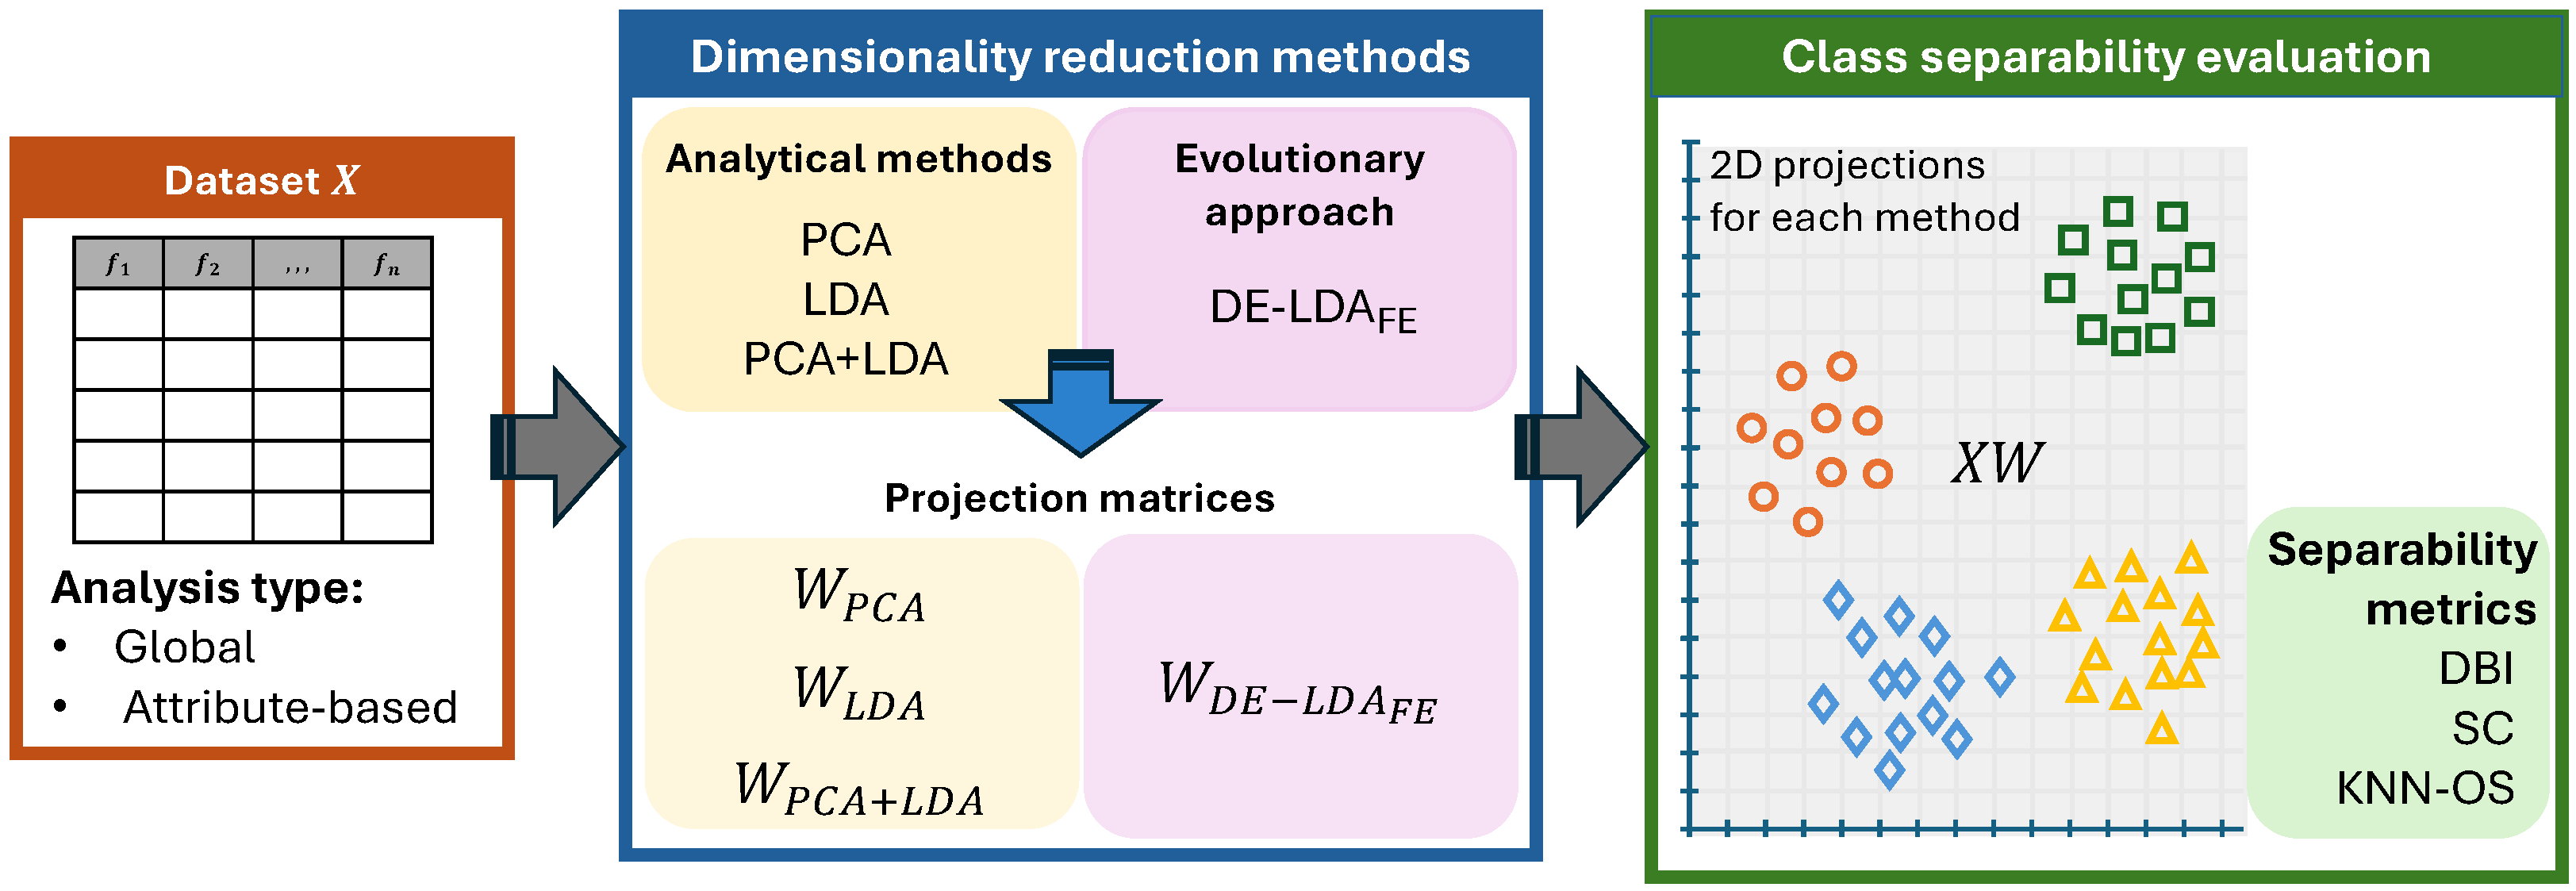
Figure 1 summarizes the experimental workflow implemented in this study. For each dataset (Xalapa or Tulancingo), the process begins by considering one of the two analysis strategies (global or attribute-based). Subsequently, dimensionality-reduction techniques are applied to compute projection matrices in a two-dimensional space. Both analytical methods (PCA, LDA, and PCA+LDA) and the proposed evolutionary approach (DE-
) are implemented under identical dimensional constraints to ensure a fair comparison. The resulting projected datasets are then evaluated using multiple class separability metrics (DBI, SC, and KNN-OS), which quantify complementary global and local discrimination properties of the feature space.
The separability results are analyzed and compared across dimensionality-reduction methods and analysis types (global and attribute-based). This evaluation framework enables not only the assessment of the effectiveness of each projection strategy, but also the characterization and differentiation of the various tortilla types based on their sensory profiles.
It is important to note that the dimensionality reduction methods considered in this study (PCA, LDA, PCA+LDA, and DE-) are used exclusively for feature projection. In particular, DE- is designed to enhance class separability within the projection space while facilitating intuitive data interpretation and visualization. Consequently, no classifier training or prediction tasks were performed. The focus of this work is on the geometric organization of multivariate sensory data to support human analysis, rather than on the automated classification of new samples.
Within this context, Generalized Procrustes Analysis (GPA) was not included in the comparative framework. Although GPA is widely used in sensory studies to align panel configurations through consensus-based geometric transformations, the present study specifically emphasizes supervised dimensionality reduction approaches aimed at maximizing discrimination between tortilla profiles.
2.5. Computational Framework and Visualization
All computational procedures, including the evolutionary optimization of the projection matrices, the calculation of separability metrics, and the generation of 2D discriminant plots, were performed using MATLAB R2023b.
3. Experiments
This section presents the experimental framework used to determine the most suitable feature-extraction method for analyzing sensory differences among nixtamal tortillas, commercial flour tortillas, and their respective fortifications with chilacayote powder.
For each sensory evaluation dataset (Xalapa and Tulancingo), the following experimental procedure was implemented:
Select the dataset according to the analysis type:
- (A)
Global analysis. In the global analysis, the complete dataset was considered, including all variables corresponding to the sensory attributes evaluated in the tortillas. Thus, for this type of analysis, each dataset X is represented as a 300 × 62 matrix, where 300 denotes the number of samples and 62 the total number of sensory variables.
- (B)
Attribute-based analysis. In the attribute-based analysis, subsets of the dataset were evaluated independently for each sensory attribute of the tortillas: color, smell, texture, taste, mouthfeel, and aftertaste. For each attribute, only the variables corresponding to that specific sensory dimension were selected, generating a reduced dataset
X for analysis. The dimensionality of each attribute-specific dataset is detailed in
Table 2.
Apply the selected dataset to compute the projection matrices of the analytical dimensionality-reduction methods (PCA, LDA and PCA+LDA). The analysis was performed on the binary raw data matrix obtained from the CATA task, which was centered to shift the coordinate system to the data mean. Standardization was not applied, as all variables share the same binary scale (0 and 1), and preserving their original variance is essential to maintain the relative contribution of each sensory attribute. Since these approaches are deterministic, a single execution is sufficient to obtain the corresponding projection matrix for each method. Once the projected feature spaces are obtained, the class separability measures considered in this study (DBI, SC, and KNN-OS) are computed to quantitatively assess the discriminative quality of each projection.
For the KNN-OS metric, the neighborhood size considered is , since it provides a strict local assessment of class mixing, particularly suitable for evaluating separability in low-dimensional visualization spaces, ensuring a robust evaluation of local overlap effects in the projected feature spaces.
Apply the selected dataset to compute projection matrices using the evolutionary approach (DE-), following the search strategy described below:
- 3.1.
A grid search strategy was implemented by systematically combining different values of the Differential Evolution (DE) parameters: population size
, number of generations
, crossover rate
, and scale factor
. The full factorial design resulted in a discrete search space, denoted as in Equation (
30), with a total of 324 distinct parameter configurations.
Although this grid search introduces a one-time computational cost during the calibration phase, the scalability of DE-
remains robust. Since the method projects data into a two-dimensional space, the optimization problem is defined over a space of size
, where
m is the number of variables. This constraint keeps the search space tractable as
m increases, ensuring computational feasibility for large-scale sensory analyses.
- 3.2.
For each parameter configuration
the DE-
algorithm was executed to obtain an optimal projection matrix
, and the corresponding projections
of the dataset
X are obtained with the calculation presented on Equation (
2).
- 3.3.
For each projected space
, the separability metrics are computed:
,
and KNN-
with
. For the KNN-OS calculation,
was used following the original authors’ recommendations [
32]. This value provides a balance between robustness to outliers and sensitivity to local class boundaries, ensuring a stable estimation of local overlap for the
index.
- 3.4.
To ensure comparability, each metric was normalized using min-max scaling over all configurations, considering the optimal direction of each metric. Let denote a parameter configuration and let represent the value of a separability metric obtained under configuration , where is the set of all metric values across the parameter space. The normalized metric is defined using min-max scaling according to the optimization direction:
- ∗
If the metric is to be minimized,
- ∗
If the metric is to be maximized,
In this study, the Davies–Bouldin Index (DBI) and KNN-OS are minimized, whereas the Silhouette Coefficient (SC) is maximized. In this work, metrics to be minimized were inverted during normalization to ensure a consistent optimization direction (higher is better).
- 3.5.
A global separability index
was defined as the geometric mean [
33] of the normalized metrics; see Equation (
33).
The geometric mean was selected to combine DBI, SC, and KNN-OS into the
index because it balances the contribution of the three metrics while penalizing configurations that perform poorly in any individual criterion. Unlike the arithmetic mean, which can mask deficiencies in specific metrics, this approach ensures a more robust and discriminative selection of projection matrices.
- 3.6.
All the configurations were ranked in descending order according to , and the configuration with the highest value is selected as optimal candidate.
- 3.7.
The parameter configuration achieving the highest value was selected for further analysis. Since DE- is a stochastic optimization method, the projection process was repeated 10 independent times using in order to asses variability due to random initialization and evolutionary dynamics. Among these executions, the projection yielding the best separability performance was selected ans used for comparison with the analytical dimensionality reduction models.
After obtaining the projections from PCA, LDA, PCA+LDA, and DE-, a numerical and graphical comparison was performed. The evaluation was based on separability metrics, employing the global separability index , and on visualizations of the projected feature spaces to assess differences in class discrimination. In these representations, neutral X and Y labels were maintained for the axes to ensure a consistent Cartesian coordinate system across all methods. This choice avoids terminological inaccuracies, as the dimensions represent “Principal Components” in PCA but “Discriminant Dimensions” in the LDA, PCA+LDA, and DE- methods. Additionally, small markers were intentionally used to preserve data density, enhance the visualization of cluster boundaries, and maintain the visibility of sensory attribute labels, ensuring that the distribution of individual panelist evaluations remains clear without overplotting.
4. Results
This section presents the experimental results obtained from applying the dimensionality-reduction methods (PCA, LDA, PCA+LDA, and DE-) to both datasets (Xalapa and Tulancingo) under the two analysis strategies considered: global and attribute-based.
4.1. Projection Performance and Separability Analysis of the Xalapa Dataset
This section presents the experimental results obtained from the Xalapa sensory evaluation dataset. The analysis is structured according to the two evaluation strategies previously defined: global analysis and attribute-based analysis. In both cases, the dimensionality-reduction methods (PCA, LDA, PCA+LDA, and DE-) are compared using the considered class-separability metrics to assess their discriminative capability in this dataset.
4.1.1. Xalapa Global Analysis
In the global analysis of the Xalapa dataset, all sensory variables were considered simultaneously, resulting in a data matrix. This configuration evaluates the overall discriminative capacity of each dimensionality-reduction method using the complete sensory profile. The separability metrics provide a comprehensive assessment of how well the projected spaces preserve and enhance class discrimination across the different tortilla types.
Table 3 reports the minimum, maximum, mean, and standard deviation of the separability metrics obtained from the 10 independent executions of the best parameter configuration
. The relatively low standard deviation values observed for DBI (0.1069 ), SC (0.0114), and KNN-OS (0.0138) indicate stable behavior of the evolutionary optimization process under the selected configuration. Although DE-
is a stochastic method, the variability across executions remains limited, suggesting robustness of the obtained projection subspace.
Table 4 presents the comparative results between PCA, LDA, PCA+LDA, and the best DE-
projection. In terms of DBI (to be minimized), DE-
achieved the lowest values, indicating more compact and better-separated class clusters. Regarding the Silhouette Coefficient, DE-
obtained the highest value, reflecting improved intra-class cohesion and inter-class separation at the sample level. Similarly, for KNN-OS, DE-
produced the lowest overlap score, demonstrating reduced local class mixing in the projected feature space.
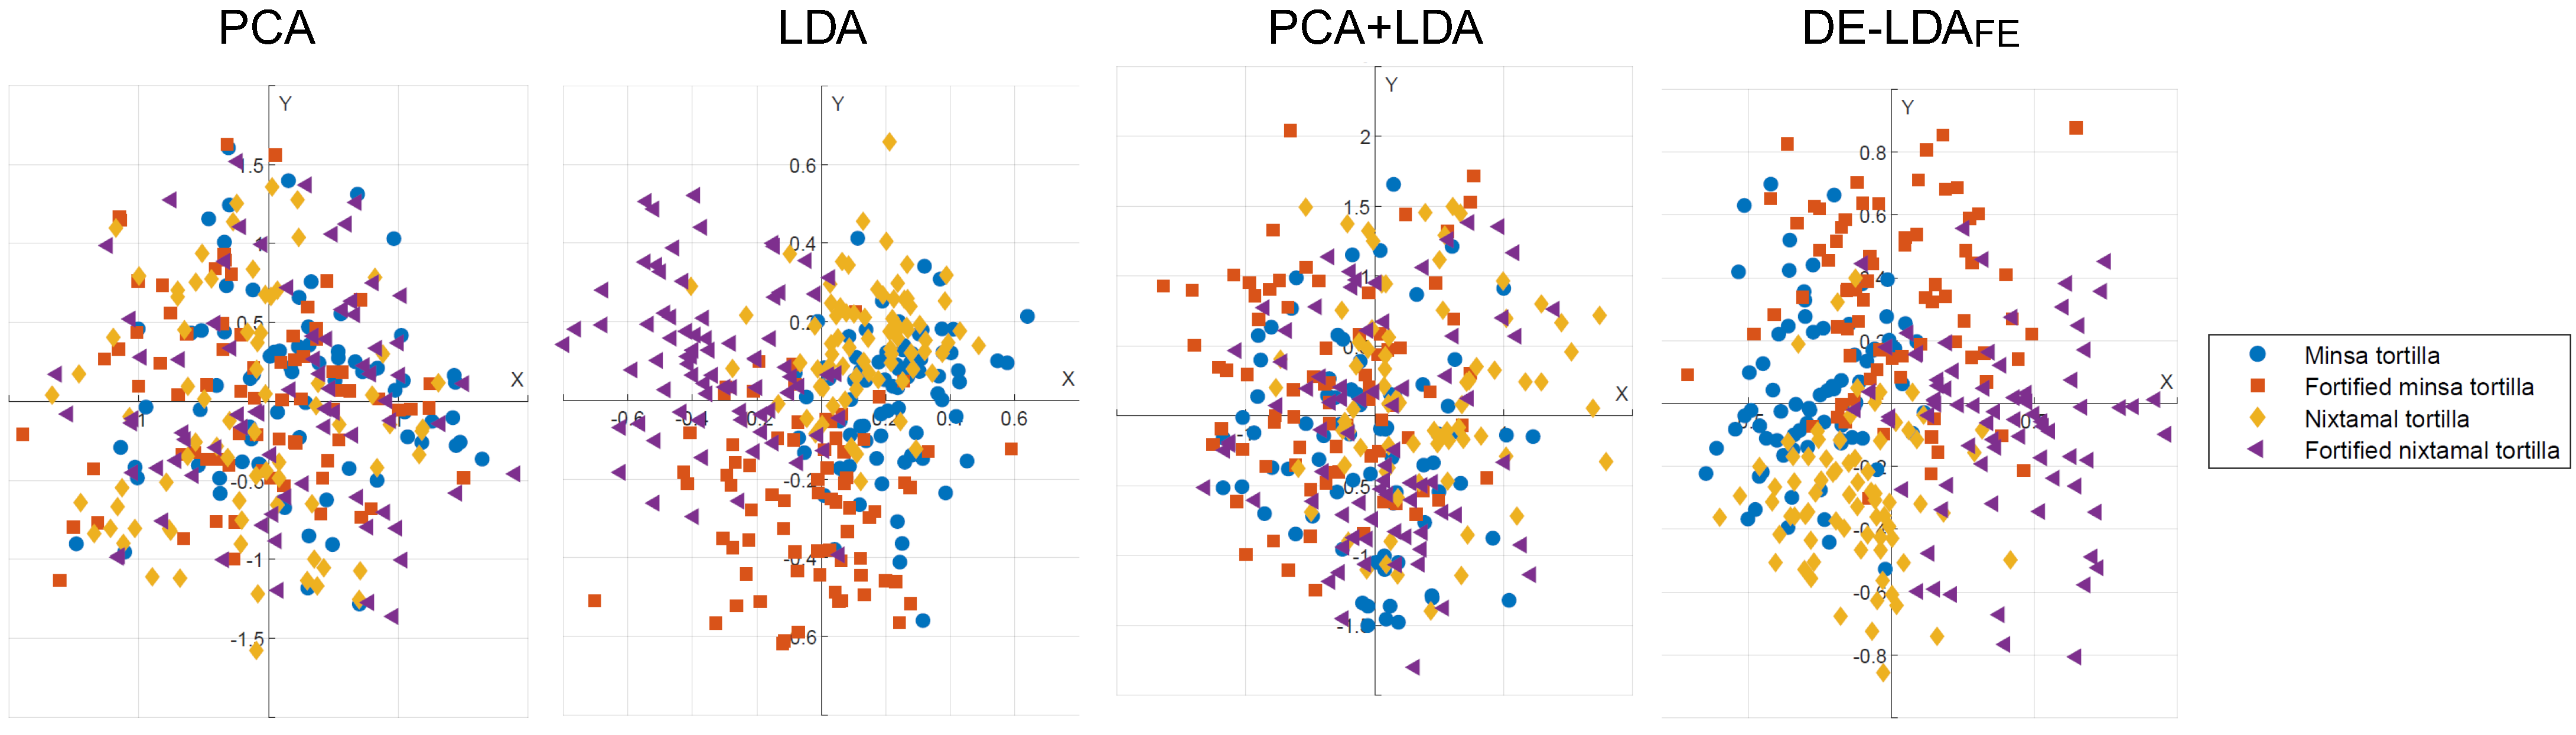
Figure 2 shows the graphical representations of the projected feature spaces obtained for the Xalapa global sensory dataset. Visual comparison enables qualitative evaluation of class compactness, inter-class separation, and local overlap generated by each dimensionality-reduction method. In this case, the projections obtained with LDA and DE-
exhibit a similar structural arrangement of class clusters, differing mainly by an apparent rotation of the discriminant axes. This similarity suggests that the intrinsic between-class structure is well captured by the Fisher criterion, while the evolutionary optimization refines the orientation of the projection space.
4.1.2. Xalapa Attribute-Based Analysis
In the attribute-based analysis, the Xalapa dataset was decomposed into independent subsets corresponding to each sensory attribute (color, smell, texture, taste, mouthfeel, and aftertaste). This approach allows the evaluation of the discriminative power of each sensory dimension separately. By analyzing the separability metrics for each attribute-specific projection, it is possible to identify which sensory attributes contribute most significantly to class differentiation.
Table 5 summarizes the separability results obtained for each sensory attribute of the Xalapa dataset. In addition to the individual metrics (DBI, SC, and KNN-OS), the global index
is reported. This index corresponds to the geometric mean of the three normalized metrics (see Equation (
33)) and provides a balanced evaluation of global, semi-global, and local discrimination properties within each projected space.
The results in
Table 5 show that the relative performance of the dimensionality-reduction methods varies across sensory attributes, indicating that class separability is strongly attribute-dependent.
For the Color attribute, DE- achieves the highest global index (), slightly outperforming LDA. Although both methods produce similar DBI and KNN-OS values, the evolutionary approach yields a more balanced improvement across metrics, suggesting refined adjustment of the projection matrix when moderate local overlap is present. This suggests that evolutionary optimization provides a marginal but consistent improvement in overall separability when color variables are considered independently.
In the Smell attribute, although LDA attains the lowest DBI, DE- yields the highest global index (), reflecting a more balanced trade-off among dispersion, cohesion, and local overlap. This suggests that evolutionary optimization can redistribute discriminative emphasis beyond purely centroid-based separation.
For Texture, LDA obtains the best global score (), indicating that, for this attribute, the analytical discriminant structure is already adequate and evolutionary optimization does not provide additional benefit. The comparable performance of DE- indicates convergence toward a similar structural solution.
In the Taste attribute, DE- produces the highest global index (), mainly driven by improvements in local overlap (KNN-OS), even though PCA+LDA achieves the lowest DBI. The comparable performance of DE- indicates convergence toward a similar structural solution.
For Mouthfeel and Aftertaste, LDA achieves the highest global scores, suggesting that these attributes exhibit a discriminant structure well captured by the classical Fisher-based projection, leaving limited margin for evolutionary refinement.
Overall, the attribute-based analysis demonstrates that while DE- dominates in the global analysis, its relative advantage at the attribute level depends on the intrinsic separability structure of each sensory dimension. The method tends to provide greater benefit when class distributions deviate from ideal linear discriminant assumptions or when local mixing effects are significant. Conversely, when the Fisher criterion sufficiently captures the between-class structure, both analytical and evolutionary approaches yield comparable separability.
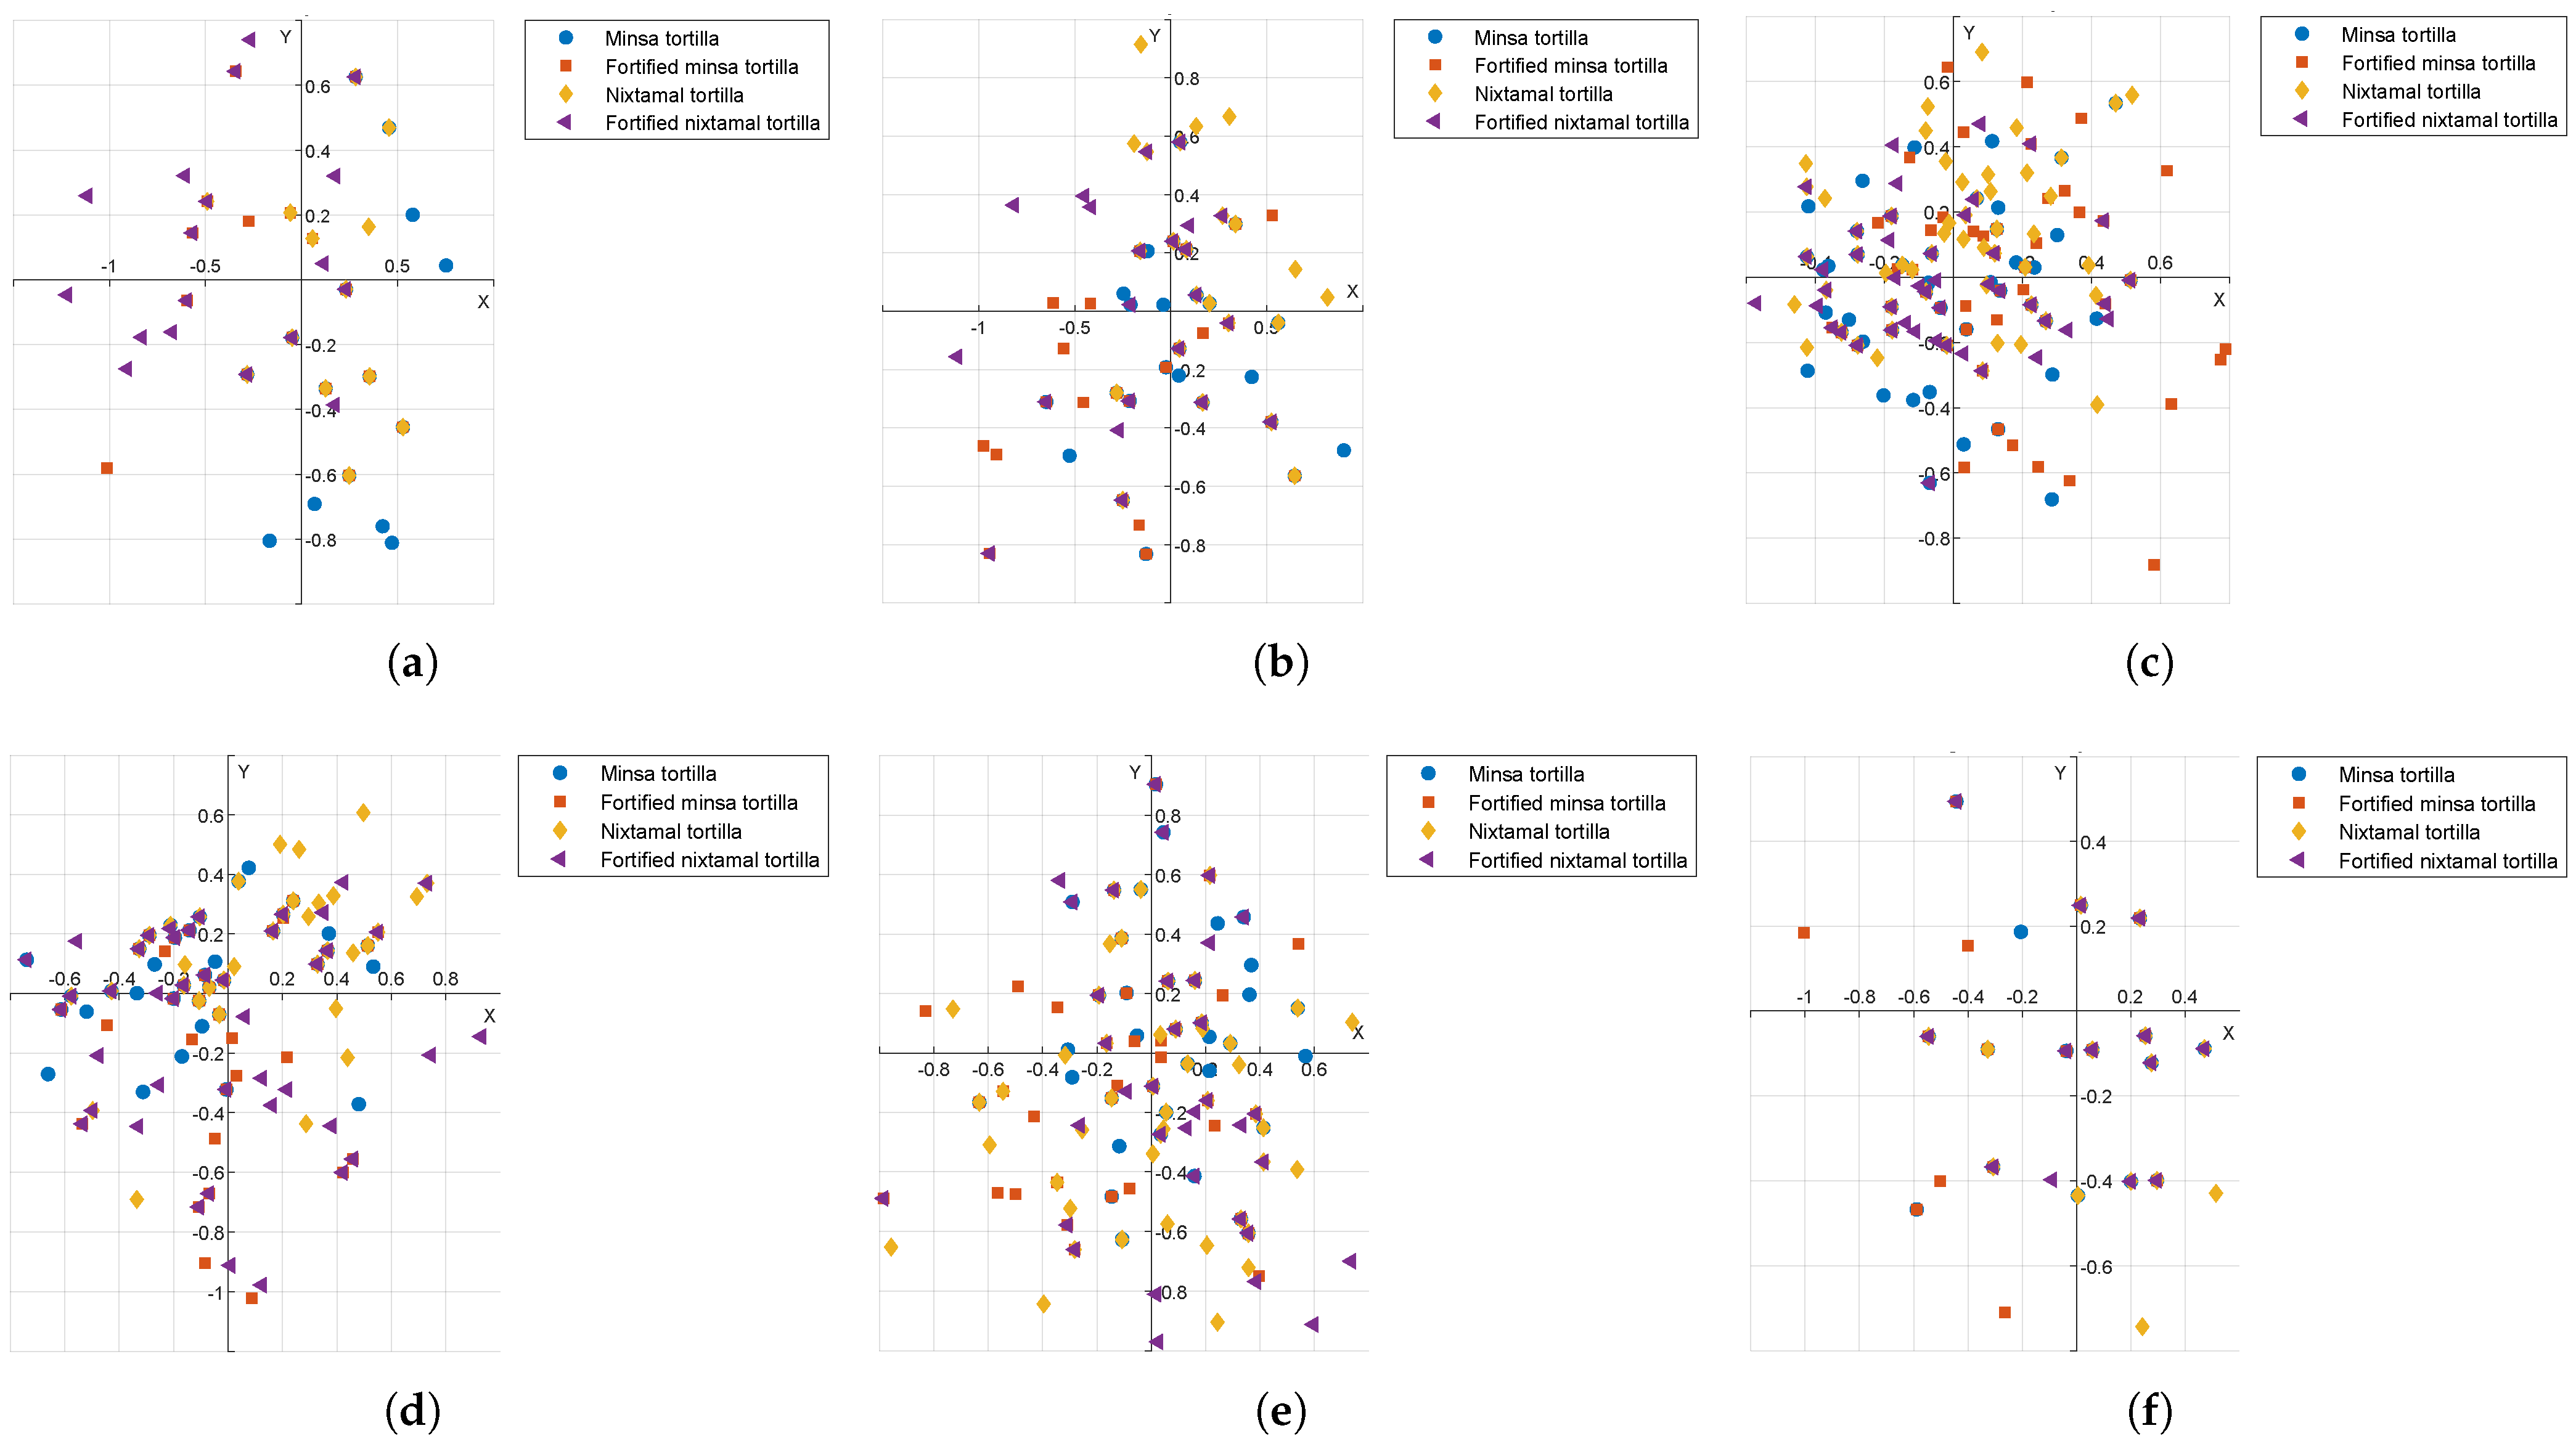
For visualization purposes, only the projection corresponding to the maximum
value for each attribute is displayed in
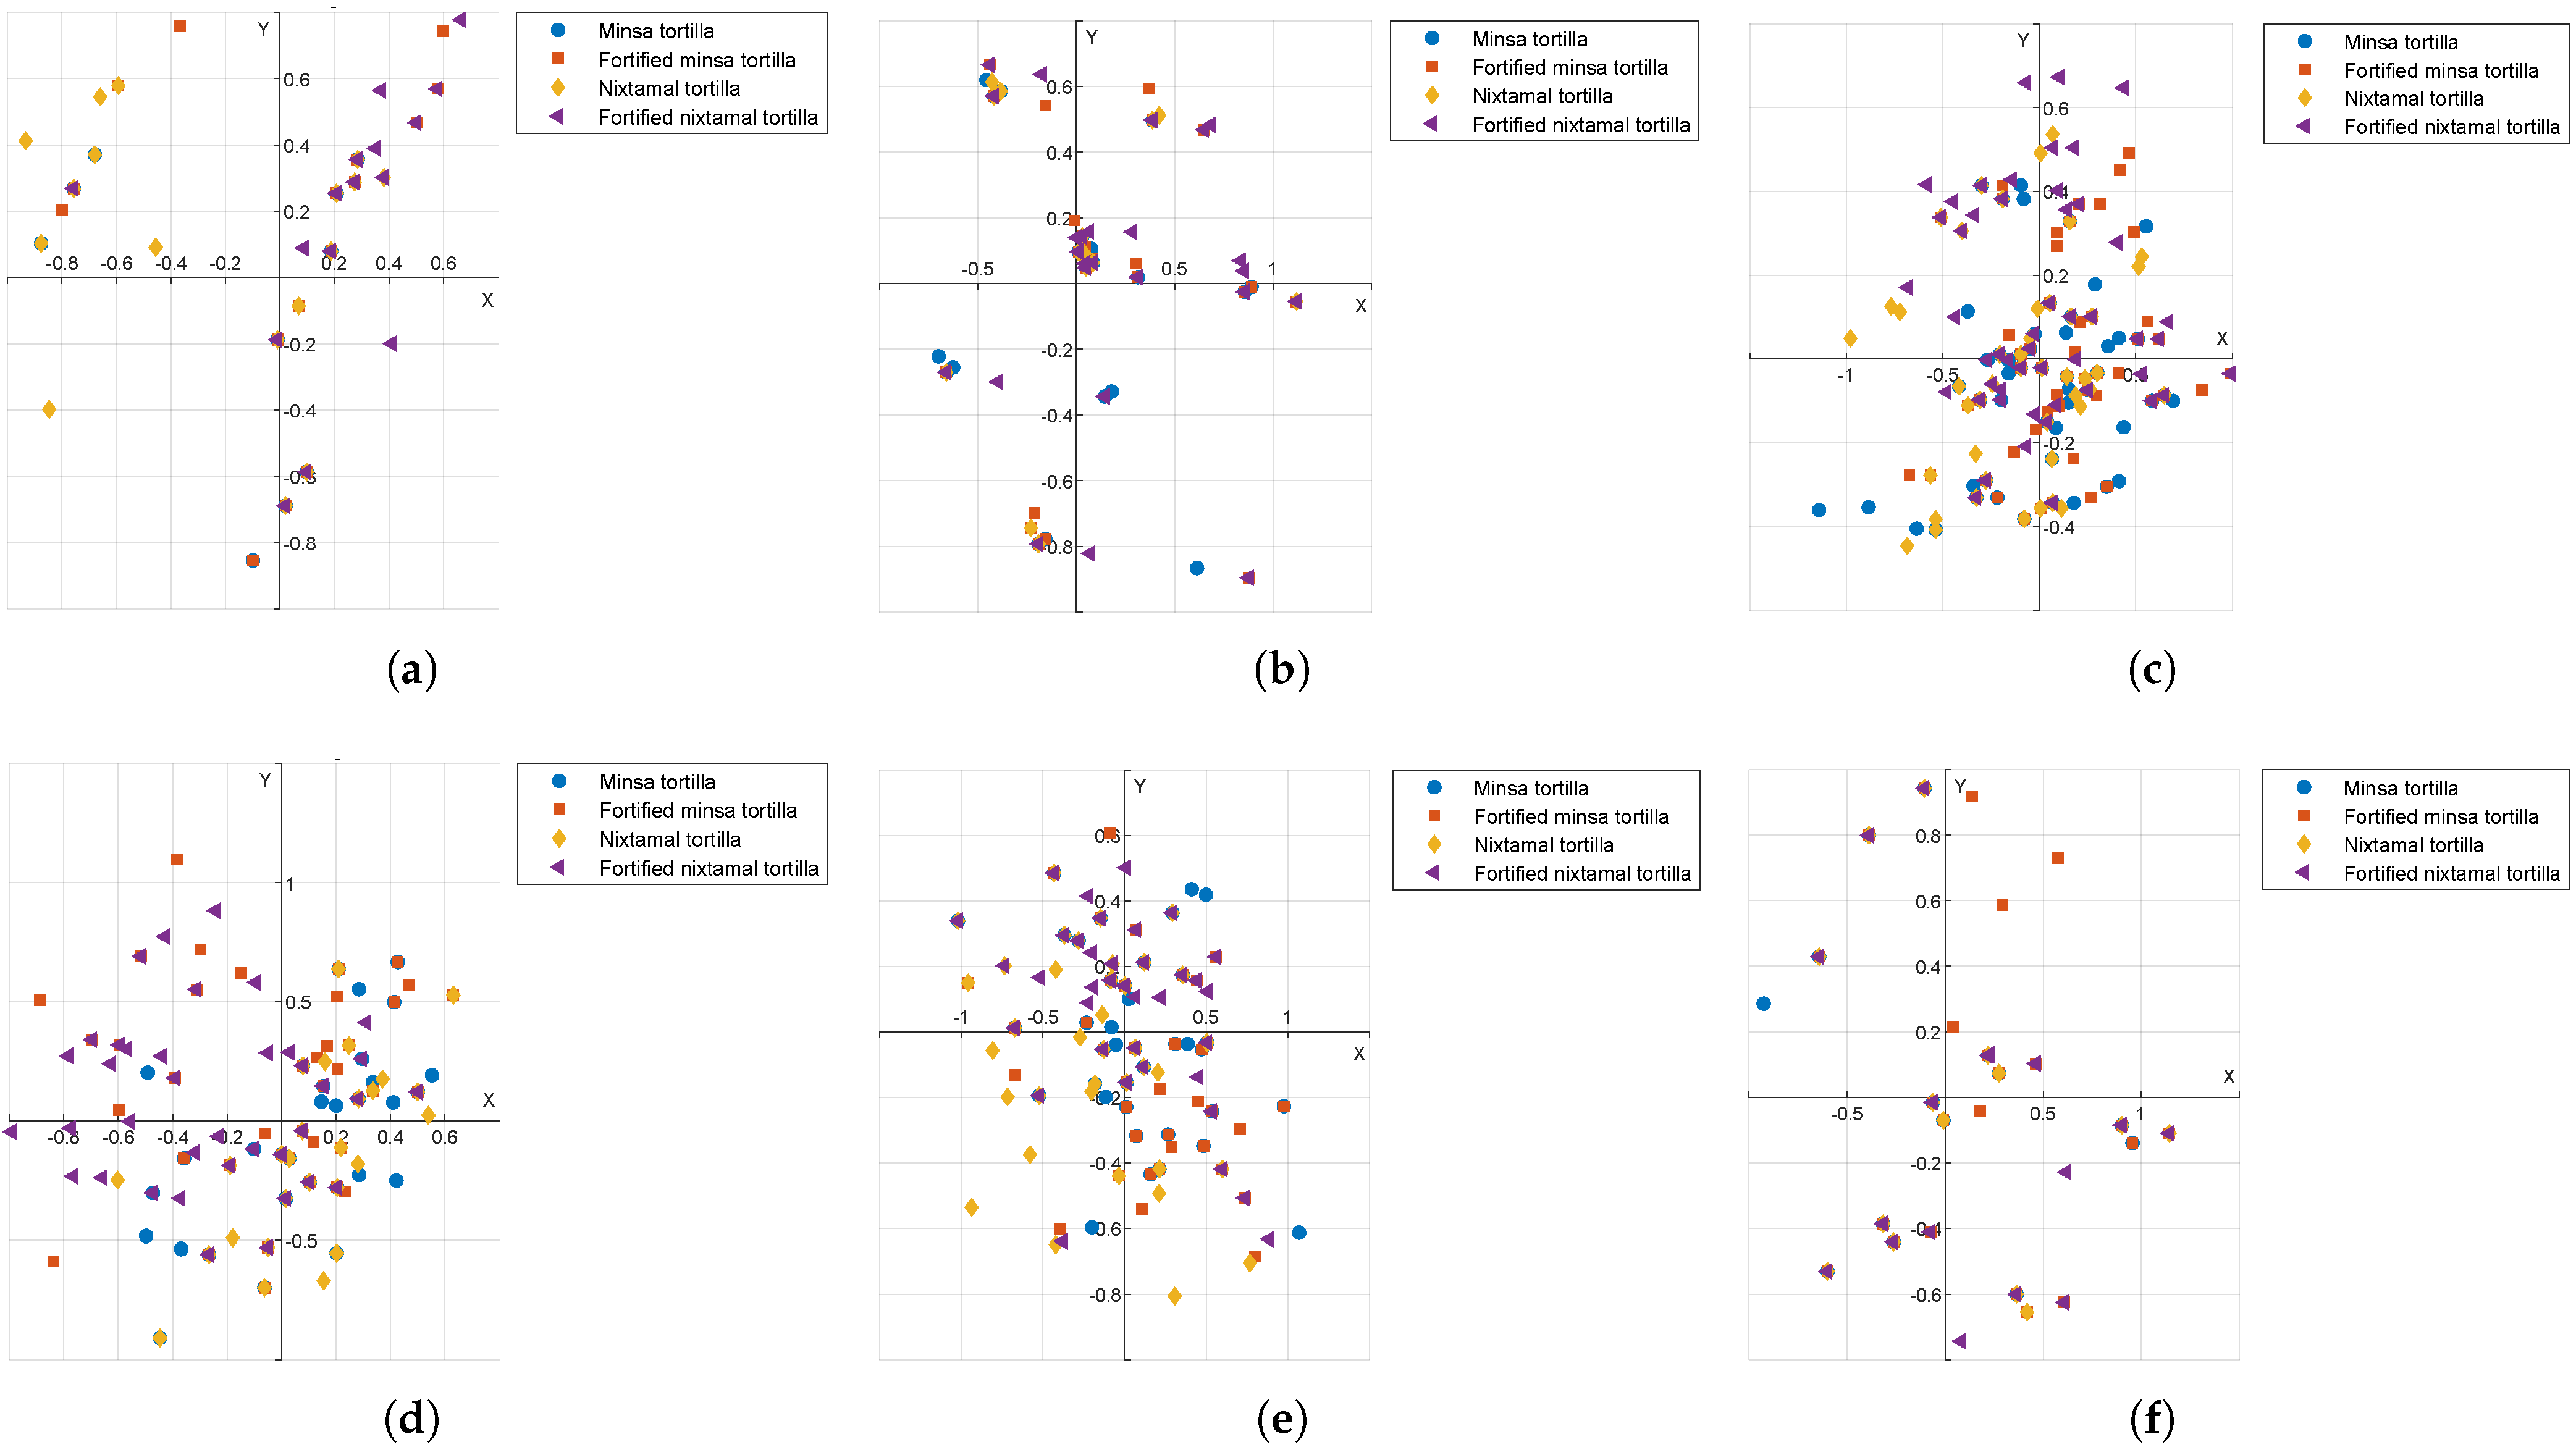
Figure 3, ensuring that graphical comparisons reflect the most structurally discriminative configuration identified for each sensory dimension.
In contrast to the global projections obtained from all sensory variables, the attribute-based projections for the Xalapa dataset exhibit a more irregular, overlapping structure. This behavior is expected, since each attribute subset contains fewer variables and therefore captures only partial information about the tortillas’ sensory profile. Consequently, the discriminative structure becomes less defined in the two-dimensional space, leading to visually intertwined class regions. Nevertheless, despite this increased visual complexity, the displayed projections correspond to the configurations that maximize the global separability index , meaning they represent the most discriminative transformations achievable under the structural constraints of each individual sensory attribute.
4.2. Projection Performance and Separability Analysis of the Tulancingo Dataset
This section presents results from the Tulancingo sensory evaluation dataset, following the same experimental structure as for the Xalapa dataset. The objective is to assess the consistency and generalization of the dimensionality-reduction methods across different sensory evaluation conditions. Both global and attribute-based analyses are considered.
4.2.1. Tulancingo Global Analysis
For the global analysis of the Tulancingo dataset, all sensory variables were jointly analyzed, forming a data matrix. This evaluation examines the overall separability achieved by each projection method when the complete sensory information is retained. Computed metrics quantify the compactness and discrimination of the resulting projected spaces.
Table 6 summarizes the separability performance obtained from the 10 independent executions of DE-
using the optimal parameter configuration
for the Tulancingo global dataset. The table reports the minimum, maximum, mean, and standard deviation of DBI, SC, and KNN-OS, allowing assessment of both projection quality and algorithmic stability. The relatively low standard deviation values across all metrics indicate that the evolutionary optimization process produces consistent projection matrices despite its stochastic nature, while the mean values confirm strong global compactness, positive sample-level cohesion, and reduced local class overlap in the projected space.
Table 7 presents the comparative separability results obtained in the global analysis of the Tulancingo dataset using PCA, LDA, PCA+LDA, and DE-
.
Classical LDA did not yield a valid solution in this case, likely due to the within-class scatter matrix being singular. Among the feasible methods, DE- clearly achieves the best overall performance. It obtains the lowest DBI value (1.5829), indicating the best global compactness and inter-class separation. Additionally, it is the only method to produce a positive Silhouette Coefficient (0.2072), indicating improved sample-level cohesion and clearer class boundaries. In terms of local structure, DE- also achieves the lowest KNN-OS value (0.3847), demonstrating reduced neighborhood-level class overlap.
These improvements are reflected in the global separability index , where DE- has the maximum normalized value (1), outperforming PCA and PCA+LDA. Overall, the results show that evolutionary optimization provides a more discriminative projection than the analytical dimensionality-reduction approaches in the Tulancingo global sensory space.
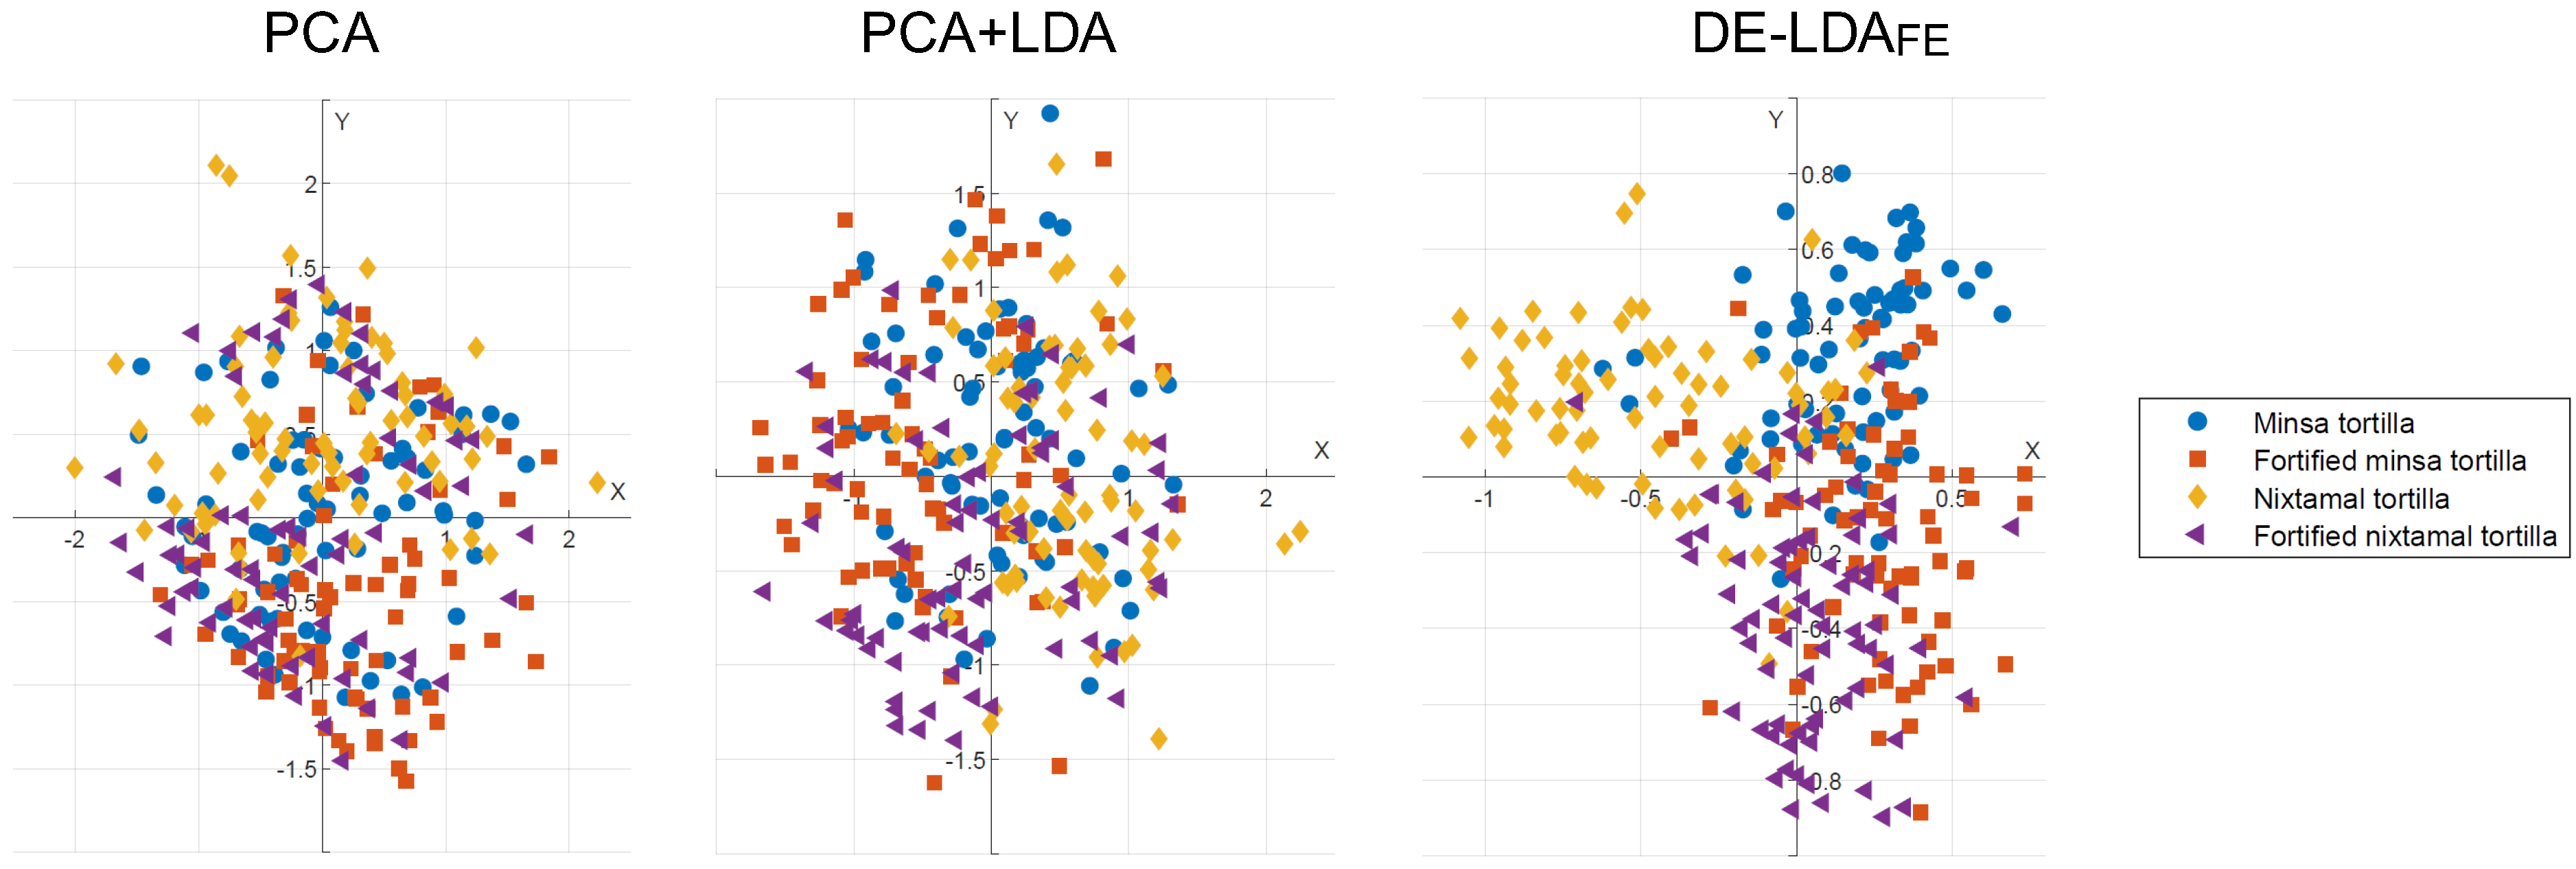
Figure 4 presents the graphical representations of the projected feature spaces obtained for the Tulancingo global sensory dataset. The visual comparison highlights the differences in class compactness, inter-class separation, and local overlap produced by each dimensionality-reduction method. Consistent with the quantitative separability metrics, the DE-
projection exhibits more clearly defined class regions and reduced overlap, supporting its superior discriminative performance in the global analysis.
4.2.2. Tulancingo Attribute-Based Analysis
In the attribute-based analysis, each sensory attribute of the Tulancingo dataset was examined independently. This allows the identification of attribute-specific discriminative patterns and enables a detailed comparison of the projection methods within each sensory dimension. The separability metrics provide insight into the relative contribution of each attribute to class differentiation.
Table 8 presents the separability results for each sensory attribute of the Tulancingo dataset. As in the previous analysis, the global index
corresponds to the geometric mean of the normalized DBI, SC, and KNN-OS values, integrating global cluster structure, semi-global cohesion, and local neighborhood consistency into a single separability indicator.
The results in
Table 8 again demonstrate that discriminative behavior is attribute-dependent, although the structural patterns differ from those observed in the Xalapa dataset.
For the Color attribute, LDA achieves the highest global index (), with DE- yielding a very close value (). Both methods produce similar DBI and KNN-OS values, indicating that the between-class scatter structure is well captured by the analytical Fisher solution. The marginal difference suggests structural alignment between the intrinsic data geometry and the linear discriminant assumption.
In the Smell attribute, LDA does not provide a valid solution, highlighting potential singularity or instability in the within-class scatter matrix. In this case, DE- becomes particularly relevant, producing the lowest DBI and KNN-OS values among the feasible methods. Although PCA+LDA attains the highest , the evolutionary approach yields the strongest global compactness and reduced local overlap, emphasizing its robustness when classical LDA is not directly applicable.
For Texture, DE- achieves the highest global index (), improving in DBI and reducing local mixing. This indicates that evolutionary optimization effectively adjusts the projection matrix to better accommodate attribute-specific class distributions.
In the Taste attribute, DE- obtains the highest value. Although SC remains negative for all methods, suggesting moderate global overlap, the evolutionary approach minimizes DBI and KNN-OS, thereby improving both global compactness and local consistency.
For Mouthfeel, DE- achieves the maximum global index (), reflecting simultaneous improvements across global and local separability measures. This suggests that the discriminative structure of this attribute benefits from optimization beyond the closed-form Fisher solution.
Finally, in Aftertaste, PCA+LDA obtains the highest , although DE- provides the lowest DBI and competitive KNN-OS values. The difference indicates that, while evolutionary optimization enhances global compactness, the semi-global cohesion measured by SC slightly favors the analytical approach.
Overall, the Tulancingo attribute-based analysis highlights two important aspects:
- (1)
DE- provides clear advantages in attributes where classical LDA is unstable or where local overlap is pronounced (Smell, Texture, Mouthfeel), and
- (2)
when the Fisher discriminant assumption is structurally adequate (Color), analytical and evolutionary approaches converge toward comparable separability levels.
As in the Xalapa dataset, only the projection corresponding to the maximum
value for each attribute is displayed in
Figure 5, ensuring that the visualization reflects the most discriminative configuration identified for each sensory dimension.
As observed in the Xalapa attribute-based projections, the Tulancingo projections derived from individual sensory attributes present a more compact, mixed visual distribution than the global analysis. The reduction in the amount of dimensional information per attribute limits the extent to which inter-class differences can be linearly emphasized in a two-dimensional space. Although the graphical separation appears less pronounced, the selected projections correspond to the highest values for each attribute. Therefore, they still represent the optimal discriminative configurations available for the given sensory dimension, preserving the maximum achievable balance between global compactness and local separability.
4.3. Comparative Analysis Between Xalapa and Tulancingo Datasets
A cross-dataset comparison shows that separability is not only attribute-dependent but also context-dependent, varying across the Xalapa and Tulancingo sensory information. Although both datasets share an identical dimensional structure, their intrinsic class geometries differ, leading to variations in the relative performance of the projection methods.
In the global analysis, DE- consistently achieved superior separability performance in both datasets, indicating that when the complete sensory profile is considered, evolutionary optimization better balances global compactness (DBI), semi-global cohesion (SC), and local overlap (KNN-OS). This suggests that the joint sensory space contains structural complexities that are not fully captured by closed-form analytical projections.
In the attribute-based analysis, the behavior becomes more heterogeneous. For Xalapa, DE- demonstrated clear advantages in Color and Taste, while LDA remained competitive in Texture, Mouthfeel, and Aftertaste. In contrast, for Tulancingo, DE- has improvements in Texture, Taste, and Mouthfeel, and showed particular robustness in Smell, where classical LDA failed to produce a solution.
These differences indicate that the discriminant structure of the sensory attributes is influenced by regional variability or product-specific characteristics. In particular, DE- proved especially advantageous in scenarios where
The within-class scatter matrix is ill-conditioned (e.g., Smell in Tulancingo);
Local class mixing is pronounced;
The Fisher criterion does not fully capture the discriminant manifold.
Conversely, when the intrinsic data geometry aligns well with the assumptions of linear discriminant analysis, analytical and evolutionary approaches converge toward comparable separability levels.
5. Identification of Sensory Profiles Through Discriminative Projection Analysis
Once the most discriminative projection spaces are determined for each dataset and analysis strategy, the next step is to identify the sensory profiles associated with each tortilla type. To achieve this, the projection matrices obtained from the best-performing models were analyzed. Each projection matrix contains the coefficients that weight the contributions of each sensory variable to the reduced two-dimensional space. These coefficients quantify the relative importance of each attribute in defining the projection’s discriminative structure.
By considering the rows of the projection matrix and selecting the first two columns (corresponding to the two-dimensional subspace), each sensory variable can be represented as a point in . Graphically, this representation provides a directional interpretation: variables with similar orientations contribute similarly to class discrimination, while opposing directions indicate contrasting sensory influences. This geometric interpretation enables the identification of dominant sensory attributes associated with specific tortilla groups.
It is important to note that this analysis is not feasible in global projections. When all 62 variables are considered simultaneously, the resulting projection coefficients tend to be very small due to the higher dimensionality and the distributed variance across many attributes. Consequently, individual variable contributions become diluted, preventing a clear directional interpretation. For this reason, sensory profile identification is conducted exclusively using attribute-based projections, where the reduced-dimensional structure allows a more meaningful interpretation of variable influence.
It should be noted that, although PCA+LDA is included for performance benchmarking, it is not considered in the sensory profile interpretation. This is because PCA+LDA involves a two-stage transformation in which the final discriminant dimensions are expressed as linear combinations of principal components, which are themselves linear combinations of the original variables. This nested structure limits the direct interpretability of the results in terms of the original sensory descriptors. In contrast, PCA, LDA, and DE- each produce a single projection matrix, where the coefficients explicitly represent the contribution of the original sensory attributes. This enables a more direct, transparent, and geometrically interpretable link between the mathematical representation and the sensory characterization.
5.1. Graphical Representation and Interpretation
To generate the graphical representations used for sensory-feature analysis, the best-discriminative projection for each attribute was employed. Given that class distributions remain partially overlapped even in the optimal projection space, the centroid (mean vector) of each class was first computed in the two-dimensional projected space. These centroids provide a stable representative location for each tortilla type, reducing the influence of intra-class dispersion.
Subsequently, the first two columns of the corresponding projection matrix were analyzed. Each row represents the projection weights associated with the i-th sensory variable, so d is the number of sensory variables. These rows were plotted as points in , where each coordinate pair reflects the contribution of a specific attribute feature (e.g., brown within the color dimension) to the discriminative subspace.
The resulting visualization contains two types of elements:
Sensory features were then associated with specific tortilla types by evaluating the Euclidean distance between each feature point and the class centroids. Features located closer to a given centroid were interpreted as contributing more strongly to the sensory profile of that tortilla class.
In the following sections, the graphical representations of each sensory attribute are presented to characterize and interpret the sensory profiles associated with the different tortilla classes.
5.1.1. Visualization and Sensory Profile Characterization of the Xalapa Dataset
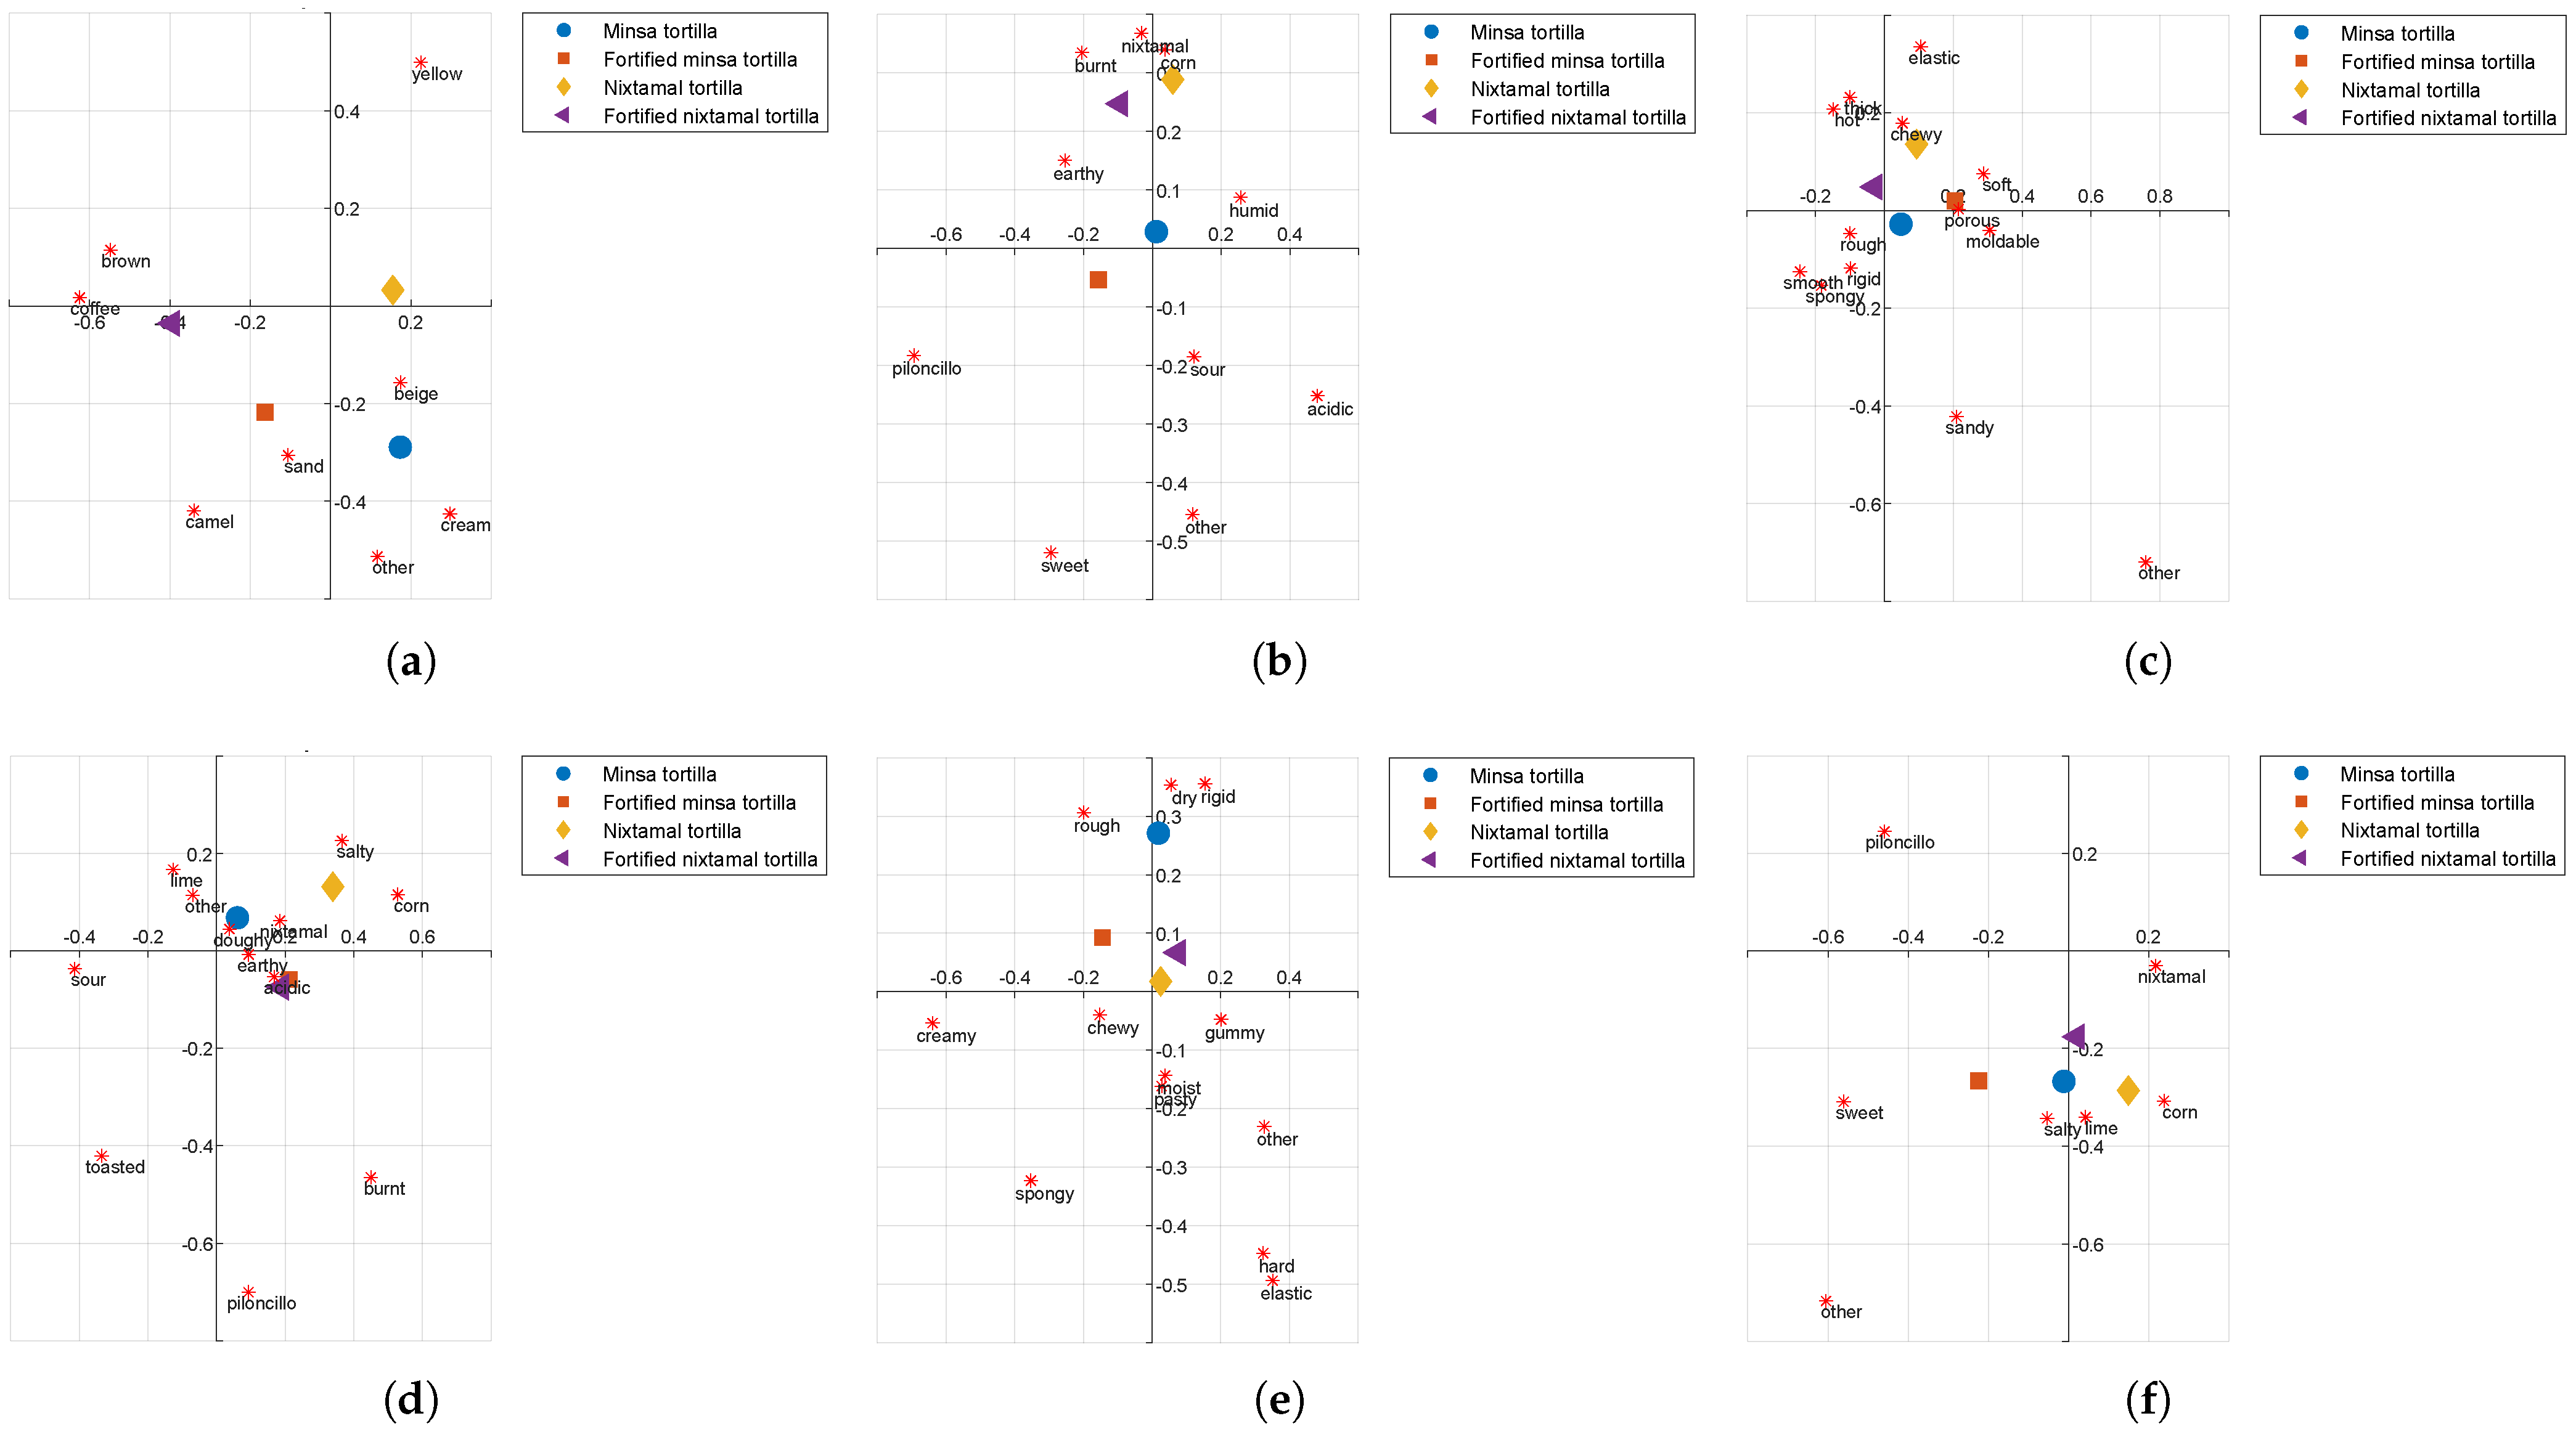
In the following sections, the graphical representations and corresponding interpretations obtained for each sensory attribute in the Xalapa dataset are presented. The corresponding graphical representations are displayed in
Figure 6.
Color
Analysis of the color attribute in the Xalapa dataset shows distinct chromatic patterns associated with each tortilla type. Based on the Euclidean proximity between feature-weight vectors and class centroids in the discriminative projection space, specific color descriptors were linked to each class; see
Figure 6a and
Table 9. These associations reflect the dominant visual characteristics contributing to the sensory identity of each tortilla type.
Lighter tonalities, such as cream and beige, are predominantly associated with the commercial Minsa tortilla, while yellow is characteristic of the traditional nixtamal tortilla. Fortified variants exhibit darker or more saturated hues: sand and camel are primarily associated with the fortified Minsa tortilla, whereas brown and coffee are more closely related to the fortified nixtamal tortilla. The descriptor ’other’ also appears to be associated with the Minsa tortilla, suggesting broader variability in its perceived color profile.
Smell
The olfactory profile obtained from the discriminative projection shows distinct aroma patterns across tortilla types in the Xalapa dataset. By analyzing the Euclidean proximity between sensory feature-weight vectors and class centroids, characteristic odor descriptors were identified for each tortilla class; see
Figure 6b and
Table 10.
The traditional nixtamal tortilla is characterized primarily by nixtamal and corn flavor, reflecting its maize-based processing. In contrast, the commercial Minsa tortilla is associated with acidic, sour, and humid descriptors, suggesting a differentiated fermentation or moisture-related perception. The fortified nixtamal tortilla offers deeper, more intense aromatic nuances, notably burnt and earthy notes. Meanwhile, the fortified Minsa tortilla is distinguished by sweeter tonalities, such as piloncillo and ‘other’, indicating additional aroma variability introduced by fortification.
These associations highlight how fortification and processing type influence the aromatic sensory structure of the tortillas.
Texture
The texture profile in the Xalapa dataset shows clear differences among tortilla types (see
Figure 6c and
Table 11), reflecting variations in structural and mechanical perception.
The fortified Minsa tortilla is characterized by porous, soft, moldable, and other descriptors, suggesting a more compliant, aerated texture. In contrast, the fortified nixtamal tortilla is associated with smooth, hot, rough, thick, and spongy attributes, suggesting a more heterogeneous, structurally complex mouthfeel.
The traditional nixtamal tortilla is primarily associated with chewy and elastic properties, consistent with a cohesive dough structure. Meanwhile, the commercial Minsa tortilla is characterized by sandy and rigid descriptors, reflecting a firmer and comparatively less elastic texture.
Taste
The taste attribute in the Xalapa dataset shows distinctive flavor patterns across tortilla types; see
Figure 6d and
Table 12.
The traditional nixtamal tortilla is characterized by salty, corn notes, consistent with its maize-based preparation. The commercial Minsa tortilla presents a more heterogeneous flavor profile, with sour, lime, earthy, doughy, and other descriptors, suggesting perceptible acidity and less pronounced toasting.
The fortified nixtamal tortilla exhibits more intense and complex flavor attributes, including acidic, burnt, toasted, and piloncillo, indicating that fortification contributes to deeper roasted and sweet undertones. In contrast, the fortified Minsa tortilla is mainly associated with the descriptor nixtamal, suggesting a shift toward more traditional flavor perception after fortification.
Overall, the taste results highlight how fortification modifies flavor balance and introduces additional sensory nuances across tortilla types.
Mouthfeel
The mouthfeel attribute reveals differentiated tactile sensations perceived during mastication across the tortilla types in the Xalapa dataset; see
Figure 6e and
Table 13.
The traditional nixtamal tortilla is mainly associated with elastic, hard, moist, and pasty descriptors, suggesting a cohesive internal structure, perceptible firmness, and humidity. In contrast, the commercial Minsa tortilla is characterized by a rigid, rough, and dry texture, reflecting a firmer, less hydrated perception during consumption.
The fortified Minsa tortilla exhibits a softer, more cohesive mouthfeel, with creamy, spongy, and chewy attributes. Meanwhile, the fortified nixtamal tortilla is linked to gummy and other descriptors, indicating modifications in internal consistency and residual oral texture due to fortification.
These results suggest that fortification influences not only structural texture but also the dynamic oral sensations experienced during chewing.
Aftertaste
The aftertaste attribute highlights persistent flavor sensations perceived after consumption, showing distinctive residual profiles across tortilla types; see
Figure 6f and
Table 14.
The traditional nixtamal tortilla is mainly characterized by a corn aftertaste, reinforcing its maize-based identity. The commercial Minsa tortilla shows salty and lime residual notes, suggesting a more pronounced perception of salinity and acidity after mastication.
The fortified Minsa tortilla exhibits sweeter lingering sensations, linked to sweet, piloncillo, and other descriptors, indicating that fortification enhances sweet tonalities in the residual flavor. In contrast, the fortified nixtamal tortilla is associated with a nixtamal aftertaste, suggesting reinforcement of traditional processing notes in the final sensory perception.
These results indicate that fortification not only modifies immediate taste perception but also influences the persistence and balance of residual flavors.
Overall, the attribute-based analysis of the Xalapa dataset reveals well-defined sensory tendencies that differentiate the four tortilla types across visual, aromatic, textural, gustatory, and residual dimensions. Traditional nixtamal tortillas are consistently associated with characteristic maize-related descriptors, reflecting preservation of their conventional sensory identity. In contrast, commercial Minsa tortillas exhibit attributes linked to acidity, rigidity, and lighter tonalities, suggesting a distinct processing profile. Fortification introduces noticeable modifications in several attributes, particularly enhancing sweetness, roasted notes, and structural softness in the fortified variants. Collectively, these patterns confirm that both processing method and fortification significantly shape the tortillas’ multidimensional sensory profile in the Xalapa dataset.
5.1.2. Visualization and Sensory Profile Characterization of the Tulancingo Dataset
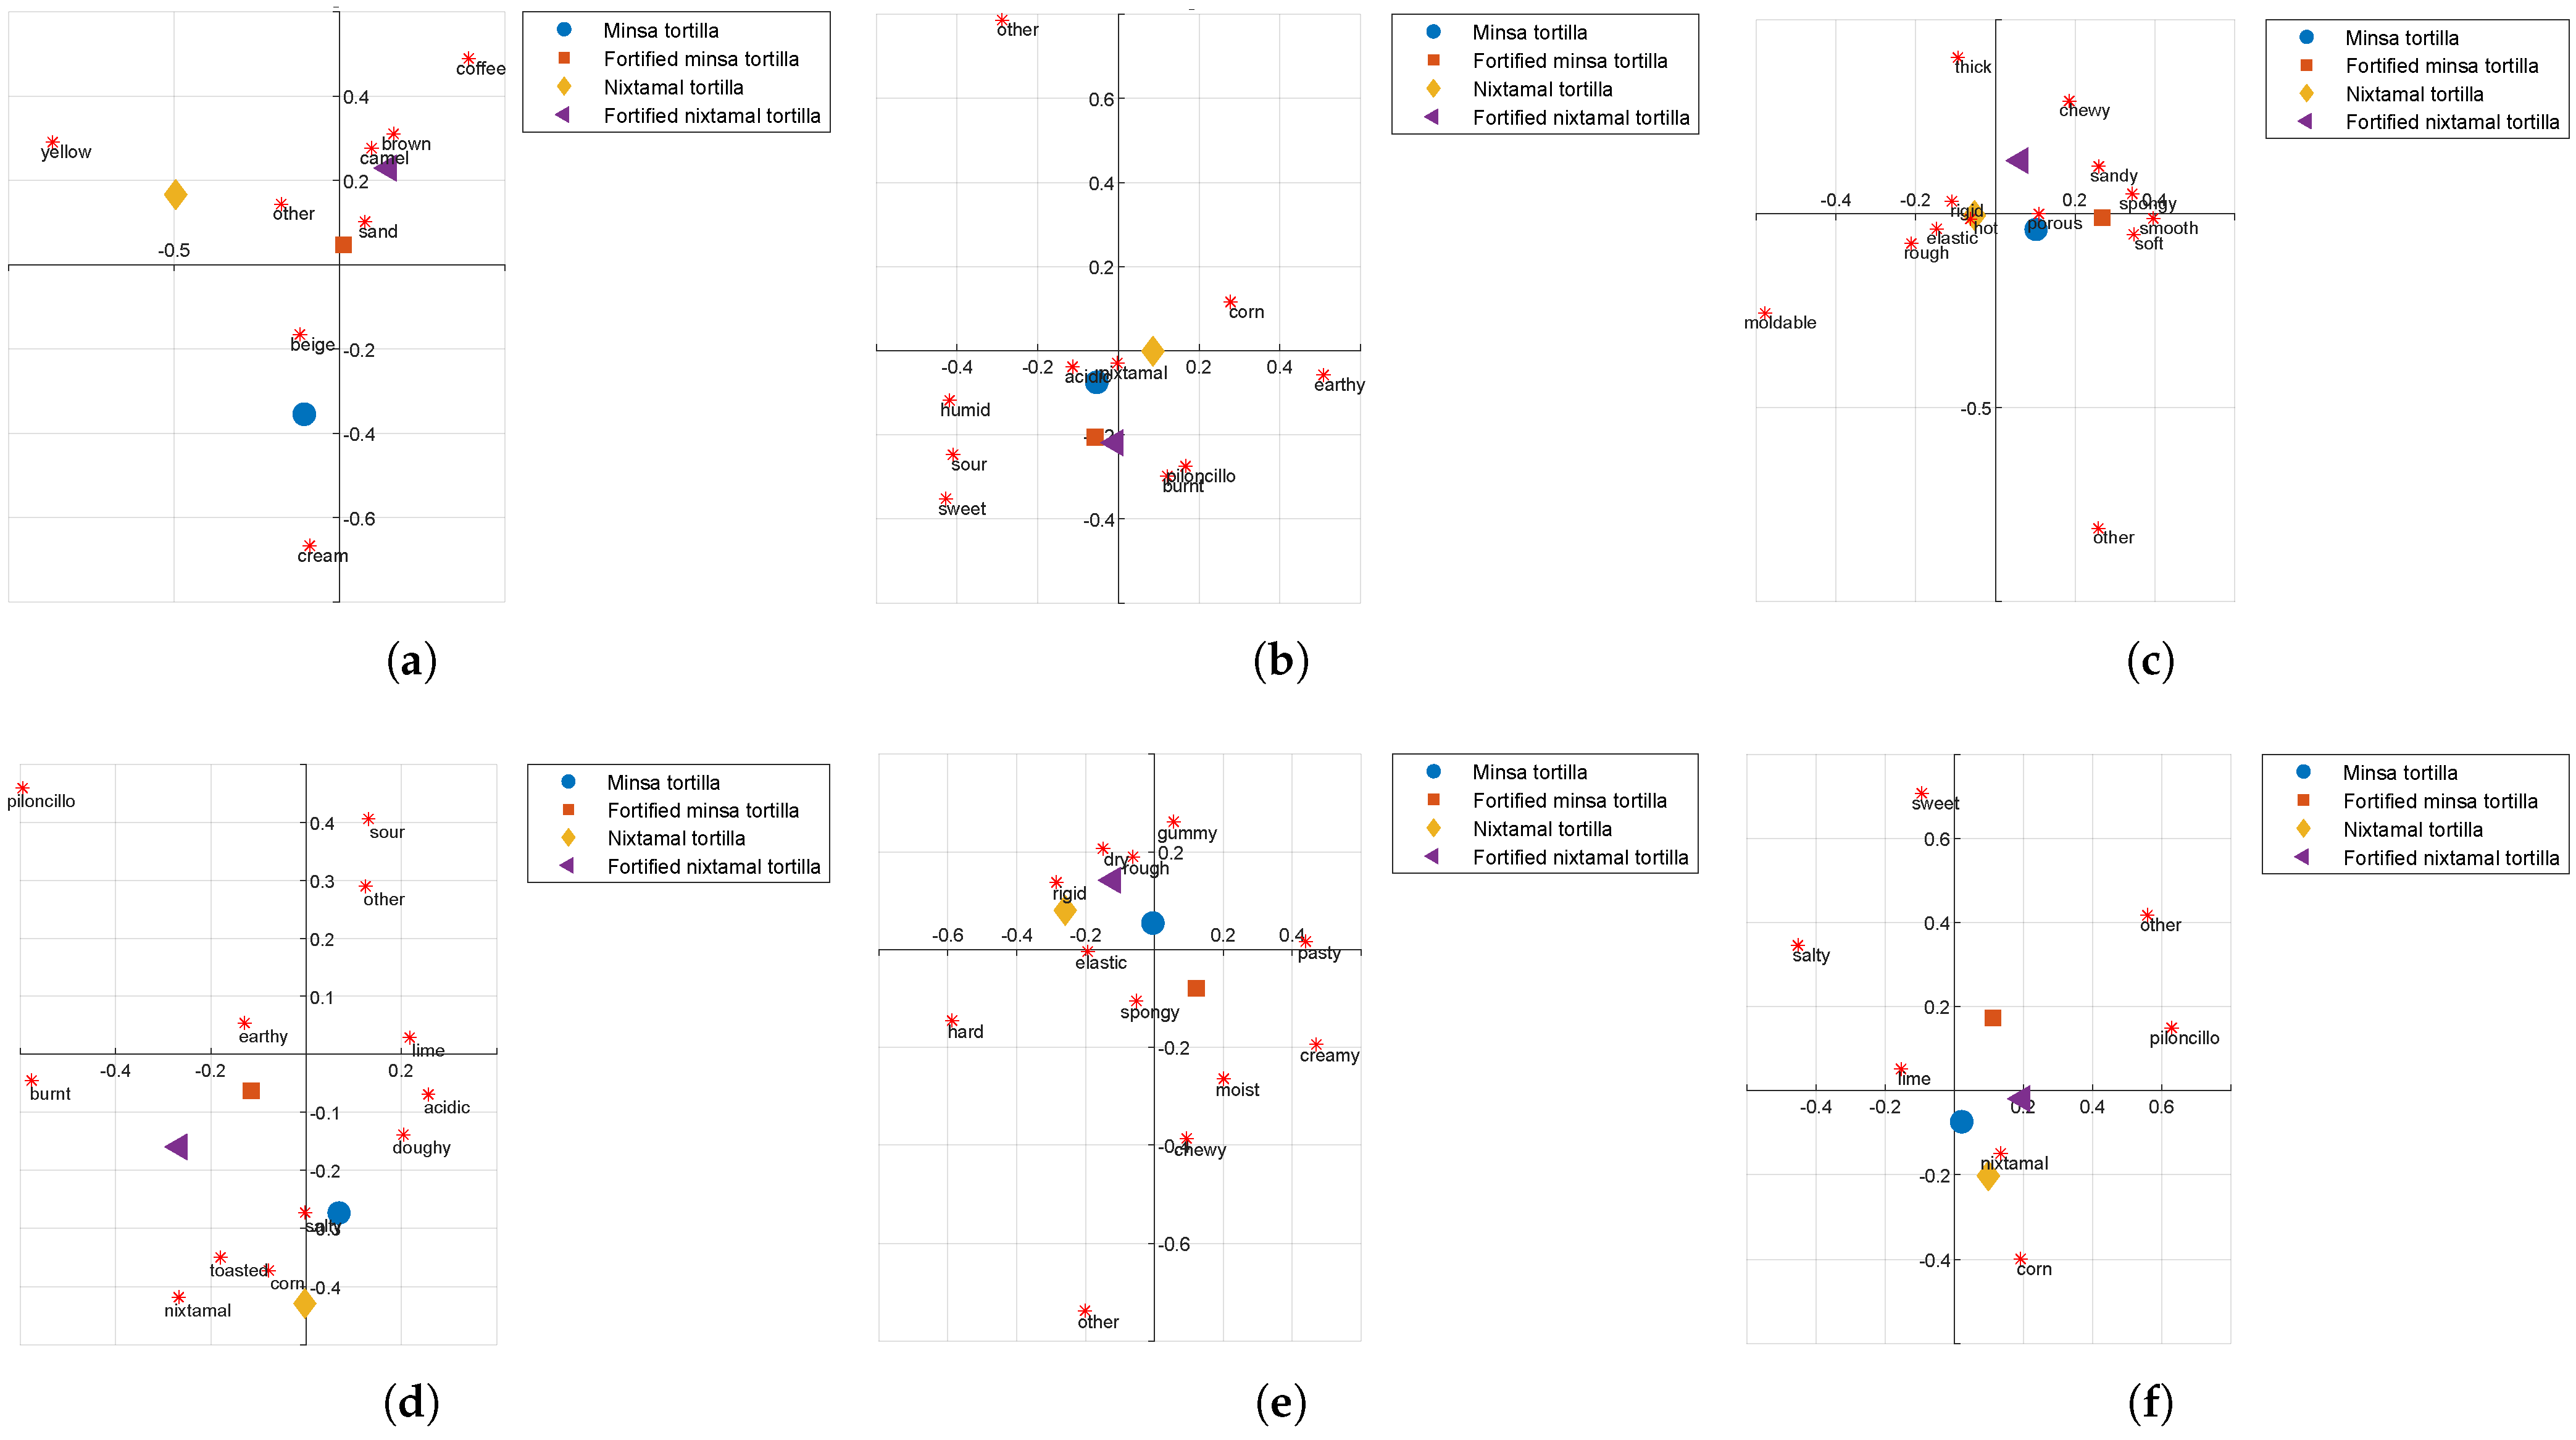
In the following sections, the graphical representations and corresponding interpretations obtained for each sensory attribute in the Tulancingo dataset are presented. The corresponding graphical representations are displayed in
Figure 7. Here, it is important to mention that although PCA+LDA obtained the highest separability index
for smell and aftertaste, it was not used for sensory profile characterization because its projection matrix results from a composition of transformations, limiting direct interpretability in terms of the original sensory variables. Since profile identification requires explicit geometric interpretation of projection weights, the method with the second-highest
value was selected. In both cases, DE-
offered a suitable alternative, maintaining strong discriminative performance while allowing interpretable sensory characterization.
Color
The color attribute in the Tulancingo dataset shows differentiated chromatic patterns across tortilla types (see
Figure 7a and
Table 15), reflecting variations associated with processing method and fortification. The commercial Minsa tortilla is characterized by lighter tonalities, such as cream and beige, suggesting a relatively uniform, pale appearance. The traditional nixtamal tortilla is mainly associated with yellow color, consistent with the natural pigmentation imparted by nixtamalization.
Fortification introduces noticeable chromatic modifications. The fortified Minsa tortilla is linked to sand and other descriptors, indicating subtle tonal shifts compared to its non-fortified counterpart. Meanwhile, the fortified nixtamal tortilla exhibits stronger associations with darker hues, including brown, camel, and coffee, suggesting increased color depth and intensity.
Overall, the results indicate that fortification affects color perception more markedly in the nixtamal-based tortillas, while commercial Minsa tortillas maintain lighter visual characteristics.
Smell
The olfactory profile in the Tulancingo dataset presents distinctive aromatic associations across tortilla types (see
Figure 7b and
Table 16), revealing differences influenced by both processing and fortification.
The commercial Minsa tortilla is characterized by nixtamal, acidic, and humid descriptors, indicating perceptible fermentation-like and moisture-related notes. The traditional nixtamal tortilla is primarily associated with corn, earthy, and other aromas, reflecting a more natural maize-based and grounded aromatic profile.
The fortified Minsa tortilla exhibits sweeter and slightly fermented characteristics, linked to sour and sweet descriptors. In contrast, the fortified nixtamal tortilla is associated with deeper and more intense aromatic notes, including burnt and piloncillo, suggesting the presence of roasted and sweet undertones introduced through fortification.
Overall, the smell attribute indicates that fortification modifies aromatic balance differently depending on the base tortilla type, enhancing sweetness in the Minsa variant and intensifying roasted–sweet nuances in the nixtamal-based tortilla.
Texture
The texture attribute in the Tulancingo dataset reflects differentiated structural and mechanical characteristics across tortilla types; see
Figure 7c and
Table 17.
The commercial Minsa tortilla is associated with porous and other descriptors, suggesting a relatively open structure with less distinctive mechanical features. The traditional nixtamal tortilla exhibits a firmer, more structured profile, characterized by hot, rough, elastic, rigid, and moldable attributes, indicating cohesiveness and perceptible surface irregularity.
The fortified Minsa tortilla presents a softer, more aerated profile, associated with soft, smooth, sandy, and spongy descriptors, suggesting that fortification modifies the internal structure and surface perception. In contrast, the fortified nixtamal tortilla exhibits chewy, thick attributes, reflecting increased density and resistance during mastication. Overall, the texture results indicate that fortification alters mechanical perception differently depending on the base formulation, softening and aerating the Minsa variant while reinforcing density and chewiness in the nixtamal-based tortilla.
Taste
The taste attribute in the Tulancingo dataset reveals differentiated flavor profiles shaped by processing method and fortification; see
Figure 7d and
Table 18.
The commercial Minsa tortilla is characterized by salty, acidic, lime, and doughy descriptors, suggesting a perceptible balance between salinity, acidity, and cereal-based notes. The traditional nixtamal tortilla is associated with corn and toasted flavors, reflecting its characteristic maize identity and thermal processing notes.
The fortified Minsa tortilla presents a more complex flavor structure, linked to sour, earthy, and other descriptors, indicating modifications in acidity and depth after fortification. In contrast, the fortified nixtamal tortilla is associated with more intense and layered notes, including nixtamal, burnt, and piloncillo, suggesting reinforcement of traditional processing characteristics combined with sweeter undertones. Overall, the taste profile in Tulancingo indicates that fortification enhances flavor complexity in both formulations, although the specific sensory shifts differ between Minsa- and nixtamal-based tortillas.
Mouthfeel
The mouthfeel attribute in the Tulancingo dataset highlights clear differences in oral texture and structural perception among tortilla types; see
Figure 7e and
Table 19. The traditional nixtamal tortilla is primarily characterized by elastic, rigid, and hard sensations, indicating a firm and cohesive internal structure during mastication. In contrast, the commercial Minsa tortilla is mainly associated with the descriptor ’spongy,’ suggesting a lighter, more aerated oral texture.
Fortification introduces distinct modifications depending on the base formulation. The fortified Minsa tortilla is characterized by moist, creamy, pasty, chewy, and other descriptors, reflecting a softer, more cohesive, and more hydrated mouthfeel. Meanwhile, the fortified nixtamal tortilla is associated with rough, dry, and gummy sensations, indicating increased resistance and residual oral adhesion.
Overall, the mouthfeel results suggest that fortification softens and enhances cohesiveness in the Minsa variant, while it reinforces density and residual texture perception in the nixtamal-based tortilla.
Aftertaste
The aftertaste attribute in the Tulancingo dataset reveals differentiated residual flavor patterns across tortilla types (see
Figure 7f and
Table 20), highlighting how processing and fortification influence persistent sensory perception.
The traditional nixtamal tortilla is characterized by corn and nixtamal descriptors, reinforcing its maize-based identity even after swallowing. The commercial Minsa tortilla shows a lime aftertaste, indicating perceptible residual acidity.
Fortification produces distinct modifications in both formulations. The fortified Minsa tortilla exhibits a combination of sweet, salty, and other residual notes, suggesting a more complex and prolonged flavor persistence. In contrast, the fortified nixtamal tortilla is associated with piloncillo, suggesting a sweet undertone that persists after consumption. Overall, the aftertaste results suggest that fortification enhances residual sweetness and flavor complexity, while traditional nixtamal tortillas maintain a consistent maize-derived sensory persistence.
Overall, the attribute-based analysis of the Tulancingo dataset reveals consistent and distinct sensory tendencies across tortilla types, though with structural variations compared with the Xalapa results. Traditional nixtamal tortillas maintain a stable maize-centered identity, characterized by yellow color, corn-related aromatic and flavor notes, and firm, cohesive texture. Commercial Minsa tortillas exhibit lighter visual tones, perceptible acidity, and comparatively less structured mechanical characteristics. Fortification introduces notable modifications in both formulations: in the Minsa variant, it enhances sweetness, moisture, and softness, whereas in the nixtamal-based tortilla, it tends to intensify darker coloration, roasted or sweet undertones, and a denser or more adhesive mouthfeel. Collectively, these patterns confirm that fortification alters multiple sensory dimensions while preserving the foundational identity of each base tortilla type in the Tulancingo dataset.
6. Discussion
The experimental results suggest that class separability in sensory tortilla analysis exhibits multi-scale structural behavior. By integrating DBI, SC, and KNN-OS into a unified geometric index , the evaluation framework indicates that projection quality is assessed from complementary structural perspectives rather than a single criterion.
Across both datasets and analysis types, DE- consistently achieved competitive or superior performance compared with PCA, LDA, and PCA+LDA. Its main advantage lies in its flexibility: unlike classical LDA, which optimizes a closed-form Fisher criterion under strict assumptions, DE- directly searches the projection space to optimize separability behavior, enabling adaptation to non-ideal or partially overlapping class distributions. It is important to note that the comparative analysis in this study was intentionally limited to PCA, LDA, and their combination, as these methods remain the most widely adopted in food science due to their interpretability and the clear associations they reveal between variables and sensory attributes. Although alternative approaches such as PLS-DA, Random Forest, and non-linear techniques (e.g., t-SNE and UMAP) offer strong performance, their limited geometric interpretability often hinders their adoption in this field. In this context, DE- operates within the same orthonormal projection framework as PCA and LDA, preserving interpretability while optimizing class separability. This positions the proposed method as a natural extension of established techniques, bridging the gap between explainability and discriminative performance. Nonetheless, future work should explore comparisons with non-linear and ensemble methods.
The global analyses indicates that when all sensory attributes are considered simultaneously, evolutionary optimization captures discriminant directions that improve both compactness and local discrimination. The attribute-based analyses show that separability strength is unevenly distributed across sensory dimensions, emphasizing the importance of attribute-level evaluation in food sensory characterization.
Beyond quantitative separability, the projection matrices derived from the best-performing configurations enabled the identification of sensory profiles for each tortilla type. By analyzing the geometric relationship between feature-weight vectors and class centroids in the discriminative subspace, distinct attribute patterns were observed across both datasets. Traditional nixtamal tortillas consistently maintained a maize-centered identity, characterized by yellow color, corn-related aromatic and flavor notes, and firm or elastic texture. Commercial Minsa tortillas tended to exhibit lighter color tones, perceptible acidity, and comparatively weaker structural cohesion. Fortification introduced systematic modifications: in Minsa-based tortillas, it frequently enhanced sweetness, softness, and moisture perception, while in nixtamal-based tortillas, it intensified darker color tones, roasted or burnt notes, and a denser or more adhesive mouthfeel.
It is important to note that, although attribute-based projections exhibit class overlap, the geometric interpretation of projection weights provides a meaningful structural mapping between sensory variables and tortilla types. This suggests that discriminative dimensionality reduction not only improves classification-oriented separability but also facilitates interpretability at the feature level, a crucial aspect in sensory science applications.
Moreover, the robustness of DE- when LDA fails or becomes unstable underscores its practical relevance for real-world datasets, where multicollinearity and limited sample structure may compromise analytical solutions.
Regarding the experimental design, it is important to acknowledge the demographic concentration of the sensory panel, which consisted of university students aged 18 to 25. This population was selected to ensure participants’ availability and willingness to engage in multiple tasting sessions, thereby enabling the acquisition of a dataset. However, this choice introduces demographic bias. The sensory preferences and perceptions reported herein, therefore, reflect this specific segment and should be generalized to broader populations with caution. Nevertheless, the proposed framework focuses on extracting structural relationships and discriminative patterns within the data rather than on population-level inference, thereby supporting the validity of the methodological findings despite the sample constraint. Future research could benefit from incorporating more diverse panels to evaluate the stability of the identified sensory profiles and confirm the robustness of fortified tortilla characterization across different age groups and socio-economic backgrounds.
Another methodological aspect to consider is that this study does not employ a training/test split or cross-validation. This choice is intentional, as DE- is used here as a descriptive and exploratory tool for data characterization rather than for predictive modeling or machine learning tasks. The primary objective is to identify a projection matrix that reveals the intrinsic structural separability of the fortified tortilla samples. In this context, the absence of external validation is consistent with exploratory multivariate techniques such as PCA. Nevertheless, future extensions of the DE- framework could incorporate resampling strategies to assess the stability and robustness of the optimized projection across different data subsets.
Overall, the proposed framework indicates that combining evolutionary feature extraction with structured separability evaluation provides improved discriminative projections, greater robustness against ill-conditioned scatter matrices, enhanced local overlap control, interpretable two-dimensional visualizations for sensory analysis, and a structured methodology for identifying attribute-level sensory profiles.
The DE- framework is specifically designed to reduce dimensionality to two or three dimensions (), aligning with its primary goal of enabling intuitive visualization of multivariate sensory data. This restriction reflects the practical limits of human interpretation, as meaningful geometric insights are best obtained in low-dimensional spaces. By concentrating the evolutionary search within these projection spaces, the method enhances class separability while avoiding stability issues commonly encountered by analytical approaches. As a result, it achieves a balance between cluster compactness and visual interpretability, providing clear 2D or 3D representations for the analysis of complex sensory profiles.
The results indicate that DE- is a promising and robust alternative for visualizing sensory data, offering significant advantages in class separation in the specific case of fortified tortillas.
7. Conclusions
This study proposed a structured framework for dimensionality reduction in complex sensory datasets, combining analytical and evolutionary projection methods with a multi-criteria separability assessment through the unified index . This approach enabled a balanced evaluation of cluster compactness, cohesion, and neighborhood consistency.
Across both datasets, the DE- method demonstrated competitive or superior performance compared to PCA, LDA, and PCA+LDA, particularly in handling overlapping classes and heterogeneous sensory variables. Its ability to directly optimize separability enabled it to overcome limitations of classical linear approaches.
Attribute-level analysis revealed that sensory discrimination is not uniformly distributed, with color, taste, and mouthfeel contributing differently across datasets and formulations. Additionally, the proposed framework facilitated the identification of interpretable sensory profiles, showing that fortification systematically modifies key attributes such as sweetness, color, and texture.
In summary, the proposed methodology provides:
A structurally grounded separability evaluation scheme;
A flexible evolutionary projection strategy robust to ill-conditioned scenarios;
Interpretable low-dimensional representations suitable for visualization;
A systematic approach for sensory profile identification.
Overall, the methodology provides a robust and interpretable tool for analyzing sensory data on tortilla fortifications with chilacayote powder.



 ,
,