1. Introduction
The energy efficiency of compressed air systems remains a critical challenge in industrial environments, particularly in facilities where production demands fluctuate and equipment operates under partial load conditions [
1,
2,
3]. Despite their widespread use as a reliable source of pneumatic energy, rotary screw compressors are often characterized by low operational efficiency, especially when oversized or improperly controlled [
4,
5]. This mismatch between installed capacity and actual demand results in unnecessary energy losses, reduced equipment lifespan, and increased operational costs [
6,
7,
8].
Numerous studies have analyzed the performance of industrial air compressors, emphasizing the impact of factors such as operating pressure, volumetric flow rate, compression temperature, and motor efficiency [
9,
10,
11]. Research has shown that energy losses in these systems can be attributed to both mechanical inefficiencies during compression and electrical inefficiencies in the drive motor [
12,
13,
14]. Moreover, the presence of reactive energy commonly overlooked in daily operation can significantly affect the overall power factor and result in financial penalties or increased transformer losses [
15,
16,
17].
Industrial compressed air systems typically involve a compressor unit, storage tanks, a distribution network, and multiple end-use machines [
18,
19,
20]. The overall efficiency of such systems depends not only on the compressor’s mechanical design but also on control strategies, demand-side management, and the quality of the electrical supply [
21,
22,
23]. In particular, maintaining a high power factor and minimizing idle operating times are crucial for optimizing energy use and ensuring sustainable operation [
24,
25,
26].
Among the most influential variables affecting compressor performance are load factor, volumetric flow rate, isentropic work, and motor electrical efficiency [
27,
28,
29]. These variables are interrelated, and their impact on energy consumption must be assessed using thermodynamic models, field measurements, and power quality analyses. For instance, the ratio of compression work to electrical input provides a reliable efficiency indicator under varying load conditions [
30,
31,
32]. Likewise, real-time monitoring of electrical demand and power factor enables targeted interventions such as capacitor bank installation or control system upgrades [
33,
34,
35].
Advancements in predictive maintenance and artificial intelligence have led to the development of data-driven models capable of forecasting compressor behavior based on operational parameters [
36,
37,
38]. These tools allow early detection of underperformance, support asset management decisions, and contribute to decarbonization goals through energy savings [
39,
40,
41]. However, their accuracy depends heavily on the quality of experimental data collected under realistic operating conditions [
42,
43,
44].
Most existing studies on compressor efficiency rely either on theoretical simulations, manufacturer’s curves, or experiments under controlled laboratory conditions. However, few works provide a detailed experimental assessment of rotary screw compressors under real industrial partial-load conditions, where efficiency losses are most pronounced. Additionally, the literature often neglects the combined effect of reactive power consumption, low power factor, and operational strategies on overall system efficiency.
To address this gap, our study provides:
A field-based thermodynamic and electrical evaluation of a BOGE C 22-2 compressor under actual plant conditions, showing significant discrepancies between nominal and operational efficiencies.
An integrated analysis of compressor performance and power quality, quantifying both active and reactive energy contributions, which is rarely reported in comparable case studies.
Practical techno-economic improvement strategies (capacitor bank compensation, demand-based control, and hybrid compressor configuration) supported by real measurements, bridging the gap between theoretical optimization methods and industrial feasibility.
This paper is organized as follows:
Section 1 presents the challenges associated with energy efficiency in industrial compressed air systems, and the need for operational modeling and optimization.
Section 2 details the measurement instruments, compressor specifications, and mathematical models used.
Section 3 presents the experimental findings, including efficiency metrics, flow rates, and power factor analysis.
Section 4 interprets the results in the context of best industrial practices and outlines potential improvements. Finally,
Section 5 summarizes the key insights and recommendations for future implementation.
2. Materials and Methods
To identify the predominant trends, technological advances, and energy-related concerns associated with industrial compressors and electric motors, a bibliometric search was conducted using the Scopus database. The search strategy was designed to capture both the technical aspects, such as energy efficiency, operational optimization, and power consumption, and to filter out results related to non-representative applications, such as gas turbines, fuel cells, or hybrid vehicles, which often introduce noise into compressor–motor system analyses.
The query focused on documents that included the term “compressor” in combination with “electric motor” or “electrical motor”, and that referenced key concepts such as efficiency, optimization, or energy consumption. These dimensions are crucial for assessing the performance of compressor motor systems in industrial environments, where power demand, thermal losses, and control strategies significantly impact operational costs and carbon emissions.
To ensure thematic relevance, targeted exclusions were applied to keywords associated with adjacent but unrelated fields, such as fuel cells, electric vehicles, carbon footprint, or waste heat utilization. This refinement enabled the search to focus exclusively on research related to the mechanical and industrial applications of compressors and electric motors.
The search string used was the following:
TITLE-ABS-KEY ( compressor* ) AND TITLE-ABS-KEY ( "electric motor*" OR "electrical motor*" ) AND TITLE-ABS-KEY ( efficiency OR optimization OR "energy consumption" ) AND PUBYEAR > 2018 AND PUBYEAR < 2026 AND ( EXCLUDE ( EXACTKEYWORD , "Gas Turbines" ) OR EXCLUDE ( EXACTKEYWORD , "Fuel Cells" ) OR EXCLUDE ( EXACTKEYWORD , "Electric Drives" ) OR EXCLUDE ( EXACTKEYWORD , "Carbon Dioxide" ) OR EXCLUDE ( EXACTKEYWORD , "Variable Speed Drives" ) OR EXCLUDE ( EXACTKEYWORD , "Hybrid Vehicles" ) OR EXCLUDE ( EXACTKEYWORD , "Hydrogen" ) OR EXCLUDE ( EXACTKEYWORD , "Carbon Footprint" ) OR EXCLUDE ( EXACTKEYWORD , "Electric Vehicles" ) OR EXCLUDE ( EXACTKEYWORD , "Electric Loads" ) OR EXCLUDE ( EXACTKEYWORD , "Centrifugation" ) OR EXCLUDE ( EXACTKEYWORD , "Bearings (machine Parts)" ) OR EXCLUDE ( EXACTKEYWORD , "Waste Heat Utilization" ) OR EXCLUDE ( EXACTKEYWORD , "Waste Heat" ) OR EXCLUDE ( EXACTKEYWORD , \hl{"’} %MDPI: Please check if this should be ".current" ) OR EXCLUDE ( EXACTKEYWORD , "Acoustic Noise" ) OR EXCLUDE ( EXACTKEYWORD , "Automotive Batteries" ) OR EXCLUDE ( EXACTKEYWORD , "Cathodes" ) OR EXCLUDE ( EXACTKEYWORD , "Chemical Industry" ))
This strategy enabled the identification of a body of literature specifically focused on energy performance, optimization strategies, and technological development in compressor–motor systems across various industrial sectors. The time window was limited to the 2018–2025 period to capture the most recent advancements aligned with Industry 4.0 and the digitalization of processes through smart monitoring systems.
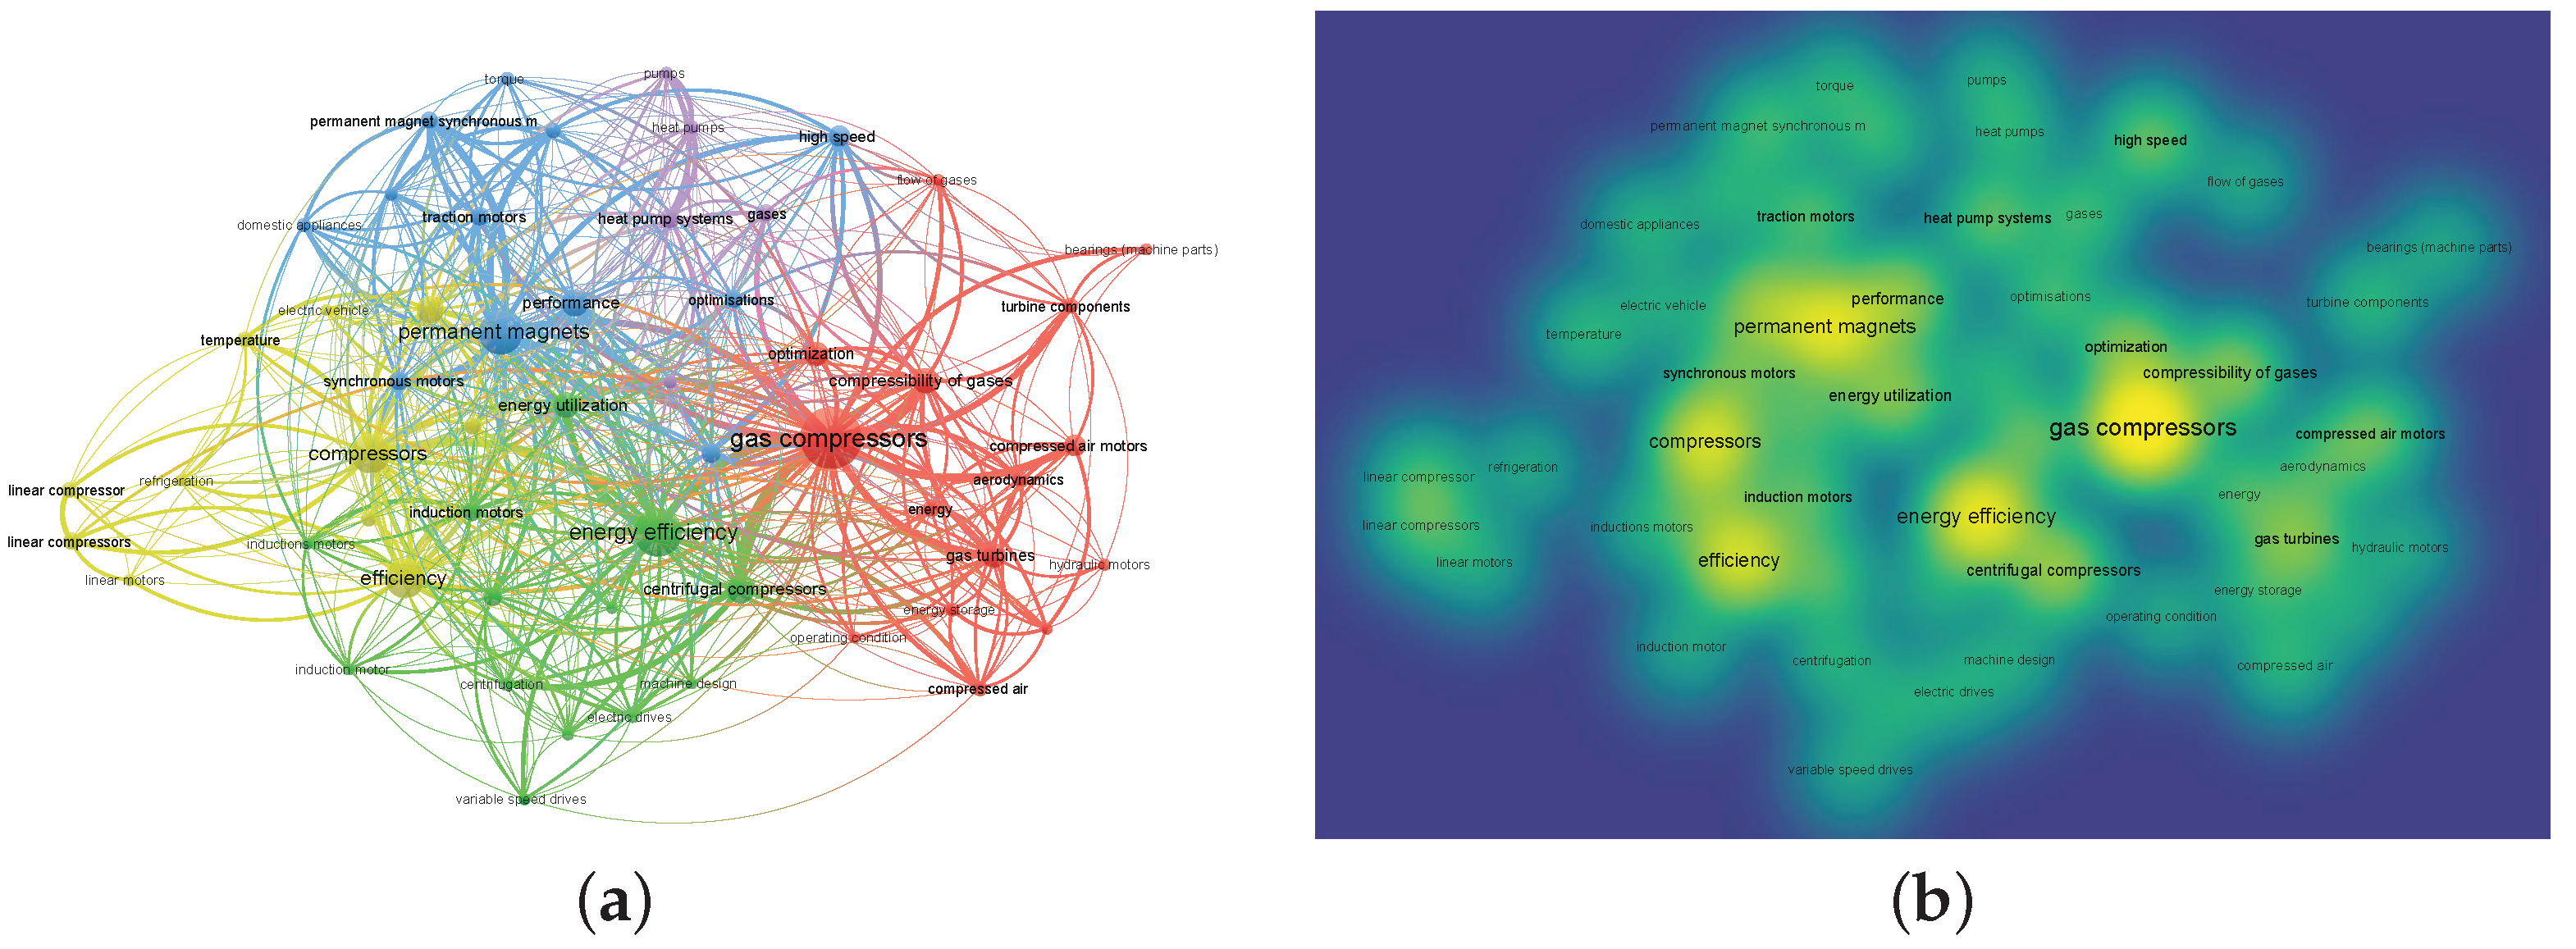
The resulting software provides a solid foundation for further analysis of trends in control methods (e.g., load-adaptive operation), innovations in materials and configurations, and comparative efficiency evaluations in rotary screw compressors and their associated drive systems. The bibliometric analysis performed using VOSviewer (1.6.20) reveals a high co-occurrence of terms such as compressors, electric motors, efficiency, energy utilization, and thermal management systems, confirming the close relationship between these components in the study of thermal and industrial systems (
Figure 1). The prominent presence of concepts such as isentropic efficiency, reciprocating compressors, and permanent magnet motors indicates a clear research focus on improving energy performance and reducing electrical losses in high-speed and variable-load applications.
Additionally, the interconnection of terms such as hydrogen storage, greenhouse gases, and gas emissions suggests an increasing concern for environmental impact, positioning compressors and electric motors as critical elements in the energy transition toward more sustainable systems. The frequency of nodes, such as cooling, heat pump systems, and refrigerants, also highlights their central role in air conditioning and heat pump applications, where system performance strongly depends on the efficient coupling between the motor and compressor.
Overall, these findings reflect a consolidation of research lines oriented toward energy optimization, integration with clean technologies, and the design of high-performance components, which aligns with current industrial challenges related to efficiency and decarbonization.
2.1. Methodology for Compressed Air Flow Calculation
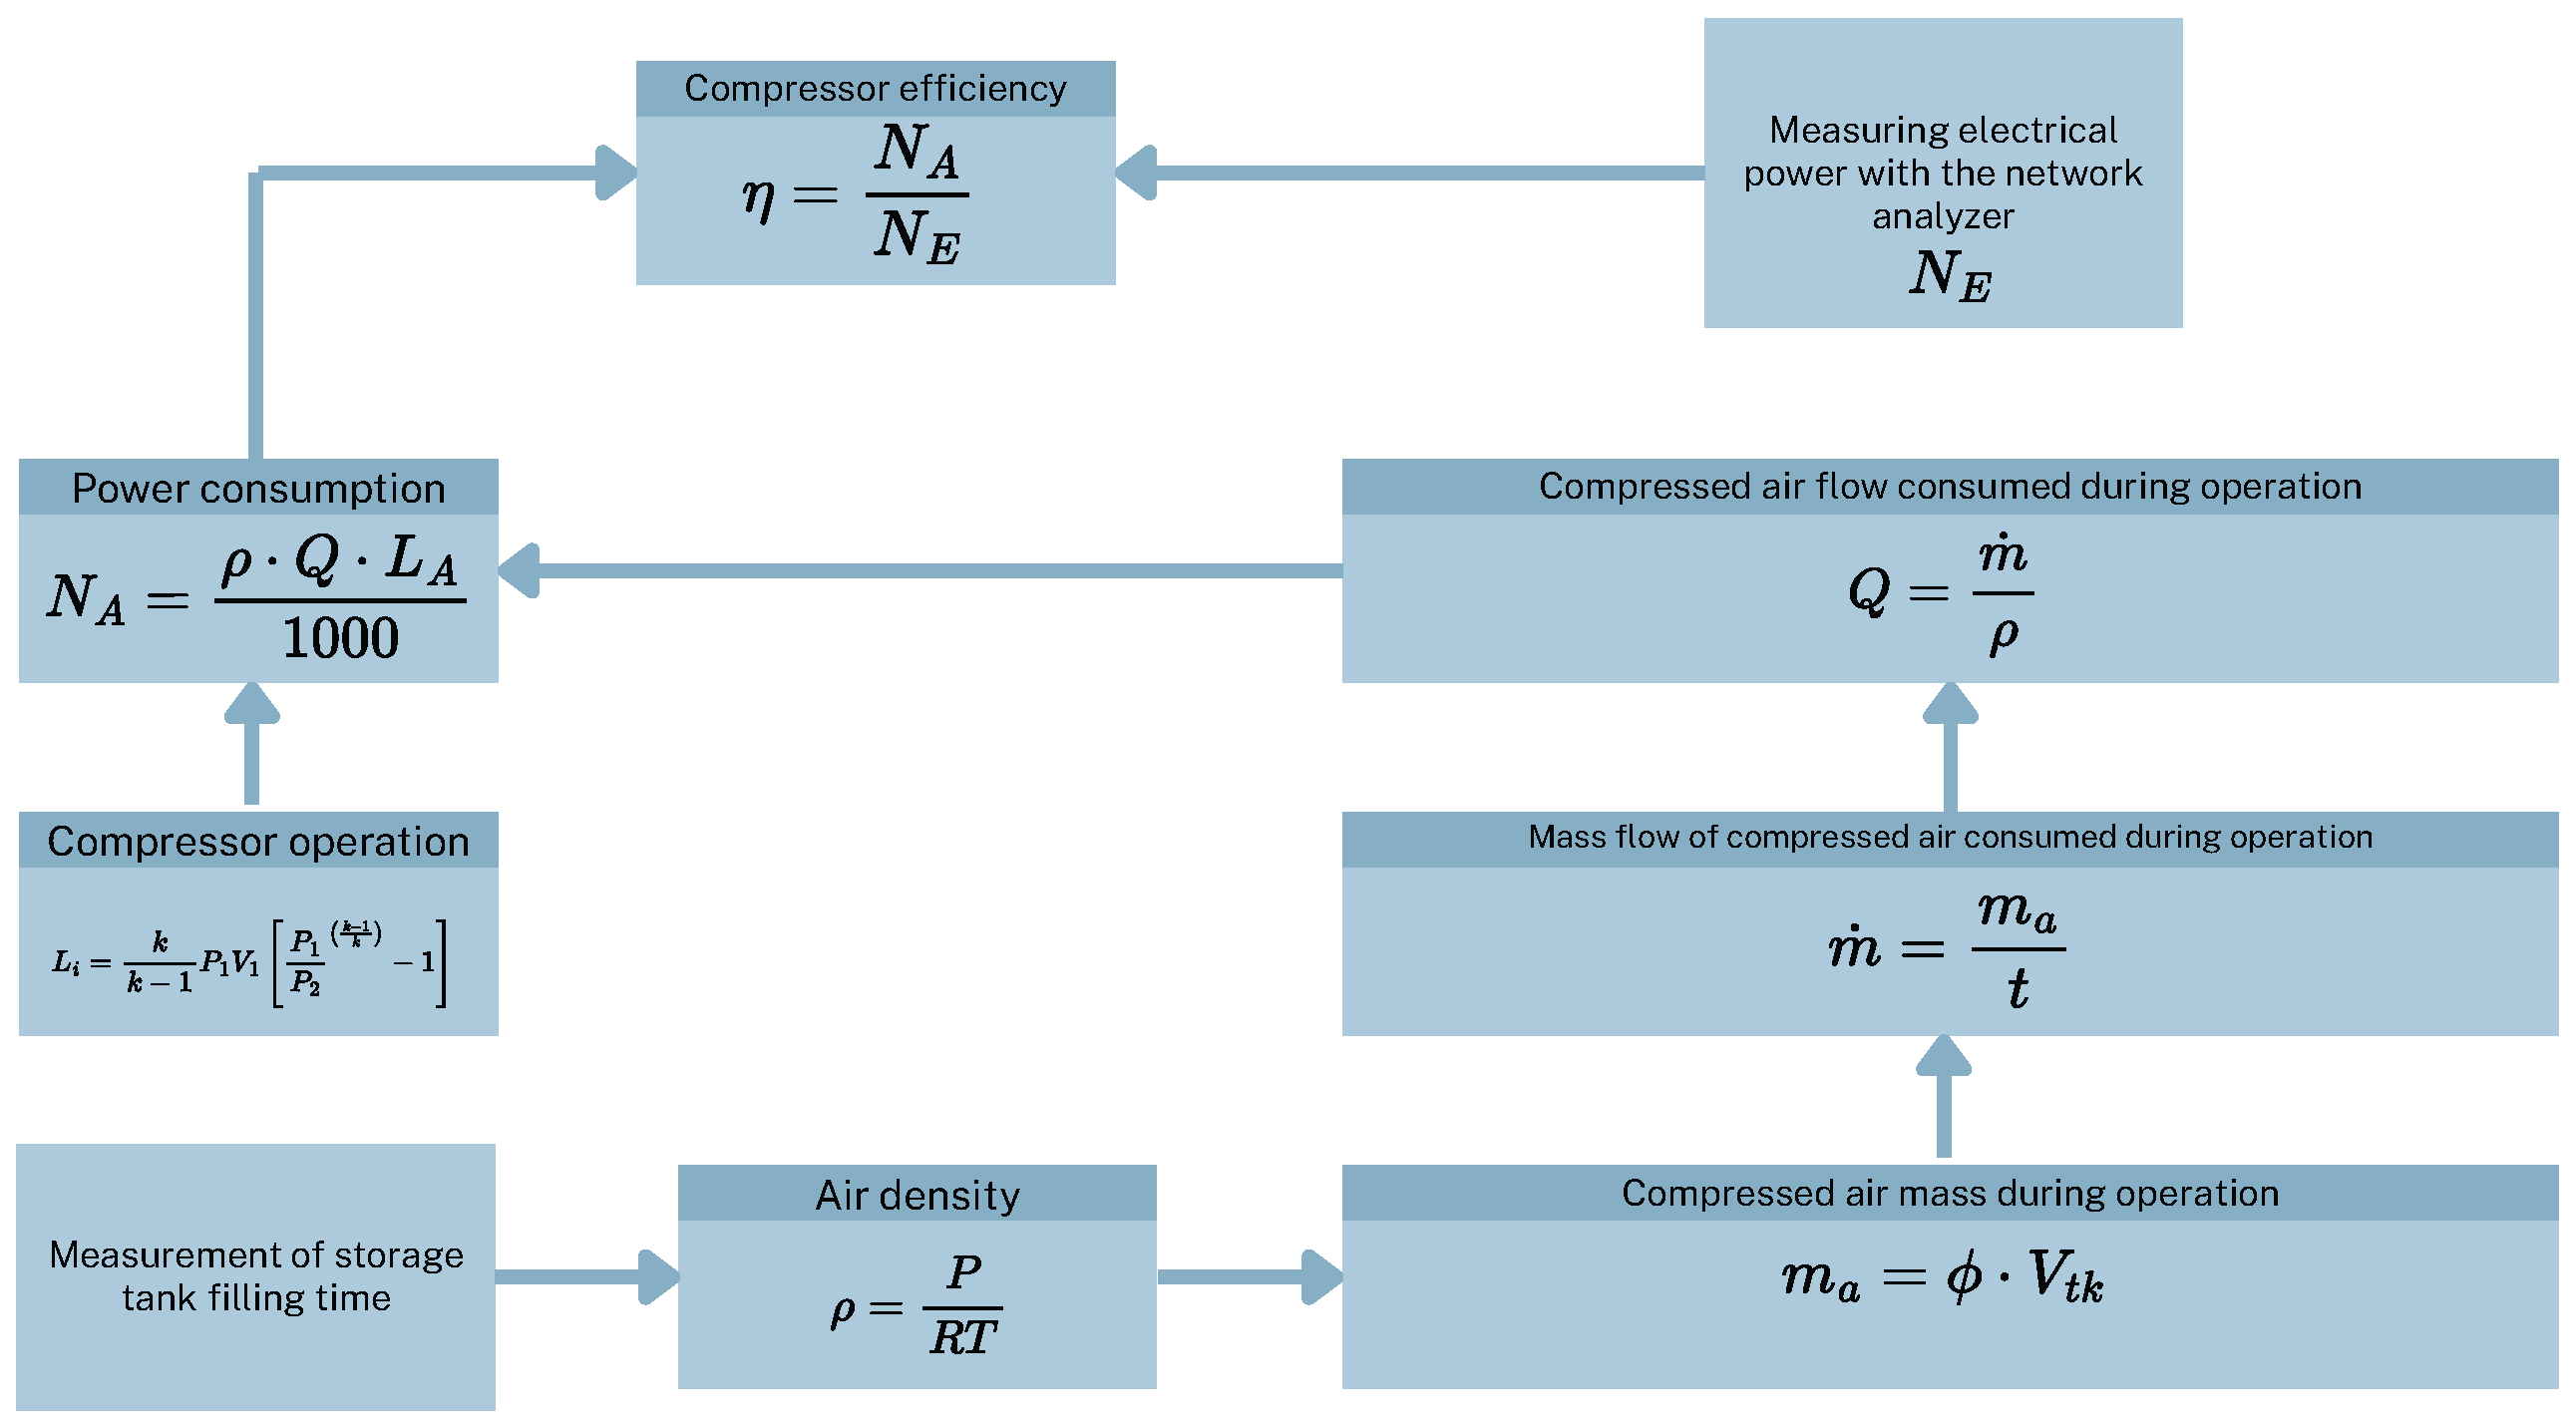
The methodology applied to determine the compressed air flow consumed during the tests was based on an indirect calculation through the storage tank filling test. Since the compressor was operating under a low-load regime, it was necessary to precisely establish the amount of air supplied under this condition. The procedure involved monitoring the On/Off cycles of the compressor, measuring the filling time of the 4.44 m
3 storage tank, and recording pressure and temperature values at start-up and shutdown. From these data, air density was calculated, followed by the determination of the stored air mass, the mass flow rate, and finally the volumetric flow rate, using fundamental thermodynamic equations. This stepwise methodology, summarized in the flow diagram of
Figure 2, provides a clear and structured representation of the process employed in this study to quantify compressed air consumption.
2.2. Description of the System Under Evaluation
The present study was conducted at the José Gregorio Martínez oil company, which recently replaced its aging compressed air system with a rotary screw compressor manufactured by BOGE KOMPRESSOREN. This new oil-lubricated unit was configured to operate at two key pressure points: 10 bar (maximum discharge pressure) and 5.2 bar (nominal working pressure), according to readings displayed on the compressor’s control panel [
45,
46].
2.3. Measurement of Operating Parameters
A detailed monitoring campaign was conducted to record the main electrical and automated parameters of the system. Digital sensors were used to measure pressure, temperature, volumetric flow rate, and electrical consumption. The measurements were carried out exclusively under low-load conditions due to the plant’s reduced productivity. Based on these data, the compressor’s performance at maximum load was estimated using the calculation equations for work, power, and efficiency. The methodology applied is based on approaches previously documented in studies on energy efficiency in industrial compressors (compressors operating at a maximum workload level).
2.4. Compressor Efficiency Calculation
The compressor efficiency was defined as the ratio between the useful energy delivered to the compressed air and the electrical energy consumed by the system. The useful power was calculated based on the airflow rate, outlet pressure, and air temperature. Results were analyzed under the two specified operating pressures. This procedure is consistent with experimental studies that evaluated the performance of screw compressors under varying operational conditions [
47].
The compressor efficiency is defined as the ratio between the useful power delivered to the compressed air (
) and the electrical power supplied to the compressor (
) (Equation (
2)):
The useful power can be estimated as:
Alternatively, for ideal adiabatic compression of air, the following approximate expression can be used:
where:
: inlet pressure (Pa)
: outlet pressure (Pa)
Q: volumetric flow rate (m3/s)
k: adiabatic index of air (≈1.4)
2.5. Compressor Work Estimation
The BOGE C 22-2 compressor is a rotary screw compressor with oil injection into the compression stage. The injected oil fulfils three critical functions: it cools the compressed air, lubricates the internal rotating components (screw rotors), and provides sealing within the compression chamber [
7].
According to Cherkasski [
6], the isentropic coefficient of compression (
k) provides a more accurate description of the pressure–volume relationship during air compression in systems with low thermal dissipation. This is particularly applicable to oil-injected screw compressors, where the heat removal capacity is lower compared to water-cooled systems.
Following this criterion, the theoretical compression work of the BOGE C 22-2 compressor was estimated using Equation (
16), which represents the ideal isentropic work required for gas compression under non-ideal cooling conditions, as suggested by Monteagudo [
48].
where:
: Isentropic work of compression (J/kg)
k: Isentropic coefficient of air compression (); for air,
: Initial pressure (Pa)
: Final pressure (Pa)
: Specific volume of air (m
3/kg); for air at standard conditions,
m
3/kg [
49]
2.6. Electric Motor Efficiency Calculation
The electric motor efficiency was estimated through direct measurements of active power, voltage, current, and power factor using a power quality analyzer. The experimental values were compared with the maximum efficiency specified by the manufacturer (92.8%). This comparison allowed for the identification of potential electrical losses under both partial and full load conditions [
50,
51].
The electric motor efficiency is calculated as:
The input electrical power in a three-phase system is computed as (Equation (
6)):
where:
From Equation (
7), the efficiency value was obtained for each of the three measured power levels [
52].
where:
: Load factor (dimensionless)
: Rated motor power (kW)
: No-load losses (kW)
: Rated motor efficiency (dimensionless)
Indirect Calculation of Power Factor
The power factor was estimated indirectly using the relationship between active energy (
) and reactive energy (
), as no direct readings were obtained from the Power Factor Total (PFT) channel through the power quality analyzer. The power factor is defined as the ratio of active power to apparent power, which is the combination of active and reactive power. This relationship can be expressed mathematically as (Equation (
8)):
where
is calculated using the following formula (Equation (
9)):
In this study, the active and reactive energy values were obtained using a network analyzer, which allows for precise measurement of these parameters in electrical systems. The lack of direct PFT readings did not compromise the power factor estimation, as the indirect measurements of active and reactive energy are sufficient to provide an accurate estimate of this parameter. This indirect methodology is commonly used when measurement instruments are not configured to provide direct PFT readings, but still allow for reliable estimation based on active and reactive energy measurements.
2.7. Load Factor Equation
Based on the power values presented, which will be shown in the following sections as equipment plate data. It is possible to determine the load factor (
) of the electric motor for each measured power value using Equation (
10), as described by Chalmers [
52].
where:
2.8. Estimation of No-Load Losses
The no-load losses (
) of the electric motor can be estimated using Equation (
11), which is derived from rearranging the general motor efficiency expression for a known load factor different from the nominal value. This approach allows isolating the fixed losses in the system based on measured efficiency values [
52].
where:
: Load factor (dimensionless)
: Rated power of the electric motor (kW)
: Efficiency at the given load factor
: Maximum (nominal) efficiency of the motor
: No-load losses (kW)
2.9. Critical Evaluation of Energy Efficiency in Compressors
The reviewed studies reveal that the most widely used methodologies for assessing the efficiency of industrial compressors include (
Table 1): isentropic efficiency, polytropic efficiency, exergy analysis, and advanced control strategies. Research indicates that assuming a constant isentropic efficiency is inaccurate, especially in multistage compressors or under pressure variations; however, this method is more accurate for screw compressors with oil injection in the compression stage. In contrast, the polytropic approach yields more realistic predictions [
53,
54].
On the other hand, exergy-based analyses and holistic integral evaluations help us to understand not only the compressor’s performance but also losses in the motor, control system, piping, and end-use points. These studies have revealed overall system efficiencies below 10% in some industrial cases [
55,
56]. This emphasizes the need to address efficiency from a system-wide perspective, rather than just at the component level.
In the calculation of efficiency of screw compressors with insufficient cooling, the isentropic coefficient (k) is the most accurate, due to the absence of mechanical friction in the pair of worm gears; this coefficient more accurately describes the change of pressure and volume during the compression stage in screw compressors [
6]. In this case study, the BOGE C 22-2 compressor is a screw compressor with oil cooling in the compression stage [
7]. This type of cooling is considered insufficient cooling [
6].
Recent advancements include optimization techniques that utilize active machine learning in combination with thermodynamic models [
57], which accelerate design while preserving accuracy (diva portal.org, arxiv.org). In addition, compressor sequencing strategies, particularly through nonlinear control or load shifting, have proven capable of reducing energy consumption by up to 20% by intelligently managing operating levels across systems [
58].
Other innovations include the use of variable-speed drives (VSDs), economizers, and variable-displacement screws, which significantly improve efficiency under partial-load conditions. However, they require a higher initial investment [
59].
Although each method offers specific technical value, the literature suggests that no single approach is sufficient in isolation. For example, while polytropic efficiency improves predictive accuracy, it requires precise calibration. Control strategies, on the other hand, reduce energy use but depend on digital infrastructure and operational data. Exergy analysis emerges as the most comprehensive method, though it is data-intensive and time-consuming.
Table 1.
Methods for evaluating and improving compressor efficiency.
Table 1.
Methods for evaluating and improving compressor efficiency.
| Method/Strategy | Brief Description | Main Advantages |
|---|
| Isentropic efficiency | Based on ideal enthalpy difference | Easy to compute, but inaccurate under real conditions [60] |
| Polytropic efficiency | Incremental model accounting for pressure variations | More accurate in multistage and variable-load compressors [61] |
| Exergy analysis | Evaluates destruction of useful energy across the full system | Comprehensive diagnosis and systemic perspective [54] |
| Optimized control/sequencing | Strategies to operate multiple compressors coordinately | Up to 20% energy savings via load shifting [62] |
| Active ML with thermodynamics | Combines models and ML for design and optimization | Reduces design time by ∼46% [63] |
| VSDs and variable displacement | Adjust speed/volume of compression based on demand | High efficiency under partial loads, though with higher capital costs [64] |
In multi-compressor settings, intelligent sequencing combined with variable-speed drives appears to offer the highest energy-saving potential. Future studies should integrate advanced modeling (e.g., ML or simulation) with both qualitative and quantitative energy audits, focusing not only on the compressor component but on the overall system efficiency, including the motor, air distribution network, and point of use conditions.
2.10. Critical Evaluation of Energy Efficiency in Electric Motors
The energy efficiency of industrial electric motors is a central aspect of sustainability policies and technological competitiveness. Various methodological approaches have been developed to estimate, diagnose, and improve motor performance, ranging from classical physical models to advanced artificial intelligence tools. This section presents a critical discussion of the most representative methods identified in recent scientific literature, along with their main advantages, limitations, and application contexts [
65].
Among the most widely used methods for estimating motor efficiency are equivalent circuit models (such as IEEE 112 Method F1), which calculate motor performance based on no-load and partial load tests, without the need for disassembly or invasive instrumentation. These methods provide acceptable precision, on the order of ±3–4%, and are widely used in field diagnostics [
66,
67,
68].
In terms of regulatory classification, the IEC 60034-30 standard [
69] defines efficiency levels from IE1 to IE5, providing a framework for technological replacement and procurement policies [
70,
71]. However, this classification does not consider real-world operational variability.
The analysis of internal losses, including core losses, winding resistance, and mechanical losses, is fundamental for the design of high efficiency motors. This approach has been strengthened by studies incorporating advanced materials, improved cooling techniques, and new rotor topologies [
72,
73].
Control strategies, such as variable speed drives (VSDs) and direct torque control (DTC), enable the real-time adaptation of motor operation to actual load demand, thereby minimizing slip losses and improving efficiency in dynamic regimes [
74].
Recently, machine learning-based predictive maintenance methods have been introduced, enabling early failure detection and identification of operational conditions that compromise energy performance. These approaches, based on sensor networks and supervised algorithms, are particularly effective in continuous and complex systems [
75].
Table 2 presents a comparative summary of the most relevant methods and strategies, including their principles and key advantages, based on specialized literature.
2.11. Repeatability and Quality Control
To ensure the reliability of the results, each measurement was replicated over three consecutive operating cycles under similar conditions. Instrument uncertainty was assessed, and validation protocols were applied using energy audit procedures, such as those suggested by the National Renewable Energy Laboratory [
49,
85].
2.12. Technical Specifications of the BOGE Compressors
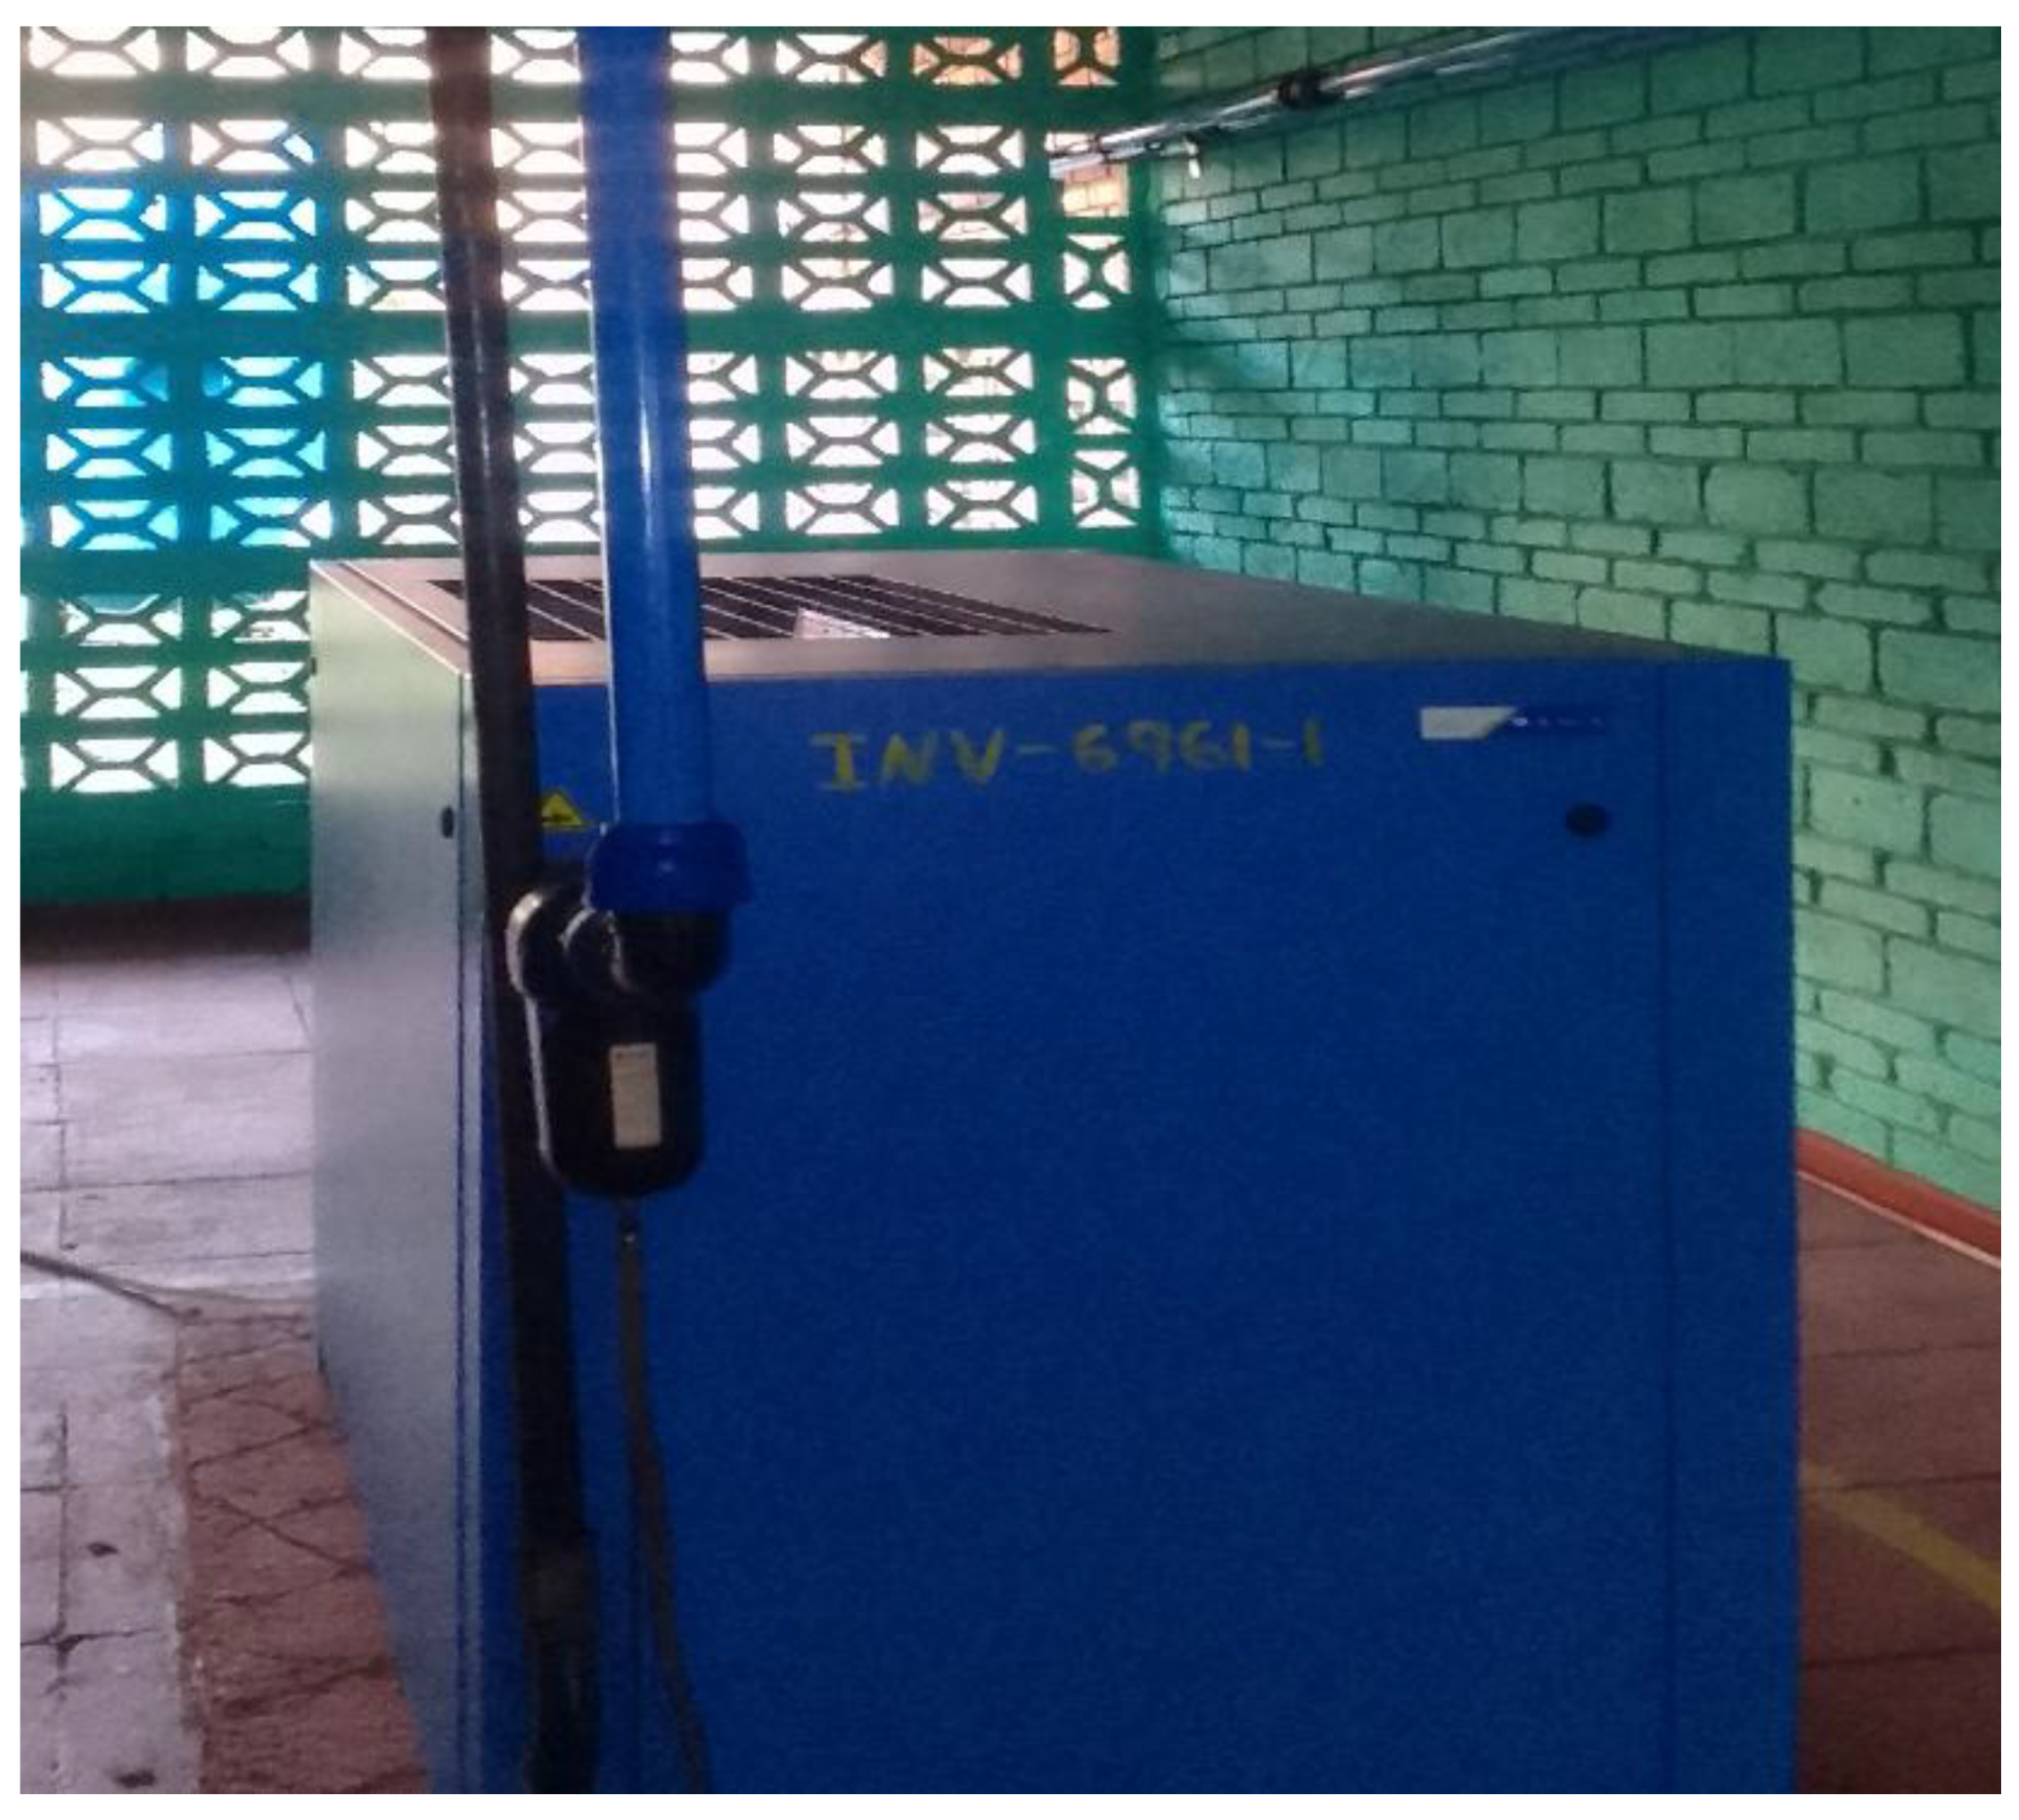
The Oleohidráulica Cienfuegos compressed air system is equipped with two BOGE C 22-2 rotary screw compressors, with oil injection and air-cooled aftercoolers. These units are designed for continuous operation in industrial environments, for a stable and efficient compressed air supply.
Figure 3 shows one of the installed compressors, highlighting its compact structure and modular configuration [
7].
According to the manufacturer’s technical documentation [
86,
87], the main specifications of the BOGE C 22-2 compressors are summarized in
Table 3.
2.13. Technical Characterization of the Electric Motor
2.13.1. Efficiency Behavior Under Different Load Factors
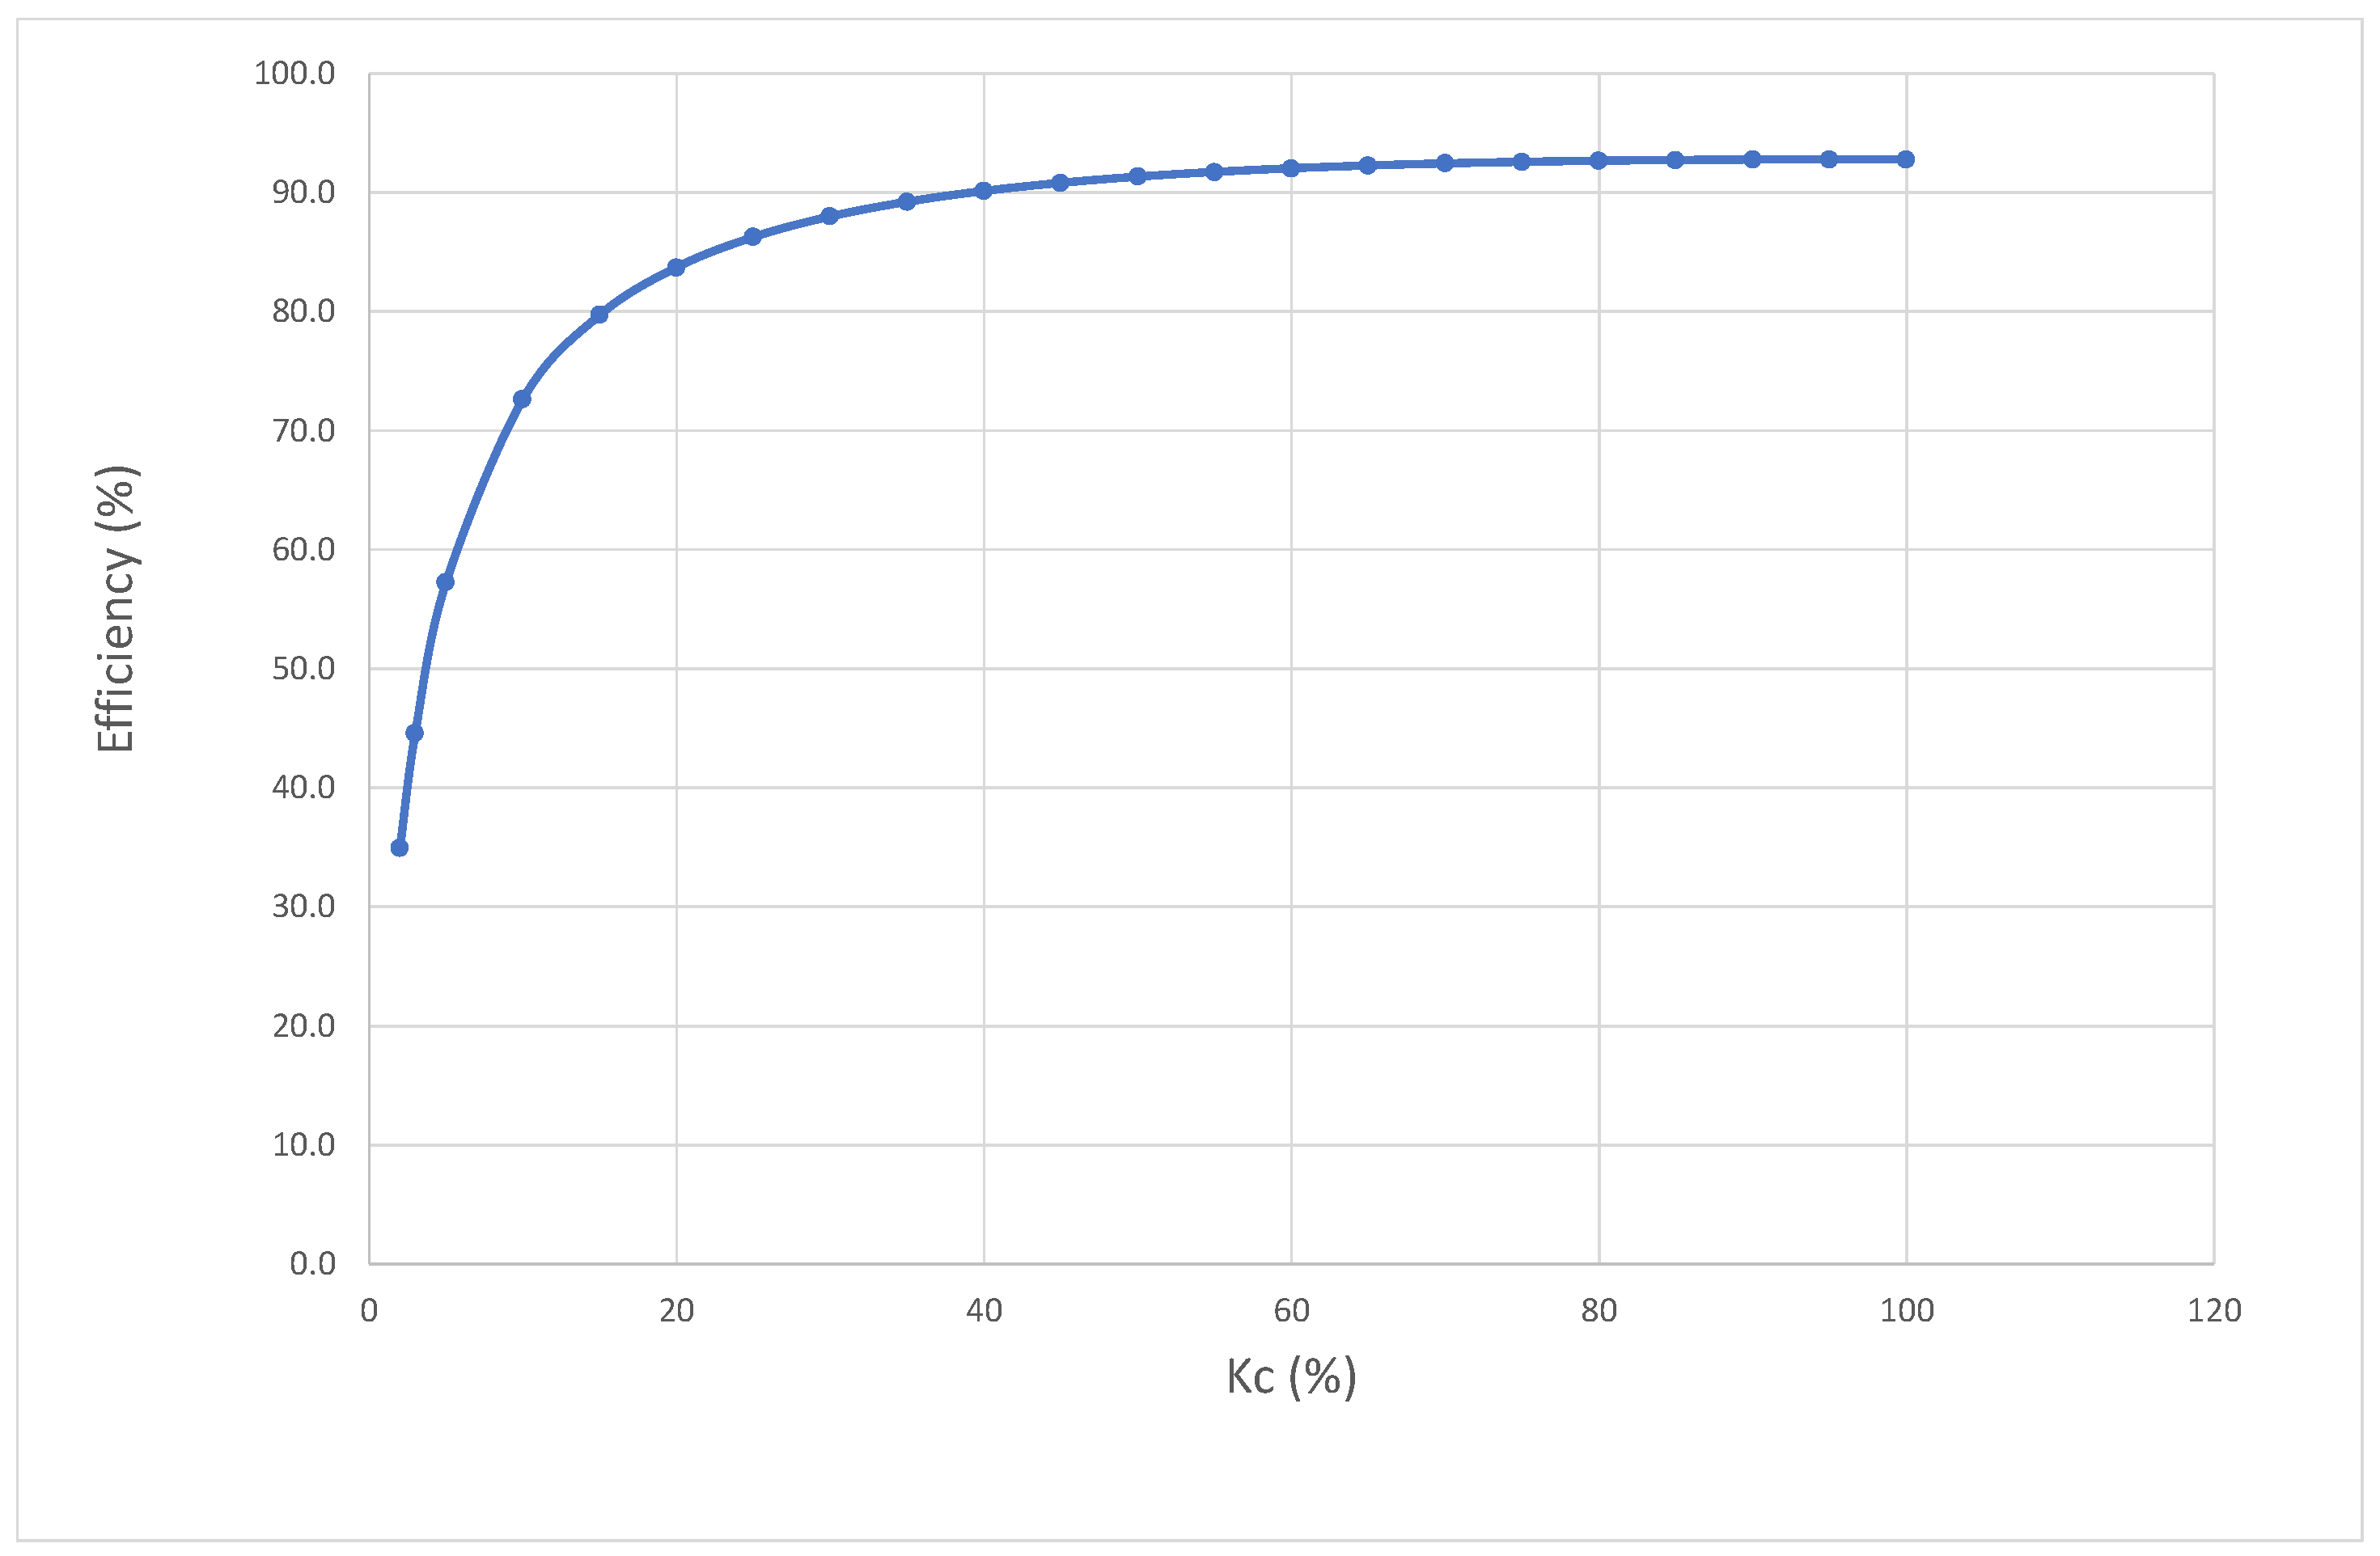
To analyze the performance of the electric motor coupled to the BOGE C 22-2 compressor, the efficiency curve as a function of the load factor (
) was constructed. This was achieved using the nameplate data and plotting the trend using Microsoft Excel.
Figure 4 illustrates the variation in motor efficiency across different load percentages.
As shown in the figure, the motor achieves its highest efficiency when operating between 75% and 100% of its rated capacity, while performance declines significantly under partial load conditions. This behavior is consistent with standard efficiency profiles for three-phase induction motors, highlighting the importance of operating near the design point to maximize energy utilization.
2.13.2. Measurement of Electrical Power Demand
To determine the actual electrical power consumed by the motor, a Chauvin Arnoux C.A 8331 power quality analyzer was connected to the plant’s electrical supply network. Three consecutive measurements were taken to record variations in active power supplied to the motor under different operating conditions. The results are presented in
Table 4.
The recorded values show the variability in the motor’s electrical consumption depending on the load and real-time operating conditions. These data are essential for estimating the overall energy performance of the compressor motor system and for validating theoretical efficiency estimates based on manufacturer-provided curves.
3. Results
3.1. Frequency Stability Analysis
The analyzed
Figure 5 is a frequency stability log for a monitored channel identified as “F”, covering a period of seven days from 31 March 2025, at 2:20 PM to 7 April 2025, at 2:19 PM. The system operated with a display resolution of 12 h per division.
Throughout the observation period, the recorded frequency ranged from a minimum of 59.88 Hz to a maximum of 60.00 Hz, with an average cursor value of 59.93 Hz. These results indicate a very narrow variation around the nominal 60 Hz value, which is indicative of good frequency stability within acceptable limits for electrical or precision electronic systems.
A specific event is noted on 3 April 2025, at 4:37 AM, lasting 2 min. Although this event does not represent a significant deviation, it is recommended to cross-reference it with complementary data such as voltage, power, or maintenance logs to rule out any transient anomalies.
Overall, the results suggest stable behavior of the analyzed system, with no evidence of sustained deviations or synchronization loss. The slight average deviation below the nominal value may be attributed to variable loads or minor delays in the system’s control response, without critical operational implications in this context.
3.2. Evaluation of the Electrical Energy Behavior
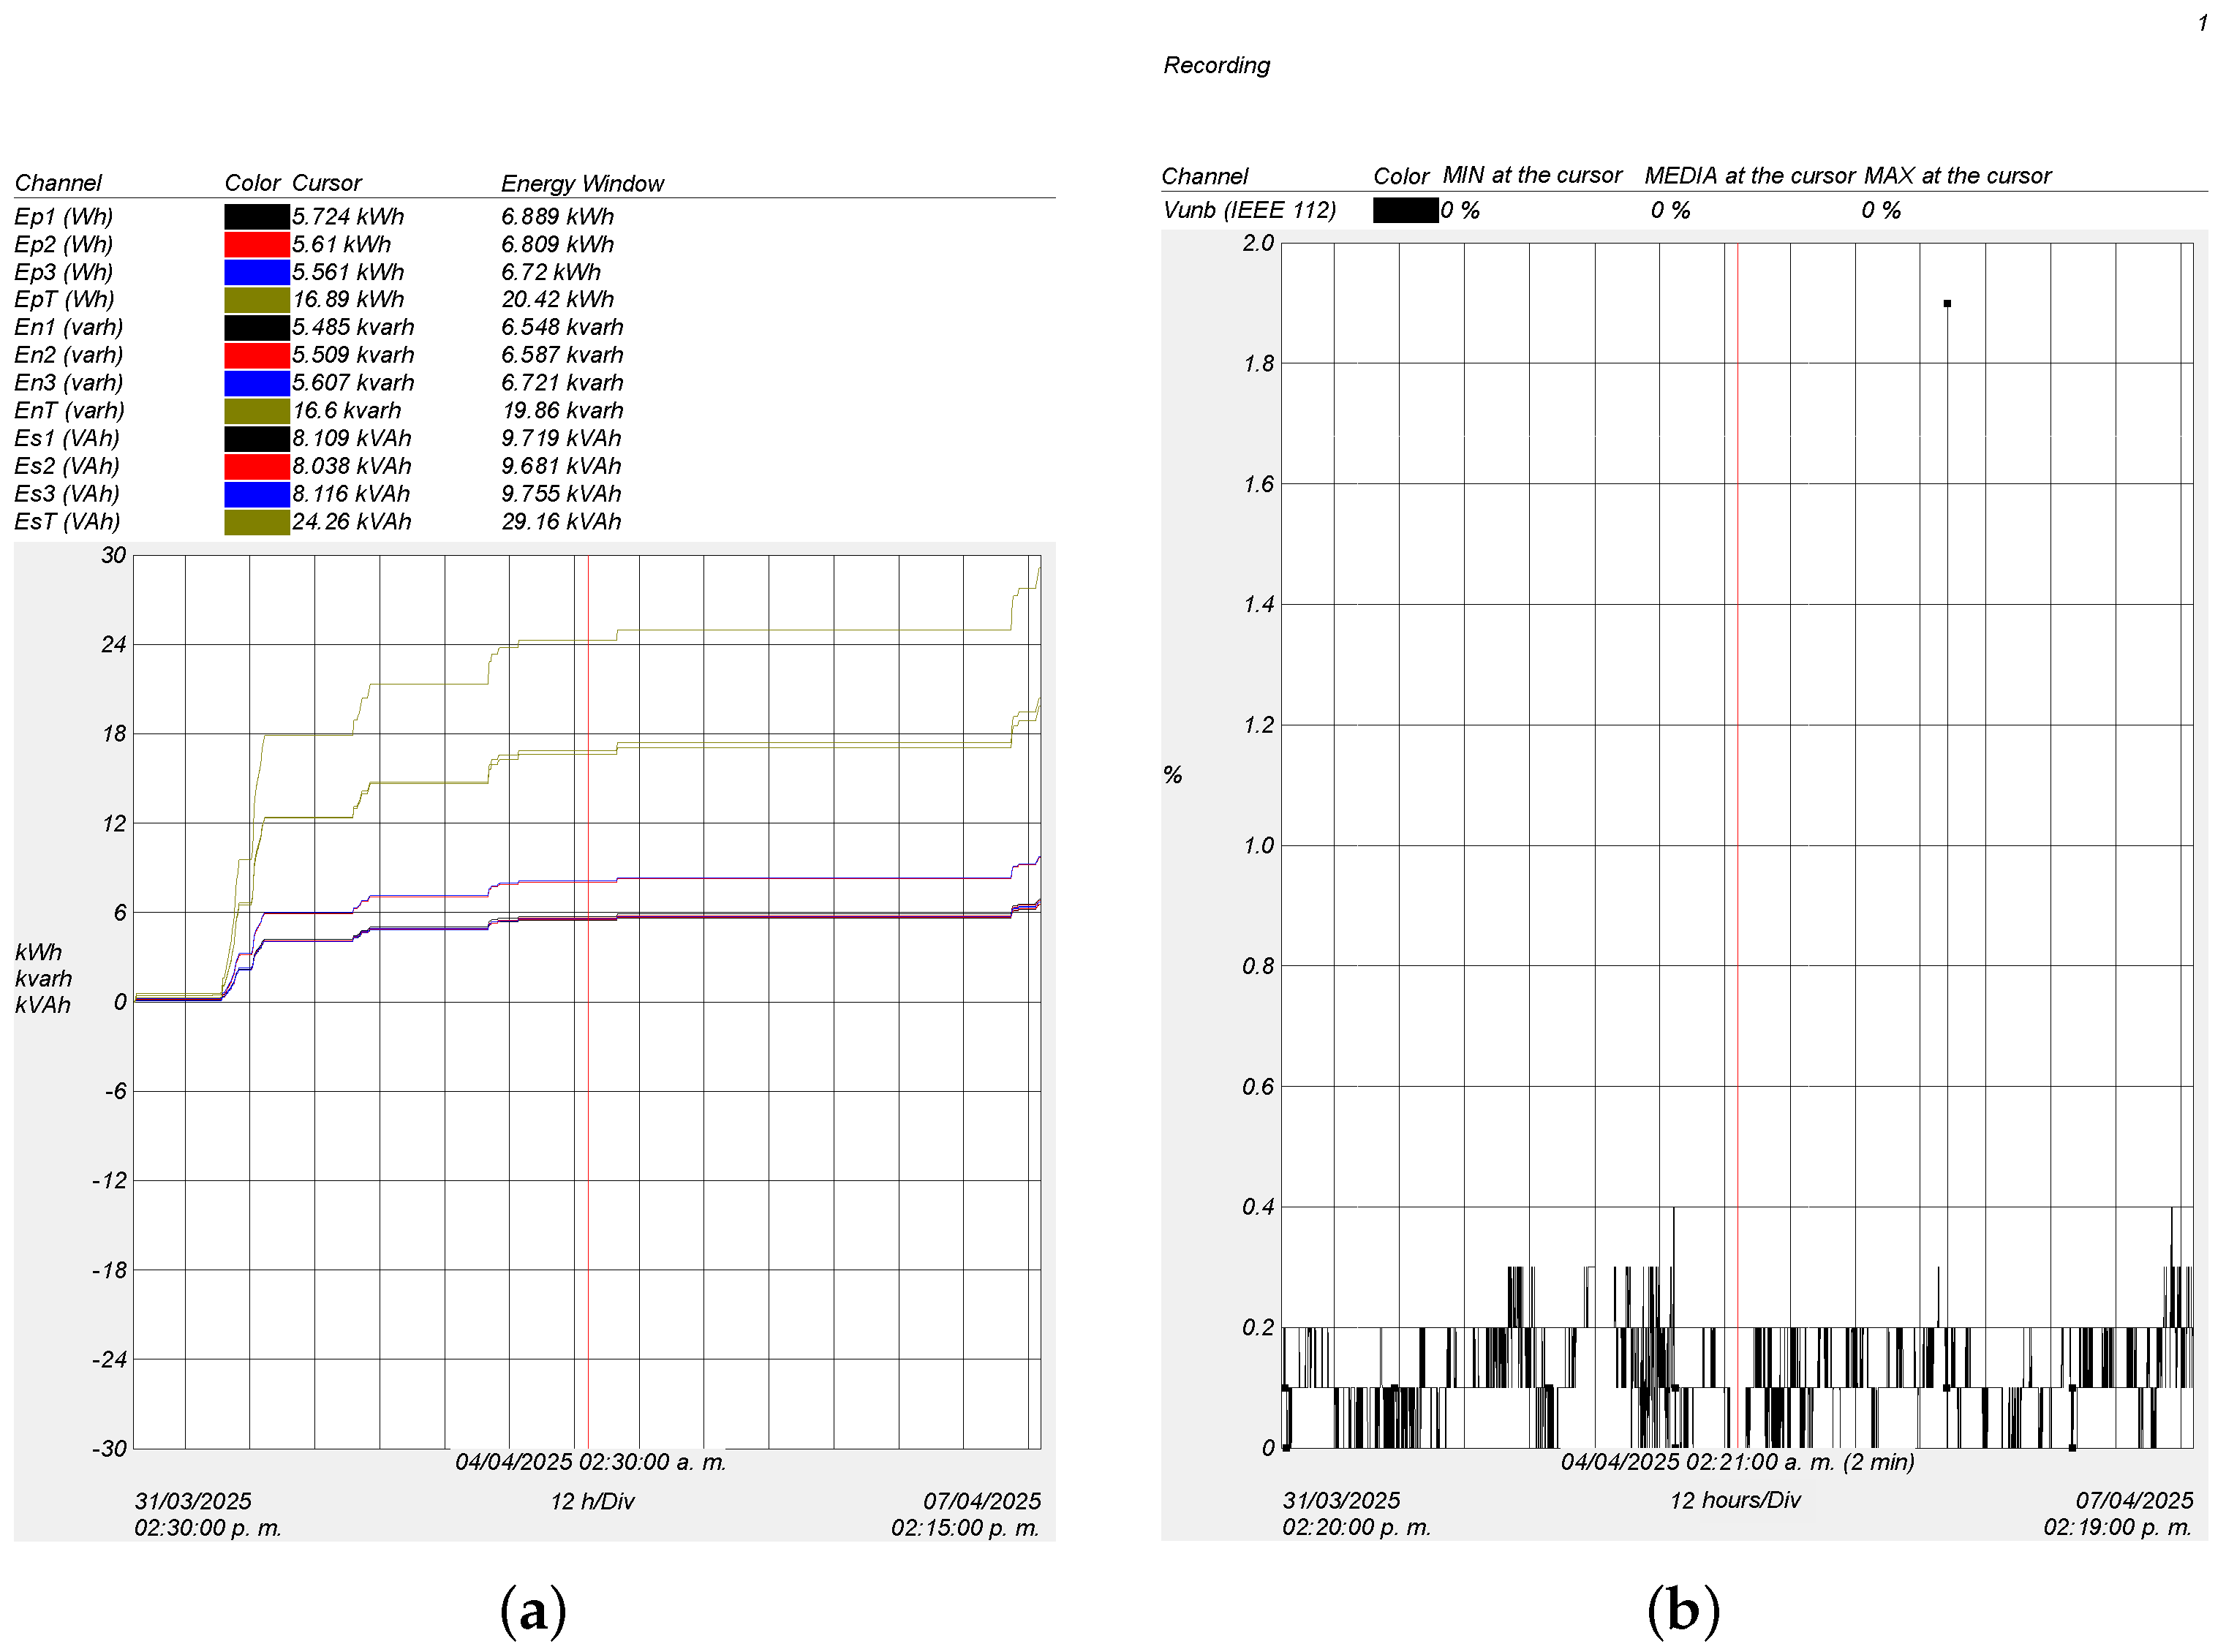
An analysis was conducted on the evolution of electrical energy variables based on the data collected by a power quality analyzer over a continuous seven-day period (
Figure 6a), from 31 March 2025, at 2:30 PM to 7 April 2025, at 2:15 PM, with a temporal resolution of 12 h per division. The measurements included active energy (Ep), reactive energy (En), and apparent energy (Es) across the three phases (Ep1–Ep3, En1–En3, Es1–Es3), as well as their respective total values (EpT, EnT, EsT).
Figure 6a analyzes the energy behavior of a system that integrates the instantaneous power measured over time, starting from zero. The continuous integration of power over time results in a progressive accumulation of energy, represented by a growing curve whose slope depends on variations in the measured power. In dynamic systems with variable loads, the energy curve exhibits a nonlinear behavior.
Active energy (kWh) reflects the useful work performed, while reactive energy (kvarh) is essential for the operation of inductive devices. Apparent energy (kVAh) combines both components, providing a comprehensive view of system consumption and capacity. Energy accumulation follows a growing trajectory, influenced by power variability. During periods of higher power, the accumulation is faster, while in intervals of lower power, the increase is more gradual. This variability highlights the importance of maintaining controlled operating conditions to ensure accurate and reliable measurements.
This analysis is based on the recording of the voltage imbalance (Vunb), according to IEEE 112 standard, captured by the power analyzer over a seven-day monitoring period, from 31 March 2025, at 14:20 to 7 April 2025, at 14:19. The graphical resolution used was 12 h per division (
Figure 6b). The results show that Vunb remained exceptionally low, with an average value of 0%, showing no significant variations in the minimum, maximum, or average values throughout the observation window, indicating remarkable stability in the line voltage system.
This behavior suggests a perfect phase balance within the system, with no evidence of voltage unbalance that could compromise the performance of three-phase motors, transformers, or sensitive electronic equipment. The stability of this parameter reflects a symmetrical load distribution and an electrically well configured network. Notably, no transient events or abrupt deviations were identified during the period, reinforcing the system’s reliability in maintaining voltage symmetry under normal operating conditions.
3.3. Three Phase RMS Voltage Evaluation
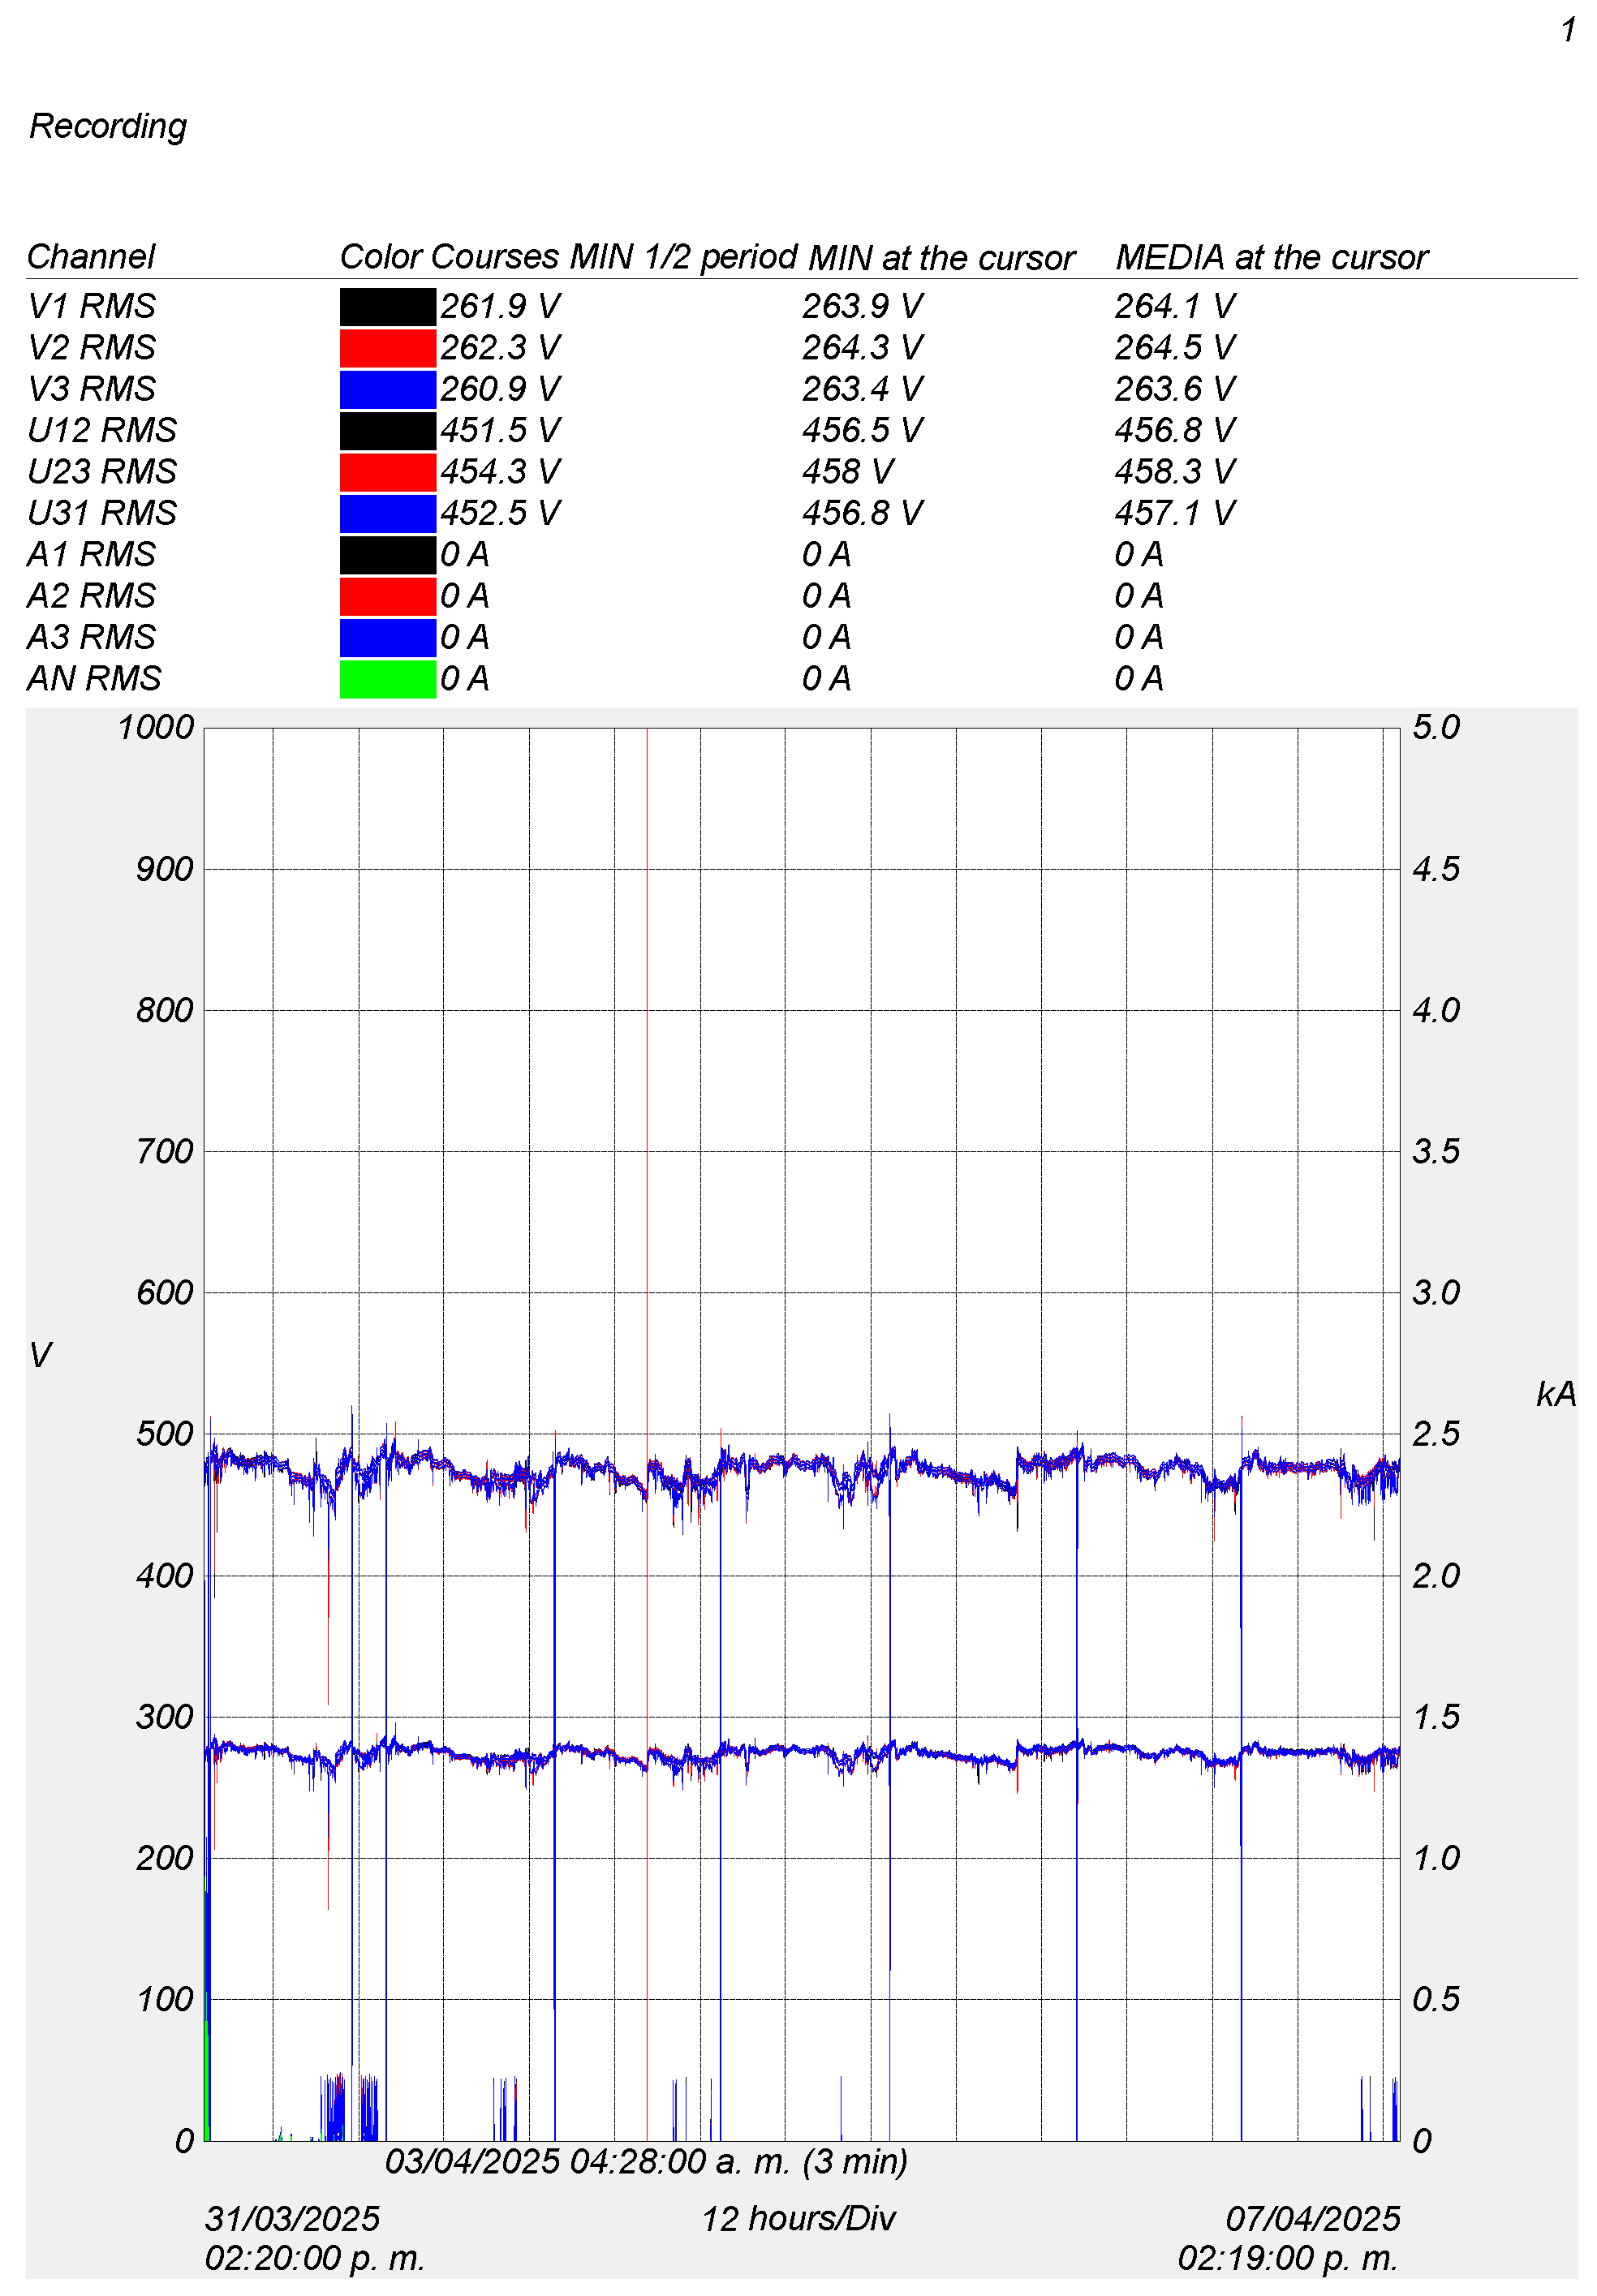
The analysis was conducted based on the recorded RMS values of voltage and current over a seven-day period (
Figure 7), from 31 March 2025, at 14:20 to 7 April 2025, at 14:19, with a resolution of 12 h per division. The monitored channels included phase voltages (V1, V2, V3), line voltages (U12, U23, U31), and phase currents (A1, A2, A3, AN). Notably, the RMS currents measured on all three phases were 0 A, indicating that no load was connected to the system during the monitoring period, or that the equipment was in a no-load (idle) state (
Table 5).
The low variability among phase voltages suggests a high degree of supply symmetry. At the same time, the absence of current confirms that the system was operating under no-load conditions during the recording. This type of evaluation is essential for establishing baseline reference conditions in energy audits or acceptance testing of electrical equipment.
3.4. Analysis of Active, Reactive, and Apparent Power
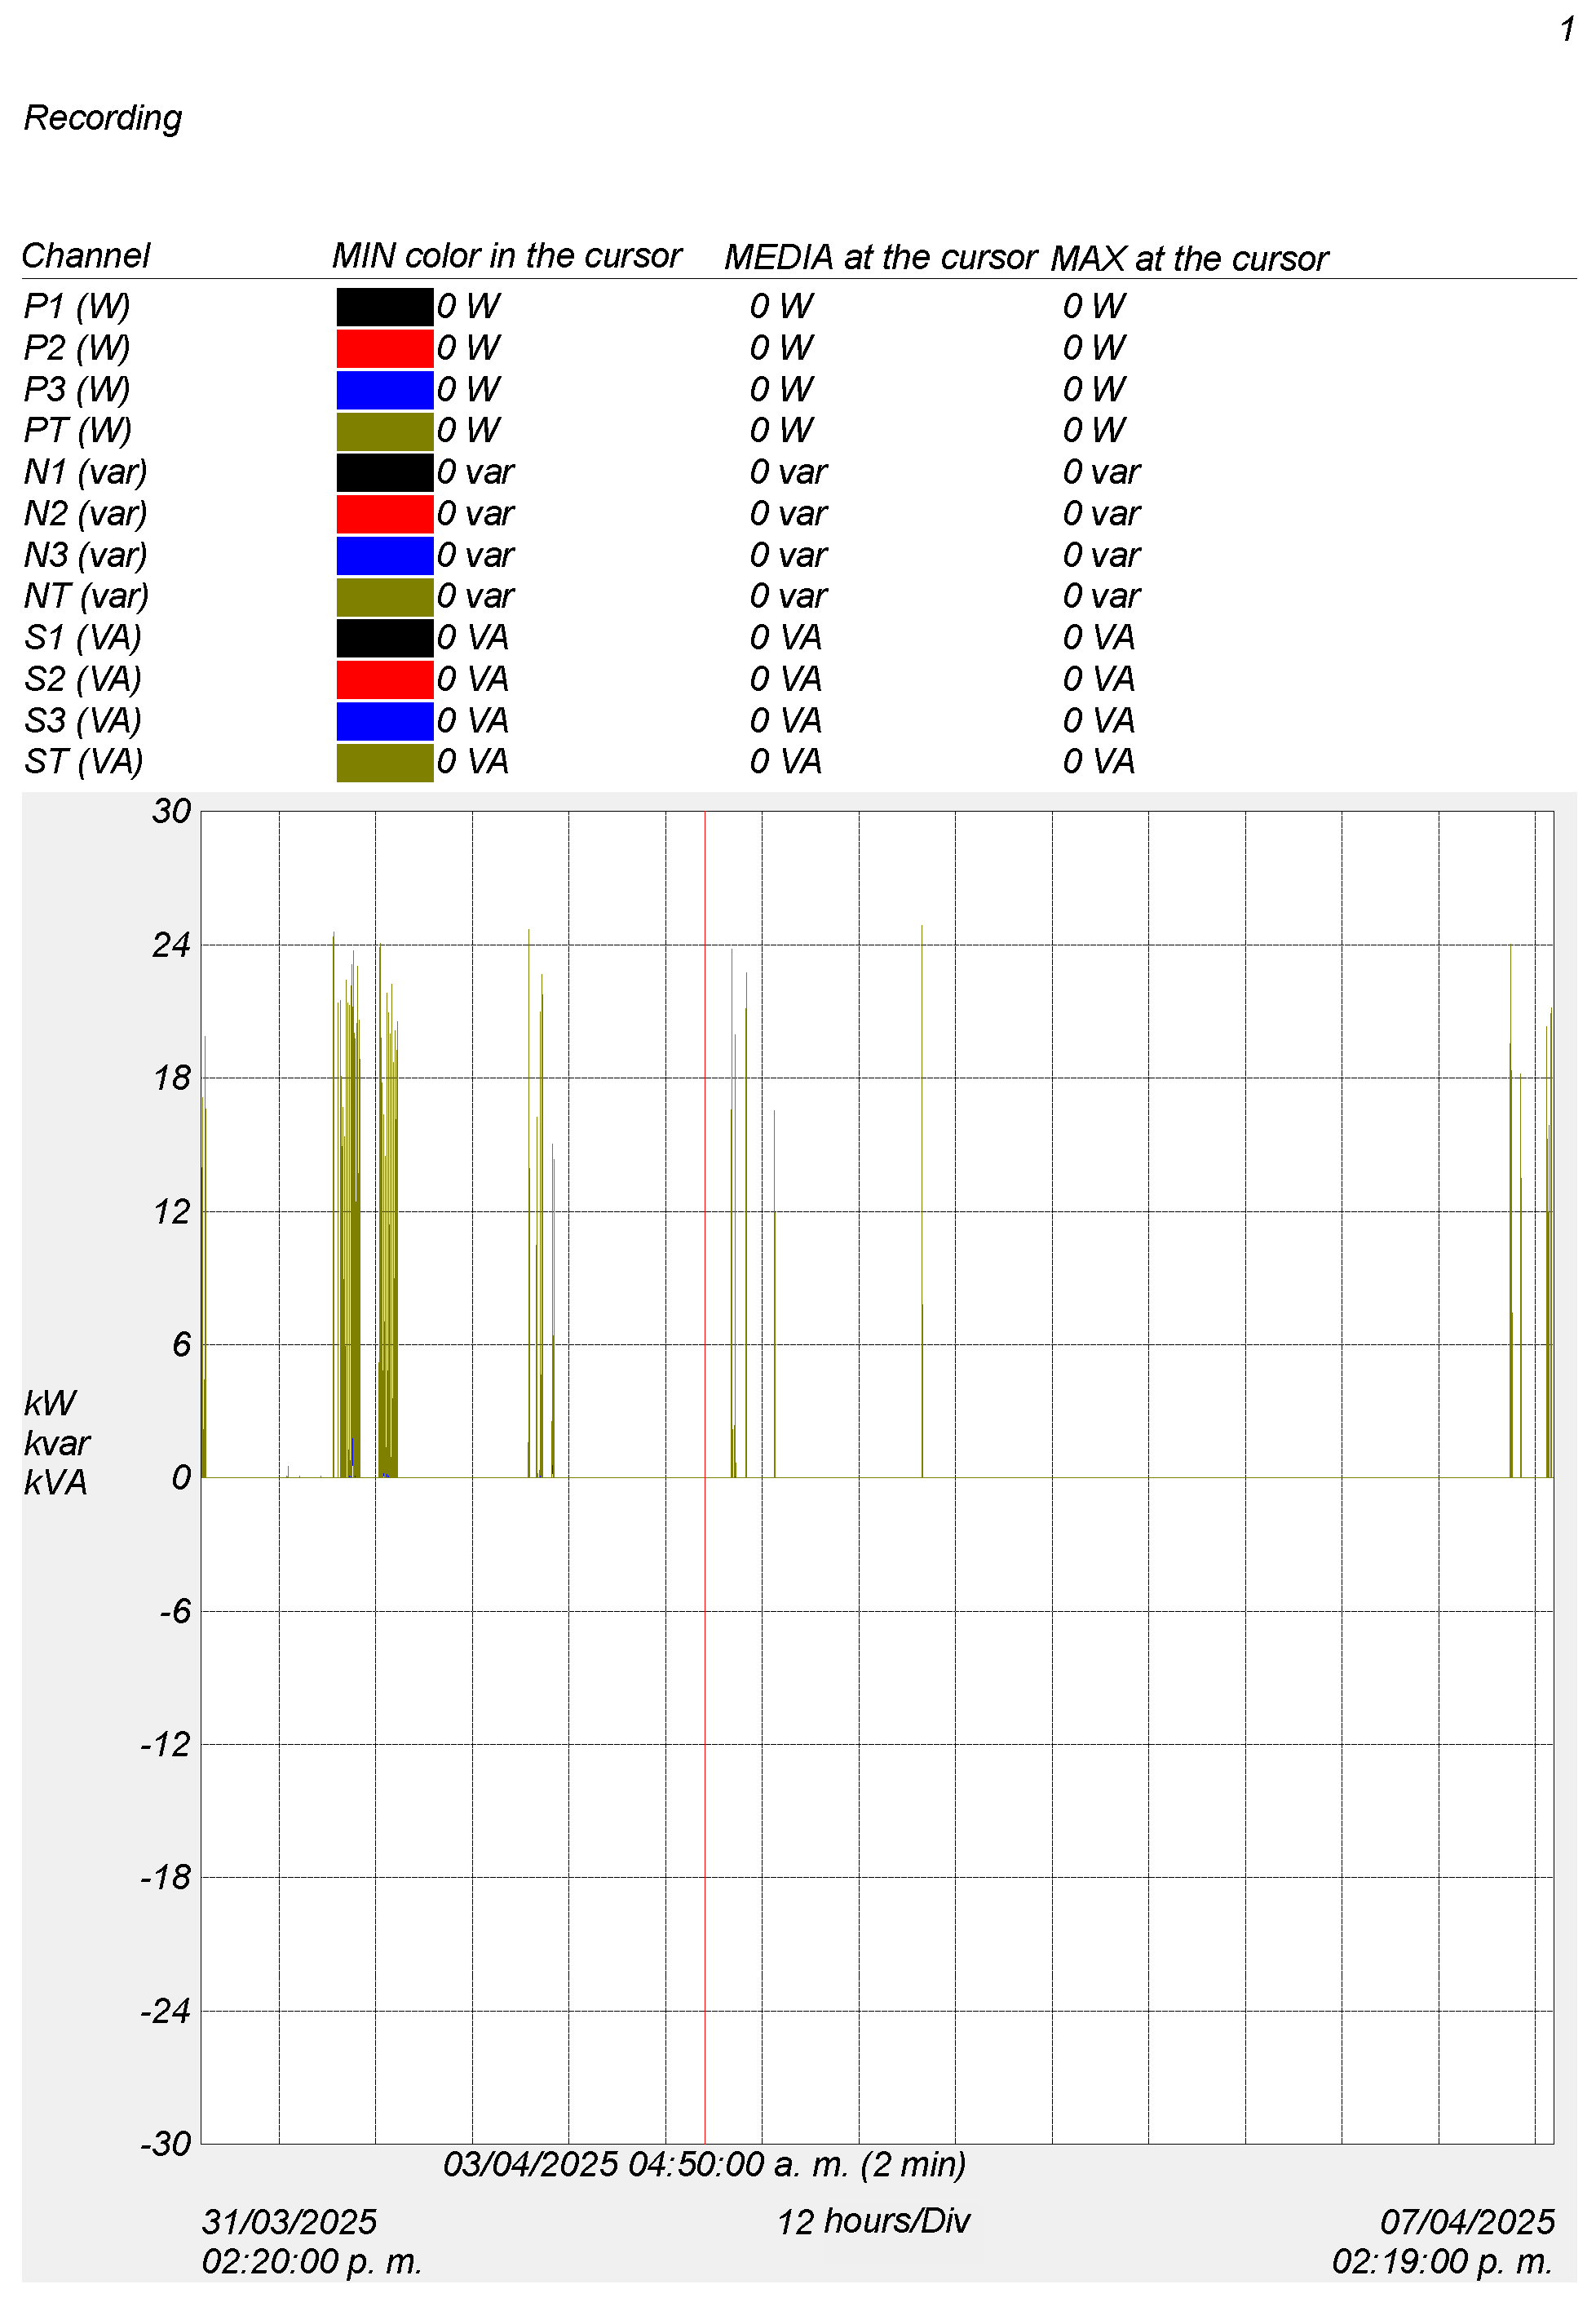
The analysis of the obtained data shows that the power values (P1, P2, P3, PT) and reactive power (N1, N2, N3, NT) remain at zero at the moment indicated by the cursor (red vertical line), suggesting that at that specific moment, the motor was de-energized or not in operation. This behavior is consistent with the absence of active or reactive energy consumption during that interval (
Figure 8).
However, it is important to note that the compressor continues to register work at certain moments over time. This phenomenon can be attributed to specific characteristics of the device or possible residual effects of the system. It is possible that, during certain periods, the motor was operating intermittently or momentarily, which is not reflected in the power readings, yet still shows variations in the recorded work values.
This behavior highlights the importance of considering temporary fluctuations in the motor’s operation, as well as the potential influence of factors such as system configuration or the calibration of the measurement instruments. The absence of power readings in the monitored parameters in this case does not necessarily indicate that the system is not operating; rather, it could reflect low-load or intermittent operation, warranting further investigation to better understand the possible effects of residual operation and ensure the accuracy of the measurements.
3.5. Calculation of Electric Motor Efficiency
Table 6 summarizes the calculated load factor (
) of the electric motor corresponding to the three active power measurements previously obtained with the power analyzer.
Using the efficiency curve previously presented in
Figure 4, it was possible to determine the estimated efficiency of the electric motor corresponding to each load factor value shown in
Table 6. The results are presented in
Table 7.
The motor efficiency values range between 80% and 88%, which is consistent with the expected performance for three-phase induction motors under partial load conditions. Given that the nominal efficiency of the motor is 92.8%, the results suggest that the compressor is not operating in a state of significant underutilization. Therefore, no substantial evidence of performance degradation or oversizing is observed under the current load conditions.
3.6. Improvement Proposal: Installation of a Capacitor Bank
Although no direct values were obtained from the Power Factor Total (PFT) channel, the proximity between active energy (EpT = 20.42 kWh) and reactive energy (EnT = 19.86 kvarh) indicates a significant reactive component. This implies a low power factor, possibly below 0.9, which could lead to financial penalties and increased load on the electrical system.
An effective solution is the installation of a static capacitor bank with automatic control, which would enable:
Compensation of the reactive power drawn by the compressor and other inductive loads.
Raising the overall power factor above 0.95 by local electrical regulations.
Reduction of Joule losses in conductors and transformers.
Lowering the apparent power demand, freeing up capacity in the internal distribution system.
The assessment of the initial state of the electrical system was conducted based on the direct records of the Total Power Factor (PFT) channel. The results showed an active energy of
and a reactive energy of
. The closeness between these two values indicates a significant presence of reactive power. The ratio between these energies makes it possible to estimate the phase angle
, defined as:
Thus, the initial power factor of the system was calculated as:
This value indicates an operation with a considerable level of inductive reactive power, resulting in low power utilization and potential economic penalties from the utility company.
To raise the power factor to acceptable industrial reference values (
and
), the required reactive compensation power (
) to be installed was determined using the following expression [
89]:
where
P corresponds to the active power of the system, associated with the measured energy (
). The tangent of the angle related to the desired power factor is obtained through [
89]:
The calculations yield the following results:
Consequently, the installation of a capacitor bank with an approximate capacity of 13 to 15 kVAr would enable the correction of the power factor to levels between 0.95 and 0.97, thereby reducing the demand for reactive power, improving the overall energy efficiency of the system, and avoiding tariff surcharges. It is important to note that the calculation of the required capacitor bank size is based on a one-week data period, which provides a representative estimate for immediate operating conditions. However, due to potential seasonal and long-term variations in the system’s demand, it is recommended to consider additional analysis with a longer data period to ensure the long-term representativeness of the proposed design.
3.7. Calculation of Compressor Work
The BOGE C 22-2 is an oil-injected rotary screw compressor, in which oil is used for air cooling, lubrication of the rotating screws, and internal sealing of the compression system [
7].
According to [
6], the isentropic compression coefficient
k better represents the pressure–volume behavior in compressors with limited cooling capacity, such as those cooled by oil. Based on this criterion, the work required for air compression was estimated using Equation (
16) as described by Monteagudo [
48].
where
is the specific volume of air at standard conditions [
90], and
for dry air, assuming insufficient cooling during compression, which approximates adiabatic behavior.
As shown in
Table 8, the system reaches a maximum pressure of 10 bar at 110 °C.
All calculations were performed in absolute units (Pascal and Kelvin). The results of the estimated compressor work at two operating pressures are shown in
Table 9.
3.8. Air Consumption in the Factory
Table 10 presents the compressed air consumption rates of all factory equipment under nominal conditions.
In the context of this study, the term
low-load refers to the operating condition in which the compressor supplied air exclusively to two end-use devices: the machining center and the paint spray gun. During the monitoring period, all other pneumatic consumers listed in
Table 10 (e.g., blow nozzles, test benches, hose crimping presses) remained inactive due to reduced plant productivity. As a result, the actual compressed air demand was measured at approximately 0.43 m
3/min, which represents only 13% of the compressor’s rated capacity of 3.21 m
3/min. This explains the prevalence of partial-load conditions and the relatively low efficiency values reported in this study.
Currently, only the machining center and paint spray gun are in operation. To determine their actual air demand, a real-time measurement test was conducted. This involved measuring the time required for the compressor to fill the air tank while isolating the system by closing the supply valves (
Table 11).
Table 12 shows the pressure and temperature conditions at startup and shutdown.
3.9. Air Density and Mass Flow Rate
Based on the values in
Table 12, the air density at startup and shutdown was calculated using the ideal gas equation:
where
R is the specific gas constant for dry air, calculated from:
The parameters required for the density calculation are summarized in
Table 13.
The calculated air densities are shown in
Table 14.
3.10. Compressed Mass and Flow Rate
The mass of air stored in the tank was calculated using:
Given that the tank volume is
[
91], the air mass values are shown in
Table 15.
The compressed mass is thus
kg. The mass flow rate is calculated as:
From these values, the volumetric flow rate was calculated using:
3.11. Flow Comparison
Finally,
Table 18 compares the current production air consumption with the maximum compressor capacity.
3.12. Power Demand in the Compression Stage
The power required in the compression stage was estimated using Equation (
22), as proposed by [
92,
93]:
where:
is the air density (kg/m3),
Q is the volumetric flow rate of compressed air (m3/s),
is the specific compression work (J/kg).
Two power values were calculated based on the volumetric flow rates listed in
Table 18. The results are presented in
Table 19.
3.13. Compressor Efficiency Calculation
The compressor efficiency was determined based on the electrical power measured with the network analyzer (
Table 4) and the power consumed in the compression stage, previously estimated using Equation (
22). The efficiency was obtained using the relationship defined in Equation (
23) [
94,
95]:
where:
In addition, the maximum system efficiency was calculated under nominal operating conditions, that is, using the nameplate power of the motor (22 kW) and the maximum pressure, temperature, and airflow parameters. The obtained results are summarized in
Table 20.
The reported values fall below the optimal efficiency range expected for rotary screw compressors, which typically ranges between 60% and 70% [
6]. However, the analyzed compressor operates predominantly under low-load conditions, with low flow rates and over short time intervals, which explains the observed efficiency range of 27% to 48%.
It is worth noting that in screw compressors with no direct mechanical friction between the rotors, such as the BOGE C 22-2, higher efficiency values could be achieved if the load regime were more stable and closer to the design power [
94,
95].
4. Discussion
The results show that the BOGE C 22-2 compressor reaches a maximum efficiency of 0.89 under nominal operating conditions (22 kW and 10 bar discharge pressure). This value lies within the upper expected range for rotary screw compressors, indicating high energy performance when operating at full load. However, during actual factory operation, the compressor predominantly works under partial load conditions, with efficiencies ranging from 0.27 to 0.48, as measured from power inputs between 3.94 and 6.40 kW.
This gap between nominal and operational efficiency suggests that the equipment is underutilized, resulting in electrical energy consumption that is not proportional to the useful work performed. Such behavior is typical in systems operating in intermittent cycles or under extended partial load, which can reduce the overall energy performance indicators of the industrial process.
In light of these findings, a set of complementary strategies is proposed to enhance the energy and operational efficiency of the compressed air system:
4.1. Implementation of Sequential or Demand-Based Control
Deploying a sequential control system that modulates compressor operation based on line pressure and real time demand would reduce start stop cycles and prevent unnecessary idle operation. This strategy is especially effective in facilities with intermittent or time varying air requirements.
4.2. Integration of Predictive Algorithms Based on Machine Learning
The application of machine learning algorithms trained with historical operational data (pressure, flow rate, power consumption, operating hours) enables the prediction of compressed air demand and optimizes compressor scheduling. This approach allows for smarter activation of the equipment, aligned with actual production patterns.
4.3. Evaluation of Parallel or Variable Speed (VSD) Compressors
Given that the BOGE C 22-2 achieves peak efficiency near full load, it is advisable to consider adding a smaller auxiliary compressor or one with a variable frequency drive. This second compressor would handle partial load demands, reserving the main unit for peak periods. This hybrid strategy would improve the system’s average efficiency.
4.4. Economic Feasibility and Return on Investment (ROI) Analysis
A financial viability study should be conducted to assess savings from reduced reactive energy, improved power factor, lower electrical losses, and prolonged equipment life. This analysis will help justify investments in the proposed solutions and support strategic decisions within an industrial energy management framework.
Based on the experimental results of this study, where the actual compressor efficiency ranged between 27% and 48% under partial load conditions, it is estimated that:
The implementation of a Variable Speed Drive (VSD) could increase the average operational efficiency by 10–20 percentage points, reaching a range of 45–65%, as reported in comparable industrial applications [
96,
97].
The use of predictive demand-control algorithms could reduce idle times by 8–12%, resulting in an estimated annual energy saving of 5–7 MWh in the analyzed case [
98,
99].
The installation of a capacitor bank (13–15 kVAr) would raise the power factor from 0.72 to values between 0.95 and 0.97, which would represent an annual saving of approximately 8–10% in the plant’s electricity bill by avoiding penalties for reactive power consumption [
100,
101].
From an economic perspective, considering an average industrial electricity cost of 0.12 USD/kWh, the combination of these measures would result in annual savings on the order of 1200–1600 USD. The payback period (ROI) would be less than 2 years for the capacitor bank and 3–4 years for the integration of an auxiliary compressor with VSD.
5. Conclusions
This study evaluated the energy performance of the BOGE C 22-2 screw compressor under real industrial conditions. The results revealed a significant gap between the rated peak efficiency (0.89) and the actual operating efficiency (0.27–0.48), mainly due to partial-load operation and low compressed air demand.
Reactive power consumption was also found to be nearly equal to active power, resulting in a low power factor (0.72) and highlighting the need for compensation measures.
Based on these findings, three main recommendations are proposed:
Implement sequential or demand-based control to minimize idle operation.
Integrate a secondary or variable speed drive (VSD) compressor to improve efficiency under low demand.
Install an automatic capacitor bank to raise the power factor above 0.95 and reduce electrical losses.
Altogether, these measures would enhance system efficiency, reduce operating costs, and contribute to the plant’s long-term sustainability.
