1. Introduction
Alzheimer’s disease (AD) is a neurodegenerative disorder characterized by a progressive decline in memory and other cognitive functions, leading inevitably to death. It is an incurable disease affecting more than 50 million people, with figures set to increase significantly in the coming years (World Alzheimer Report 2023). The etiology of the disease is unclear to date, but two proteins are universally recognized as playing a crucial role in the development of the disease: amyloid-beta
and tau
. Both proteins are physiologically present in the brain but, in the presence of the disease, they form abnormal aggregates, in a progressive and irreversible way. Indeed,
plaques and neurofibrillary tangles (NFTs) of
are pathological hallmarks of AD. Experimental studies suggest non-uniform distributions of pathological proteins in the brain [
1]. Both
and
exhibit characteristic spatiotemporal deposition patterns. NFTs appear first in the entorhinal cortex and then spread to the amygdala, temporal areas, and, finally, throughout the cortex [
2]. On the other hand,
plaques form first in the temporal and frontal areas and then spread to other areas of the brain [
2,
3]. Recent literature suggests that the interplay between the two proteins should be crucial in the development of the disease and must be taken into account for the development of new therapies [
4,
5,
6]. Clearly, when one is interested in modeling complex pathologies such as AD, comparison with clinical and experimental data is crucial to the reliability of the study. Clinical multimodal neuroimages, if properly processed in terms of harmonization, combination, and a quantitative approach, can give information of local character, providing, for instance, the concentration of proteins in different brain regions [
7].
This work has two main objectives. One is to capture such types of non-uniform distributions through appropriate mathematical models. The other purpose is to compare the results from the mathematical models with clinical data in the context of Alzheimer’s disease. Comparison with clinical data is a fundamental step in the development of a trustable mathematical model but it is rarely addressed in the mathematical modeling literature. To this aim, we have processed a considerable amount of clinical neuroimages to extract quantitative features, which can be compared with the concentration values provided by the mathematical models.
Networks are mathematical tools that provide an ideal setting for comparisons between clinical data and numerical results from models. Complex network properties have been identified with some consistency in all modalities of neuroimaging data and over a range of spatial and time scales. Thus, brain networks allow to describe the information process in neurons and its characteristics of being both locally specialized or segregated and globally distributed or integrated [
8]. In particular, small-worldness characterizes an intermediate regime of networks between the two extreme regimes of a regular lattice and a random network, efficiently representing the brain structure [
9]. The mathematical modeling of AD can be very useful for integrating clinical and experimental data in a theoretical setting, which could allow, once reliability has been verified, to test various hypotheses otherwise difficult to verify. For an exhaustive overview of existing mathematical models of proteins spreading on networks and of various related challenging questions, we refer to [
10]. Here, we wish to emphasize that the dynamics of the two proteins we are interested in differ in several respects, both spatial (
spreads over small distances,
over large distances) and temporal (the dynamics of
are much faster than those of
). Differences in spatial dynamics should, in some way, be reflected by the choice of network used for the evolution of the dynamics. This paper is inspired by the paper [
11] as far as the idea of using distinct networks for different protein dynamics is concerned; however, its purpose is quite different. Indeed, in [
11], the authors were mainly interested in investigating the synergistic interactions of the two proteins
and
, whose relevance was confirmed there by testing various modeling hypotheses. However, the authors were not interested in any comparison with medical data. Here, we strongly rely on the comparison with medical data to test different modeling hypotheses concerning the diffusion of
on properly chosen networks, to see if there is an optimal way to deal with the spreading of proteins when it comes to modeling AD. Therefore, the main target of this paper is twofold: 1. to consider different models for the spreading of
and, especially, of
, developed on networks with a precise biomedical meaning; 2. to have medical data for a comparison as meaningful as possible with the models, and to use that comparison to test the trustability of the model.
The plan of the work is the following: in
Section 2, we describe the networks we use for our models. We start from publicly available data and, from that, we construct several different weighted graphs on which we evolve proteins. In
Section 3, we describe the models we study; in particular, we present four different models for various possible mechanisms of the spreading of
.
Section 4 is concerned with the procedures we have adopted to obtain reliable medical data. We emphasize that we used a multimodal approach, based on MRI and PET, to determine the concentrations of
protein in the brain. Finally, in
Section 5, we present the results obtained by numerical simulations and we make comparisons with medical data.
2. Brain Networks via Weighted Graphs
The central concept of a brain network constructed to segregate and integrate information processing comes from the advent of the “disconnection syndromes” hypothesis [
12], mainly on the basis of clinico-pathological correlations. The conceptualization of the relationship between the structure and function of the brain has led to understand that brain regions participate in many functions, introducing the structure–function framework described by a network of brain regions. Mesulam and colleagues [
13] introduced the network approach to understand the localization of complex functions. The connection matrix of the human brain, known as the human “connectome”, today represents an indispensable tool for mapping brain structure to functional processes and has a valuable impact on understanding brain diseases.
To model the spreading of different proteins in the brain, we consider several connectomes, each corresponding to a different undirected weighted graph. Data used for the construction of these connectomes have been downloaded from the website
https://braingraph.org (accessed on 24 November 2024) and consist of an
averaged graph of 477 healthy subjects, each with 1015 nodes (the weight calculation mode was set as median and the number of fibers launched was set to 20) [
14,
15]. We stress that the vertices of such a graph do not have associated coordinates that determine their position in space, since it is precisely an averaged graph. This will have consequences when we talk about “distances”, which must be understood in an intrinsic sense and not in the classical Euclidean metric sense.
In the following, we first recall the definition of a weighted graph and how to construct an associated Laplacian, mimicking diffusion on it. Then, we describe the weighted graphs we will use to model the spreading of
and
proteins. A
graph is a pair
, where
V is a set of vertices and
is a set of the edges;
is said to be undirected if
implies that
. The graph
is called weighted if a measure
exists, assigning a unique positive number to each edge; the value
is referred to as the weight of the edge
. A weighted graph can be represented through the adjacency matrix
A whose entries
represent the weights of the edge
. Let
be the number of vertices in
; then,
is defined as
There are several possible definitions for the Laplacian associated with a given graph. Given the adjacency matrix
of
, following [
16], we define the graph Laplacian
L as
where
D is the weighted degree matrix whose
jth diagonal element
is given by
2.1. Structural Connectome
We call
structural connectome a weighted graph
extracted from the tractography of diffusion tensor images of 477 healthy subjects of the Human Connectome Project [
17] using the Budapest Reference Connectome v3.0 [
15]. In this graph, vertices correspond to parcellated regions of gray matter formed by neurons, which share similarities in cytoarchitecture, functional activity, and structural connections to other regions, and edges represent the connectivity between the regions. We used a high-resolution connectome with
, which can be downloaded at the website
https://pitgroup.org/connectome/ (accessed on 24 November 2024). It is possible to choose, for the edges of this graph, different weights, based on the mean number of fibers connecting two regions, and on their mean length. Accordingly, we denote by
the graph with weights given by
where
is the mean number of fibers connecting vertices
i and
j, and
is the mean length of such fibers. Analogously, we denote by
the graph with weights given by
Therefore, the two weighted graphs and have the same vertices and edges, but different weights.
2.2. Intrinsic Proximity Connectome
Let
be a given positive value; the
intrinsic proximity connectome is the weighted graph
whose set of vertices
V is the same as
’s and whose set of edges
is the subset of edges of
connected by a fiber with length
ℓ less than
. The weights are given by
where
is a fixed parameter. In this way, we connect two vertices only if they are close in an intrinsic sense, as opposed to a “geometric” vicinity measured with some kind of Euclidean distance. Indeed, as already mentioned, the vertices of the graph do not have associated spatial coordinates. The weights we assign are stronger for intrinsically close vertices. For this reason,
is referred to as
intrinsic proximity connectome. It is appropriate to emphasize here that this proximity connectome is quite different from the one used in [
11]. Indeed, here, we use only
intrisic connections, without adding any new connection, and we give them a weight proportional to the intrinsic distance.
2.3. Cumulative Connectome
The
cumulative connectome is a weighted graph
with the same
V and
E as
, but with weights defined as follows. Let
be the set of all paths in the graph
starting at vertex
i and ending at vertex
j, i.e.,
where
and each path
consists of a sequence of edges:
We recall that the graphs
and
differ only in the weights assigned to the edges; thus, we can define the length of the path
, considering it as a part of the graph
or the graph
. Since the length of a path is usually defined as the sum of the weights of the edges forming the path, in
, we obtain the length
defined as
and, in
we obtain the length
given by
Finally, let
be the subset of
such that
where
is a fixed parameter. Two vertices
i and
j are connected in the cumulative connectome
if there is at least one path of length in
less or equal to
joining them (we call such a path an admissible path). In the affirmative case, the weight of the edge connecting vertices
i and
j is given by the sum of the lengths in
of all admissible paths (hence the name cumulative connectome):
Summarizing, in the cumulative connectome, two vertices i and j are connected if there is at least one path starting at i and ending at j whose length is smaller than a fixed value . Vertices that are not connected in are connected in if there is an admissible path in joining them. In this way, we encode in connections between brain regions over long distances. In other words, we connect two vertices if the corresponding brain regions are joined by axonal paths with a length determined by a parameter that we choose. The weights of the connections depend on the number and length of the axonal fibers in the connections.
3. The Models
By choosing appropriate graphs among the ones introduced in the previous section, we set up different models to describe the dynamics of and proteins. The choice of the graphs is guided by the main biological features characterizing the two proteins and their dynamics.
Concerning
, it is well known that monomeric
peptides originate physiologically from the cleavage of the transmembrane protein APP (amyloid precursor protein), and are considered non toxic [
18]. Then, for a reason not yet clarified, an imbalance between the production and clearance of the protein can occur, giving rise to a process of agglomerations. This leads to the formation of toxic amyloid fibrils [
19,
20], often referred to as oligomers. These oligomers eventually accumulate in insoluble agglomerates known as senile plaques, nowadays considered non toxic [
19]. To describe this process, we adopted a so-called compartmental model, that is, we considered
proteins assuming only three types of conformations: monomers, oligomers (which include all soluble conformations that are not monomers), and plaques (insoluble conformations). Moreover, we wanted to take into account that the
protein diffuses on short distances and its dynamics (production, aggregation, and clearance) are fast [
21]. The molar concentration of a protein on the vertices
V of a graph are denoted by an
N-dimensional vector, where
is the number of vertices of the graph. Accordingly, the vector-valued functions
describe the molar concentration of
monomers (
), oligomers (
), and plaques (
). We stress that with oligomers we mean aggregates made by two units while with plaques we mean aggregates made by three or more units.
We model
dynamics with the following equations [
11]:
where
denotes the element-wise product between vectors. System (5) is endowed with initial conditions at
as follows (at the initial time, the brain is healthy; therefore, only
monomers are present):
where
and
denote the
N-dimensional vectors whose components are all equal to zero and one, respectively. Since
t denotes a slow time variable, the
in front of the equations takes into account the fact that the processes described are fast [
21]. The first term in Equations (5a) and (5b) models the diffusion of
monomers and oligomers along the network. Since this protein spreads along short distances, we choose the intrinsic proximity connectome to model the network. Indeed, on the intrinsic proximity connectome
, two vertices
i and
j are connected only if the mean length of the axonal fibers connecting the corresponding regions of the brain is sufficiently short; in addition, the shorter the fiber length, the greater the weight of the corresponding edge. Accordingly, here, diffusion is driven by the graph Laplacian
. In the first equation, the term
represents a source term (gain) due to the physiological production of
monomers, the term
is a loss due to the aggregation of monomers with other
proteins and the term
is a loss due to clearance phenomena. In the second equation, the term
is a gain in oligomers due to the aggregation of two monomers, while the next two terms are losses analogous to those in the first equation. Finally, in the third equation, the diffusion term is absent since plaques are insoluble (they are too heavy to diffuse); there is a gain term due to aggregation (for a detailed explanation of this term and, in general, on the use of Smoluchowki’s equations in this context, see [
6]) and a loss term due to clearance. We stress that, in the equations governing the dynamics of
proteins, there is no coupling with the
protein. Indeed, such a coupling will be present in the equation governing the dynamics of
.
The protein
is a physiological microtubule-associated protein: its main function is to stabilize microtubules and to regulate axonal transport. In brains affected by AD, misfolded
has been found in the form of aggregates called neurofibrillary tangles, which, together with
plaques, are a hallmark of AD [
22]. Misfolded
is toxic for the neuron; indeed, it compromises stabilization, transport, and, in general, interferes with neuronal functions. As already mentioned in the Introduction, in recent years, there has been a consensus in the scientific community to consider a synergistic effect of
and
when it comes to AD [
4,
23,
24]. More precisely, the “trigger and bullet” hypothesis identifies in toxic
peptides the trigger for
misfolding: the bullet is the misfolded
, which, in turn, causes neural damage until, eventually, the neuron’s death [
25,
26,
27]. Concerning the spreading mechanism of misfolded
, it has been proposed that neuronal damage spreads in the neuronal net through a neuron-to-neuron prion-like propagation mechanism [
28,
29,
30,
31]. Based on the considerations presented so far, the dynamics of misfolded
, whose concentration is given by the vector-valued function
, are governed by the following equation [
11]:
endowed with the initial condition (at the initial time, the brain is healthy; therefore, there is no misfolded
):
Here, we see the coupling between
and
. Indeed, the second term
in the equation rules the interaction of the two proteins: if
, the toxic form of
, is above a given threshold, then it triggers the misfolding of
. The term
represents a source of misfolded
, typically located in the enthorinal region of the brain [
2], while the last term is the loss due to clearance.
The main purpose of this work is to investigate different possible forms for the operator
K, appearing as the first term in (7), modeling the spreading of
. As already mentioned, the spreading of such a protein can take place over long distances [
32], possibly following a prion-like type of process [
30], on a slow time scale. Several models have appeared in the literature concerning various possible mechanisms of
spreading on networks [
11,
33,
34,
35,
36,
37,
38,
39,
40]. Here, we considered four different possibilities (corresponding to four different mathematical models) for the operator
K, and we made a comparison between the results obtained for each model and clinical data. In this way, we tried to determine if there is one form for
K better describing the dynamics we were interested in reproducing. The full system of equations we studied is, therefore, given by
3.1. Model 1: Diffusion of Along the Structural Connectome
Following previous works in the literature [
6,
11,
33,
38], a quite standard choice to model the spreading of
protein along edges of a connectome consists of choosing the Laplacian
associated with the structural connectome
. In this way, spreading corresponds to diffusion and we have
3.2. Model 2: Diffusion of Along the Cumulative Connectome
In the cumulative connectome, two vertices are connected if there exists at least one admissible path between them. Such a path can be formed by several consecutive edges, each with its own weight contributing to the final weight. The corresponding Laplacian
therefore encodes the structure of the brain with connections spanning long distances. For this reason, we choose
We stress again that all distances mentioned in the paper are to be understood not in a geometric but in an intrinsic sense, i.e., referring to fiber lengths, that is, edges, in the graph.
3.3. Model 3: Spreading of via Convolution on
A common way of dealing with dynamics occurring over long distances is to make use of integral operators, typically convolutions with an appropriate kernel taking into account distances. With a notation similar to (
4), let
be the subset of
containing all the paths in
from node
i to node
j with a length less than
:
where
is a fixed parameter. We define the signal
on each node
i of the graph
as follows:
Intuitively,
accounts for all the paths between
i and each vertex
j in
that is not too far from
i and plays the role of the convolution kernel. The convolution product on
between
and
is defined by using the graph Laplacian eigenvectors [
41]. Let
be a complete set of orthonormal eigenvectors of the Laplacian
of
with eigenvalues
ordered in nondecreasing order and let
be the matrix whose columns correspond to the eigenvectors
,
. The graph Fourier transform
of the signal
on
is defined as the expansion of
in terms of the eigenvectors of
, i.e.,
where * denotes the conjugate transpose of a matrix. The inverse graph Fourier transform is given by
The convolution product on
between
and
is the vector
such that
where
is the graph Fourier transform of
defined as in (14). We choose
as the convolution product of
with
:
3.4. Model 4: Spreading of via Convolution on
In [
36,
37], the authors introduce a graph convolution operator as a nonlocal model for the conversion from a healthy protein to a toxic one. Inspired by these works, we use their nonlocal operator to model the prion-like spreading of misfolded
proteins. Let
be the matrix whose elements
,
, are the length of the shortest path from vertex
i to vertex
j in the graph
. If two vertices are not connected,
. Moreover, let
be the matrix with elements
where
is a positive parameter. Finally, let
be the matrix defined as
Then, the operator
is chosen as
6. Discussion
In this study, we had two main objectives. We were interested in (1) comparing different modeling possibilities concerning the spreading of
protein in a brain with AD, when the
protein is also present and the synergy between the two was considered; (2) producing clinical data that can be compared with the outputs of the models in order to verify their reliability. We believe that the lack of comparison between the results of a theoretical model and clinical data could be considered a deficiency that should be rectified in order to support the usefulness of mathematical models in AD [
49]. To this end, we evolved the two proteins on appropriate networks, created from the medical data of human connectomes. The need for different connectomes was dictated by both the physiology of the brain and the biological characteristics of the proteins themselves. We therefore considered, for the evolution of
, which travels only on short distances, an intrinsic proximity connectome, and a standard diffusion Laplacian on it. With regard to
spreading, which is supposed to possibly travel with a prion-like mechanism and over long distances, we considered four distinct mathematical models on as many networks: a diffusion via Laplacian on a structural connectome and on a cumulative connectome, and a spreading via convolution on two further different connectomes. We emphasize that the so-called intrinsic proximity connectome and the cumulative connectome were introduced in this work for the first time. We identified from public multimodal data, with a careful statistical analysis, six regions relevant when it comes to AD and we evaluated
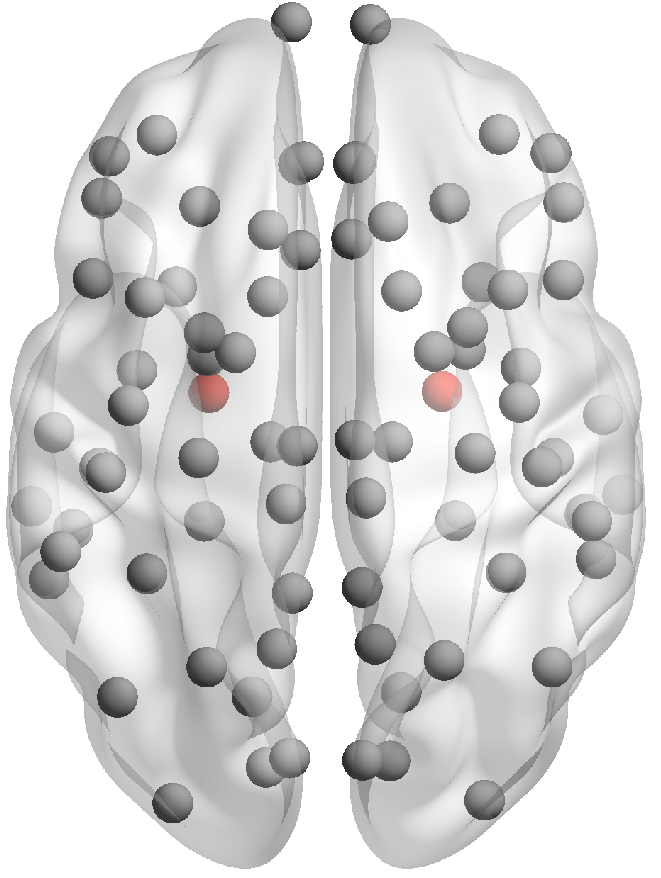
concentrations in them, obtaining a degradation pattern that was crucial for us to verify the goodness of the models.
By comparing the results of the simulations with clinical data, we saw that only the model using the cumulative connectome was able to correctly reproduce the clinical degradation pattern, which also includes a network that is not damaged by the disease. We hypothesize that this result is due to the fact that the cumulative connectome encodes information on brain regions connected along long distances. On the basis of these findings, we feel that we can say that the models are not all equivalent, and that the comparison with clinical data is a crucial element to be able to assess their reliability. Of course, the results obtained here relate to the specific case of AD, and it is plausible that, for other diseases, the same models give different performances. As a next step, we are going to apply the same paradigm of analysis, i.e., a close comparison with appropriate clinical data, to the models enriched by taking into account atrophy, to be more realistic and see if something relevant happens. We believe that a highly interdisciplinary study, such as the one reported in the paper, could be a very promising direction in which cutting-edge biomedical mathematical research could be heading.


 ,
, 
