1. Introduction
Proteins or polypeptides are macromolecules built from amino acids (aa) and are mainly responsible for living beings’ functionality. Proteins are essentials elements because every protein has a specific function related to its unique three-dimensional structure named Native Structure (NS). All the proteins consist of a polymer chain of aa; the junctions with a small number of them are named peptides. The peptides have significant importance in the science community because of their multiple applications, for instance, in pharmaceutical research [
1,
2,
3,
4], drug design [
5,
6,
7], diagnosis [
8,
9,
10], and therapy [
11,
12]. To obtain the NS of proteins from an amino acid sequence could bring benefits to human beings.
The PFP has been identified as an important problem since Kendrew and Perutz’s research teams obtained the myoglobin and hemoglobin molecules’ tertiary structure, respectively [
13,
14]. These studies established the relation between function and structure. PFP consists of obtaining the three-dimensional structure of a protein with the lowest Gibbs free energy, thermodynamically stable three-dimensional conformation [
15].
The PFP is considered an NP-hard problem [
16]. Thus, presumably, none of the known exact algorithms can solve it in polynomial time. In other words, the execution time grows exponentially when using them. In contrast, any protein passes from the aa sequence to its NS three-dimensional structure very rapidly in nature. The latter issue is known as the Levinthal Paradox [
17].
Several algorithms have been applied to solve the PFP successfully, and one of the most effective algorithms has been the Simulated Annealing algorithm (SA). The SA is commonly hybridized with other methods; the combination algorithms are called Hybrid Simulated Annealing algorithms (HSA). These algorithms successfully applied to peptides are the following:
- (a)
The classical Monte Carlo Method, or SA, was applied to the PFP [
18,
19]. Additionally, an analytical tuning method to SA was proposed [
20].
- (b)
Golden Ratio Simulated Annealing (GRSA) family: Original GRSA proposing a cooling strategy [
21], Evolutionary Golden Ratio SA (EGRSA) using genetic operators [
22], and GRSA2, which is hybridization with the GRSA and Chemical Reaction Optimization algorithm (CRO) [
23].
- (c)
Metropolis and multiobjective optimization methods were applied in the previous CASP competitions. The approaches that traditionally have obtained the best results were Rossetta [
24], QUARK [
25], and I-TASSER [
26]. However, deep learning applied by the Alphafold algorithm [
27] achieved the best score in the CASP13 and CASP14.
- (d)
PEP-FOLD3 algorithm, which uses secondary structure information and a Monte Carlo method, and is very successful for small peptides (5 to 50 aa) [
28].
The HSA algorithms previously mentioned obtained excellent results for small proteins or peptides. However, when the number of aa increases, the variables (torsional angle of aa) are also increased, the computational time for exploring the solution space is considerable. As a result, the PFP area needs new approaches to obtaining better solutions for large peptides or proteins.
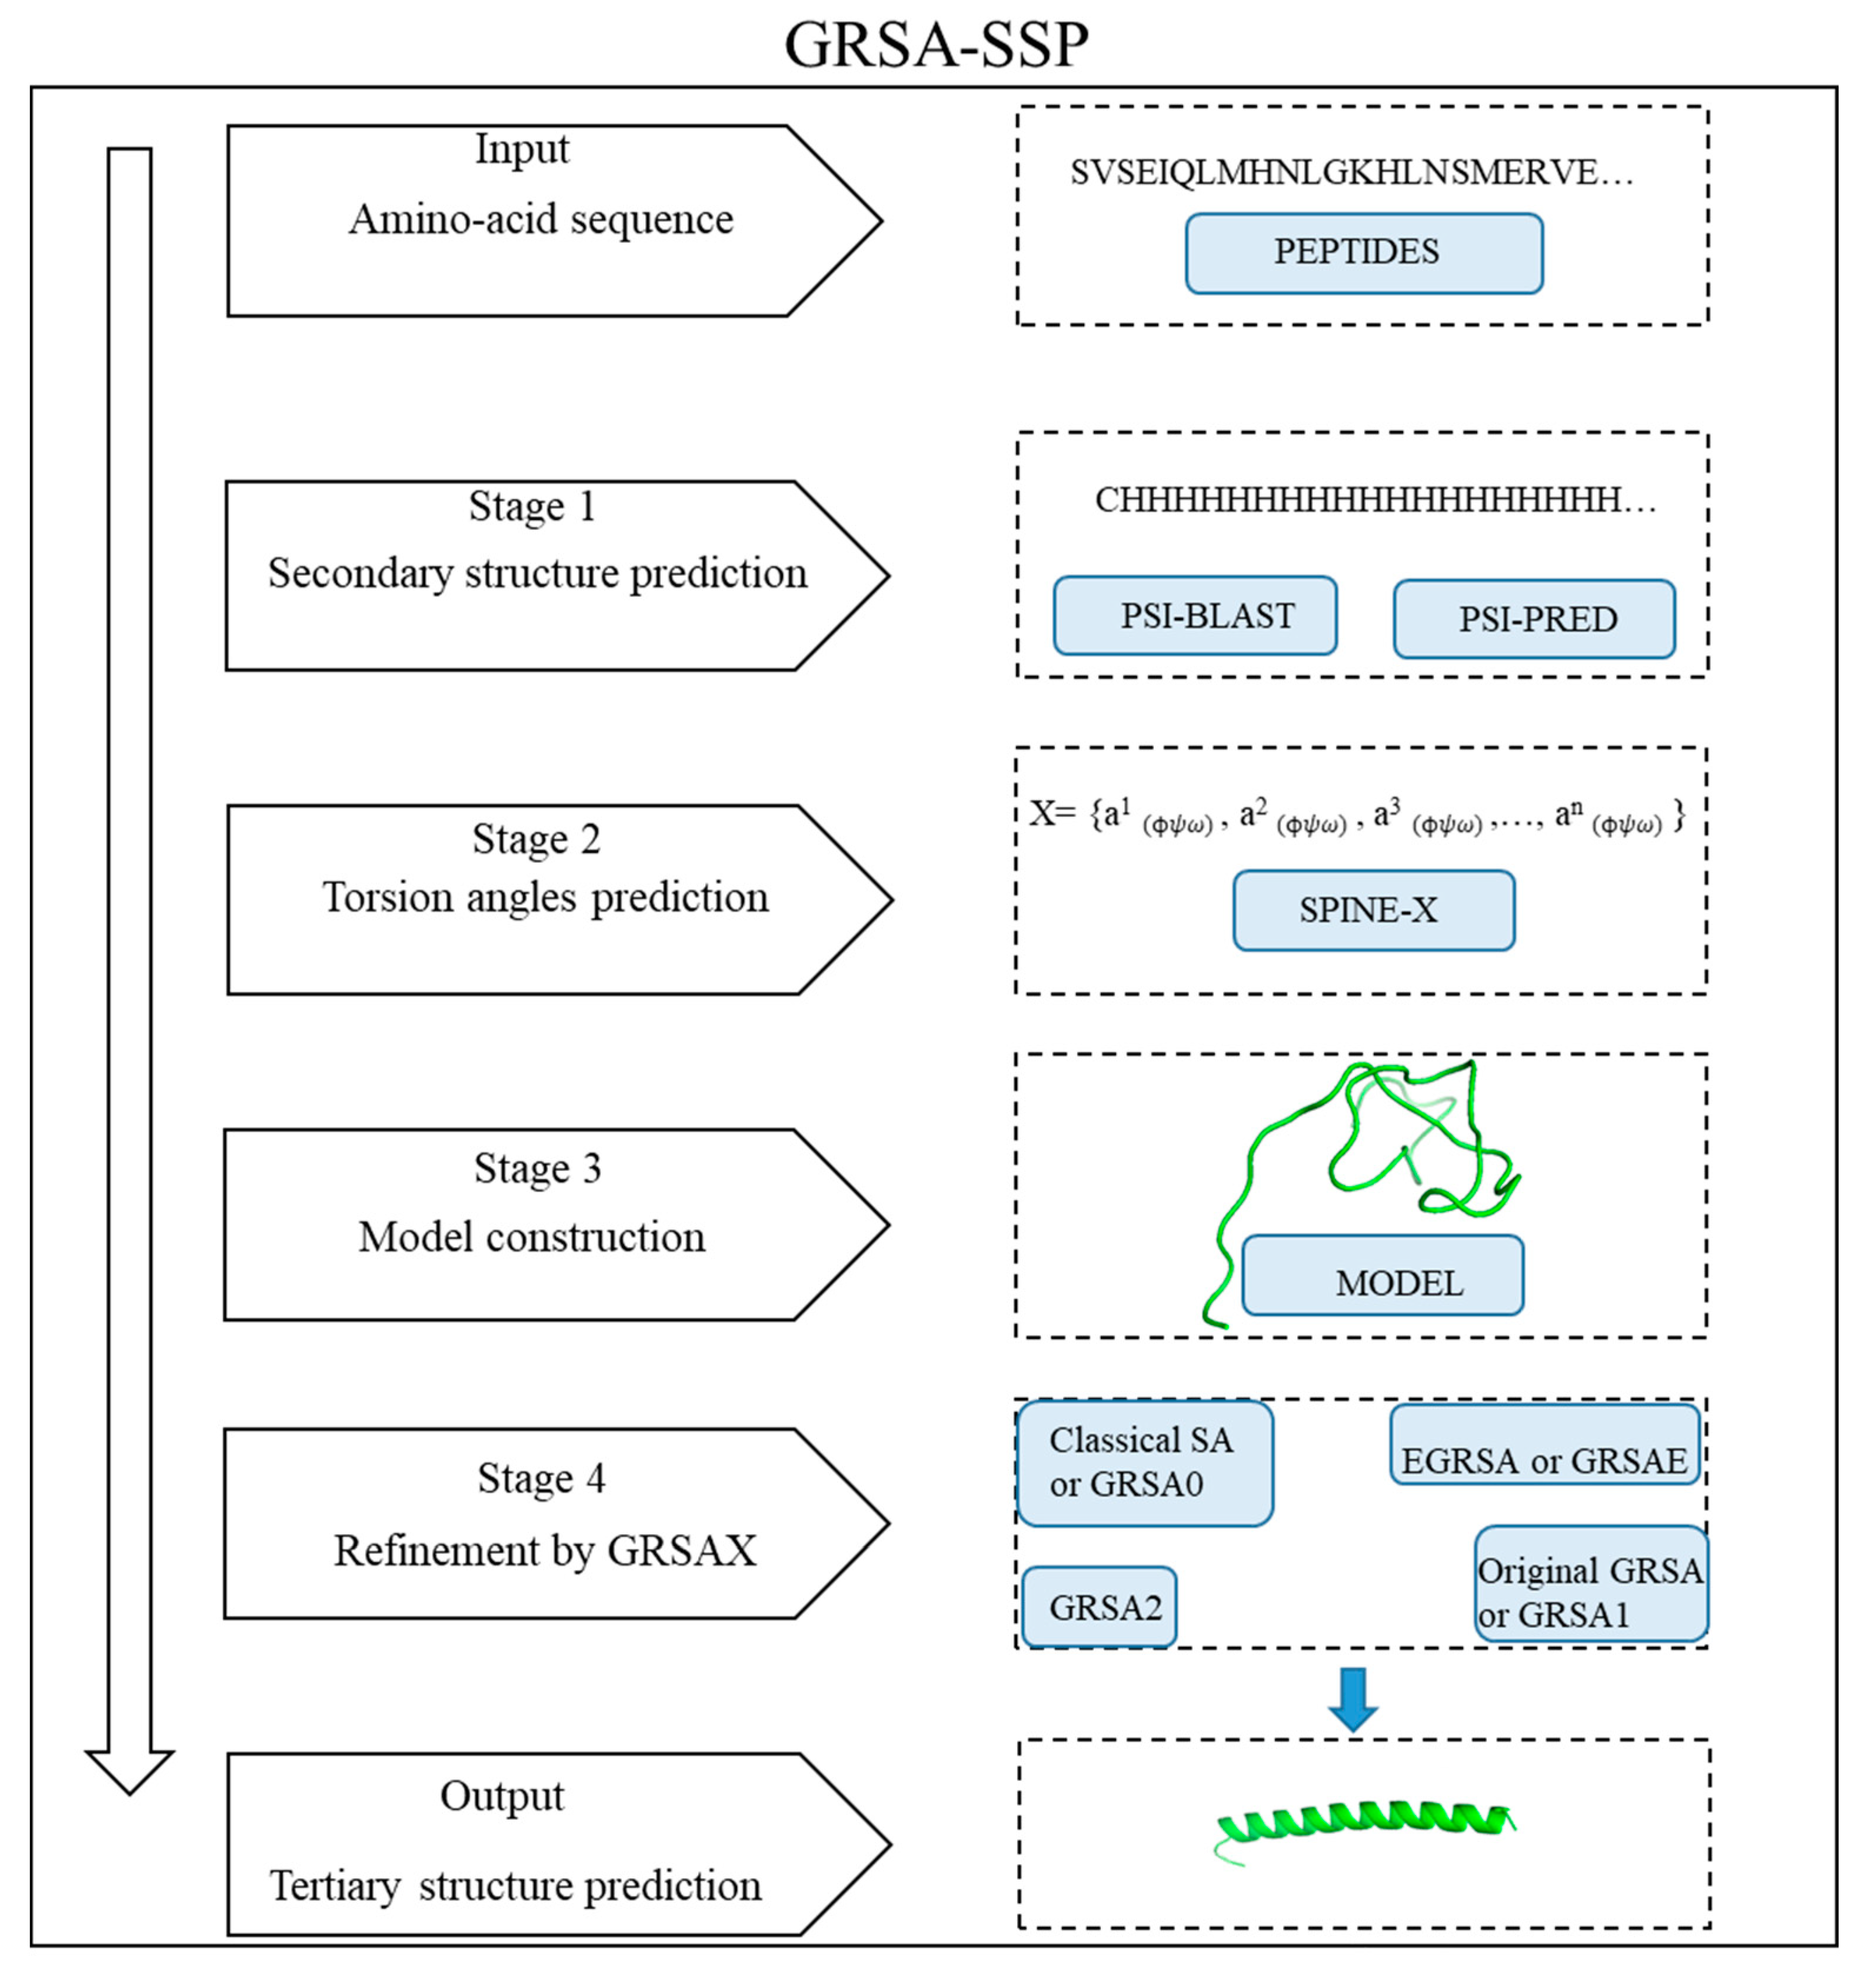
This paper proposes the methodology GRSA-SSP that combines GRSA algorithms with the Secondary Structure Prediction (SSP). For a given chain of aa representing a peptide or a protein, the GRSA-SSP performs two processes:
- (a)
To obtain the first protein prediction from the secondary structure of the amino-acids sequence.
- (b)
To refine the previous protein prediction by using GRSA family algorithms.
These two processes are performed in several steps described in this paper. The algorithms used in the second phase of GRSA-SSP can be one of the GRSA family algorithms. This paper named these hybrid algorithms GRSAX-SSP, where X is used to distinguish the GRSA algorithm. We evaluate our methodology using RMSD and TM-score metrics [
29]. Additionally, experimentation is performed with a set of forty-five instances of peptides and a set of six mini proteins, which are compared with the most popular algorithms in the literature, such as PEP-FOLD3 [
28], I-TASSER [
30,
31], Rosetta [
24,
32], and QUARK [
25,
33].
The paper’s organization is as follows: first, we present the introduction to PFP and HSA algorithms. Then, in the Background section, we review the Protein Folding Problem definition and some relevant research in the literature, and we explain the GRSA family of algorithms. In the next section, we describe the GRSA-SSP methodology. In the Results section, we present experimentation comparing the GRSA algorithms with those of the literature; also, we analyze the presented methodology’s performance. Finally, the conclusions of this research are presented.
4. Results
We performed the next GRSAX-SSP algorithms with the proposed methodology: (a) GRSA0-SSP using classical SA [
19], (b) GRSA1-SSP using original GRSA [
21], (c) GRSAE-SSP using EGRSA [
22], and (d) GRSA2-SSP using GRSA2 [
23]. For all of them, we used the methodology presented in
Figure 1. The peptides in this experimentation have 9 to 49 amino acids. The number of variables (torsion angles) for each peptide in this data set is in the range [49, 304]. We chose this set because these instances (peptides) were used before in the literature. This set was also useful for comparing the GRSA2-SSP algorithm with the top-performing approaches of the CASP, which can be used for small peptides. We compared the last algorithm with I-TASSER, PEP-FOLD3, QUARK, and Rosetta, which are among the best algorithms in the CASP competition. We noted a difference between the GRSAX-SSP algorithms and the one that only applies ab initio by naming it GRSAX.
Table 1 presents the set of 45 instances sorted by the number of variables taken from [
23,
28,
68,
69] and a PDB code represents each peptide.
In the experimentation, the GRSAX-SSP algorithms were executed 30 times to validate the results. The energy function ECEPP/2 is determined with SMMP framework [
38]; it is the objective function of our optimization algorithms. An analytical tuning [
20] was performed to obtain the initial and final temperature for each instance. In GRSA0-SSP the α value is 0.95, and the temperature range has zero golden sections. For GRSA1-SSP, GRSAE-SSP, and GRSA2-SSP algorithms, the same cooling scheme was used, using the α parameter with values from 0.75 to 0.95 with five golden ratio sections, which was determined by experimentation [
21,
22,
23]. The GRSAX-SSP algorithms were executed in one of the terminals of the Ehecatl cluster in TecNM/IT Ciudad Madero, and it has the following characteristics: Intel
® Xeon
® processor at 2.30 GHz, Memory: 64 GB (4 × 16 GB) ddr4-2133, Linux CentOS operating system, and Fortran language.
We used the minimum energy quality values, the RMSD, and TM-score to evaluate the results, which are two metrics of the structural quality used for PFP algorithms. The RMSD is a structural measure between the native structure and the one predicted by the GRSAX-SSP and classical SA named here as GRSA0:
- (a)
If the RMSD has a value close to zero, the quality of the structure is considered excellent. On the contrary, the quality is worse.
- (b)
The TM-score is also used to measure the similarity between two structures. When the TM-score is greater than 0.5, it indicates that there is a good similarity between the two structures, and the tested one has the same fold. Otherwise, as the TM-score is lower than 0.5, the target peptide has a different fold [
29].
The TM-score metrics can be calculated using the TM-align [
70] (an algorithm to obtain the best structural alignment between two proteins) or in a classical formulation [
29]. In this paper, we use the classical formulation of TM-score.
GRSAX-SSP algorithms use a model determined by the secondary structure, and then it is refined for obtaining a better prediction. The results are compared with the GRSAX based on ab initio that only uses the amino acid sequence as information.
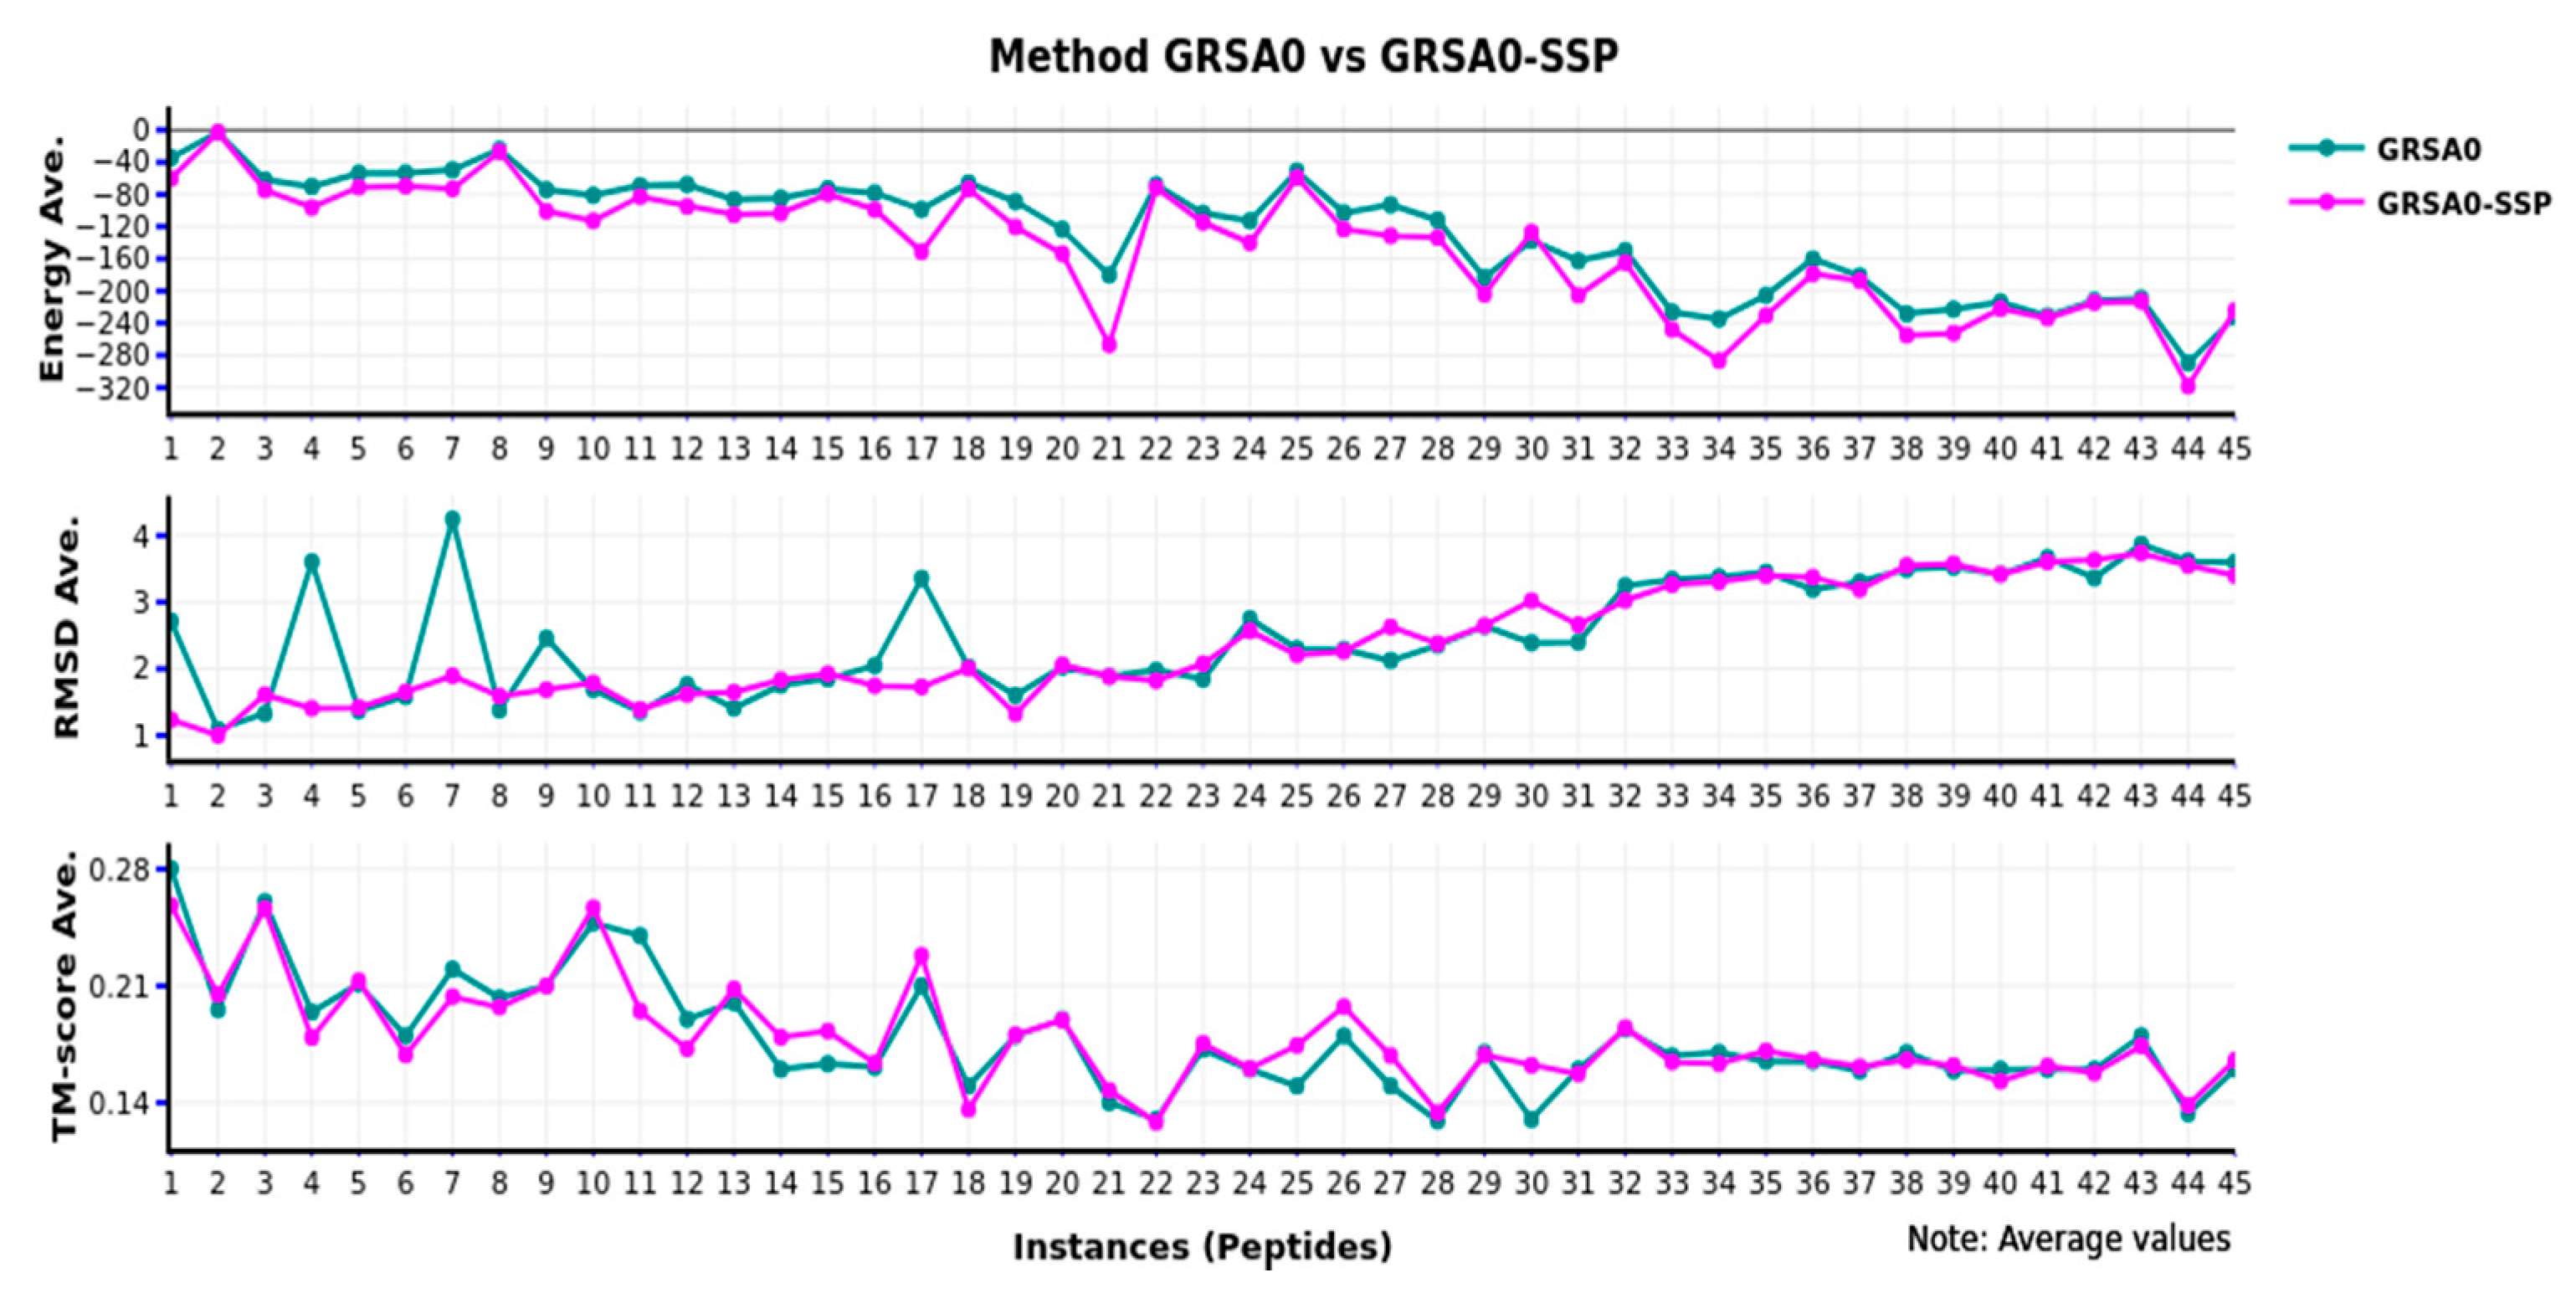
Figure 2,
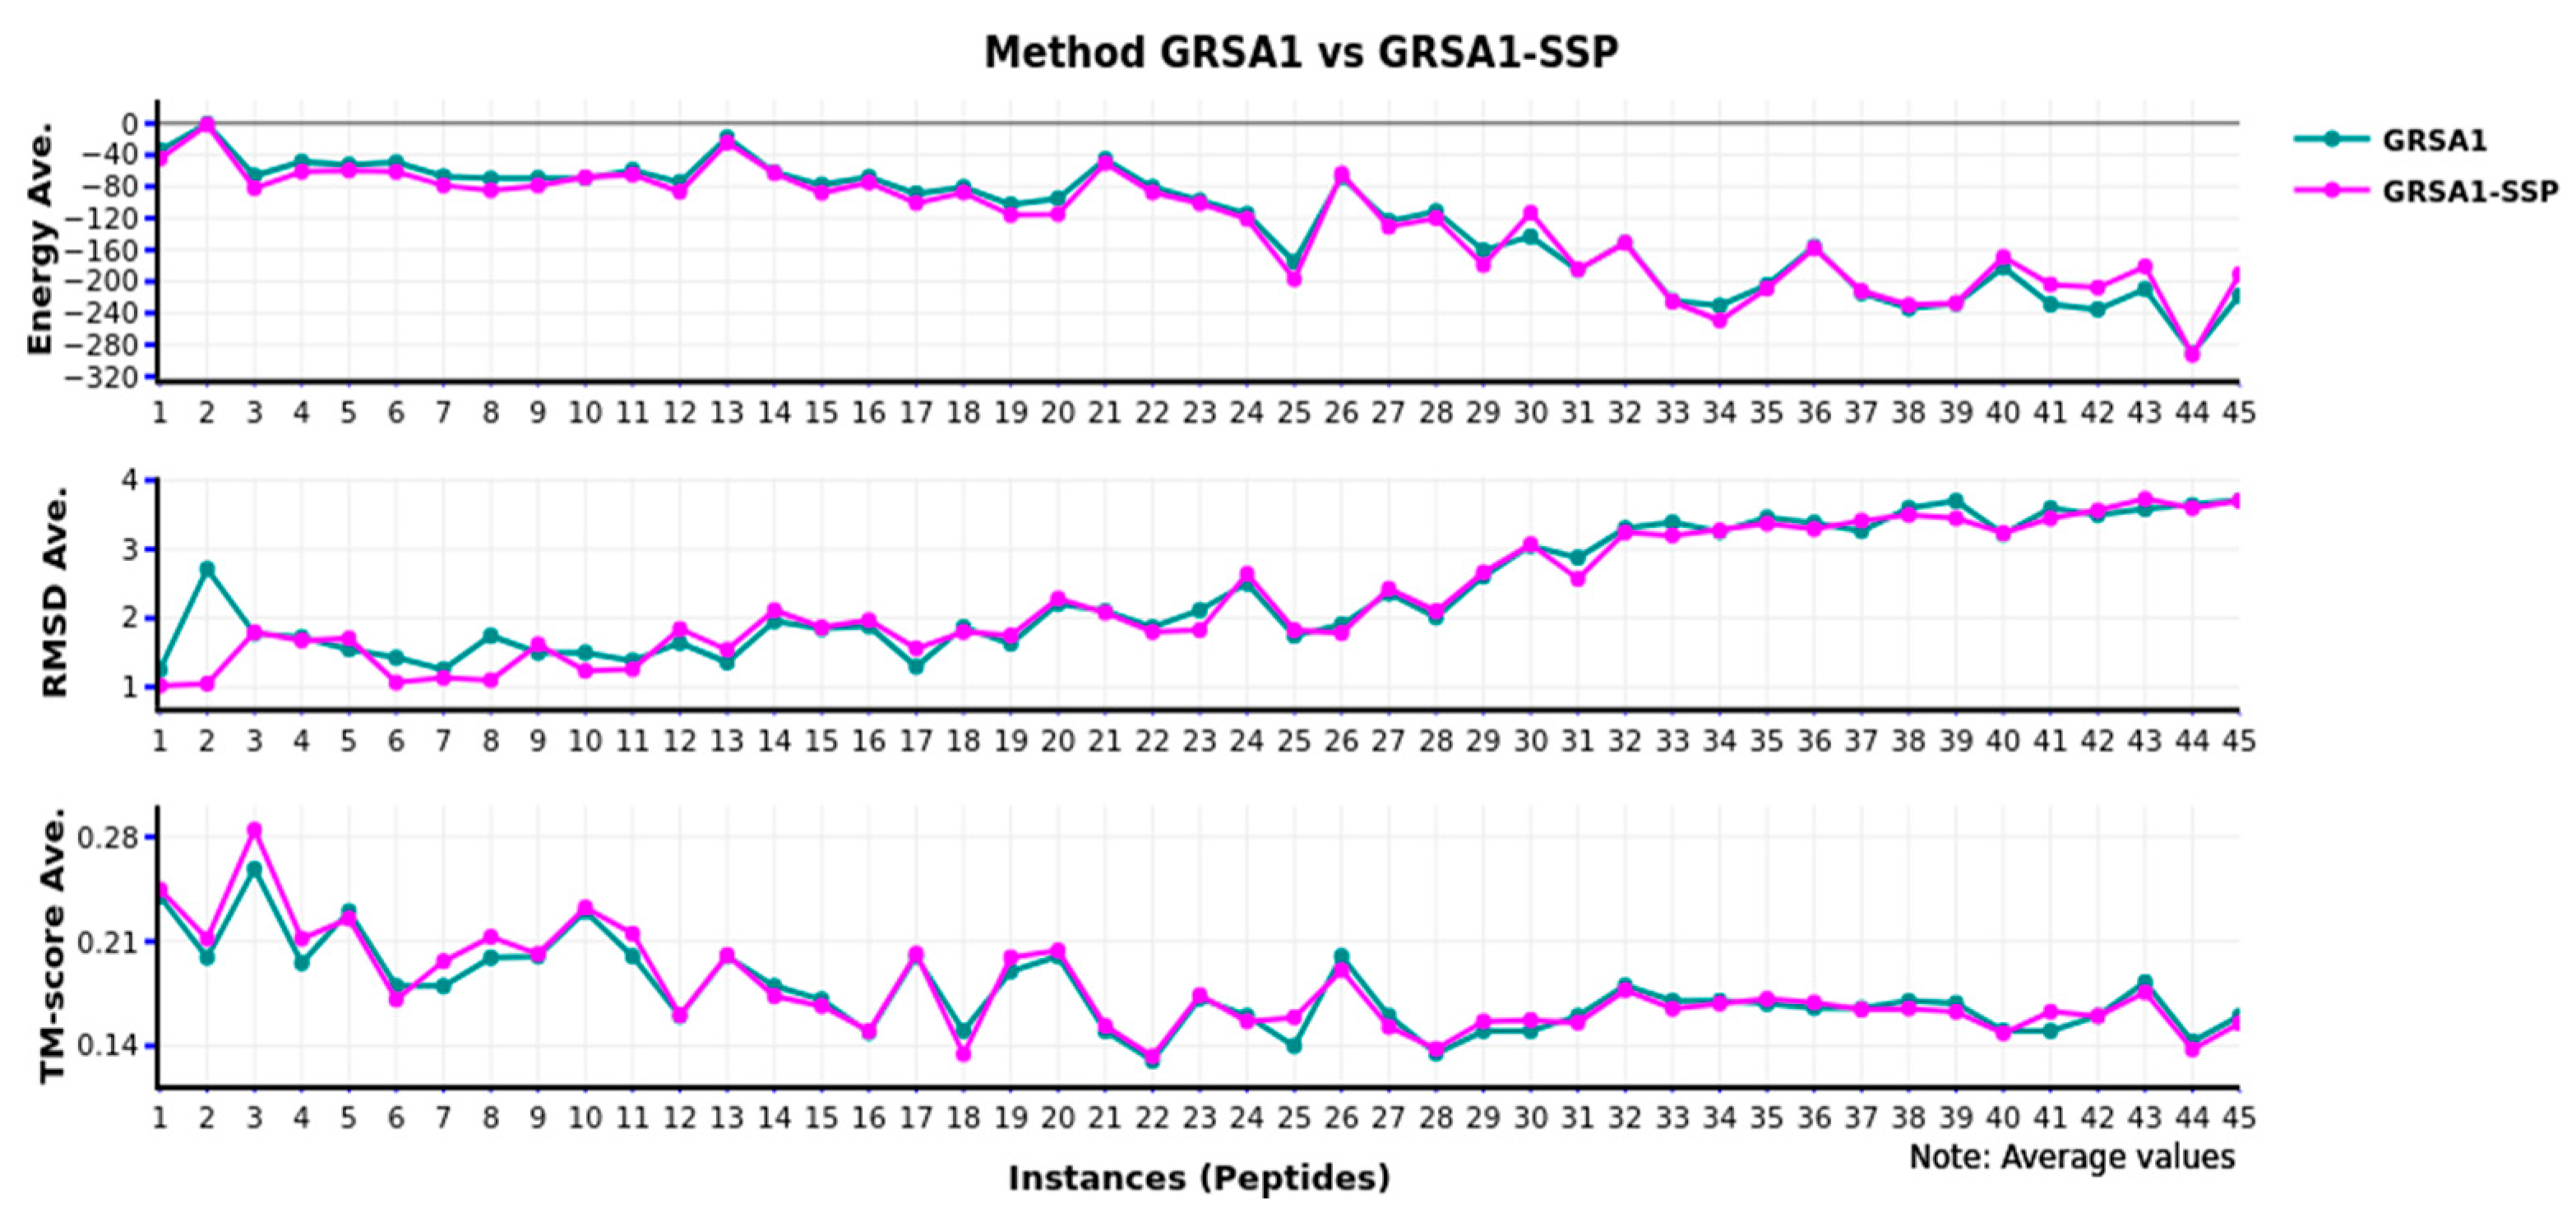
Figure 3,
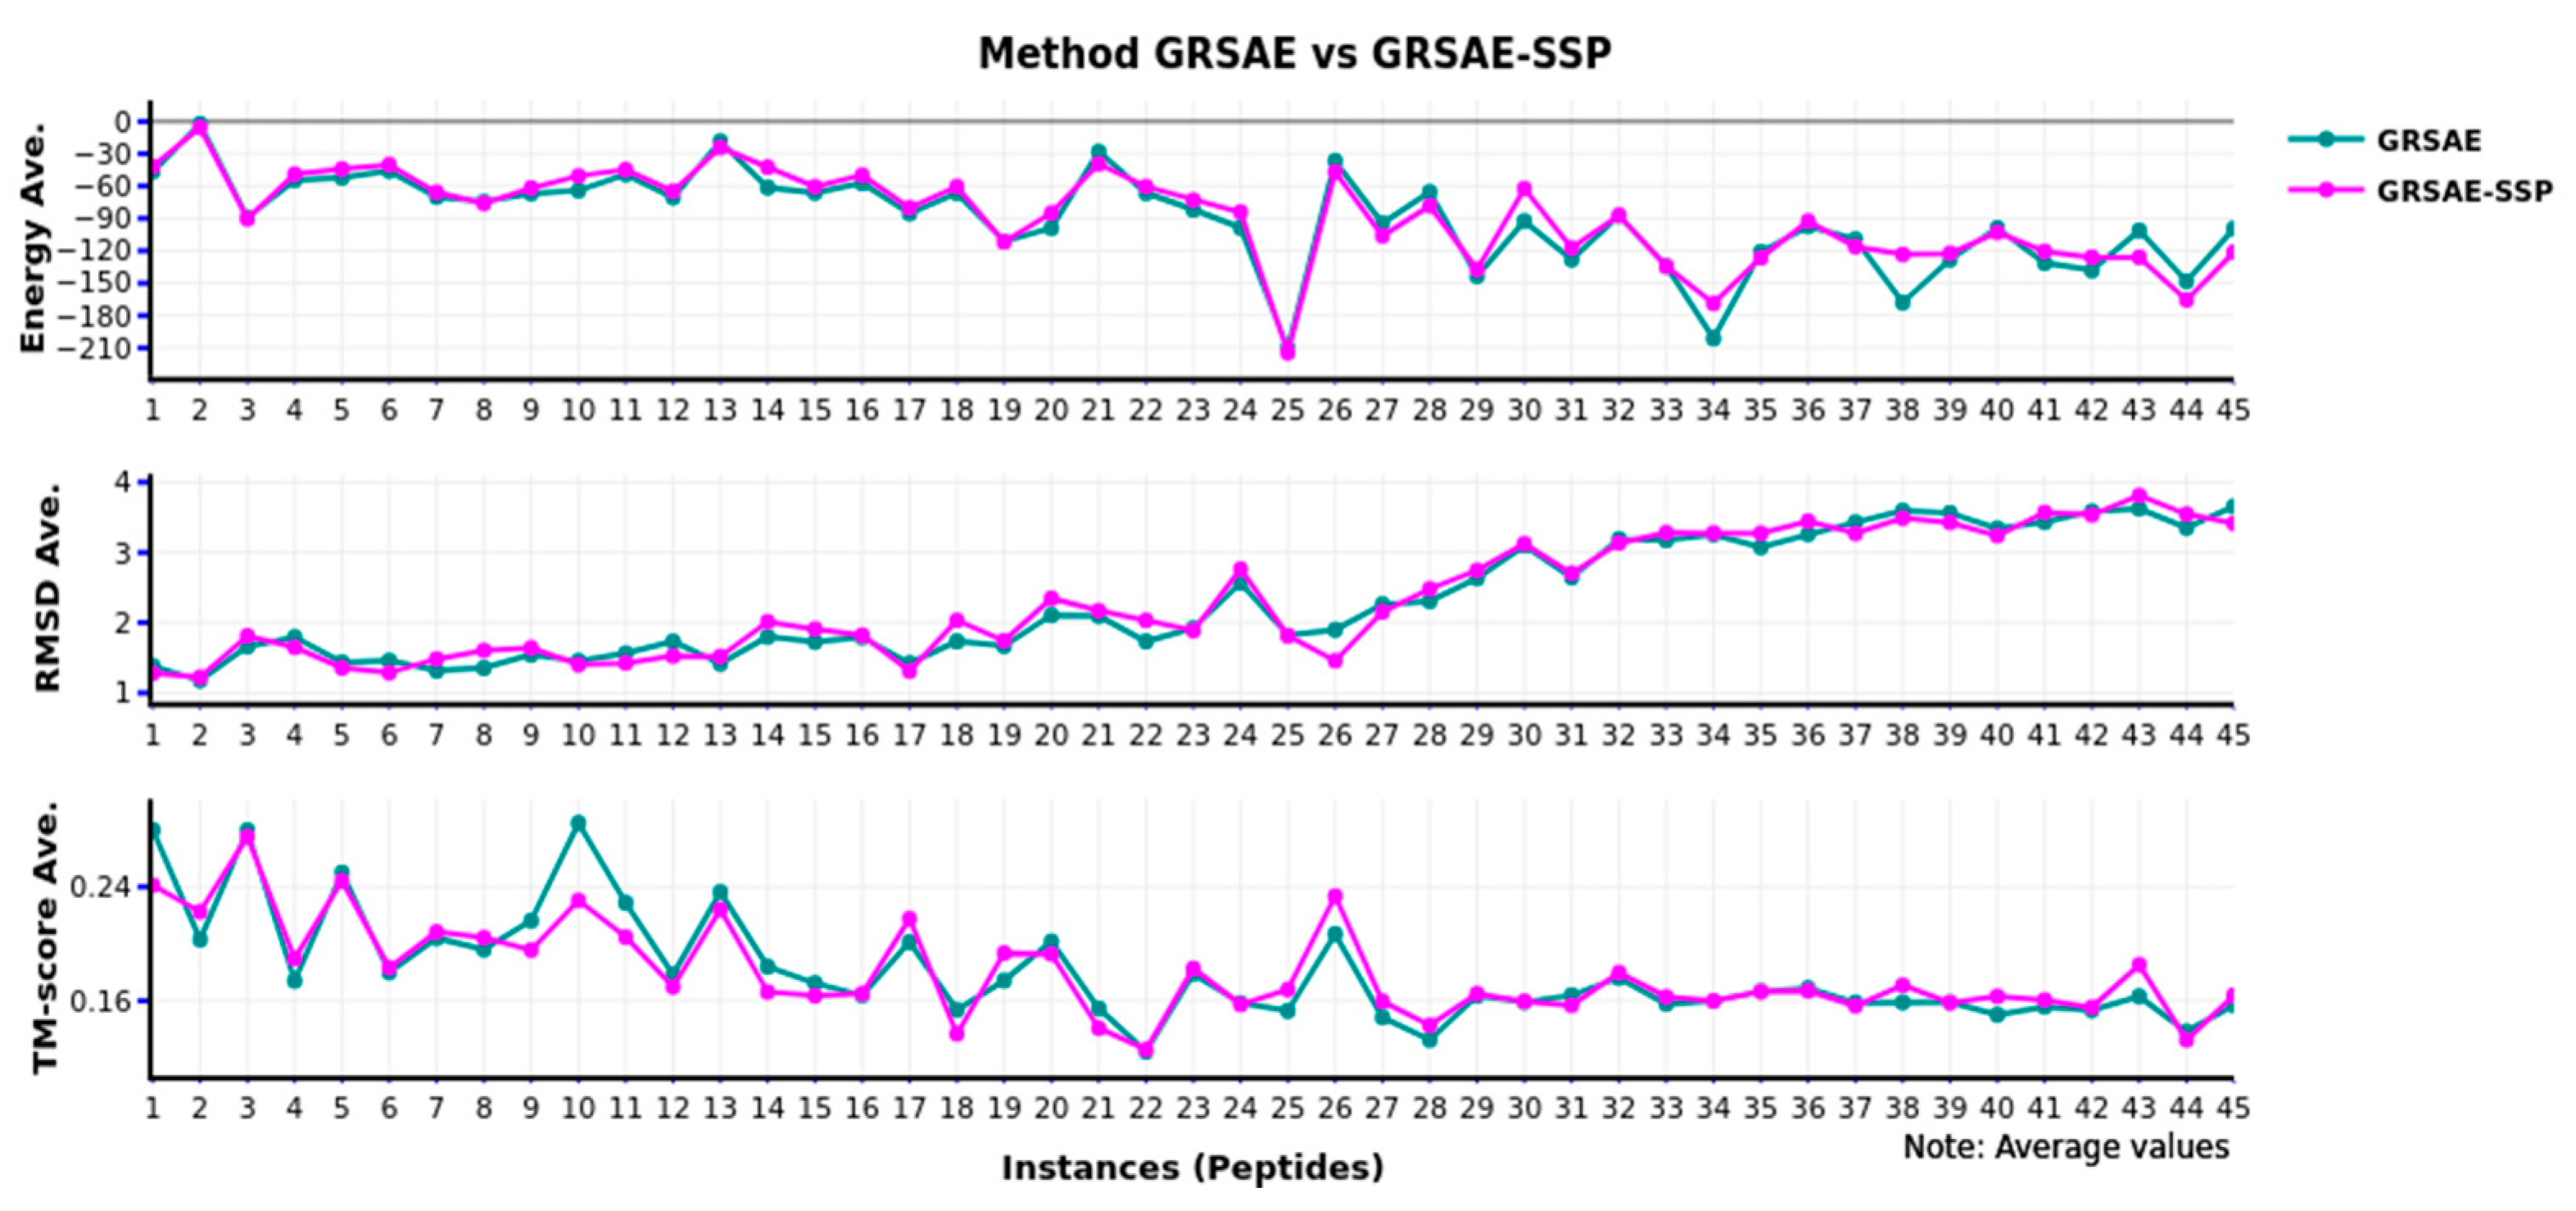
Figure 4 and
Figure 5 show average results related to energy (kcal/mol), RMSD, and TM-score for each peptide. The numbers in the x-axis, represent the instances or peptides of
Table 1, and each instance is a set of torsional angles X = [ɸ
1, Ψ
1, Χ
1, ω
1, ɸ
2, Ψ
2, Χ
2, ω
2, …, ɸ
n, Ψ
n, Χ
n, ω
n] associated to each amino acid. We averaged the results of 30 executions for comparison.
Figure 2 shows that GRSA0-SSP has better behavior than GRSA0 or classical SA. Note that in all the peptides, GRSA0-SSP obtained the lowest energy. In other cases, the RMSD is more stable with small instances (1–16), and in the next instances, the behavior is equal. Additionally, when we compared with TM-score, the behavior, in general, is similar. In conclusion, by implementing this methodology in GRSA0-SSP with these instances, we obtained slightly improved results.
Figure 3 presents the comparison of the GRSA1-SSP versus GRSA1 with the same metrics; we observed the behavior with the 45 instances evaluated. In terms of energy, RMSD, and TM-score, the performance of GRSA1-SSP is equivalent to GRSA1.
Figure 4 shows the behavior of GRSAE-SSP, and we compared it with the original GRSAE algorithm. In this figure, we can appreciate that the results are equivalent in all cases when energy, RMSD, and TM-score are used for comparison.
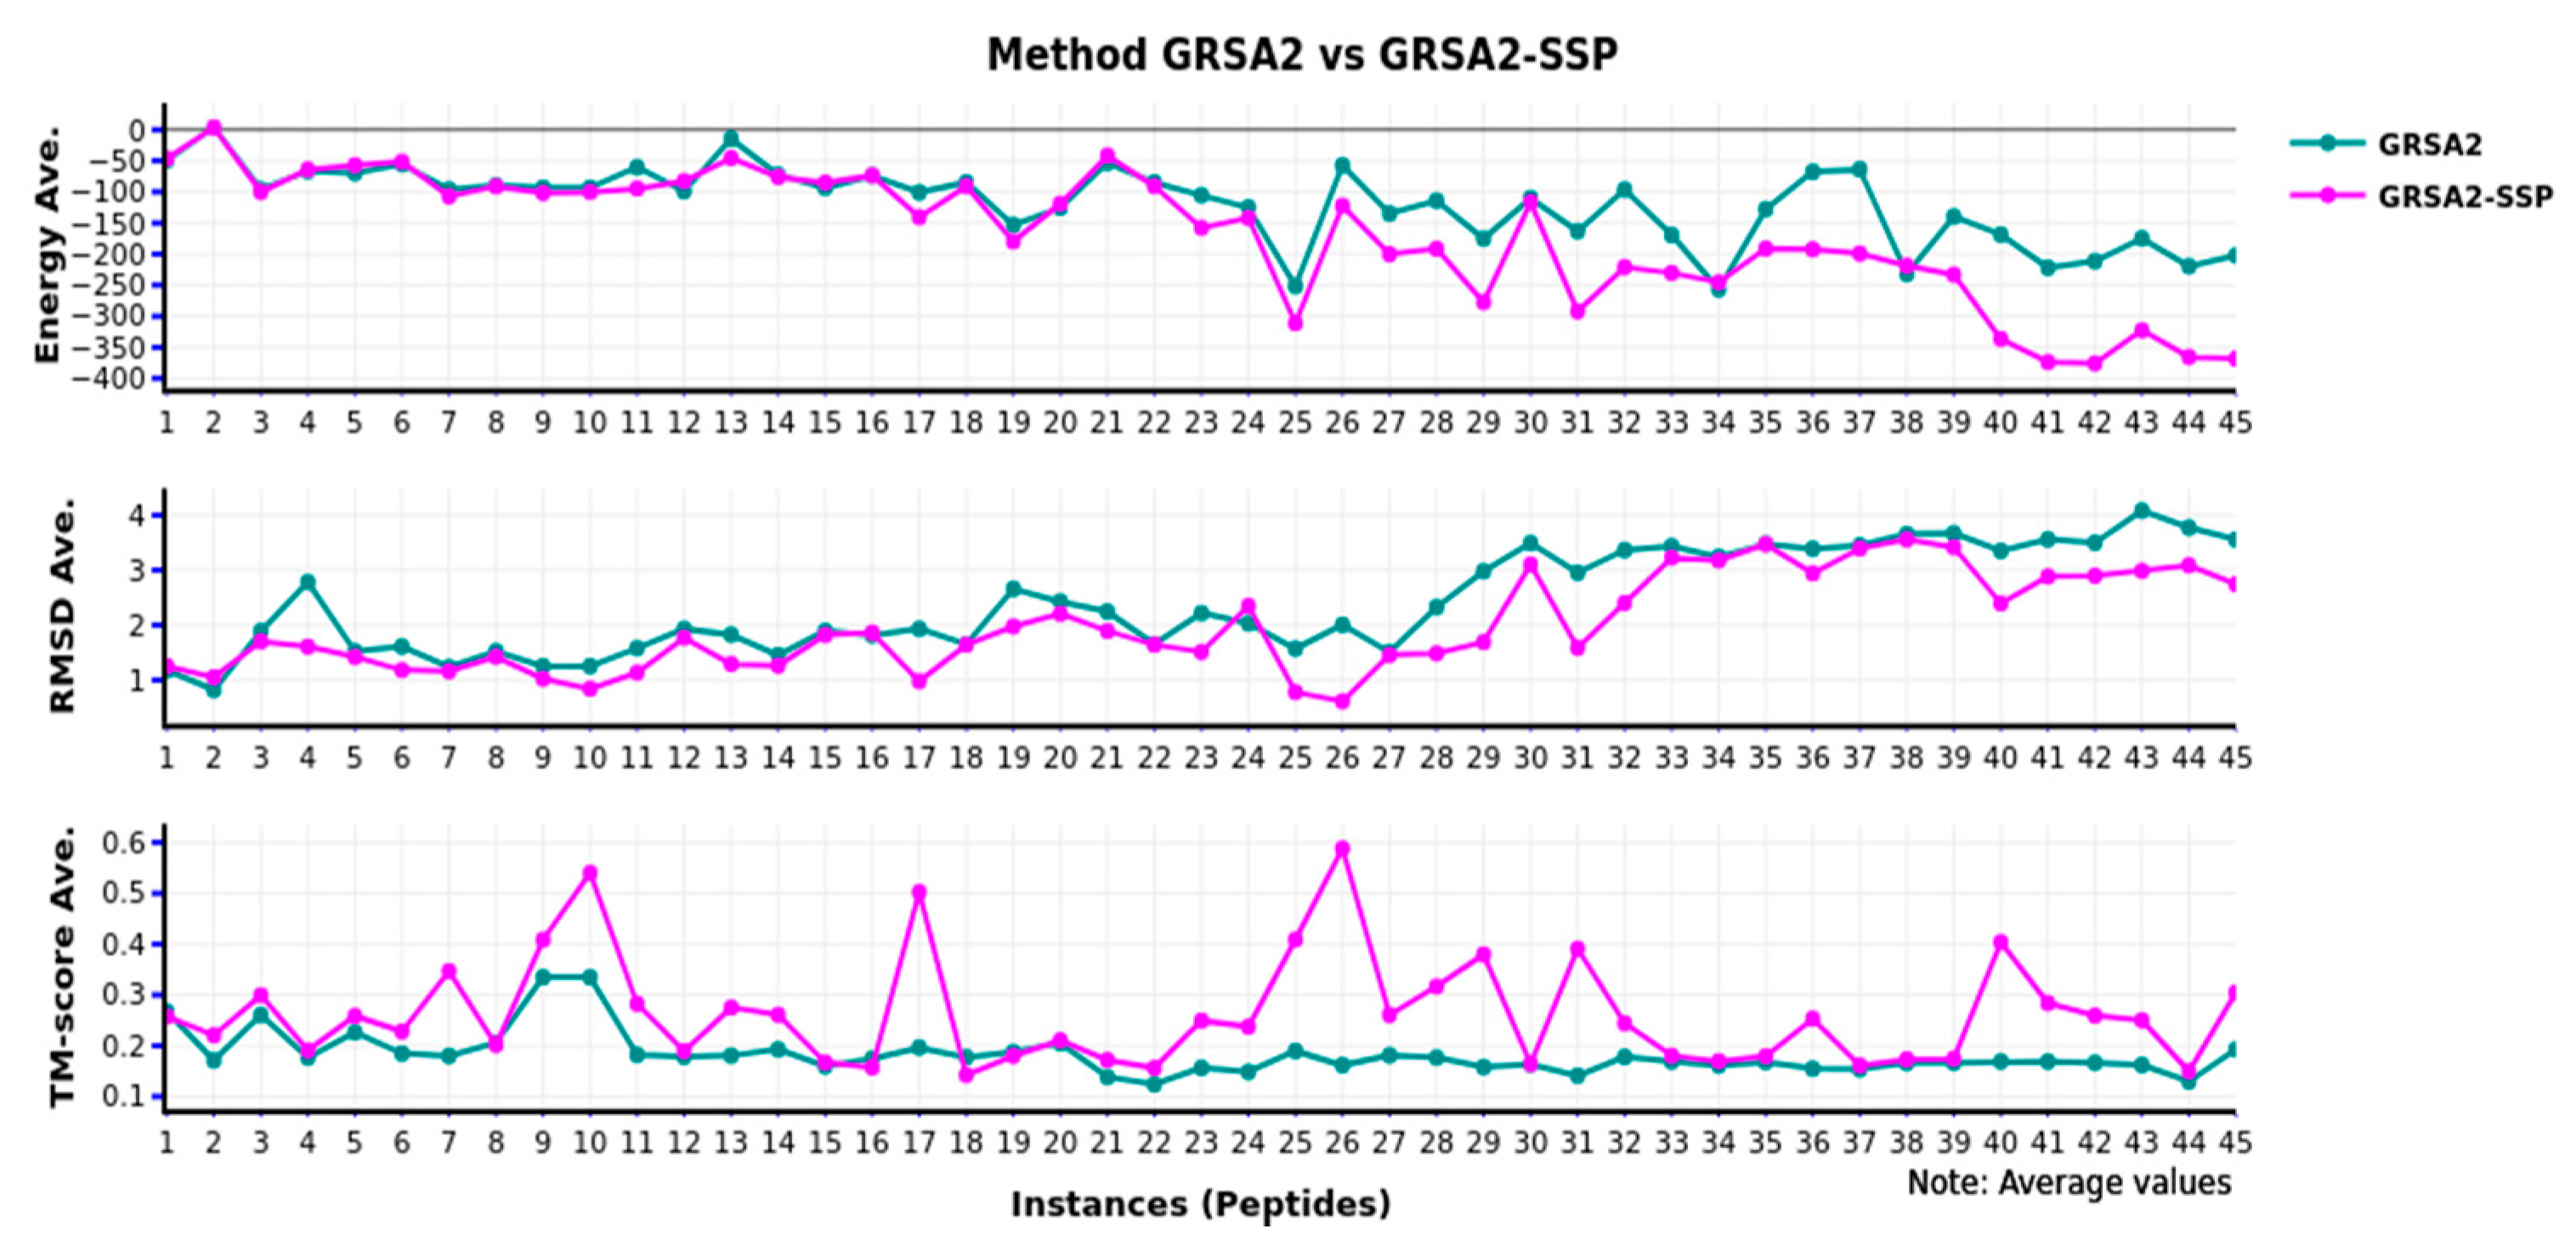
In
Figure 5, we present the comparison of GRSA2 versus GRSA2-SSP. Note that the results obtained in every instance are very remarkable, and the superiority of GRSA2-SSP uses the metrics of energy, RMSD, and TM-Score. In this case, we applied the methodology GRSA-SSP to improve the behavior of the classical GRSA2 algorithm.
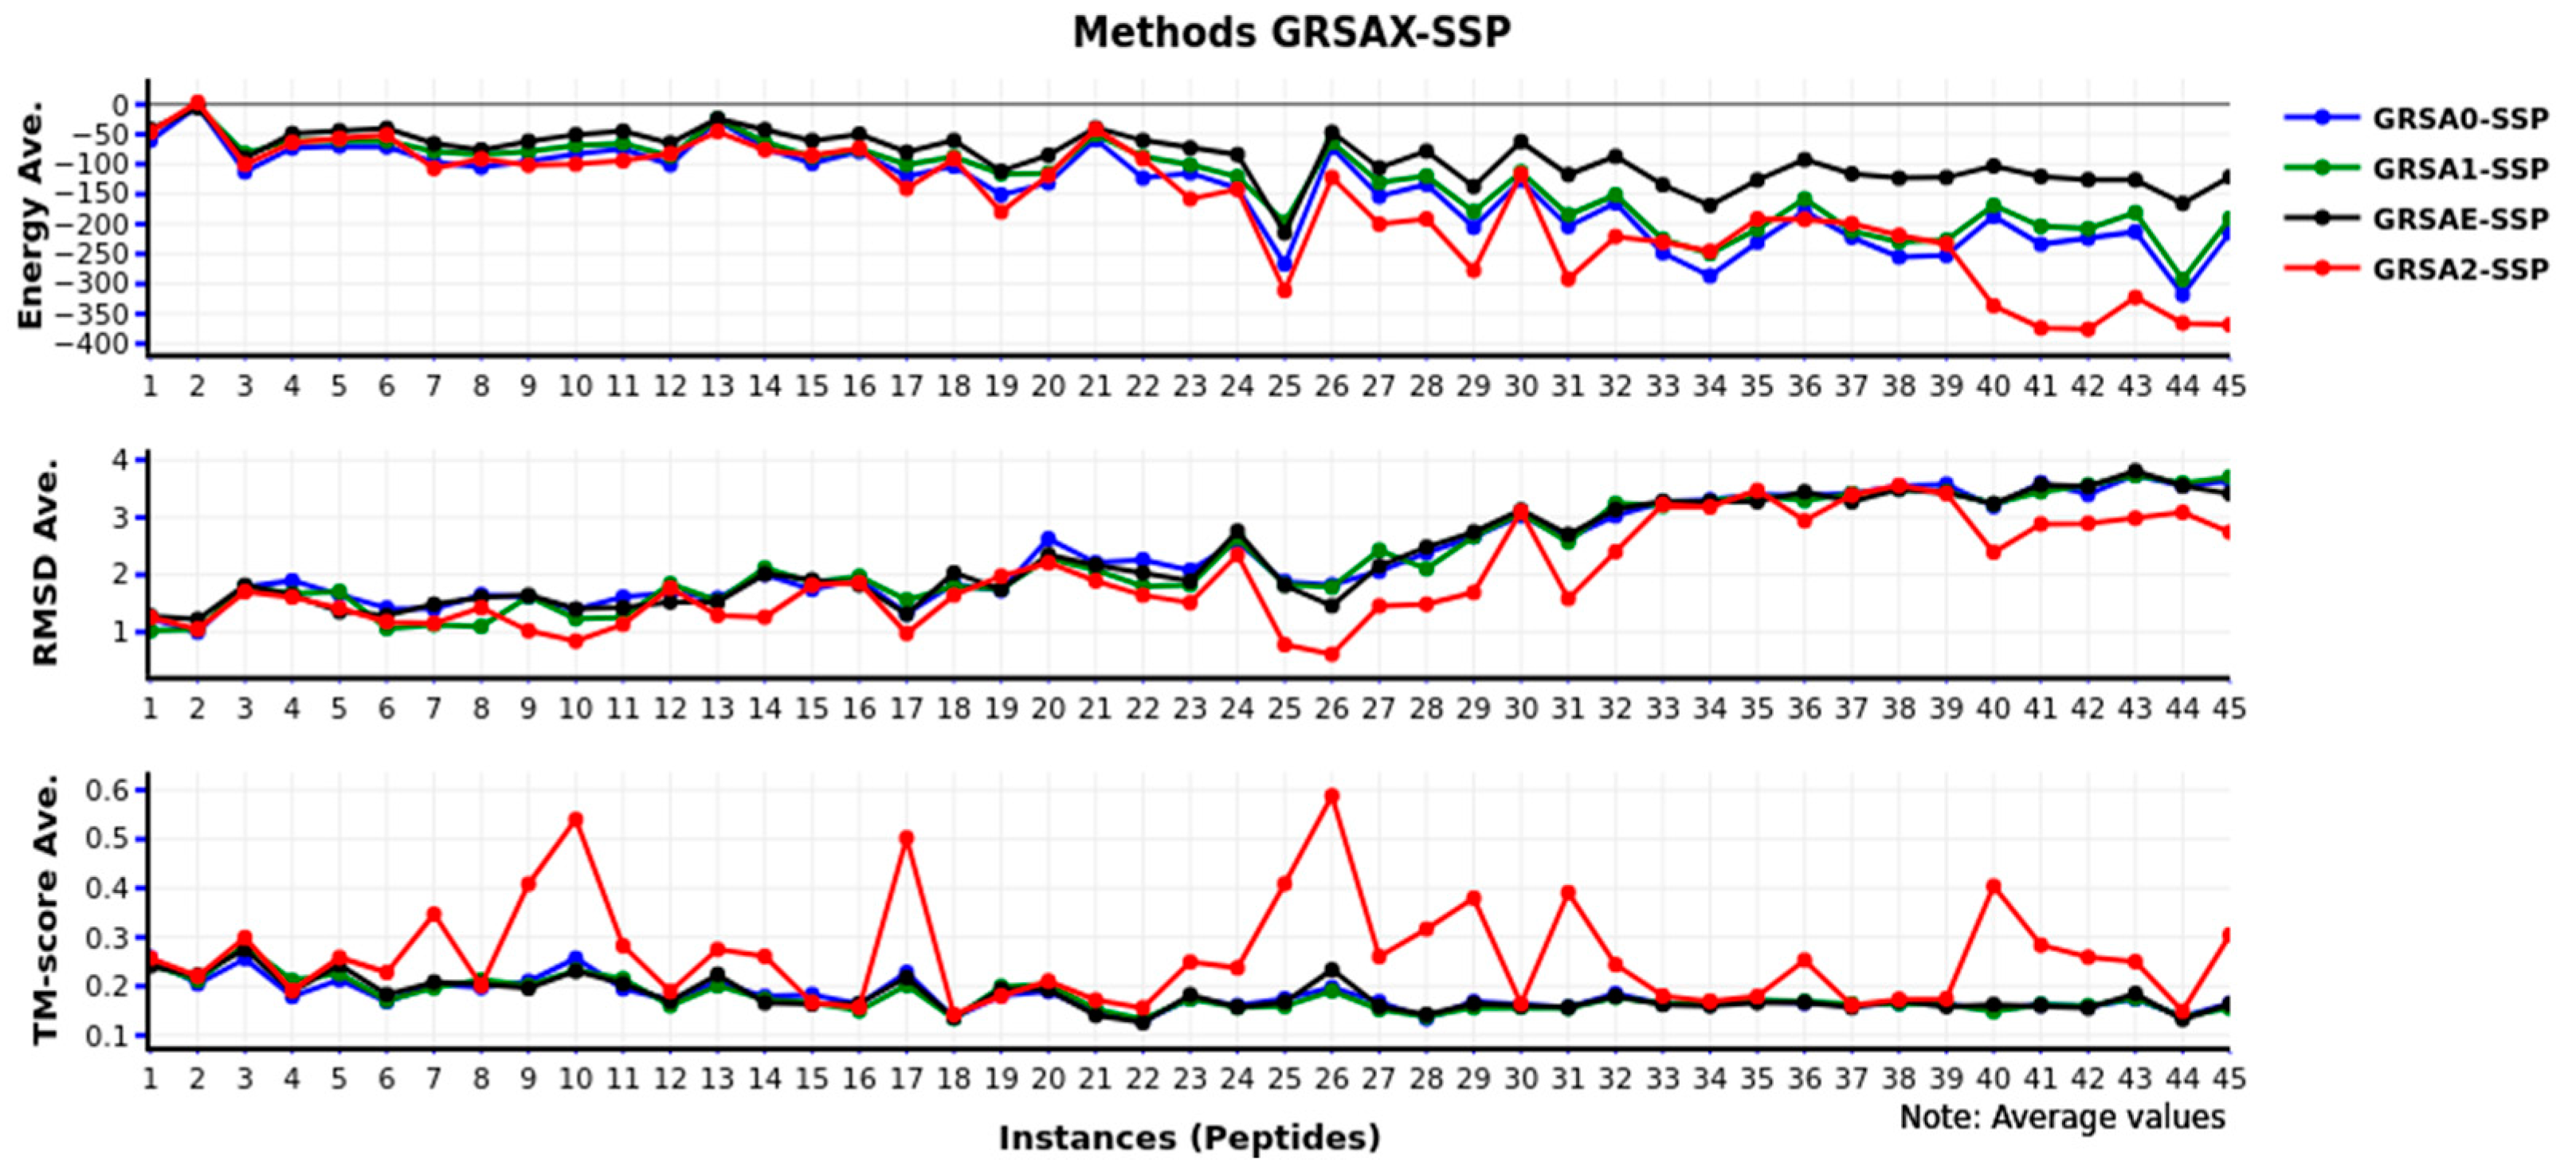
Finally, in
Figure 6, we present the comparison of the GRSAX-SSP family algorithms. We observe that GRSA2-SSP has the best values in several instances against the other algorithms, being higher than the others. Therefore, the best behavior of the algorithms with secondary structure prediction is GRSA2-SSP.
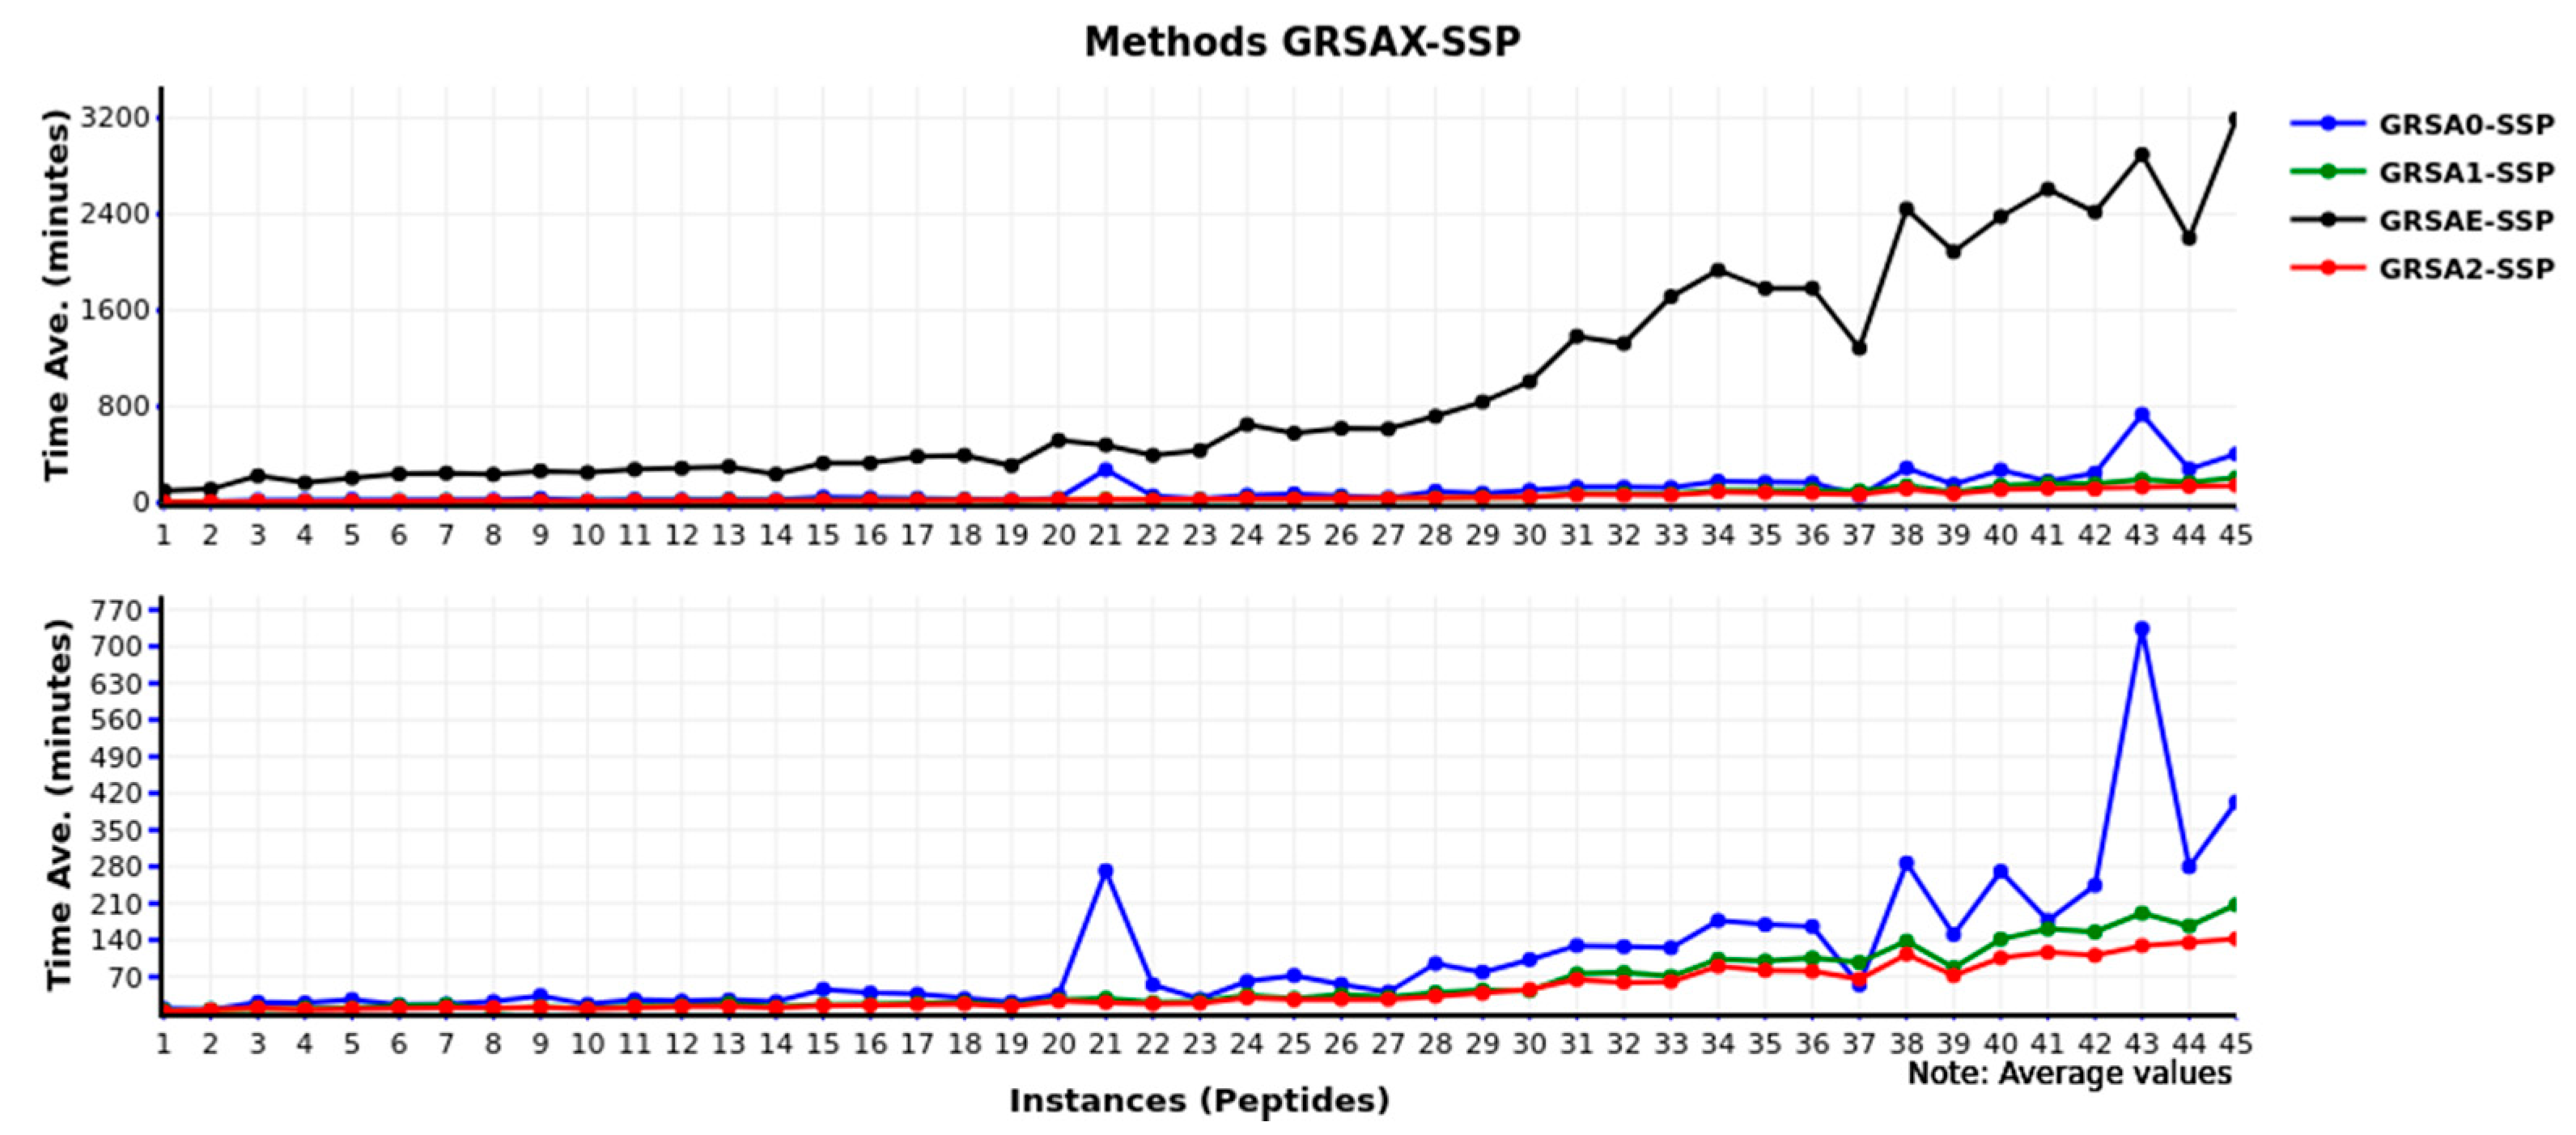
Furthermore,
Figure 7 presents the computational time of the GRSAX-SSP family algorithms. The GRSA2-SSP has the best behavior in time with low values in most of the instances compared to the other algorithms.
Table 2 presents the results obtained by GRSA2-SSP. For each instance, we show the best TM-score and their RMSD. Additionally, we calculated the average of the RMSD and TM-score for the five best predictions. Complementing the results, we determined the standard deviation (std) of the RMSD and TM-score for the five best predictions and included the best type of secondary structure: A (mainly alpha), B (mainly beta), and N (mainly none). This classification as A, B, and N is based on the secondary structure predominating in each peptide [
27,
68,
69,
71,
72]. We sort
Table 2 by the number of amino acids for comparing the best results obtained by GRSA2-SSP with the best algorithms of the literature. This comparison is presented in Figures 9–11.
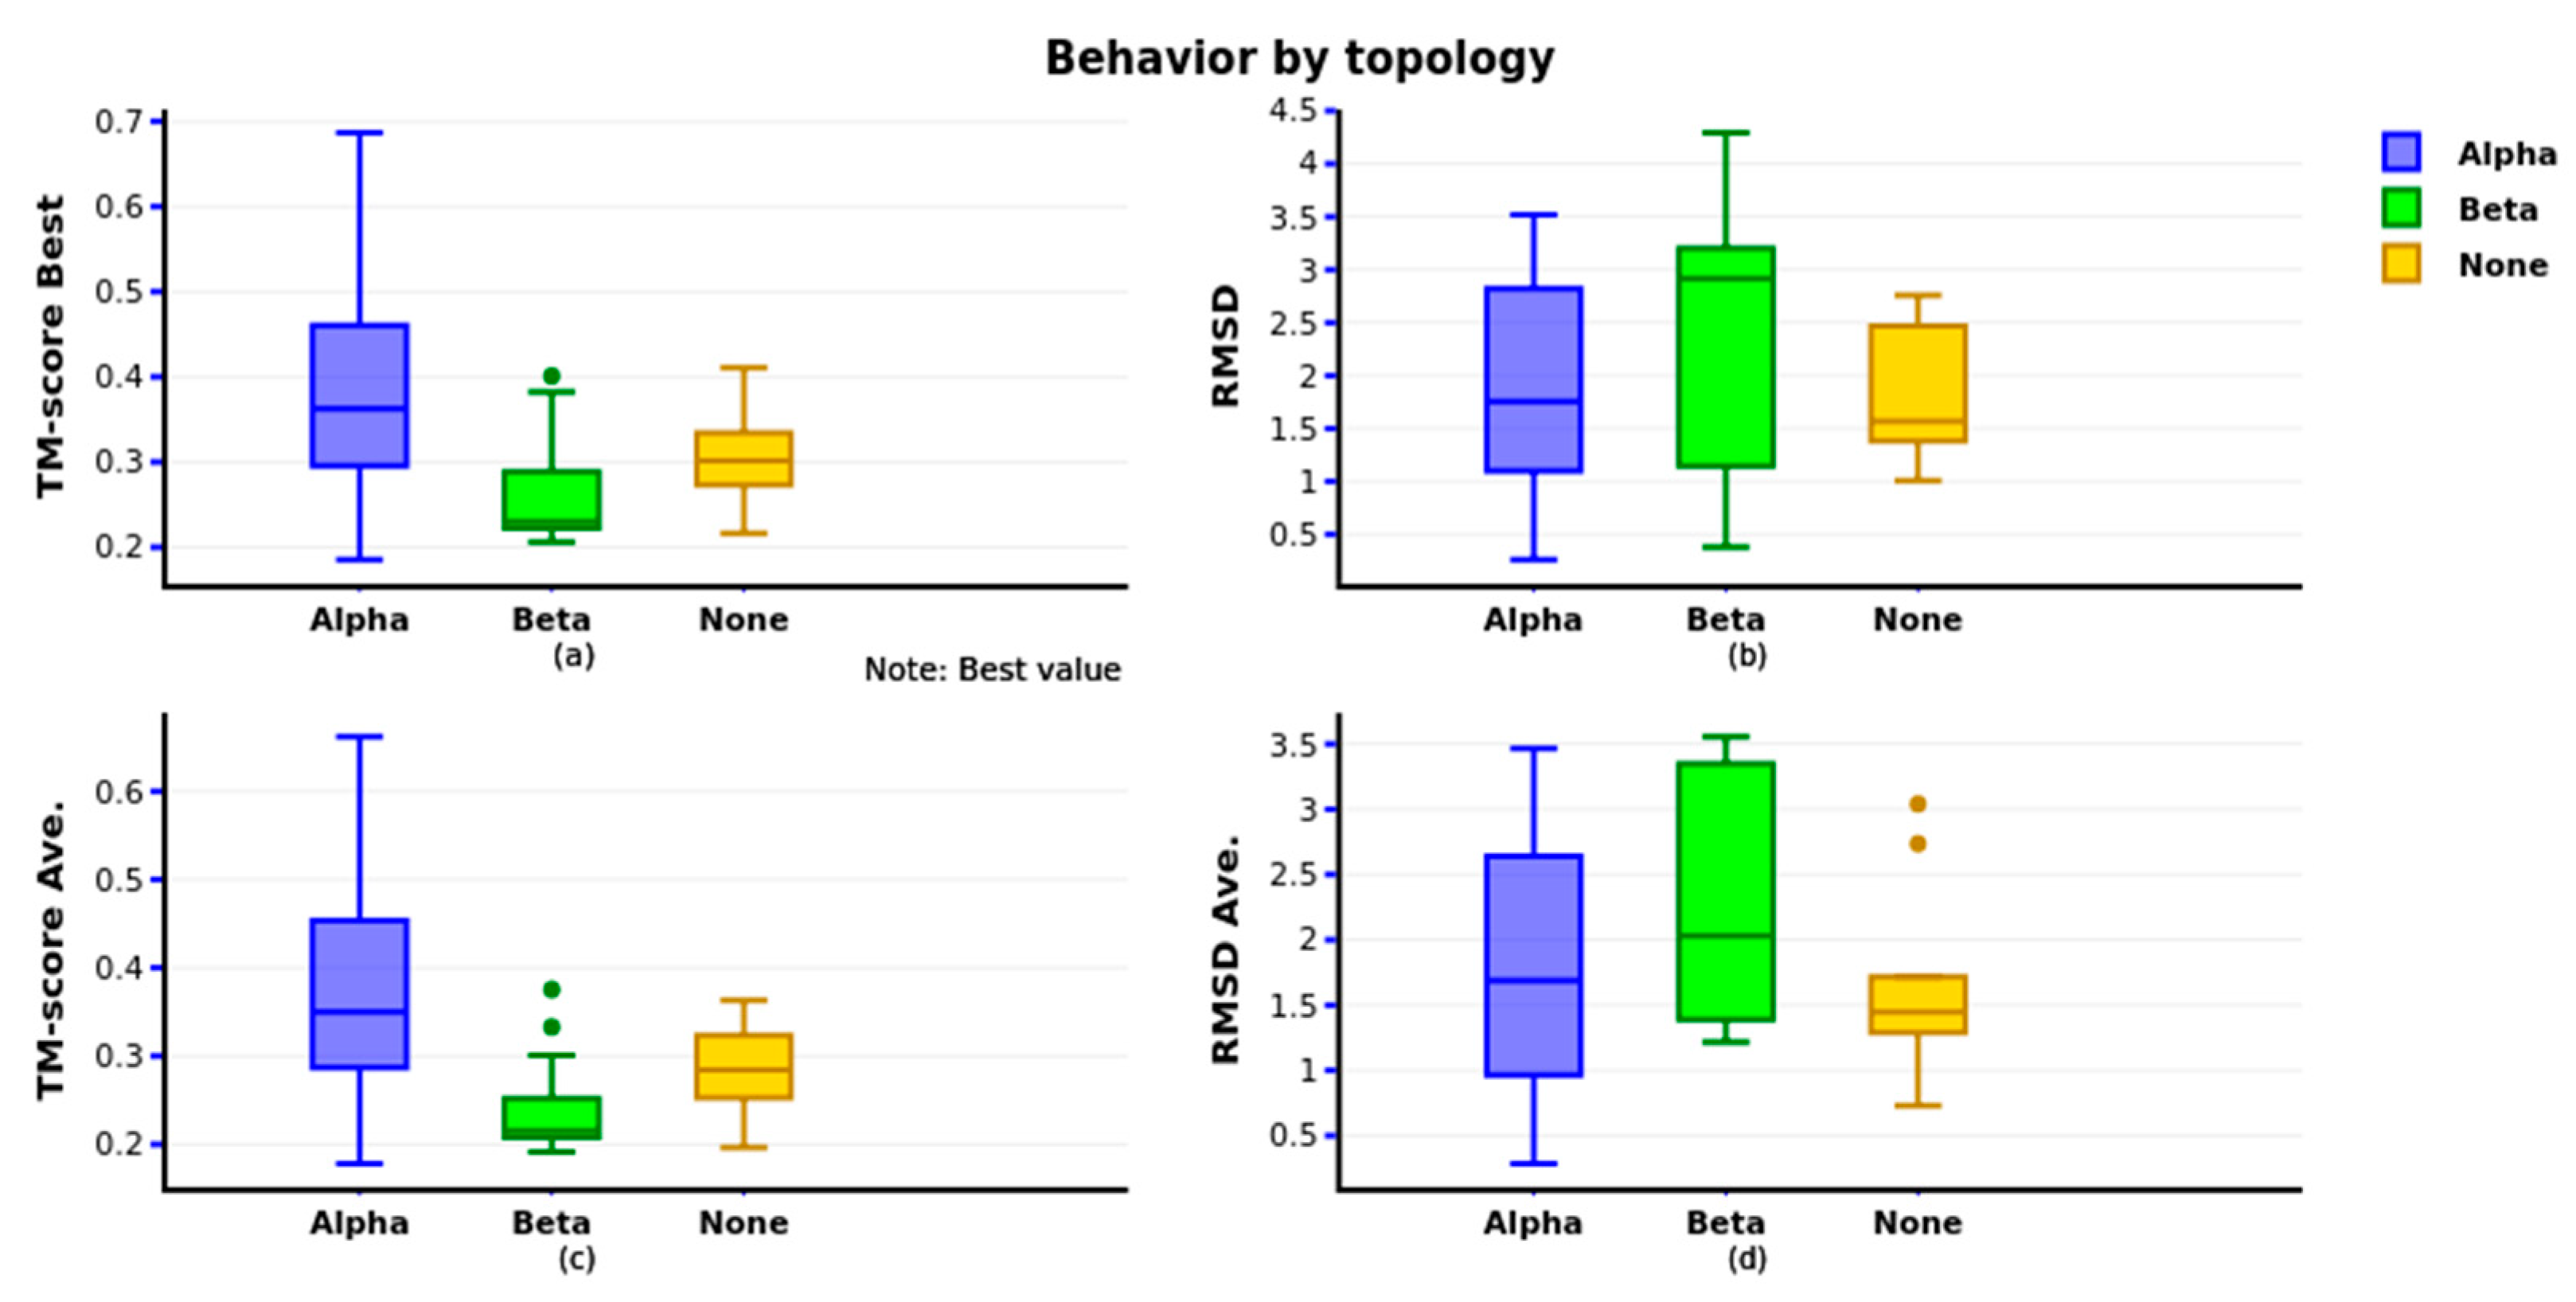
Figure 8 shows the GRSA2-SSP algorithm performance with instances classified by secondary structure. We show that the GRSA2-SSP algorithm has the best behavior in alpha structure instances evaluated with TM-score in
Figure 8a and RMSD metrics in
Figure 8b. The values in
Figure 8 are the best obtained using TM-score and their RMSD. In
Figure 8c,d, we present the TM-score average for the five best predictions and their RMSD average.
In
Figure 9,
Figure 10 and
Figure 11, we present the behavior of the GRSA2-SSP algorithm, and we compare it with the results obtained from the approaches PEP-FOLD3, I-TASSER, QUARK, and Rosetta. We divided the dataset of
Table 1 into three groups of 15 instances; groups 1, 2, and 3 have instances 1–15, 16–30, and 31–45. We compared these groups using the metrics RMSD, TM-score, GDT-TS [
73], and TM-score (classical), and we present the best TM-score, the average of the five best predictions of the TM-score, and their RMSD. Additionally, we present the GDT-TS average and TM-score average.
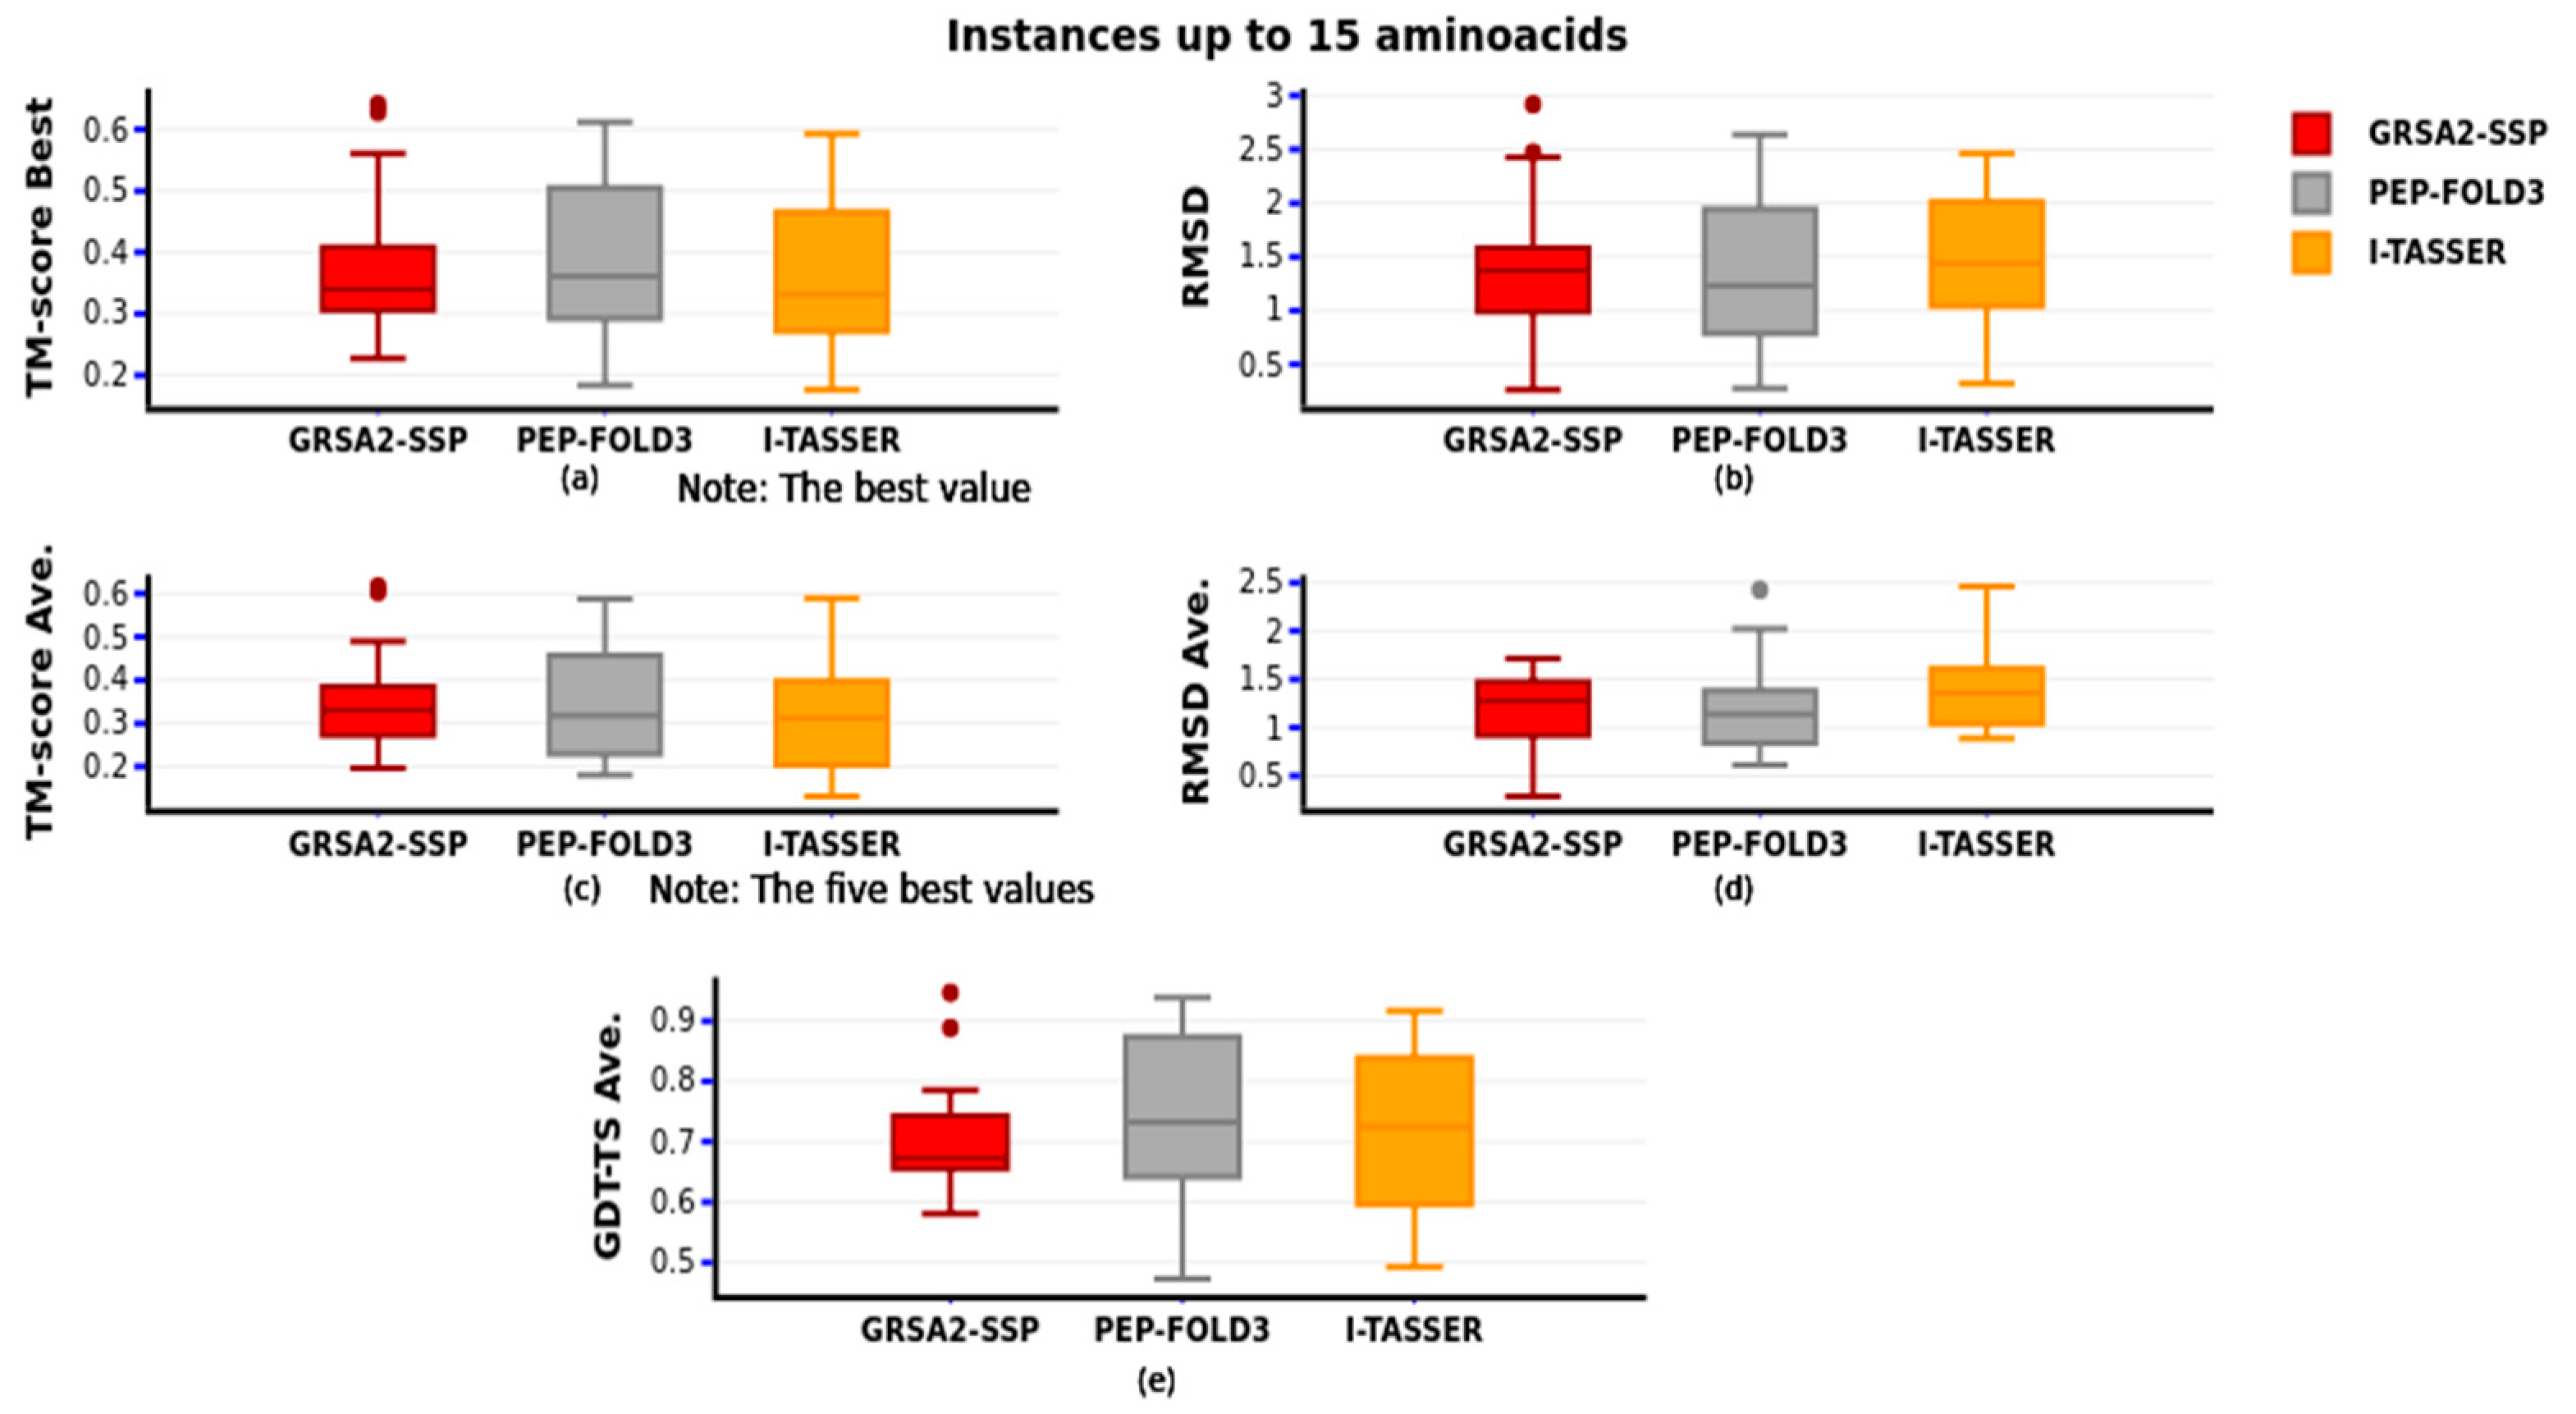
In
Figure 9, we introduced the comparison of the first group, and we observed that GRSA2-SSP behaves similarly to I-TASSER and PEP-FOLD3, but in this group of small peptides, PEP-FOLD3 is slightly better than our algorithm and I-TASSER when GDT-TS is compared (
Figure 9e). Furthermore, we observed that our algorithm is competitive in this group. In this comparison, Rossetta and QUARK were not added because the minimal number of amino acids predicted are 27 and 20, respectively.
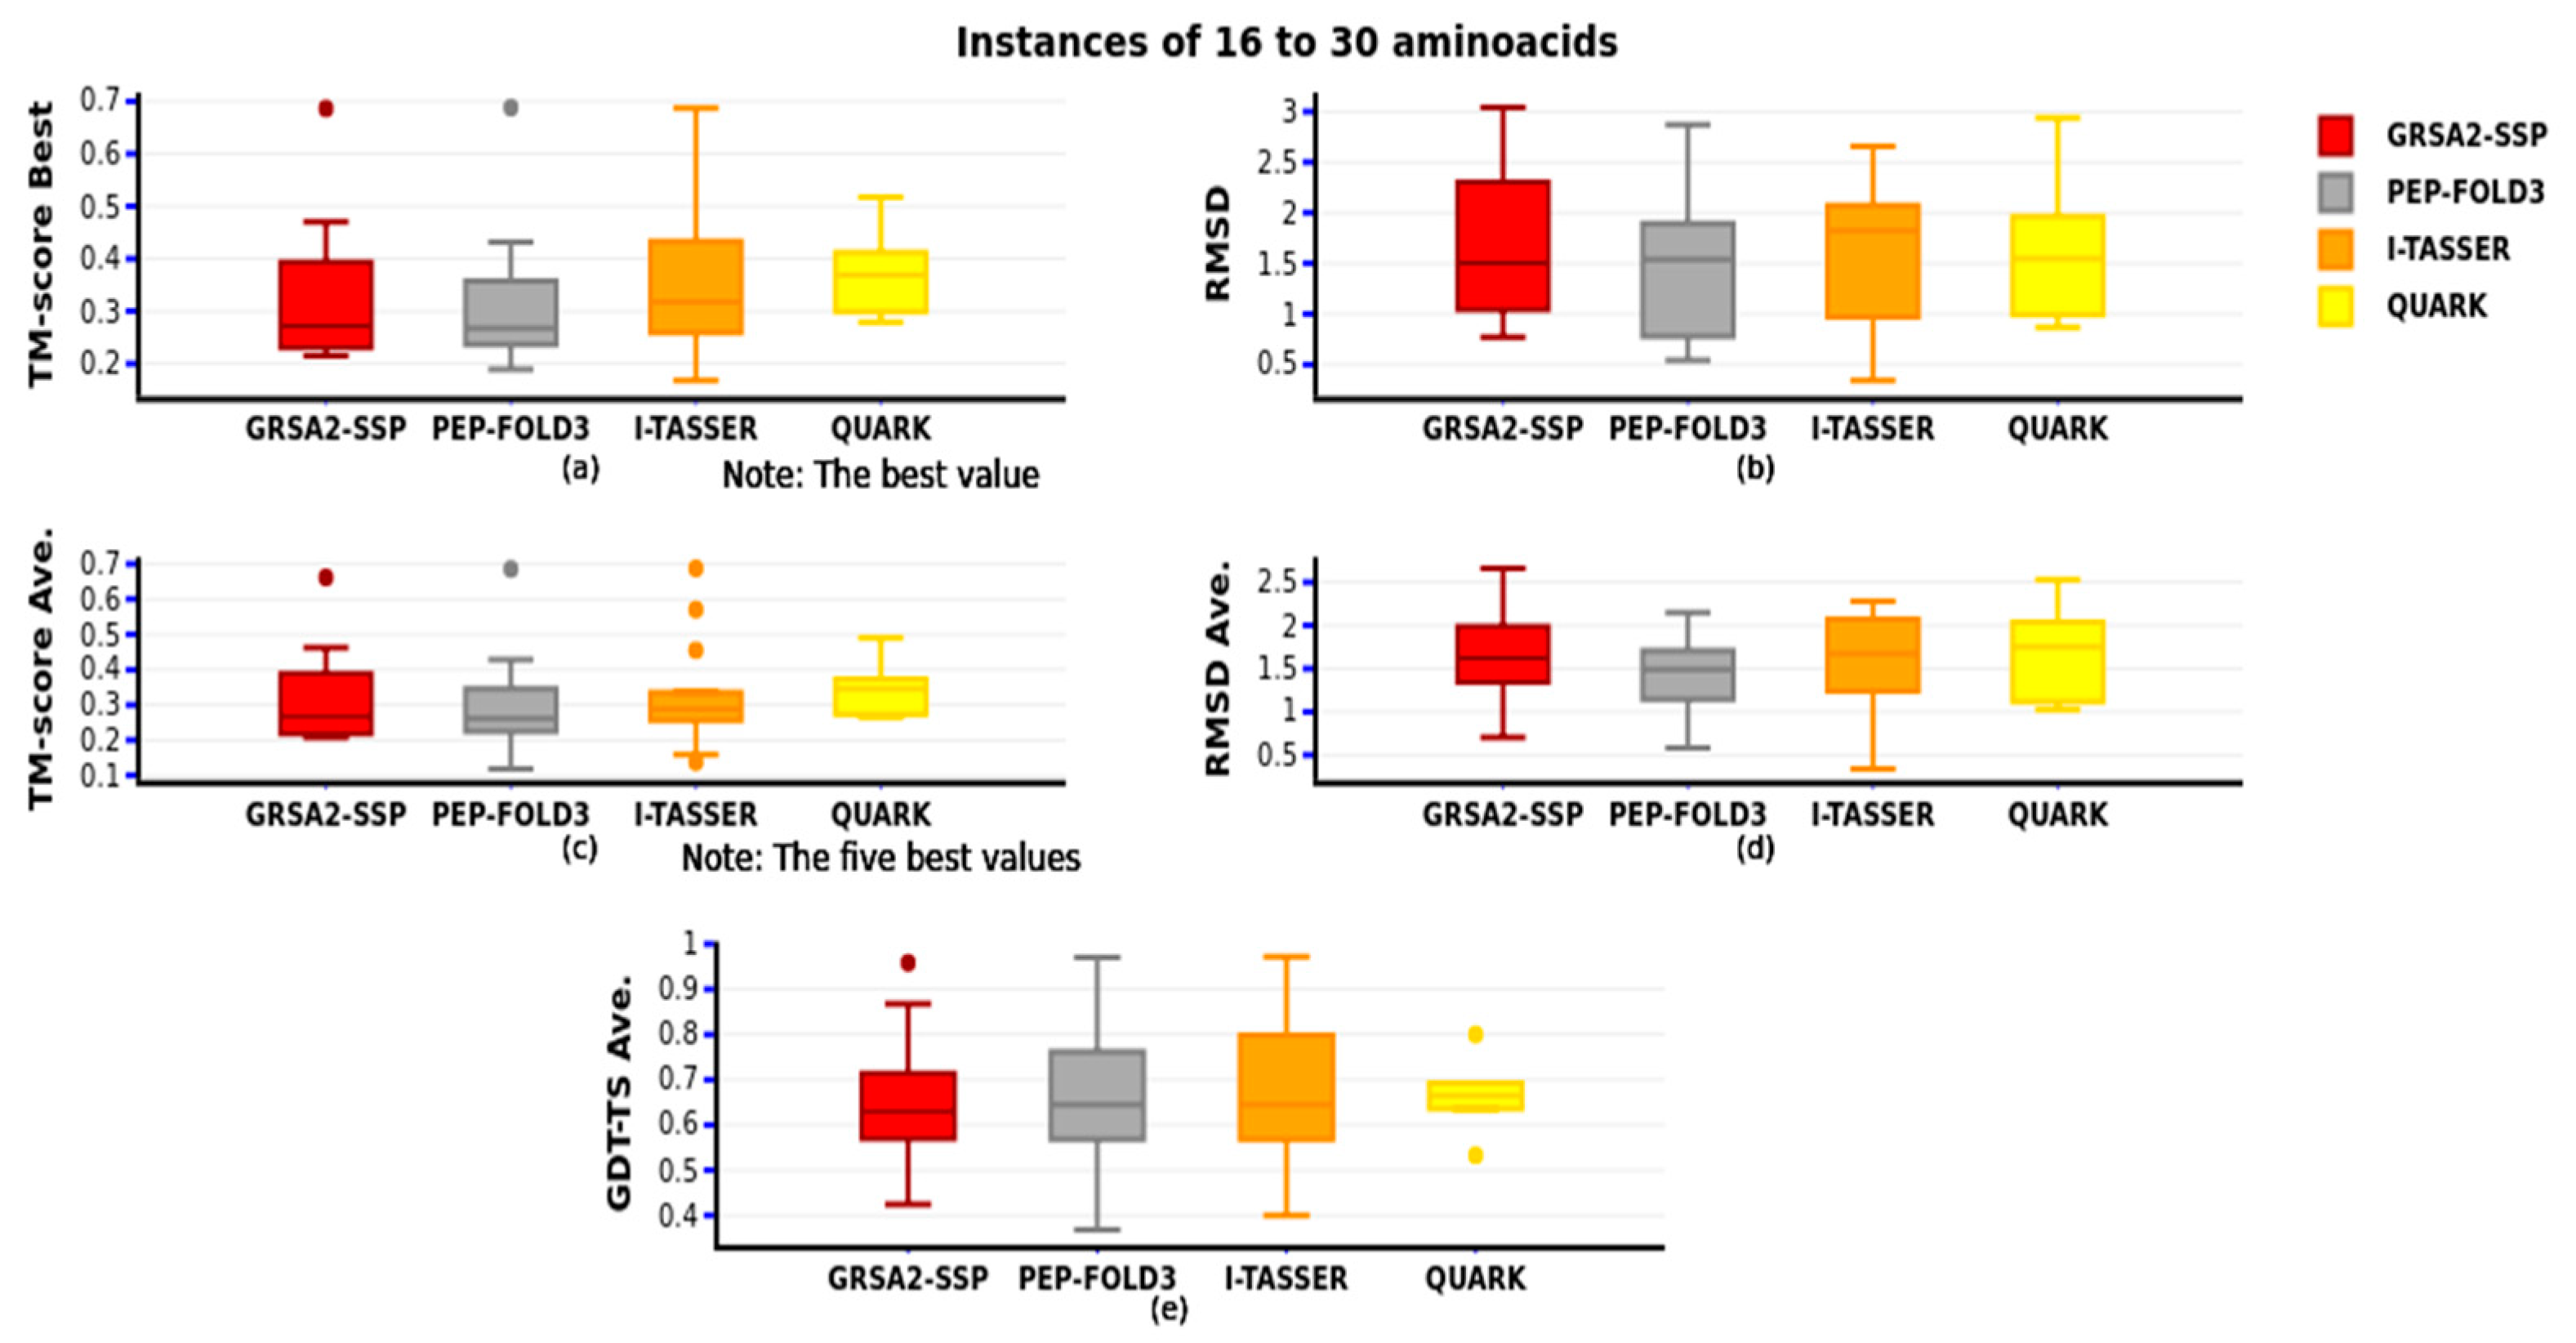
Figure 10 compares the second group of 16 to 30 amino acids with the best and the five best obtained using the TM-score metric and their RMSD, and the GDT-TS average. In this comparison, we added the second group of instances’ results of QUARK; Rosetta was omitted because it is unable to predict most of the instances of this group.
In
Figure 10a we observe very similar behavior among GRSA2-SSP, PEP-FOLD3, I-TASSER, and Rosetta. Note in this figure, GRSA2-SSP and PEP-FOLD3 obtain the best prediction. In
Figure 10c, when the best five predictions are compared, I-TASSER obtains the best results, followed by PEPFOLD3 and GRSA2-SSP. Additionally, when the RMSD average is compared (
Figure 10d), I-TASSER is the best, followed by PEP-FOLD3 and GRSA2-SSP. Finally, in
Figure 10e, when GDT-TS is compared, GRSA2-SSP has a similar performance to PEP-FOLD3, I-TASSER, and QUARK. According to this figure, GRSA2-SSP and I-TASSER obtained a similar average.
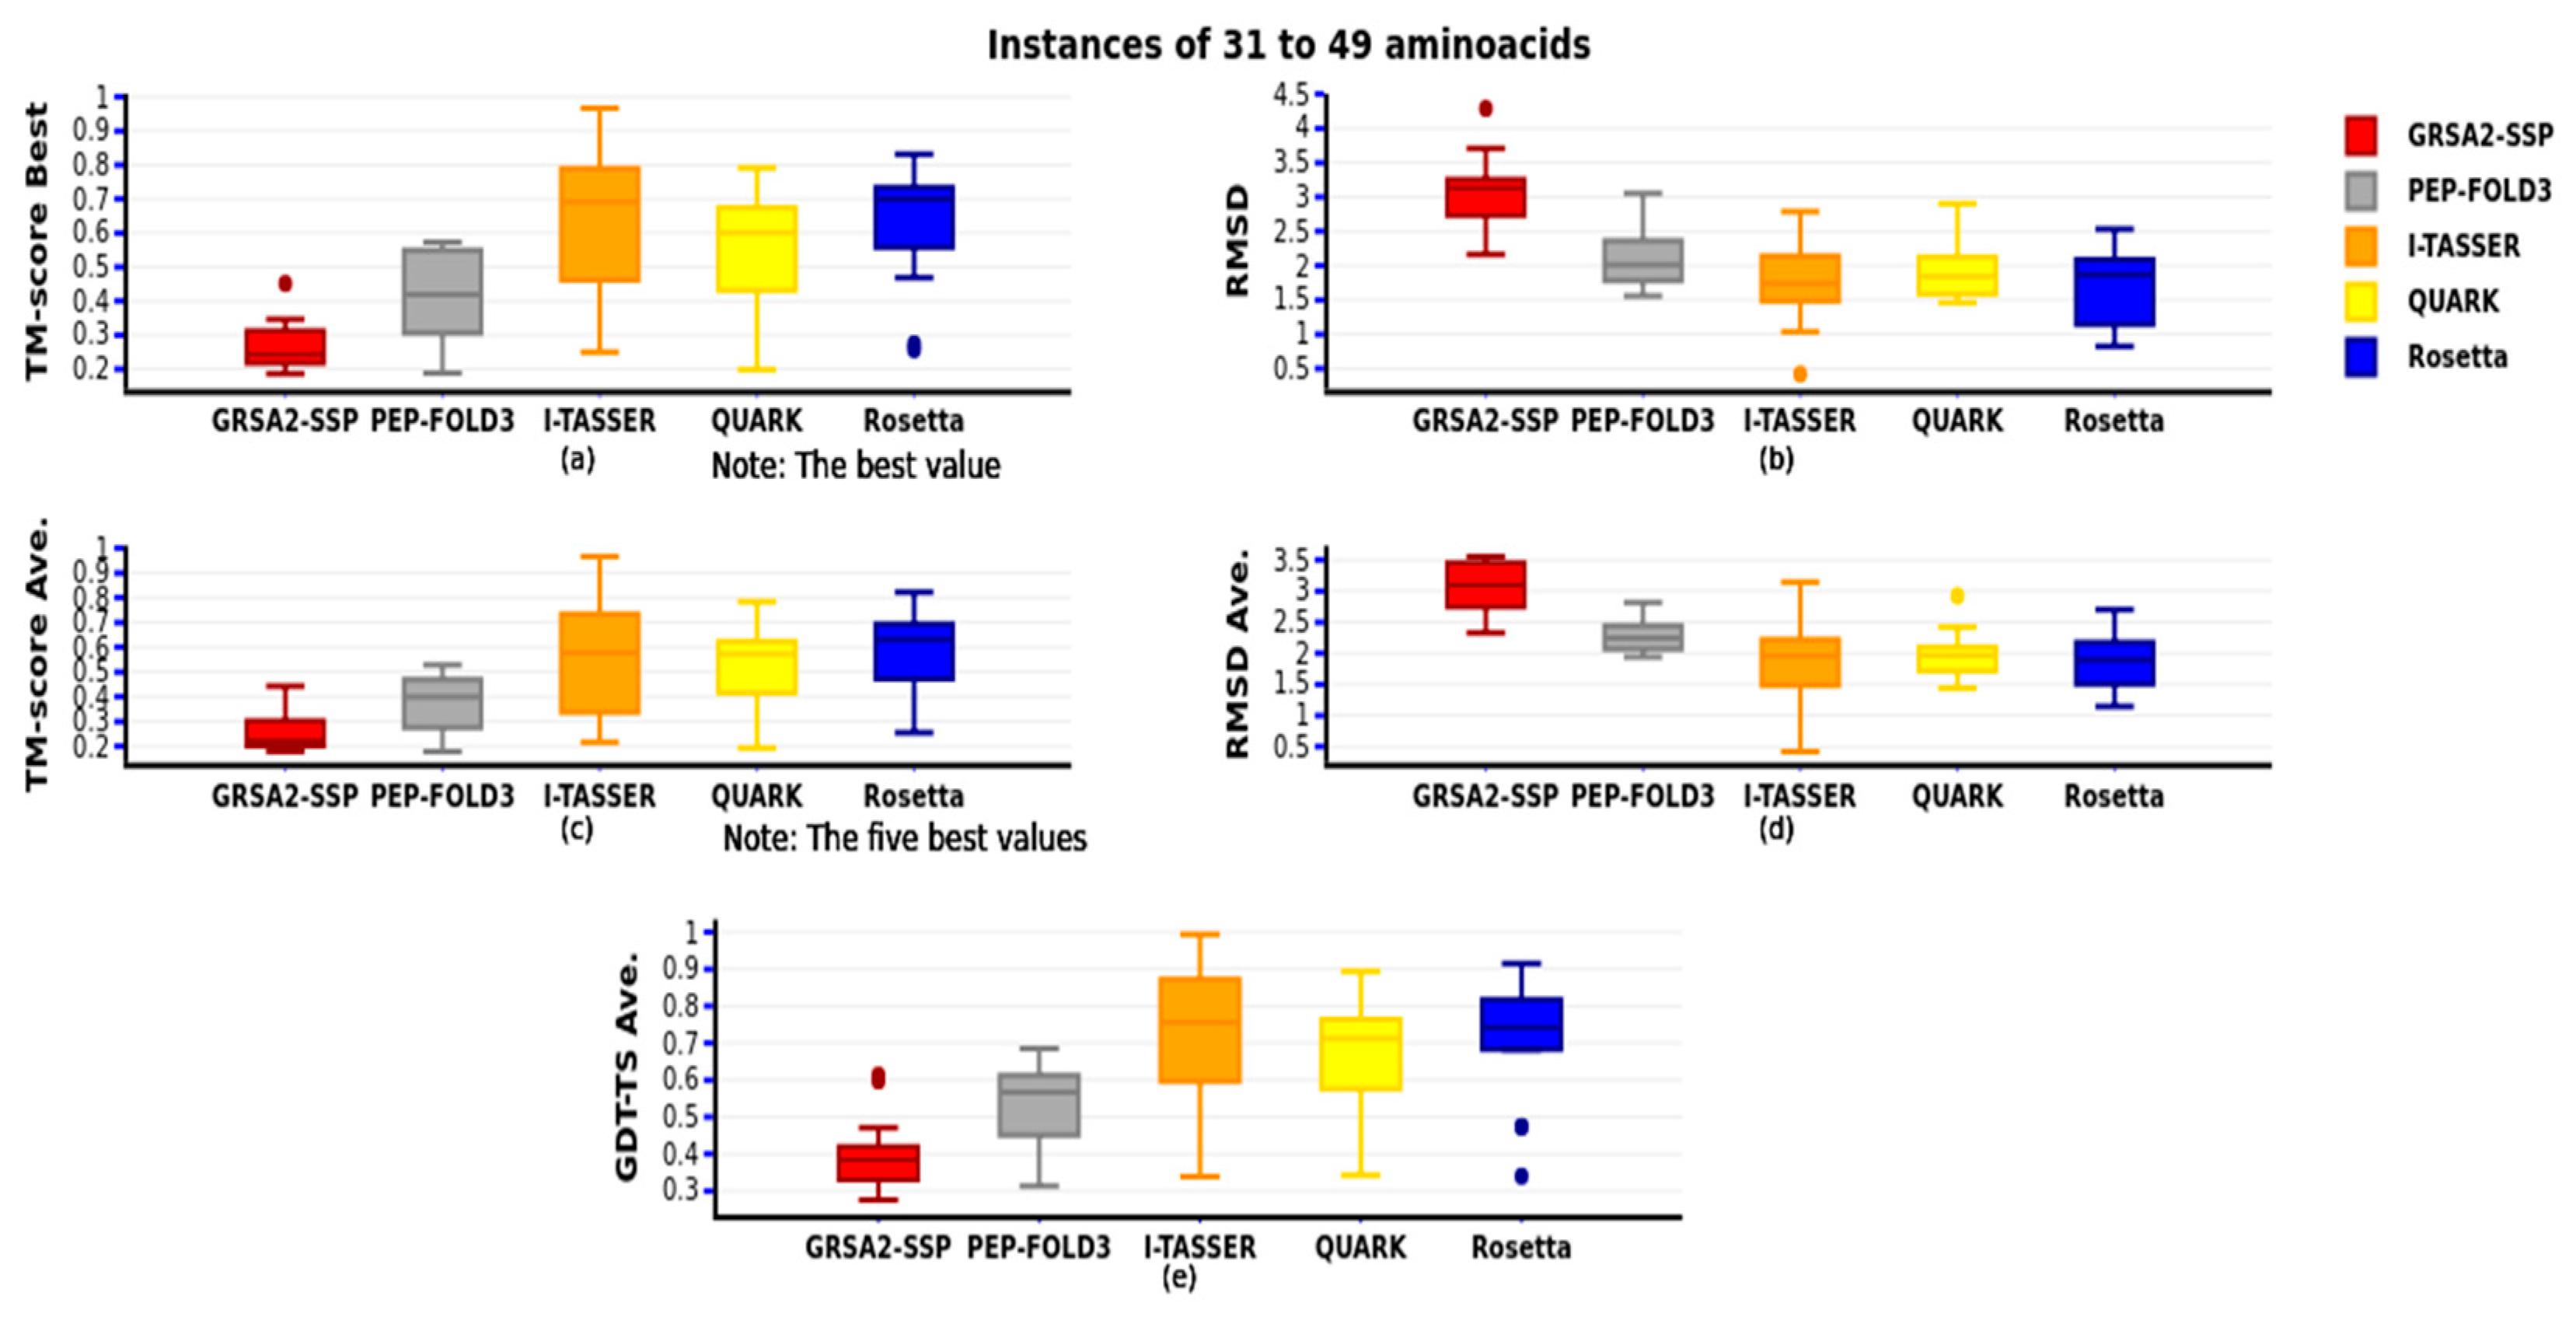
Figure 11 compares the third group of 31 to 49 amino acids with the five best results obtained using the TM-score metric and their RMSD y GDT-TS. This comparison added the Rosetta approach because it can process the number of aa in this group. As we observe, the best algorithm is I-TASSER, followed by Rosetta, QUARK, PEP-FOLD3, and finally GRSA2-SSP.
The 45 instances evaluated in the below experimentation show the application of the secondary structure results and refine them with the GRSAX algorithms, enhancing the performance in energy, RMSD, and TM-score. Specifically, when GRSA2-SSP is compared with PEP-FOLD3, I-TASSER, QUARK, and Rosetta, we observed that our algorithm performs well in small instances (Group 1 and 2). Nevertheless, in the largest instances, our algorithm is not the best, but it is competitive.
We carried out a second experimentation with six mini-proteins (5wll, 5lo2, 5up5, 5uoi, 2ki0, and 2kik) presented in
Table 3. The mini-proteins come from the de novo protein design field [
74,
75,
76,
77,
78]. This data set was proposed to observe the behavior of our best algorithm in these kinds of instances.
We applied the same evaluation of all the algorithms, as in the first experimentation, using RMSD, TM-score, and GDT-TS metrics.
Table 4 shows the results of all the algorithms in this data set. Evaluating them with TM-score and GDT-TS, we observe that the best algorithms were Rosetta, I-TASSER, and GRSA2-SSP, where the number of times the best results were achieved 3, 2, and 1, respectively. Additionally, evaluating with the RMSD, the best algorithms were again Rosseta, I-TASSER, and GRSA2-SSP, but this time they obtained the best results in two instances, which were (5uoi, 2kik), (2ki0, 5up5), and (5wll, 5lo2), respectively. As a result, we can say that Rosetta is the best algorithm, followed by I-TASSER, and GRSA2-SSP.
5. Conclusions
In this paper, we present the methodology GRSA-SSP for Protein Folding Problem applied to peptides. The objective of this problem is to predict the functional tridimensional protein structure. The algorithms developed with this methodology are GRSA0-SSP, GRSA1-SSP, GRSAE-SSP, and GRSA2-SSP. The main relevance of the algorithm GRSA2-SSP, developed with this methodology, is that it produces very good results in the case of peptides; specifically, it is similar or better than the algorithms Rosetta, PEP-FOLD3, QUARK, and I-TASSER for the small and medium peptides, according to the experimentation presented. The last algorithms have traditionally been among the best of the CASP competition; besides, they use modern machine learning techniques like artificial neural networks.
We compared the algorithms developed with the original algorithms GRSA0, GRSA1, GRSAE, and GRSA2; we used a data set of 45 instances for this comparison. We showed that the hybrid algorithms produced with the GRSA-SSP methodology outperform the original ones. For this comparison, we used the metrics Energy, RMSD, TM-score, and execution time. We observed that the best of all these algorithms is GRSA2-SSP formulated with the proposed methodology.
We made a second evaluation comparing the GRSA2-SSP algorithm with the best state-of-the-art algorithms (we used the same data set of 45 instances). We selected for this comparison PEP-FOLD3, I-TASSER, QUARK, and Rosetta. We used a data set of forty-five instances divided into three groups, from small to large peptides. The experimentation shows that for groups 1 and 2, GRSA2-SSP performs as well as these algorithms. We observe that for the first group PEP-FOLD3 was the best, followed by GRSA2-SSP, while in the second group, the best algorithm was I-TASSER followed by GRSA2-SSP and PEP-FOLD3. Finally, in the third group, the best algorithm was Rosseta, followed by I-TASSER. Additionally, we present an analysis of GRSA2-SSP results for each type of secondary structure, obtaining a better behavior with alpha structures.
Furthermore, we assessed GRSA2-SSP with a second data set of six instances named mini proteins. The GRSA2-SSP results were compared with PEP-FOLD3, I-TASSER, QUARK, and Rosetta. The best algorithms in this data set were Rosetta, I-TASSER, and GRSA2-SSP because the number of times the best TM-score and GDT-TS were 3, 2, and 1, respectively. However, each of the three achieved two times the first place when RMSD was evaluated. As a result, the best of these algorithms for this data set is Rosetta, followed by I-TASSER and GRSA2-SSP.
We conclude that GRSAX-SSP algorithms enhance the original GRSA algorithms. The best of them is GRSA2-SSP which achieves very good results, surpassing the best state-of-art for peptides up to thirty amino acids. Finally, we note that the main advantage of our methodology is that it is simpler than the most powerful approaches of the literature.


 ,
, 


