Article

Determination of the Loading Capacity and Recovery of Extracellular Vesicles Derived from Human Embryonic Kidney Cells and Urine Matrices on Capillary-Channeled Polymer (C-CP) Fiber Columns

by
Lacey S. Billotto
,
Kaylan K. Jackson
and
R. Kenneth Marcus
*
Department of Chemistry, Biosystems Research Complex, Clemson University, Clemson, SC 29634-0973, USA
*
Author to whom correspondence should be addressed.
Separations 2022, 9(9), 251; https://doi.org/10.3390/separations9090251
Submission received: 2 August 2022 / Revised: 30 August 2022 / Accepted: 1 September 2022 / Published: 7 September 2022
(This article belongs to the Special Issue Feature Papers in Separations from Editorial Board Members)

Abstract

:
Extracellular vesicles (EVs) are 50–1000 nm membranous vesicles secreted from all cells that play important roles in many biological processes. Exosomes, a smaller-sized subset of EVs, have become of increasing interest in fundamental biochemistry and clinical fields due to their rich biological cargos and their roles in processes such as cell-signaling, maintaining homeostasis, and regulating cellular functions. To be implemented effectively in fundamental biochemistry and clinical diagnostics fields of study, and for their proposed use as vectors in gene therapies, there is a need for new methods for the isolation of large concentrations of high-purity exosomes from complex matrices in a timely manner. To address current limitations regarding recovery and purity, described here is a frontal throughput and recovery analysis of exosomes derived from human embryonic kidney (HEK) cell cultures and human urine specimens using capillary-channeled polymer (C-CP) fiber stationary phases via high performance liquid chromatography (HPLC). Using the C-CP fiber HPLC method for EV isolations, the challenge of recovering purified EVs from small sample volumes imparted by the traditional techniques was overcome while introducing significant benefits in processing, affordability (~5 $ per column), loading (~1012 particles), and recovery (1011–1012 particles) from whole specimens without further processing requirements.

Graphical Abstract

1. Introduction

Extracellular vesicles (EVs), originally considered to be “cellular dump trucks”, are a heterogeneous population of phospholipid bilayer membrane-bound vesicles actively released by all cell types [1]. Typically ranging from 50–1000 nm in diameter, EVs contain proteins, DNA, mRNA/miRNA, and other noncoding RNAs from their host cells [2,3,4,5]. They also serve as biomolecule transportation vehicles because of their ability to strategically deliver relevant molecules to local and distant cells [2,3,4,5]. EVs are generally classified into three broad categories: exosomes (30–200 nm), microvesicles (100–1000 nm), and apoptotic bodies (>500 nm) [2,3]. However, due to limitations in current isolation methods, it is difficult to differentiate exosomes from other microvesicles due to size/density overlap, and the lack of immediate information needed to distinguish between the vesicle development pathways; therefore, the generic term “EVs” is used here.
Because of their relative abundance in biological fluids and characteristic components, many attempts have been made to implement EVs for several promising applications. EVs have been suggested as candidates for use as vectors in gene [6,7] and drug therapies [8,9,10,11], liquid biopsy diagnostic markers [12,13], and even as components in cosmetics [10,14]. However, the broad translation of EVs into these areas remains limited due to the lack of understanding of EV fundamentals resulting from the inability to obtain highly concentrated and pure EV yields [14,15]. Standard approaches for EV isolations have included ultracentrifugation (UC), size-exclusion chromatography (SEC), ultrafiltration (UF), immunoaffinity (IAF), and polymer precipitation (PP)-based isolation methods [2,3]. Of these, the UC method is commonly regarded as the “gold standard” EV isolation technique [2,3,16]. However, this method, like the others, is limited by low yield recoveries, co-isolation of protein/lipoprotein aggregates, low throughput, high capital costs, and potential disruption of EV membrane structures due to the extreme centrifugal forces required [2,3,16]. Many of the aforementioned isolation methods require biofluid sample volumes of 5–10 mL, at minimum. Few EV isolation methods are suitable for processing sample volumes across the sub-mL to 100 mL range. In the case that liters of EV-rich cell cultures are employed in vector production, multiple isolation methods are likely required [3]. For context, Aronin, Khvorova, and colleagues [14,17,18,19,20,21], commented on a study, noting that a single dose of exosomes for a single mouse transfusion requires 109–1011 particle concentrations, which would require liters of conditioned media to isolate the dose necessary to treat one animal. Typically, the low EV recoveries produced by traditionally used isolation methods are simply not fit for translation into research, clinical, or therapeutic EV applications, and insufficient EV purities complicate the generation of a necessary understanding of EV fundamentals.
As an alternative, Dittmer and colleagues combined cross-flow filtration (CFF)/polyethylene glycol (PEG) and Capto Core SEC to produce biologically active EVs of concentrations up to 1014 EV mL−1 from 1 L of cultured body cavity-based lymphoma-1 cells [22]. While this method did indeed produce concentrated EV recoveries, there were concerns of contamination and protein-lipoprotein co-isolation, despite employing three different isolation methods [22]. Thus, simple, robust, and high-throughput EV isolation methods are needed that are not limited by cost, long, laborious processing times, purity, and yield restraints. Of much interest is the development of an EV isolation method able to load and recover highly concentrated, pure populations of EVs repeatedly from sample volumes on the µL to mL, and eventually liter, scales.
To address the prevalent limitations of available isolation methods, Marcus and co-workers [23,24,25,26,27,28,29,30,31,32] developed a hydrophobic interaction chromatography (HIC) method for the isolation and purification of EVs from a variety of complex biological matrices. The HIC method is performed on polyester (PET) capillary-channeled polymer (C-CP) fiber stationary phases, providing unique benefits in terms of low solvent transport impedance and highly efficient solute mass transfer versus other chromatographic stationary phases [33,34,35,36,37,38]. PET C-CP fiber phases have been successfully employed for EV isolation in conventional HPLC column [23,24,25,30], and solid-phase extraction (SPE) spin-down tip formats [31,32,39]. Using these methods, EVs have been successfully isolated from a plethora of biofluids, including cell culture media, plasma, serum, urine, unpasteurized goat milk, cervical mucus, and saliva [27,29,30]. Most importantly, high efficiency and throughput HIC C-CP methods have allowed for concentrated EV recoveries to be obtained (1010 to 1012 particles mL−1), with up to 95% recovery from the original matrices despite the great chemical and physical matrix complexities and the use of 10–100 mL sample volumes [29]. Further, the C-CP phases have allowed for EV isolations to be performed on reasonable time-scales (<15 min), with recovered populations free from low-density lipoprotein (LDL) contaminants [30], as well as the retention of biological integrity and purity of EVs as confirmed by immuno/protein-assays and electron microscopy techniques [29,30].
One of the major concerns for the use of EVs in therapeutics and as clinical diagnostic tools is the demand for isolation methods that can efficiently harvest the vesicles from complex biological matrices. Here, we compare the loading and recovery characteristics of these capillary-scale (300 mm long × 0.76 mm diameter) C-CP fiber columns for two disparate, yet very relevant systems: serum-free, suspension-adapted human embryonic kidney cell (HEK293T/17 SF) culture milieu and human urine. Due to their rapid proliferation, high EV yield, and ability to be genetically manipulated, HEK293T/17 SF cells have been used as producer cells for large-scale production of concentrated EVs for therapeutic vector applications [40,41,42,43,44,45]. Human urine represents the ideal case of a liquid biopsy, where the relative abundance and non-invasive collection of urine makes it an ideal source of biomarkers to diagnose and classify diseases, especially for screening large populations [46,47]. However, both specimens present complex matrices that make it difficult to isolate EVs in high purity. The novelty of this effort lies in the direct comparison of isolation characteristics from these two important matrices, on volume and time scales of relevance to diverse research communities. To determine the loading and recovery characteristics of EVs, frontal analysis (breakthrough curves) and elution recovery experiments were performed. Experimental variables included the load and elution flow rates as well as the primary EV concentrations. Transmission electron microscopy (TEM) was used to confirm the physical integrity and size of the EVs. By determining the loading, recovery, and throughput of EVs from these complex biological samples using the fiber stationary phases, the present work sets the groundwork for additional scale-up processes using the fibers. These efforts will advance fundamental research, clinical analysis, and therapeutic vector aspects of EV utilization.

2. Experimental

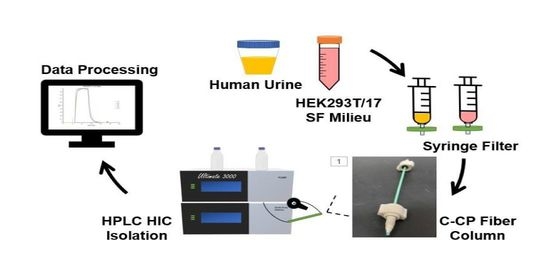
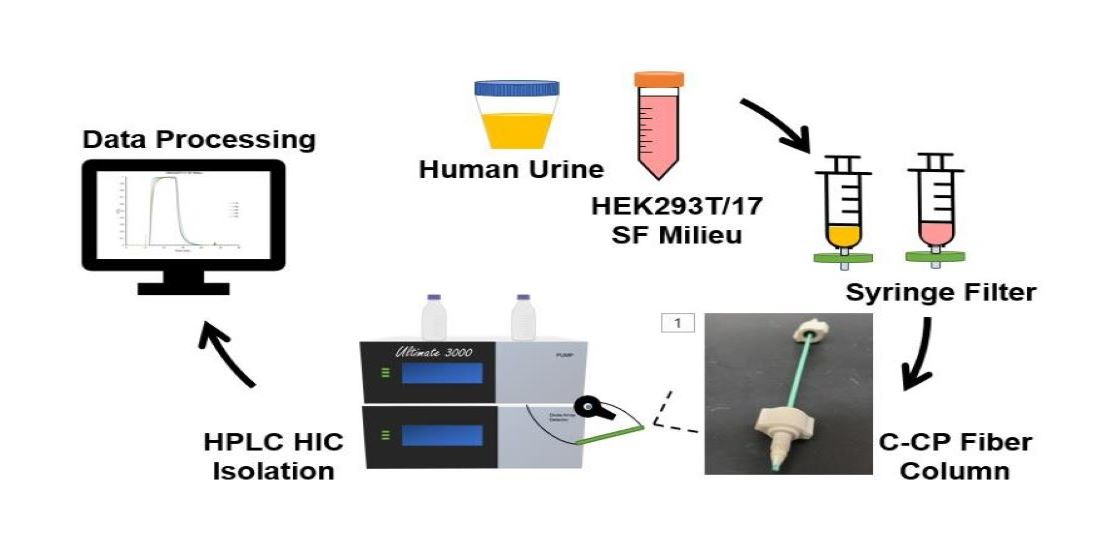
2.1. Chemicals and Sample Preparation

Ultrapure-grade ammonium sulfate and HPLC-grade acetonitrile (ACN) were purchased from VWR (Solon, OH, USA). Phosphate buffered saline (PBS) (10x; Life Technologies Corporation, Grand Island, NY, USA) was diluted to 1x with deionized water (18 M Ω cm) obtained from a Millipore water system (Billerica, MA, USA). Commercial lyophilized exosomes derived from the cell culture media of human embryonic kidney (HEK293) cells and the urine of healthy donors (HansaBioMed Life Sciences, Tallinn, Estonia) were reconstituted according to the manufacturer’s instructions using sterile Milli-Q water to provide a concentration of ~3.6 × 10¹¹ particles mL−1 and ~3.3 × 10¹² particles mL−1, respectively. The commercially available exosomes were utilized as “standards” for quantification efforts (with the understanding that these are not certified as a reference standard). No information regarding purity or classification was provided by the manufacturer.
A human embryonic kidney cell line (HEK293T/17 SF), which was modified to a serum-free, suspension-adapted culture environment (to avoid the limitations of using fetal bovine serum) was obtained from the American Type Culture Collection (ATCC, Manassas, VA, USA) [48,49,50]. As previously described [48], the HEK293 cells were grown in BalanCD HEK293 cell culture media (Irvine Scientific, Santa Ana, CA, USA) supplemented with L-glutamine (8 mM) and insulin-transferrin-selenium (ITS) (10 mL mL−1) (Corning, Corning, NY, USA). The culture flask was placed in a 37 °C shaking incubator (160 rpm) with 5% CO2. To monitor the concentration and viability of the cell line, a VI-CELL XR Cell Viability Analyzer (Beckman Coulter, Brea, CA, USA) employing the trypan blue dye exclusion method was used. All milieu samples were filtered with a 0.22 mm PES syringe filter prior to use. In terms of the human urine matrix sample, fresh morning urine from a healthy, consenting donor was obtained and filtered with 0.2 mm PES filters before use. No other sample manipulations were performed.

2.2. Chromatographic Columns

The PET C-CP fibers were extruded in the Department of Material Science and Engineering at Clemson University. To create the capillary column, 448 PET C-CP fibers were collinearly aligned and pulled through a 30 cm polyether-ether-ketone (PEEK) tube with an inner diameter of 0.76 mm (IDEX Health & Science LLC, Oak Harbor, WA, USA). The capillary column had a bed volume of 0.0817 mL and a total fiber surface area of 0.384 m2. Following packing, the column was mounted on the HPLC system and washed successively with DI-H2O, ACN, and DI-H2O at a flow rate of 0.5 mL min−1, until a stable absorbance baseline was achieved at 216 nm to ensure anti-static coatings applied to the fiber during the production (extrusion/drawing) process were removed.

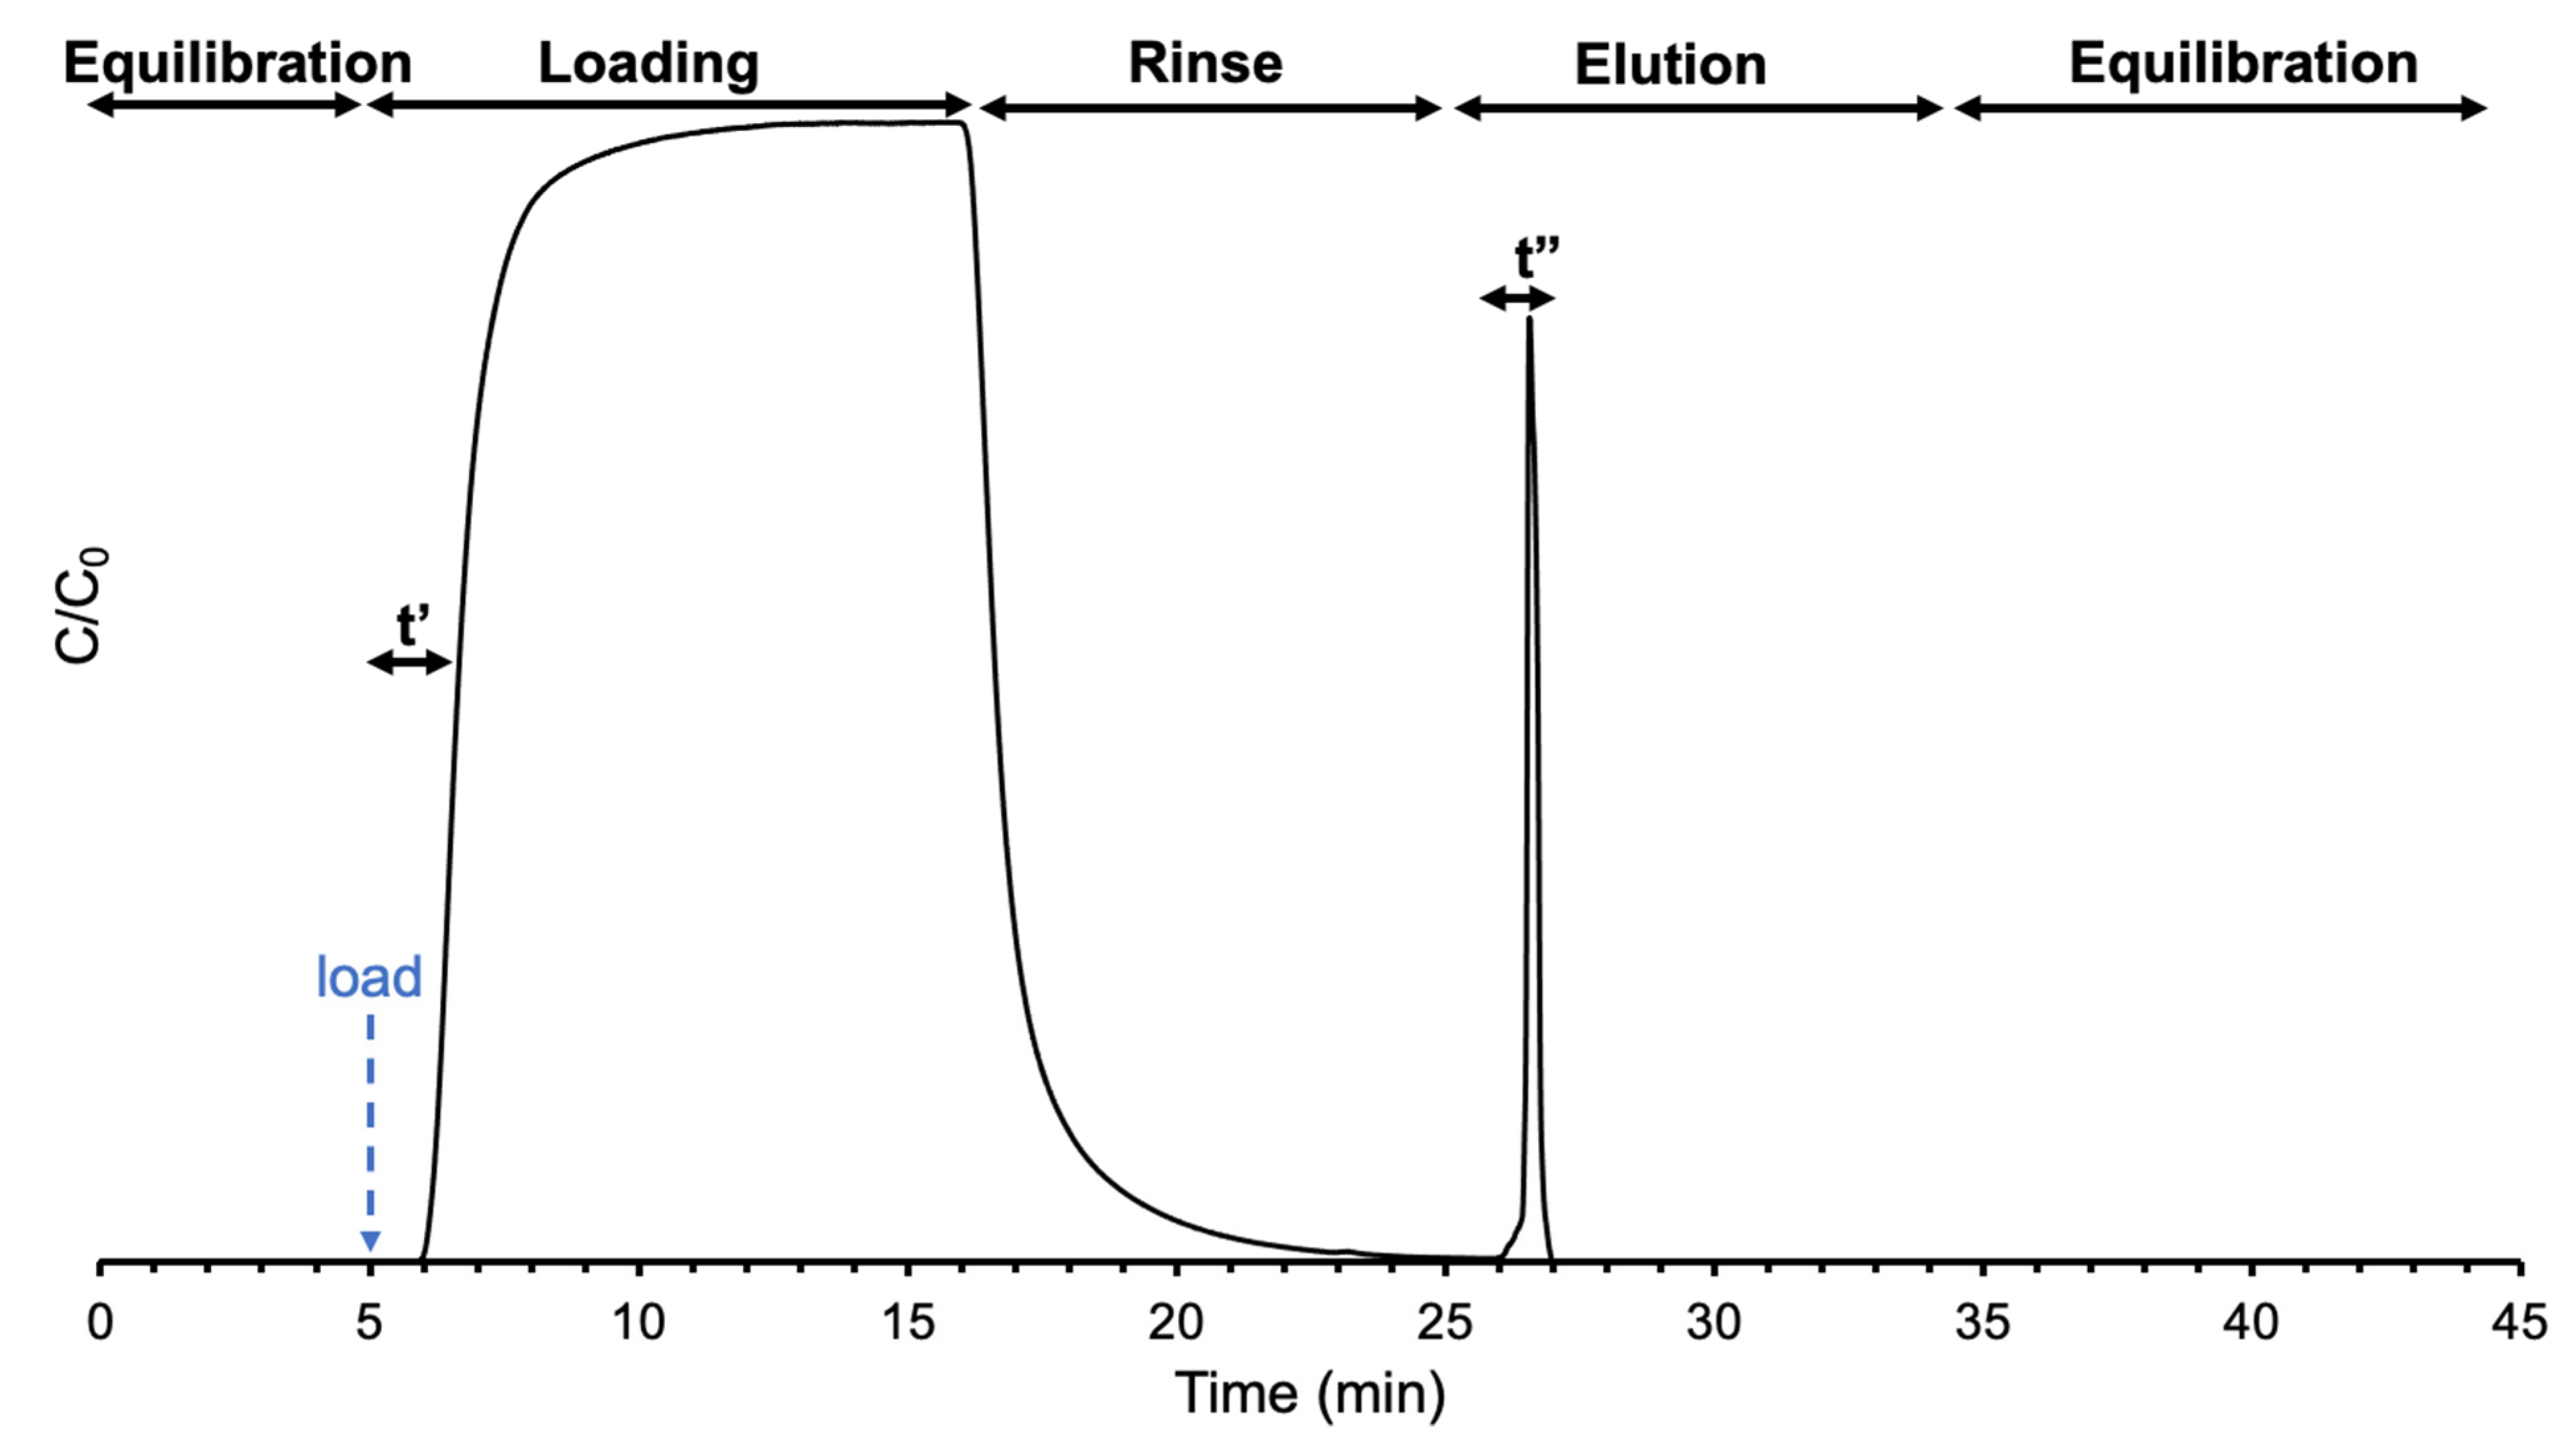
2.3. Instrumentation and Methods

All chromatographic measurements were performed on a Dionex Ultimate 3000 HPLC system (LPG-3400SD quaternary pump and MWD-3000 UV-Vis absorbance detector; Thermo Fisher Scientific, Sunnyvale, CA, USA) controlled by the Chromeleon 7 software. UV-Vis absorbance at 216 nm was used for all post-column detection and analysis. However, 280, 203, and 254 nm were also monitored due to previous studies citing EV detection at these wavelengths [23,27].
A NanoVue Plus spectrophotometer (GE Healthcare; Chicago, IL, USA), set to measure absorbance at 216 nm, was used for the method of standard addition to determine the concentration of EVs in the primary human urine sample [29]. As presented and validated previously with complex human biofluid samples [29], the method of standard addition was used here to determine the concentration of EVs in the HEK293T/17 SF milieu and human urine sample types, where known volumes and concentrations of the EV standards (3.6 × 10¹¹ and 3.3 × 10¹² particles mL−1, respectively) were spiked into the unknown sample. Briefly, three 2 μL aliquots of the HEK293T/17 SF milieu and urine (diluted 1:10 in 1x PBS) were spiked once, twice, and three times with the diluted EV standards (ranging from 3.6 × 10¹¹ particles mL−1 to 1.1 × 10¹² particles mL−1 and 6.6 × 10¹⁰ particles mL−1 to 1.9 × 10¹¹ particles mL−1, respectively). The total sample volume was then adjusted to 20 μL using 1x PBS. The NanoVue spectrophotometer measured the absorbance of each sample at 216 nm (n = 5). The linear regressions for the milieu (R2 = 0.9996) and the urine (R2 = 0.9863) were extrapolated and used to determine the concentration of EVs in HEK293T/17 SF milieu and the human urine samples as 1.5 × 10¹² and 1.2 × 10¹² particles mL−1, respectively.
Frontal loading and elution recovery (load/elute) studies were employed under HIC processing conditions, as visually represented in Figure 1. Buffer A (2.0 M (NH4)2SO4 dissolved in 1x PBS, pH = 7.4) was used as the loading medium, and buffer B (40% v/v ACN in 1x PBS, pH = 7.4) was used as the EV elution buffer [30,51]. For the load step, each biofluid was introduced (at t = 5 min) continuously in a 50:50 mixture of the loading: elution buffer (i.e., 1 M (NH4)2SO4: 20% v/v ACN in PBS, pH = 7.4) and held for a ~10 min window. This set of solvent conditions allows for the passage of salts, small organic molecules, and concomitant proteins, so that only the target EVs are retained [26]. As seen in the following chromatograms, the 10 min load step was more than sufficient to achieve breakthrough. For the rinse step, the same 50:50 mixture of the two bio-fluid free buffers was applied for ~5 min to remove lingering proteins on the fiber surface. As depicted in the chromatograms, little to no protein elution was observed. Finally, buffer B was employed for the elution of EVs, again for ~15 min, to ensure the EV elution peak had adequate time to return to baseline, a time more than sufficient under all experimental conditions. To ensure the column was re-equilibrated prior to the next run, two 5-min runs of the biofluid-free 50:50 mixture of buffers A and B were added at the beginning and end of each experimental run. The entire gradient program for the capillary column was ~40 min. It is recognized that the respective solvent windows were more than sufficient for the individual processes, and so there are opportunities for future improvement aspects relative to process throughput.
Frontal loading experiments were used to assess the EV adsorption and determine the dynamic binding capacities for the EV populations on the C-CP fiber stationary phase [35,52,53,54,55,56]. The current work builds on previous work to examine the capability of the C-CP fibers to load and recover EVs from complex matrices [26]. Therefore, to maintain consistency in comparison with earlier efforts, the throughput (T) and yield (Y), calculated as described by Singh and Pinto [57], were employed as the figures of merit in the present work. Frontal analysis first allows for the determination of the amount of adsorbed solute (Q′) based on its concentration (mg mL−1), the delivery rate (mL min−1), and the time (t′ in min) to reach the point at which the absorbance value at the column exit reaches one-half of the value of the maximum value following column saturation (C/C0 = 0.5), as depicted in Figure 1. The process throughput ( T ) is a measure of the ability to adsorb and recover the solute, as expressed in Equation (1), where the amount recovered (Q′) is determined via the standard addition approach, and the elution time (t″) is added as the time necessary to complete the recovery.
T   m g   m i n 1 = Q t + t
Percentage yield (Y) is a measure of the efficiency of recovering the adsorbed solute as depicted in Equation (2), computed as the amount of EVs recovered (Q) divided by the amount of EVs loaded (Q′) multiplied by 100.
Y % = Q Q ×   100
A Hitachi HT7830 UHR 120 kV TEM was used to verify the physical integrity and size of the EVs. To prepare samples for TEM imaging, 5 mL aliquots of the EV-containing samples were drop-cast onto a carbon grid and allowed to sit at ambient temperature (~28 °C) for 20 min. The grid was then blotted dry and washed with water for 2–3 s before being blotted dry again. The grids were then fixed in 2% paraformaldehyde for 5 min and washed in water for 2 min. Finally, the grids were stained in 1% uranyl acetate for 15 s before being blotted, washed in water, and allowed to dry in a desiccator at room temperature (~28 °C) prior to imaging. With TEM imaging, the size (30–200 nm) and the well documented cup-shape morphology of the vesicles was determined for each sample and compared to the commercially available exosomes derived from both the HEK293 cell culture media and human urine. As such, and based on extensive previous experience [27,29], it was assured that the load/elution conditions provided for recoveries of intact vesicles.

3. Results and Discussion

Previously, multiple studies have illustrated the efficacy of the HIC processing protocol to yield EVs that maintain their native vesicular physical structure while retaining their surface bioactivity as measured by immunoassays towards surface proteins such as tetraspanins CD9 and CD81 [29,32]. Likewise, mass spectrometric proteomic analyses have demonstrated the ability of the HIC protocol to achieve high purity levels with respect to host cell proteins, lipoproteins, and other non-EV cellular components [28,30]. Therefore, the premise was to evaluate the relative processing characteristics of throughput and yield in obtaining the highest quantities of EVs per unit of processing time, a major limitation in other isolation procedures.

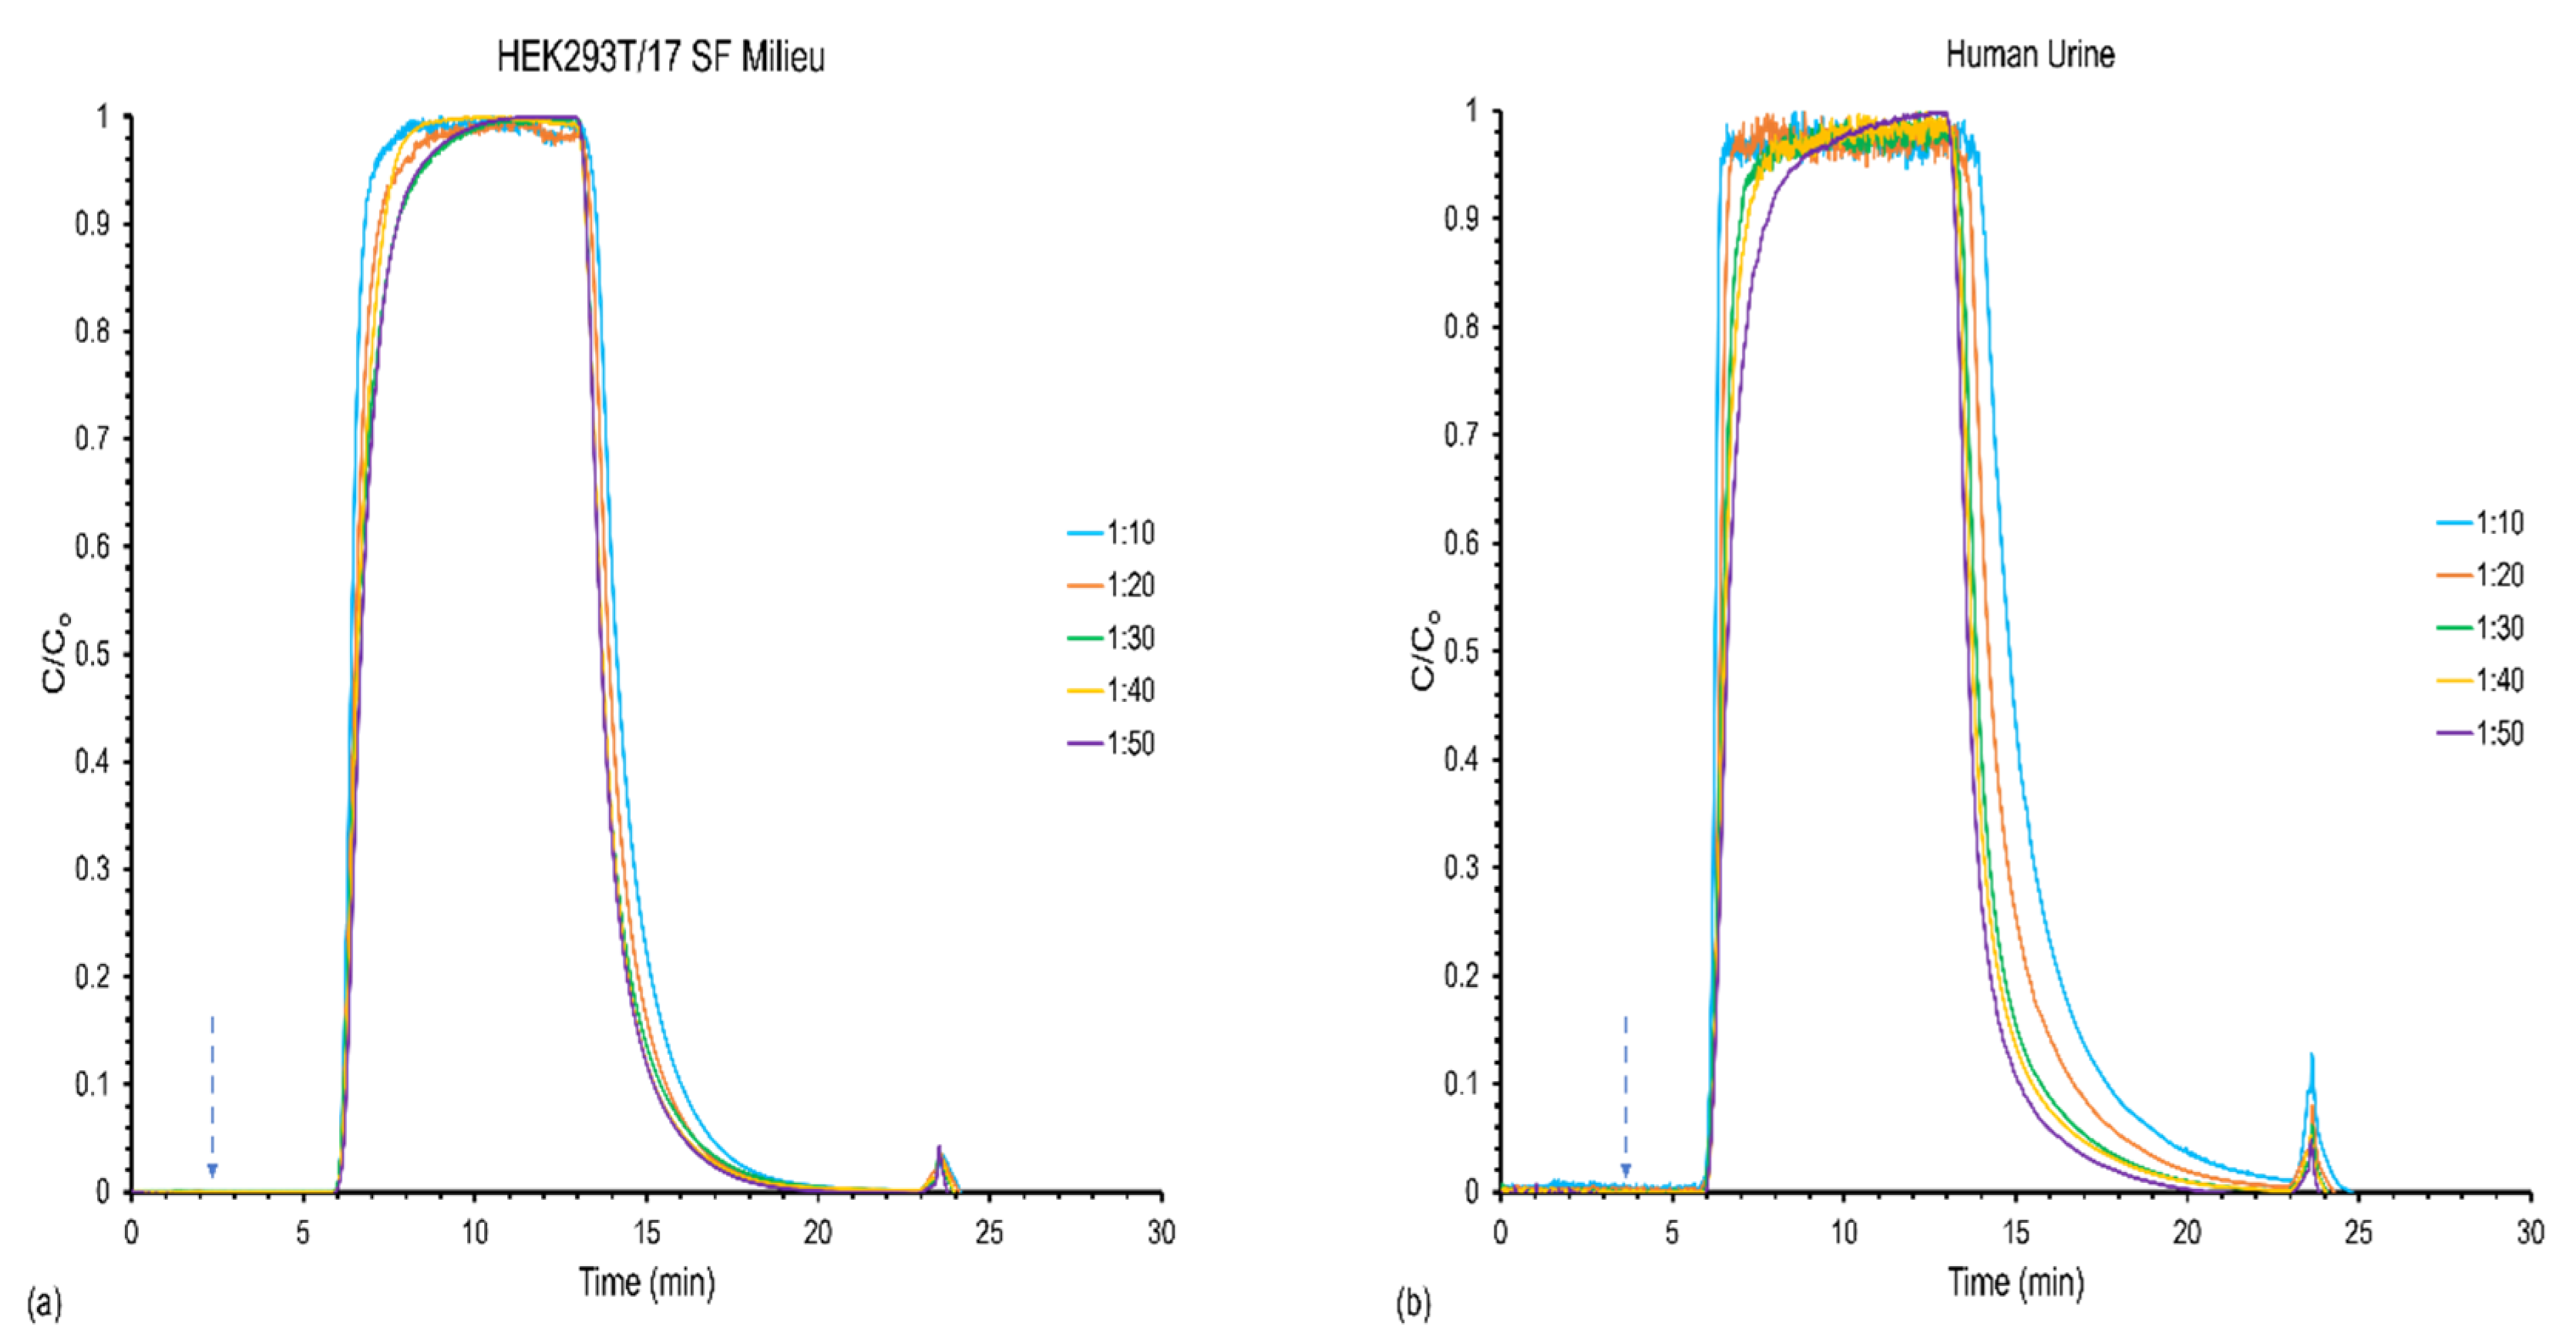
3.1. Effect of Feed Stock Concentration on Column Capacity, Recovery, and Yield

As a point of characterization for the capillary columns, the effect of the EV feed concentration on frontal throughput and yield was analyzed. The concentration of solutes in a surface adsorption process effects both the kinetics of adsorption as well as the potential for competition amongst the solutes for surface binding sites. As alluded to previously, for these respective sample types, cell culture media would pose a far greater challenge for EV adsorption than the human urine. Specifically, the milieu presents a solution of far higher density and viscosity, and having a free protein content, while the human urine has a much higher salinity/osmolality.
Naturally, the time required to reach saturation is inversely related to the solute concentration for a given sample matrix. For the present work, EV concentrations ranging from ~3.1 × 10¹⁰ to 1.5 × 10¹¹ particles mL−1 for the HEK293 milieu, and ~2.4 × 10¹⁰ to 1.2 × 10¹¹ particles mL−1 for the human urine were loaded at a relatively mid-range flow rate of 0.5 mL min−1 (U0 = 31 mm s−1). Presented in Figure 2 are representative load/elute profiles for the various solute load conditions, where the lower feed concentrations (plotted here as a function of the stock solution dilution factors) took longer times to reach the target C/C0 = 0.5 values, as expected. Qualitatively, the responses mimic what was realized in previous work by Marcus et al. in which nylon-6 was used as the stationary phase for a frontal loading analysis of proteins (in neat PBS stock solutions) under the HIC conditions [35]. The more dilute solutions show greater rounding of the responses as they approach saturation, a reflection of the lower rates of diffusional transport of the EVs at lower concentration. The final qualitative features depicted in the load/elute profiles are the elution bands of the solutes following the step change in solvent conditions towards EV release. Here, it is very clear that the vesicle recoveries from the urine matrix are more efficient based on the absorbance values/peak areas, which is likely a matrix effect presented by the far more complex cell milieu than for urine. It is also important to point out that, based on the flow rates and concentrations, the method easily processes sample volumes of the order of 0.5 mL for each matrix.
The quantitative results of the load/elute studies for the various concentrations of the milieu and urine samples are presented in Table 1. First, when considering the capture/recovery aspects of the cell milieu sample, it is easily seen that the actual EV loading capacities under these hydrodynamic conditions are invariant with the solute concentrations. To a first level approximation, this is viewed to be a very positive attribute in terms of realizing uniform utilization of the fiber capture surface. As a general observation, the binding capacities of ~5 × 10¹² particles on the 30 cm long fiber columns are very consistent with previous C-CP column loading studies of Chinese hamster ovary (CHO) cell bioreactors [26]. A very different response is seen when comparing the respective recoveries of the EVs deposited at different concentration levels. In this case, the respective recoveries are inversely related to the stock solution concentrations, with the percentage yield for the highest dilution factor approaching 44%, while that for the most concentrated load solution is a meagre 5%. Despite the method of loading under conditions that would allow cell debris and proteins to pass unretained, there is clearly a difference in the ability to recover the captured EVs. An initial hypothesis as to why this might be the case is that the higher density milieu solutions may present conditions wherein the EVs either exist as condensates in the initial solution, or form so they are adsorbed onto the surface. In either case, a far more hydrophobic entity would result, which may not be released from the fiber surface. As a final observation, it is relevant to note the precision of triplicate measurements improved with the extent of the stock solution dilution, which is attributed to the decreased complexity of the milieu media upon dilution.
In contrast to the milieu sample, the data for human urine matrix presented in Table 1 reflects some similar and different trends. First, and highly significant, the determined column binding capacities of ~4 × 10¹² particles are virtually the same as for the more complex matrix. This fact argues strongly to the effectiveness of the EV loading conditions in promoting the through-passage of media components while retaining the target vesicles. Second, the measurement precision for the adsorption step is far better for the simpler urine matrix. Indeed, the complexity of the milieu sample is reflected in the respective backpressures during the load steps, where those of the milieu are ~20% greater than for the urine, being ~525 vs. 450 psi at 0.5 mL min−1. Third, and in contrast to the milieu samples, the recoveries/yields for the urine-derived EVs are the highest for the most concentrated load solutions. Given that the respective numbers of adsorbed EVs are the same among the dilutions, suggests that some form of experimental determinate error is occurring.

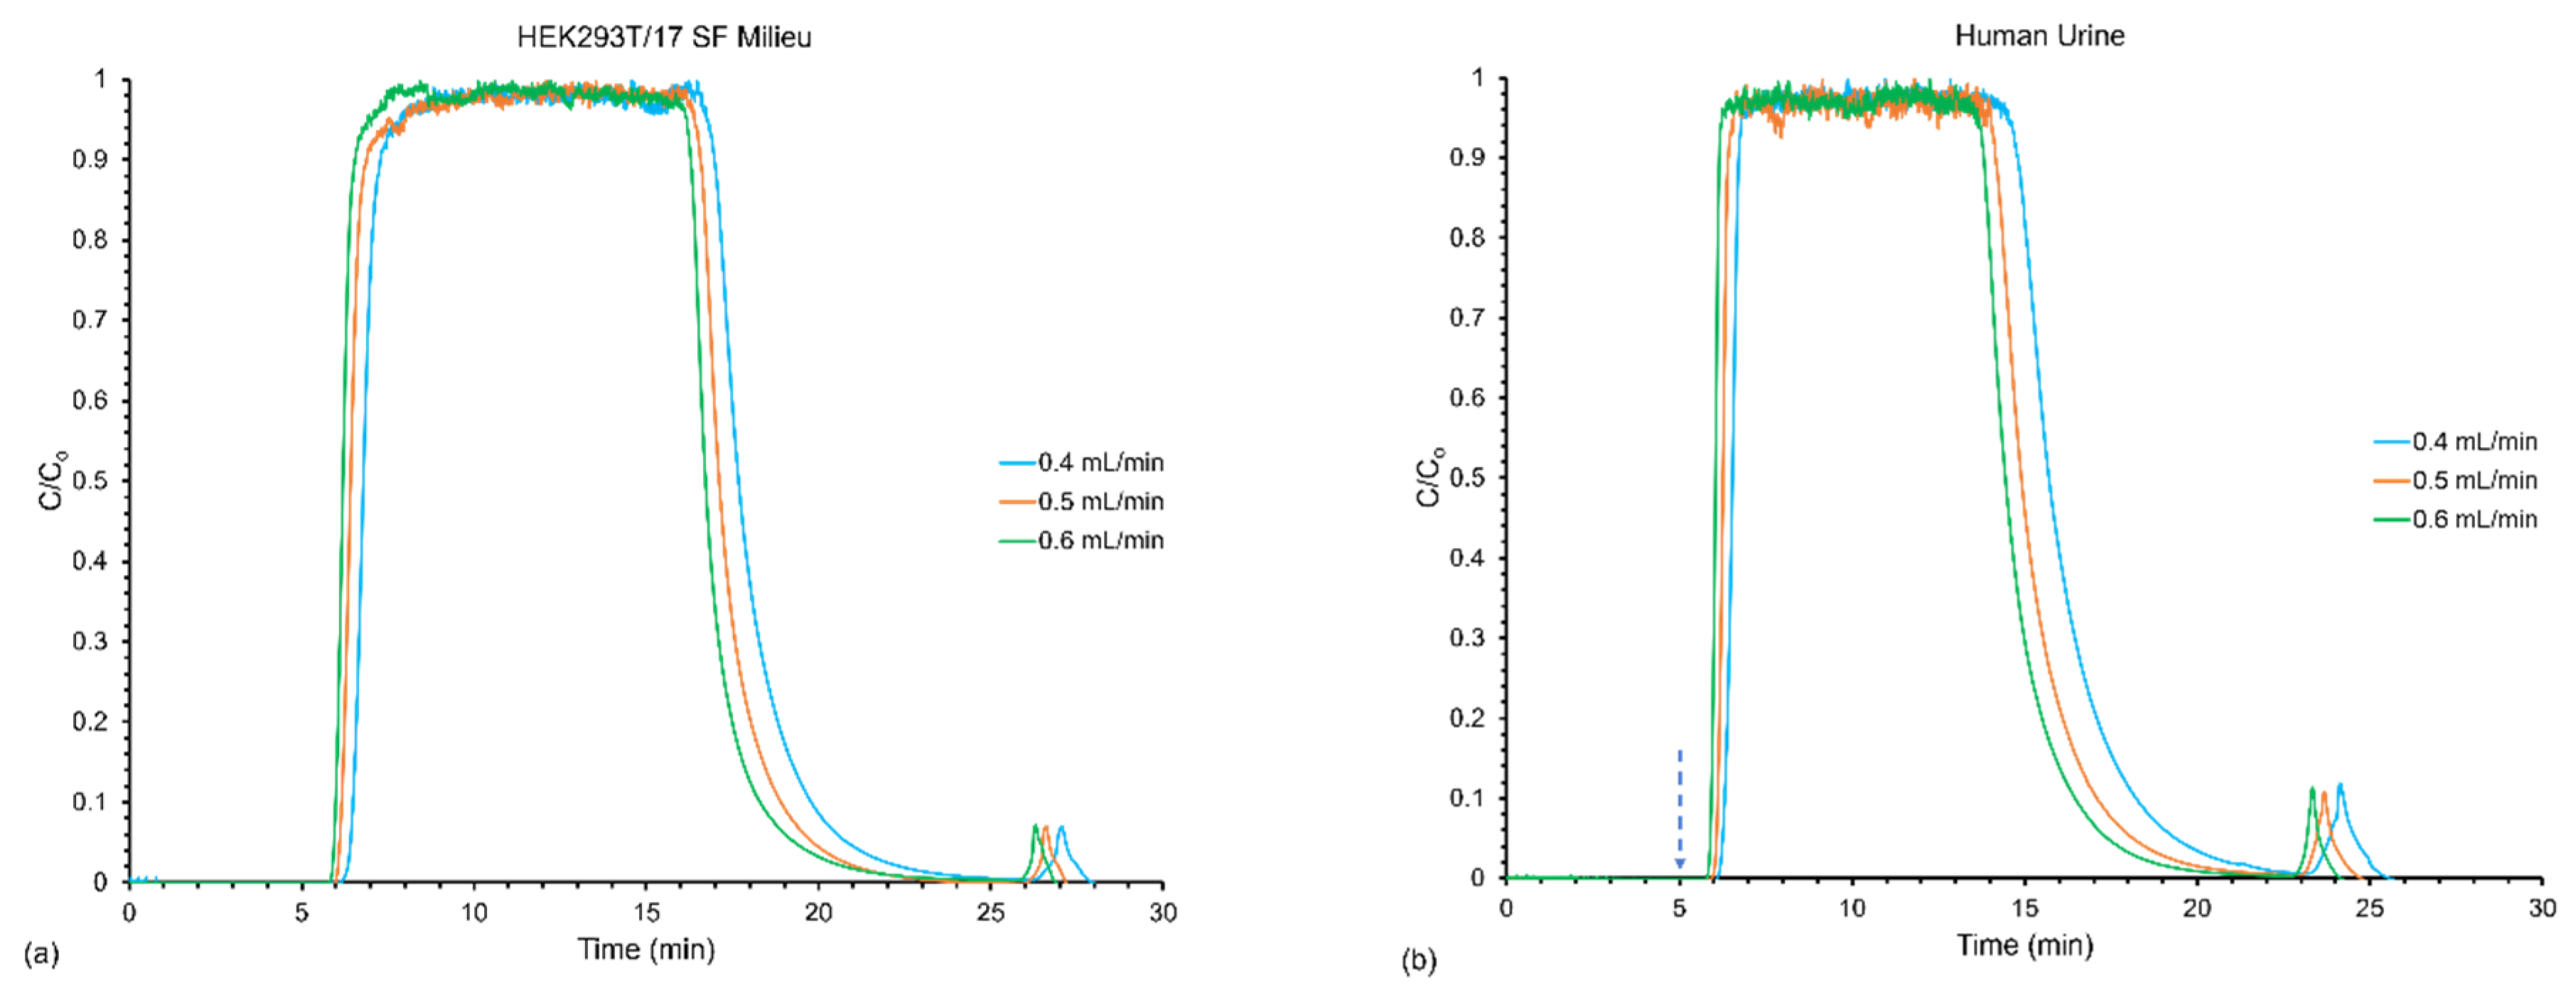
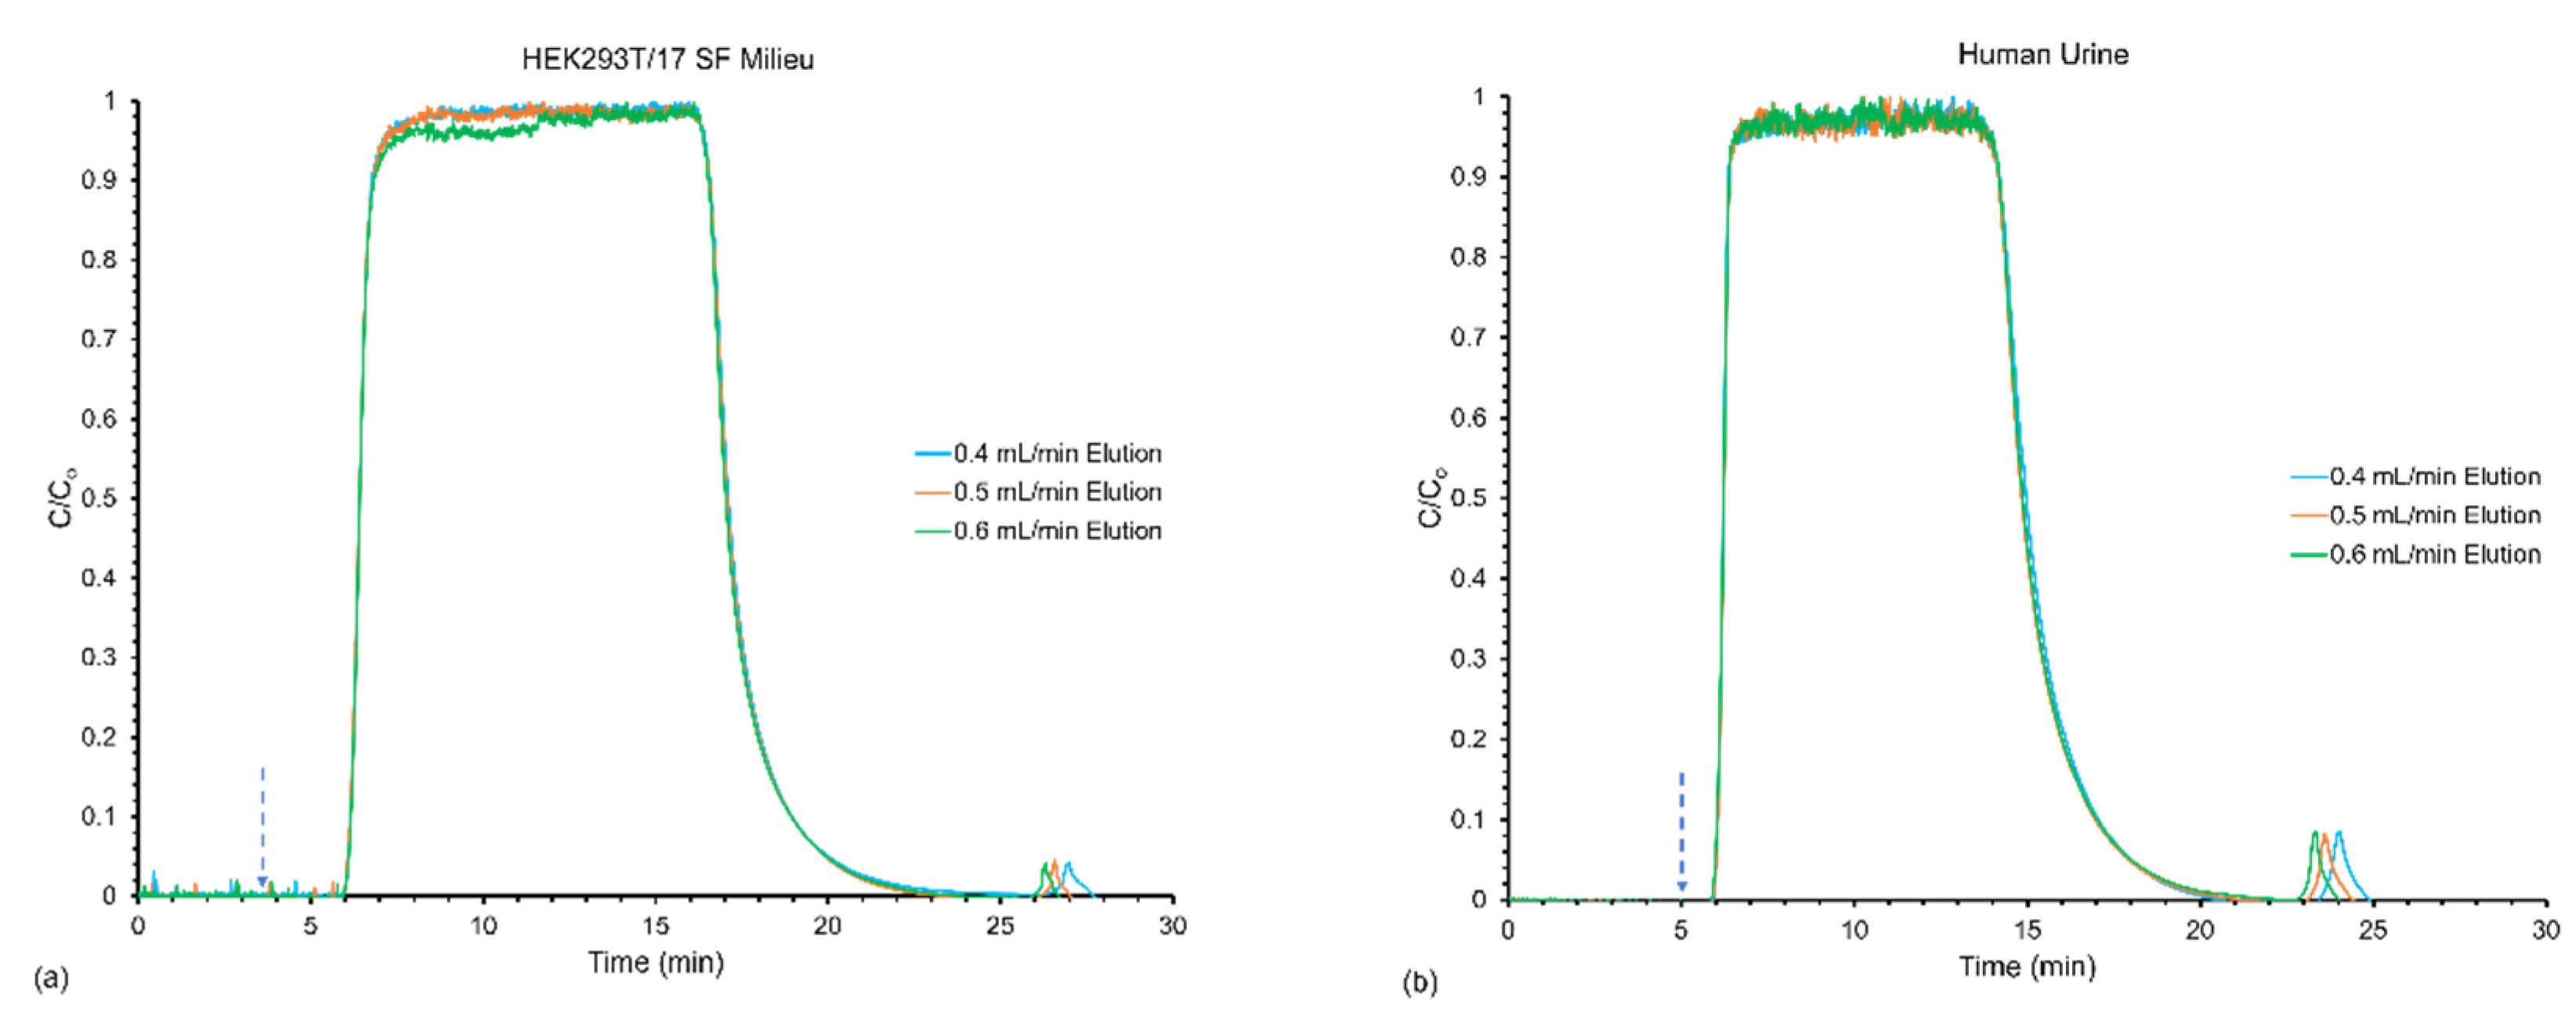
3.2. Effect of Flow Rates on Frontal Yields and Process Throughput

Previous experiments have demonstrated the ability of C-CP fiber columns to operate at high linear velocities (U0) (~100 mm s−1) without mass transfer limitations towards proteins due to the fact that the fiber matrix is virtually non-porous with respect to the size of proteins [34,35,36,58,59]. Certainly, the same is true for the target nanovesicles. This lack of porosity alleviates any intra-phase mass transfer considerations regarding the mobile phase velocities, with the overall efficiency being driven by the solution-surface kinetics. To evaluate potential absorption-desorption kinetic limitations on the process throughput and yield, the loading and elution flow rates (i.e., linear velocities) were varied in tandem from 0.4 to 0.6 mL min−1 (U0 = 24–37 mm s−1). As the actual load amounts for both matrices were invariant with stock solution concentration, and the highest throughput was desired, the experiments were performed on undiluted, native, stock solutions. As such, the respective EV concentrations were 1.5 × 10¹² particles mL−1 for the milieu and 1.2 × 10¹² particles mL−1 for the urine.
Representative responses for the varying flow rates on the load/elution profiles are presented in Figure 3. The chromatograms for the milieu (Figure 3a) and the urine (Figure 3b) both (unsurprisingly) exhibited an increase in the amount of time it took to reach breakthrough (saturation) as the flow rate decreased. Indeed, for the two samples, the transients are virtually superimposable. Likewise, the elution peaks move as a function of the flow rate. Here, of course, it is both the appearance time and the peak widths which are impacted, with higher flow rates yielding more narrow elution bands. A more subtle effect of the higher elution flow rates was an actual dilution of the solute concentrations, as would be expected, since the same number of particles (in theory) would be eluted in a higher solvent volume. For reference, the peak areas for the milieu decreased from ~160 to 100 mAU*min and the urine from ~260–190 mAU*min, in direct proportion with the respective volume flow rates.
The quantitative results regarding variation of the load and elution flow rates on frontal loading and recovery, are presented in Table 2. The first primary observation, which is perhaps counterintuitive, is the fact that for both matrices the number of particles loaded increased with the linear velocity. Here again, the load amounts for the two matrices are very comparable, showing the same sorts of increases with linear velocity. This general response has been seen consistently across protein loading studies on the C-CP fiber phases [35,59,60]. This is a direct response of the open channel structure of the columns, wherein higher linear velocities create greater amounts of shear effects and a thinning of the diffusional distances as described by the Leveque equation [61,62]. Of course, it would be expected that extension to higher velocities at some point limits the solute residence times on the column, and so diminishing returns would be realized.
As might be expected, the respective recoveries and yields between the two matrices were different in their magnitude and response to increases in mobile phase velocity. Here, the milieu solution showed much improved overall yields (maximizing at 65%), showing somewhat reduced efficiency in recoveries at the highest flow rate. On the other hand, the recoveries and yields for the cleaner urine matrix showed improvement as a function of the increased flow rate. Indeed, a value of 100% yield was observed at the load/elute conditions of 0.6 mL min−1. The differences in yields, coupled with the ability to operate at higher processing volume rates, resulted in the ability to process these EVs at a rate of ~9 × 10¹⁰ EV min−1 for the cell milieu and ~1 × 10¹¹ EV min−1 for the urine stock. The fact that the relative throughput characteristics for the HEK293- and human urine-derived EVs were virtually identical, points to a high level of matrix independence. Likewise, these yield and throughput values compare very well with those obtained previously for the case of CHO cell-derived EVs [26]; a level of consistency which provides overall validation of the approach, and values that are far superior to competing methods [32].
After examining the effects of varying both the loading and elution flow rates simultaneously, the response of varying only the elution flow rates at a constant loading flow rate was explored to see if the number of recovered EVs was affected. In this case, emphasis was placed on the elution step as a potential means of improving yields, and more specifically, throughput. In the representative chromatograms (Figure 4) each sample loaded reached saturation at approximately 6 min due to the constant loading flow rate of 0.5 mL min−1. However, due to the variation in the elution flow rates, the faster elution flow rates (0.6 mL min−1) eluted EVs off the fibers first, followed in order by the decreasing flow. The decrease in peak broadening observed in Figure 3 was also present in these elution profiles. Here, the peak areas decreased from ~103 to 65 mAU*min for milieu and ~257–163 mAU*min for the urine sample, again in proportion to the expected solute dilution factors for the three conditions.
As shown in Table 3, when maintaining a constant loading flow rate of 0.5 mL min−1 (U0 = ~31 mm s−1), the number of adsorbed EVs (determined at breakthrough) remained consistent at ~4.9 × 10¹² particles for the milieu and 3.8 × 10¹² particles for the urine, consistent with the data presented in Table 2. Unfortunately, between the time of taking the data relevant to Table 2 and Table 3, there was a dramatic change in the raw absorbance responsivity of the detector, and so the absolute values in the elution quantification step (EVs recovered) were ~50% lower for the HEK-derived EVs and ~20% lower for urine than the equivalent flow conditions (0.5 mL min−1 load/elute) between the data sets. While the absolute values may be in error, the trends displayed for each EV type as a function of elution flow rate were consistent. In both cases, the yields increased appreciably with increasing flow rate, as did the respective process throughput values. These two trends are in full agreement with the previous load/elution characterizations of proteins on the C-CP fiber columns [35]. While the throughput value increases make implicit sense (higher transport velocities), the fact that the percent yields increased with flow rate is more deeply associated with the fundamental desorption phenomena. As noted previously, when velocities in the column channel structure increase, so too do potential shear effects on the release process, which includes both the physical aspect of shearing from the surface, and the chemical effects related to better solvation around the vesicles.

4. Conclusions

A PET C-CP fiber stationary phase packed into a capillary column format was employed via HPLC operating under a HIC workflow to characterize the loading and recovery capacity of EVs from two diverse, yet highly relevant sources: HEK293T/17 SF cell milieu and human urine. This set of experiments aimed to assess the performance of the method versus other EV isolation methods, which are limited in their practical implementation towards processing sample volumes of relevance from complex matrices with respect to fundamental biochemistry, clinical diagnostic, and biochemical engineering/biotherapeutics fields. The fiber columns demonstrated the ability to consistently load ~1012 particles while recovering 1011 to 1012 particles in less than 10 min. Based on the stable working ranges employed, the actual adsorption process was insensitive to changes in load rates ranging from 0.4–0.6 mL min−1. Clearly, there would be some point at which higher flow rates would begin to limit solute residence times and yield lower amounts of particle adsorption. Advantages were seen in the recovery step as flow rates were increased. Both sets of responses are readily explained based on the open-channel structure existing in the C-CP fiber columns. Overall, the throughput for the EVs in the column ranged from 1010 to 1011 particles min−1. In all instances, the performance with the urine-derived EVs was somewhat better than with the more highly complex cell milieu, though the metrics derived for both were far superior to more established EV isolation methods. Ultimately, it is believed that the capillary-scale C-CP fiber columns used in this study, readily implemented on standard HPLC instruments, can provide a step-change improvement in the processing of EVs from diverse bio-media samples. Future efforts will use these concepts to move the methodology towards scales relevant to bioprocessing applications.

Author Contributions

L.S.B.: methodology, data curation, visualization, writing—original draft preparation; K.K.J.: methodology, R.K.M.: conceptualization, supervision, writing—reviewing and editing. All authors have read and agreed to the published version of the manuscript.

Funding

This project was supported in part by funds provided by the National Science Foundation under grant no. CHE-2107882.

Institutional Review Board Statement

Not applicable.

Informed Consent Statement

Not applicable.

Data Availability Statement

Not applicable.

Acknowledgments

The authors acknowledge the National Science Foundation for their funding support.

Conflicts of Interest

The authors have no potential conflict of interest to report.

References

  1. Gutierrez-Millan, C.; Calvo Diaz, C.; Lanao, J.M.; Colino, C.I. Advances in Exosomes-Based Drug Delivery Systems. Macromol. Biosci. 2021, 21, e2000269. [Google Scholar] [CrossRef]
  2. Shao, H.; Im, H.; Castro, C.M.; Breakefield, X.; Weissleder, R.; Lee, H. New Technologies for Analysis of Extracellular Vesicles. Chem. Rev. 2018, 118, 1917–1950. [Google Scholar] [CrossRef]
  3. Yan, H.; Li, Y.; Cheng, S.; Zeng, Y. Advances in Analytical Technologies for Extracellular Vesicles. Anal. Chem. 2021, 93, 4739–4774. [Google Scholar] [CrossRef]
  4. Colombo, M.; Raposo, G.; Théry, C. Biogenesis, Secretion, and Intercellular Interactions of Exosomes and Other Extracellular Vesicles. Annu. Rev. Cell Dev. Biol. 2014, 30, 255–289. [Google Scholar] [CrossRef]
  5. Théry, C. Exosomes: Secreted vesicles and intercellular communications. F1000 Biol. Rep. 2011, 3, 15. [Google Scholar] [CrossRef]
  6. Watson, D.C.; Yung, B.C.; Bergamaschi, C.; Chowdhury, B.; Bear, J.; Stellas, D.; Morales-Kastresana, A.; Jones, J.C.; Felber, B.K.; Chen, X. Scalable, cGMP-compatible purification of extracellular vesicles carrying bioactive human heterodimeric IL-15/lactadherin complexes. J. Extracell. Vesicles 2018, 7, 1442088. [Google Scholar] [CrossRef]
  7. Lamparski, H.G.; Metha-Damani, A.; Yao, J.-Y.; Patel, S.; Hsu, D.-H.; Ruegg, C.; Le Pecq, J.-B. Production and characterization of clinical grade exosomes derived from dendritic cells. J. Immunol. Methods 2002, 270, 211–226. [Google Scholar] [CrossRef]
  8. Tibbitt, M.W.; Dahlman, J.E.; Langer, R. Emerging frontiers in drug delivery. J. Am. Chem. Soc. 2016, 138, 704–717. [Google Scholar] [CrossRef]
  9. Xitong, D.; Xiaorong, Z. Targeted therapeutic delivery using engineered exosomes and its applications in cardiovascular diseases. Gene 2016, 575, 377–384. [Google Scholar] [CrossRef] [PubMed]
  10. Manandhar, S.; Kothandan, V.K.; Oh, J.; Yoo, S.H.; Hwang, J.; Hwang, S.R. A pharmaceutical investigation into exosomes. J. Pharm. Investig. 2018, 48, 617–626. [Google Scholar] [CrossRef]
  11. Jiang, X.-C.; Gao, J.-Q. Exosomes as novel bio-carriers for gene and drug delivery. Int. J. Pharm. 2017, 521, 167–175. [Google Scholar] [CrossRef]
  12. Barile, L.; Vassalli, G. Exosomes: Therapy delivery tools and biomarkers of diseases. Pharmacol. Ther. 2017, 174, 63–78. [Google Scholar] [CrossRef] [PubMed]
  13. Andreu, Z.; Otta Oshiro, R.; Redruello, A.; López-Martín, S.; Gutiérrez-Vázquez, C.; Morato, E.; Marina, A.I.; Olivier Gómez, C.; Yáñez-Mó, M. Extracellular vesicles as a source for non-invasive biomarkers in bladder cancer progression. Eur. J. Pharm. Sci. 2017, 98, 70–79. [Google Scholar] [CrossRef]
  14. Paganini, C.; Capasso Palmiero, U.; Pocsfalvi, G.; Touzet, N.; Bongiovanni, A.; Arosio, P. Scalable Production and Isolation of Extracellular Vesicles: Available Sources and Lessons from Current Industrial Bioprocesses. Biotechnol. J. 2019, 14, 1800528. [Google Scholar] [CrossRef] [PubMed]
  15. Gimona, M.; Pachler, K.; Laner-Plamberger, S.; Schallmoser, K.; Rohde, E. Manufacturing of human extracellular vesicle-based therapeutics for clinical use. Int. J. Mol. Sci. 2017, 18, 1190. [Google Scholar] [CrossRef] [PubMed]
  16. Jong, A.Y.; Wu, C.H.; Li, J.; Sun, J.; Fabbri, M.; Wayne, A.S.; Seeger, R.C. Large-scale isolation and cytotoxicity of extracellular vesicles derived from activated human natural killer cells. J. Extracell. Vesicles 2017, 6, 1294368. [Google Scholar] [CrossRef]
  17. Haraszti, R.A.; Miller, R.; Stoppato, M.; Sere, Y.Y.; Coles, A.; Didiot, M.-C.; Wollacott, R.; Sapp, E.; Dubuke, M.L.; Li, X.; et al. Exosomes Produced from 3D Cultures of MSCs by Tangential Flow Filtration Show Higher Yield and Improved Activity. Mol. Ther. 2018, 26, 2838–2847. [Google Scholar] [CrossRef]
  18. Kamerkar, S.; LeBleu, V.S.; Sugimoto, H.; Yang, S.; Ruivo, C.F.; Melo, S.A.; Lee, J.J.; Kalluri, R. Exosomes facilitate therapeutic targeting of oncogenic KRAS in pancreatic cancer. Nature 2017, 546, 498–503. [Google Scholar] [CrossRef]
  19. Wen, S.; Dooner, M.; Cheng, Y.; Papa, E.; Del Tatto, M.; Pereira, M.; Deng, Y.; Goldberg, L.; Aliotta, J.; Chatterjee, D.; et al. Mesenchymal stromal cell-derived extracellular vesicles rescue radiation damage to murine marrow hematopoietic cells. Leukemia 2016, 30, 2221–2231. [Google Scholar] [CrossRef]
  20. Didiot, M.-C.; Hall, L.M.; Coles, A.H.; Haraszti, R.A.; Godinho, B.M.D.C.; Chase, K.; Sapp, E.; Ly, S.; Alterman, J.F.; Hassler, M.R.; et al. Exosome-mediated Delivery of Hydrophobically Modified siRNA for Huntingtin mRNA Silencing. Mol. Ther. 2016, 24, 1836–1847. [Google Scholar] [CrossRef] [Green Version]
  21. Pi, F.; Binzel, D.W.; Lee, T.J.; Li, Z.; Sun, M.; Rychahou, P.; Li, H.; Haque, F.; Wang, S.; Croce, C.M.; et al. Nanoparticle orientation to control RNA loading and ligand display on extracellular vesicles for cancer regression. Nat. Nanotechnol. 2018, 13, 82–89. [Google Scholar] [CrossRef]
  22. McNamara, R.P.; Caro-Vegas, C.P.; Costantini, L.M.; Landis, J.T.; Griffith, J.D.; Damania, B.A.; Dittmer, D.P. Large-scale, cross-flow based isolation of highly pure and endocytosis-competent extracellular vesicles. J. Extracell. Vesicles 2018, 7, 1541396. [Google Scholar] [CrossRef]
  23. Bruce, T.F.; Slonecki, T.J.; Wang, L.; Huang, S.; Powell, R.R.; Marcus, R.K. Exosome isolation and purification via hydrophobic interaction chromatography using a polyester, capillary-channeled polymer fiber phase. Electrophoresis 2019, 40, 571–581. [Google Scholar] [CrossRef] [PubMed]
  24. Huang, S.; Wang, L.; Bruce, T.F.; Marcus, R.K. Isolation and quantification of human urinary exosomes by hydrophobic interaction chromatography on a polyester capillary-channeled polymer fiber stationary phase. Anal. Bioanal. Chem. 2019, 411, 6591–6601. [Google Scholar] [CrossRef] [PubMed]
  25. Wang, L.; Bruce, T.F.; Huang, S.; Marcus, R.K. Isolation and quantitation of exosomes isolated from human plasma via hydrophobic interaction chromatography using a polyester, capillary-channeled polymer fiber phase. Anal. Chim. Acta 2019, 1082, 186–193. [Google Scholar] [CrossRef] [PubMed]
  26. Huang, S.; Wang, L.; Bruce, T.F.; Marcus, R.K. Evaluation of exosome loading characteristics in their purification via a glycerol-assisted hydrophobic interaction chromatography method on a polyester, capillary-channeled polymer fiber phase. Biotechnol. Prog. 2020, 36, e2998. [Google Scholar] [CrossRef]
  27. Jackson, K.K.; Powell, R.R.; Bruce, T.F.; Marcus, R.K. Solid-phase extraction of exosomes from diverse matrices via a polyester capillary-channeled polymer (C-CP) fiber stationary phase in a spin-down tip format. Anal. Bioanal. Chem. 2020, 412, 4713–4724. [Google Scholar] [CrossRef]
  28. Ji, X.; Huang, S.; Zhang, J.; Bruce, T.F.; Tan, Z.; Wang, D.; Zhu, J.; Marcus, R.K.; Lubman, D.M. A novel method of high-purity extracellular vesicle enrichment from microliter-scale human serum for proteomic analysis. Electrophoresis 2021, 42, 245–256. [Google Scholar] [CrossRef]
  29. Jackson, K.K.; Powell, R.R.; Bruce, T.F.; Marcus, R.K. Rapid isolation of extracellular vesicles from diverse biofluid matrices via capillary-channeled polymer fiber solid-phase extraction micropipette tips. Analyst 2021, 146, 4314–4325. [Google Scholar] [CrossRef]
  30. Huang, S.; Ji, X.; Jackson, K.K.; Lubman, D.M.; Ard, M.B.; Bruce, T.F.; Marcus, R.K. Rapid separation of blood plasma exosomes from low-density lipoproteins via a hydrophobic interaction chromatography method on a polyester capillary-channeled polymer fiber phase. Anal. Chim. Acta 2021, 1167, 338578. [Google Scholar] [CrossRef]
  31. Jackson, K.K.; Powell, R.R.; Bruce, T.F.; Marcus, R.K. Facile, Generic Capture and On-Fiber Differentiation of Exosomes via Confocal Immunofluorescence Microscopy using a Capillary-Channeled Polymer Fiber Solid-Phase Extraction Tip. Sens. Diagnost. 2022, 1, 525–533. [Google Scholar] [CrossRef]
  32. Jackson, K.K.; Powell, R.R.; Marcus, R.K.; Bruce, T.F. Comparison of the capillary-channeled polymer (C-CP) fiber spin-down tip approach to traditional methods for the isolation of extracellular vesicles from human urine. Anal. Bioanal. Chem. 2022, 414, 3813–3825. [Google Scholar] [CrossRef] [PubMed]
  33. Nelson, D.M.; Marcus, R.K. Characterization of Capillary-Channeled Polymer Fiber Stationary Phases for High-Performance Liquid Chromatography Protein Separations:  Comparative Analysis with a Packed-Bed Column. Anal. Chem. 2006, 78, 8462–8471. [Google Scholar] [CrossRef] [PubMed]
  34. Randunu, K.M.; Dimartino, S.; Marcus, R.K. Dynamic evaluation of polypropylene capillary-channeled fibers as a stationary phase in high-performance liquid chromatography. J. Sep. Sci. 2012, 35, 3270–3280. [Google Scholar] [CrossRef] [PubMed]
  35. Randunu, K.M.; Marcus, R.K. Initial evaluation of protein throughput and yield characteristics on nylon 6 capillary-channeled polymer (C-CP) fiber stationary phases by frontal analysis. Biotechnol. Prog. 2013, 29, 1222–1229. [Google Scholar] [CrossRef] [PubMed]
  36. Randunu, K.M.; Marcus, R.K. Microbore polypropylene capillary channeled polymer (C-CP) fiber columns for rapid reversed-phase HPLC of proteins. Anal. Bioanal. Chem. 2012, 404, 721–729. [Google Scholar] [CrossRef]
  37. Nelson, D.M.; Marcus, R.K. Potential for Ultrafast Protein Separations with Capillary-Channeled Polymer (C-CP) Fiber Columns. Protein Pept. Lett. 2006, 13, 95–99. [Google Scholar] [CrossRef] [PubMed]
  38. Marcus, R.K. Use of polymer fiber stationary phases for liquid chromatography separations: Part I–physical and chemical rationale. J. Sep. Sci. 2008, 31, 1923–1935. [Google Scholar] [CrossRef]
  39. Jackson, K.K.; Mata, C.; Marcus, R.K. A Rapid Capillary-Channeled Polymer (C-CP) Fiber Spin-Down Tip Approach for the Isolation of Plant-Derived Extracellular Vesicles (PDEVs) from 20 Common Fruit and Vegetable Sources. Talanta 2022, in press. [Google Scholar] [CrossRef]
  40. Jurgielewicz, B.J.; Yao, Y.; Stice, S.L. Kinetics and Specificity of HEK293T Extracellular Vesicle Uptake using Imaging Flow Cytometry. Nanoscale Res. Lett. 2020, 15, 170. [Google Scholar] [CrossRef] [PubMed]
  41. Ferguson, S.; Kim, S.; Lee, C.; Deci, M.; Nguyen, J. The phenotypic effects of exosomes secreted from distinct cellular sources: A comparative study based on miRNA composition. AAPS J. 2018, 20, 67. [Google Scholar] [CrossRef] [PubMed]
  42. Johnsen, K.B.; Gudbergsson, J.M.; Skov, M.N.; Pilgaard, L.; Moos, T.; Duroux, M. A comprehensive overview of exosomes as drug delivery vehicles—endogenous nanocarriers for targeted cancer therapy. Biochim. Biophys. Acta-Rev. Cancer 2014, 1846, 75–87. [Google Scholar] [CrossRef] [PubMed]
  43. Faruqu, F.N.; Xu, L.; Al-Jamal, K.T. Preparation of exosomes for siRNA delivery to cancer cells. JoVE 2018, 142, e58814. [Google Scholar] [CrossRef]
  44. Liu, Y.; Li, D.; Liu, Z.; Zhou, Y.; Chu, D.; Li, X.; Jiang, X.; Hou, D.; Chen, X.; Chen, Y. Targeted exosome-mediated delivery of opioid receptor Mu siRNA for the treatment of morphine relapse. Sci. Rep. 2015, 517543. [Google Scholar] [CrossRef] [PubMed]
  45. Zhu, X.; Badawi, M.; Pomeroy, S.; Sutaria, D.S.; Xie, Z.; Baek, A.; Jiang, J.; Elgamal, O.A.; Mo, X.; Perle, K.L. Comprehensive toxicity and immunogenicity studies reveal minimal effects in mice following sustained dosing of extracellular vesicles derived from HEK293T cells. J. Extracell. Vesicles 2017, 6, 1324730. [Google Scholar] [CrossRef]
  46. Zhou, H.; Yuen, P.S.; Pisitkun, T.; Gonzales, P.A.; Yasuda, H.; Dear, J.W.; Gross, P.; Knepper, M.A.; Star, R.A. Collection, storage, preservation, and normalization of human urinary exosomes for biomarker discovery. Kidney Int. 2006, 69, 1471–1476. [Google Scholar] [CrossRef]
  47. Merchant, M.L.; Powell, D.W.; Wilkey, D.W.; Cummins, T.D.; Deegens, J.K.; Rood, I.M.; McAfee, K.J.; Fleischer, C.; Klein, E.; Klein, J.B. Microfiltration isolation of human urinary exosomes for characterization by MS. PROTEOMICS–Clin. Appl. 2010, 4, 84–96. [Google Scholar] [CrossRef]
  48. Jackson, K.K.; Kenneth Marcus, R. Rapid Isolation and Quantification of Extracellular Vesicles from Suspension-Adapted Human Embryonic Kidney Cells using Capillary-Channeled Polymer Fiber Spin-Down Tips. Electrophoresis 2022, in press. [Google Scholar] [CrossRef] [PubMed]
  49. Lehrich, B.M.; Liang, Y.; Khosravi, P.; Federoff, H.J.; Fiandaca, M.S. Fetal Bovine Serum-Derived Extracellular Vesicles Persist within Vesicle-Depleted Culture Media. Int. J. Mol. Sci. 2018, 19, 3538. [Google Scholar] [CrossRef]
  50. Eitan, E.; Zhang, S.; Witwer, K.W.; Mattson, M.P. Extracellular vesicle–depleted fetal bovine and human sera have reduced capacity to support cell growth. J. Extracell. Vesicles 2015, 4, 26373. [Google Scholar] [CrossRef]
  51. Huang, S.; Bruce, T.F.; Ding, H.; Wei, Y.; Marcus, R.K. Rapid isolation of lentivirus particles from cell culture media via a hydrophobic interaction chromatography method on a polyester, capillary-channeled polymer fiber stationary phase. Anal. Bioanal Chem. 2021, 413, 2985–2994. [Google Scholar] [CrossRef] [PubMed]
  52. Ladisch, M.R. Bioseparations Engineering: Principles, Practice, and Economics; Wiley: New York, NY, USA, 2001. [Google Scholar]
  53. Carta, G.; Jungbauer, A. Protein Chromatography: Process. Development and Scale-Up; John Wiley & Sons: Hoboken, NJ, USA, 2020. [Google Scholar]
  54. Hearn, M.T.; Anspach, B. Chemical, physical, and biochemical concepts in isolation and purification of proteins. Sep. Purif. Methods 2001, 30, 221–263. [Google Scholar] [CrossRef]
  55. Guiochon, G.; Felinger, A.; Shirazi, D.G. Fundamentals of Preparative and Nonlinear Chromatography; Elsevier: Amsterdam, The Netherlands, 2006. [Google Scholar]
  56. Vera-Avila, L.E.; Gallegos-Perez, J.L.; Camacho-Frias, E. Frontal analysis of aqueous phenol solutions in amberlite XAD-4 columns: Implications on the operation and design of solid phase extraction systems. Talanta 1999, 50, 509–526. [Google Scholar] [CrossRef]
  57. Singh, A.; Pinto, N.G. Polymeric short-fiber chromatographic supports for downstream processing of biomolecules. React. Polym. 1995, 24, 229–242. [Google Scholar] [CrossRef]
  58. Wang, Z.; Marcus, R.K. Determination of pore size distributions in capillary-channeled polymer fiber stationary phases by inverse size-exclusion chromatography and implications for fast protein separations. J. Chromatogr. A 2014, 1351, 82–89. [Google Scholar] [CrossRef]
  59. Wang, L.; Stevens, K.A.; Haupt-Renaud, P.; Marcus, R.K. Dynamic evaluation of a trilobal capillary-channeled polymer fiber shape for reversed phase protein separations and comparison to the eight-channeled form. J. Sep. Sci. 2018, 41, 1063–1073. [Google Scholar] [CrossRef]
  60. Wang, Z.; Marcus, R.K. Roles of Interstitial Fraction and Load Linear Velocity on the Dynamic Biding Capacity of Proteins on Capillary Channeled Polymer Fiber Columns. Biotechnol. Progr. 2015, 15, 97–109. [Google Scholar] [CrossRef]
  61. Leveque, M. The Laws of Convective Heat Transfer. Ann. Mines 1928, 13, 284. [Google Scholar]
  62. Bird, B.R.; Stewart, W.E.; Lightfoot, E.N. Transport Phenomena; Wiley: New York, NY, USA, 1960. [Google Scholar]
Figure 1. Temporal evolution of EV load/elution experiments with specific designations for throughput and yield computations as defined by Equations (1) and (2).
Separations 09 00251 g001
Figure 2. Frontal load and recovery response for varying the EV loading concentrations of the (a) HEK293T/17 SF milieu and (b) human urine samples at a constant load and elution flow rate of 0.5 mL min−1.
Separations 09 00251 g002
Figure 3. Frontal loading response for the effect of varying the loading and elution flow rates of the (a) HEK293T/17 SF milieu and (b) human urine samples from 0.4–0.6 mL min−1.
Separations 09 00251 g003
Figure 4. Frontal loading response for the effect of varying the elution flow rate from 0.4–0.6 mL min−1 while maintaining the loading flow rate at 0.5 mL min−1 for (a) HEK293T/17 SF Milieu and (b) human urine samples.
Separations 09 00251 g004
Table 1. Effects of varying the loading concentration of the HEK293T/17 SF cell milieu and human urine sample matrices on the loading, recovery, and yield of the capillary column. Precision noted as percent relative standard deviation (%RSD) for triplicates.
SampleLoading and Elution Flow Rate
(mL min−1)
Linear Velocity
(mm s−1)
EVs Loaded
(Q′)
(Particles)
(%RSD)
EVs Recovered
(Q)
(Particles)
(%RSD)
Yield
(%)
(%RSD)
Throughput
(T)
(Particles min−1)
(%RSD)
HEK293T/17 SF Milieu0.424.94.15 × 1012
(0.19)
2.00 × 10¹²
(15)
48.0
(15)
5.92 × 10¹⁰
(15)
0.531.14.88 × 1012
(0.93)
3.19 × 10¹²
(24)
65.0
(24)
9.67 × 10¹⁰
(24)
0.637.45.69 × 1012
(0.09)
2.85 × 10¹²
(10)
50.0
(10)
8.77 × 10¹⁰
(10)
Human Urine0.424.93.19 × 1012
(0.16)
2.81 × 10¹²
(20)
70.0
(21)
9.16 × 10¹⁰
(19)
0.531.13.82 × 1012
(0.08)
3.33 × 10¹²
(16)
87.0
(14)
1.11 × 10¹¹
(16)
0.637.44.43 × 1012
(0.06)
4.47 × 10¹²
(6.0)
100
(5.0)
1.52 × 10¹¹
(6.0)
Table 2. The effect of varying loading and elution flow rates on the loading, recovery, throughput, and yield of EVs isolated from HEK293T/17 SF milieu and human urine.
SampleLoading and Elution Flow Rate
(mL min−1)
Linear Velocity
(mm s−1)
EVs Loaded
(Q′)
(Particles)
(%RSD)
EVs Recovered
(Q)
(Particles)
(%RSD)
Yield
(%)
(%RSD)
Throughput
(T)
(Particles min−1)
(%RSD)
HEK293T/17 SF Milieu0.424.94.15 × 1012
(0.19)
2.00 × 10¹²
(15)
48.0
(15)
5.92 × 10¹⁰
(15)
0.531.14.88 × 1012
(0.93)
3.19 × 10¹²
(24)
65.0
(24)
9.67 × 10¹⁰
(24)
0.637.45.69 × 1012
(0.09)
2.85 × 10¹²
(10)
50.0
(10)
8.77 × 10¹⁰
(10)
Human Urine0.424.93.19 × 1012
(0.16)
2.81 × 10¹²
(20)
70.0
(21)
9.16 × 10¹⁰
(19)
0.531.13.82 × 1012
(0.08)
3.33 × 10¹²
(16)
87.0
(14)
1.11 × 10¹¹
(16)
0.637.44.43 × 1012
(0.06)
4.47 × 10¹²
(6.0)
100
(5.0)
1.52 × 10¹¹
(6.0)
Table 3. The effect of varying loading and elution flow rates on the loading, recovery, throughput, and yield of EVs isolated from HEK293T/17 SF milieu and human urine.
SampleLoading Flow Rate
(mL min−1)
Elution Flow Rate
(mL min−1)
Linear Velocity
(mm s−1)
EVs Loaded
(Q′)
(Particles)
(%RSD)
EVs Recovered
(Q)
(Particles)
(%RSD)
Yield
(Y)
(%)
(%RSD)
Throughput
(T)
(Particles min−1)
(%RSD)
HEK293T/17 SF Milieu0.50.424.94.90 × 1012
(0.20)
7.79 × 10¹¹
(27)
16.0
(27)
2.33 × 10¹⁰
(27)
0.50.531.14.88 × 1012
(0.93)
1.53 × 10¹²
(48)
31.0
(49)
4.64 × 10¹⁰
(48)
0.50.637.44.91 × 1012
(0.09)
1.65 × 10¹²
(58)
34.0
(58)
5.04 × 10¹⁰
(58)
Human Urine0.50.424.93.80 × 1012
(0.12)
2.15 × 10¹²
(4.0)
57.0
(5.0)
7.12 × 10¹⁰
(4.0)
0.50.531.13.80 × 1012
(0.15)
2.60 × 10¹²
(5.0)
68.0
(5.0)
8.70 × 10¹⁰
(5.0)
0.50.637.43.80 × 1012
(0.08)
3.63 × 10¹²
(12)
96.0
(12)
1.23 × 10¹¹
(12)
Publisher’s Note: MDPI stays neutral with regard to jurisdictional claims in published maps and institutional affiliations.

