Article

Homemade Pipette Tip Solid-Phase Extraction for the Simultaneous Determination of 40 Drugs of Abuse in Urine by Liquid Chromatography–Tandem Mass Spectrometry

Department of Analytical Chemistry and Organic Chemistry, Universitat Rovira i Virgili, Campus Sescelades, Marcel·lí Domingo 1, 43007 Tarragona, Spain
*
Author to whom correspondence should be addressed.
Separations 2022, 9(9), 233; https://doi.org/10.3390/separations9090233
Submission received: 27 July 2022 / Revised: 11 August 2022 / Accepted: 16 August 2022 / Published: 1 September 2022
(This article belongs to the Special Issue Feature Papers in Separations from Editorial Board Members)

Abstract

:
Pipette tip solid-phase extraction facilitates the handling of low-volume samples and organic solvents in order to achieve more environmentally friendly pre-treatment sample techniques. The use of pipette tip extraction was examined for the quick and simple determination of a heterogeneous group of 40 drugs of abuse and some of their metabolites in urine by liquid chromatography coupled to tandem mass spectrometry. Several parameters were studied and optimized, including those which can affect extraction efficiencies, such as the amount of sorbent and the volumes and number of aspirating/dispensing cycles of the sample and organic solvents. The linear range of this method was between the quantification limit and 75 or 100 ng mL−1. Detection limits between 0.025 and 0.500 ng mL−1 and quantification limits from 0.100 to 1.500 ng mL−1 were achieved, which are adequate to determine the studied compounds in urine from drug users. Finally, in order to prove its suitability in toxicological and forensic analyses, the method was successfully applied to 22 urine specimens from women who were starting a detoxification program. Cocaine was the most frequently detected substance, as its presence or the presence of its main metabolite was found in 86% of the analyzed samples.

1. Introduction

Drugs of abuse (DOAs) are a matter of concern due to their high impact on society. They are highly popular substances and each year consumption levels increase further. According to the 2021 World Drug Report, 1 in 18 people from 15 to 64 years old took drugs at least once [1]. In the last ten years, the market has experienced a diversification in the increasing number of DOAs as different synthetic drugs and non-medical pharmaceuticals have grown in number. Apart from established drugs such as cocaine (COC), cannabis, amphetamine-type substances (ATS), or opioids, in recent years new psychoactive substances (NPS) have also come to represent an important group that includes different synthetically modified established drugs such as synthetic cannabinoids, synthetic cathinones or synthetic opioids. Hundreds of NPS have become highly popular because they mimic the effects of established drugs and in addition, they are easily obtained through different websites at lower prices compared to other DOAs. Moreover, new substances of this type are continually emerging in an attempt to avoid new legislation, so legal control is difficult [1,2,3]. Therefore, it is important to monitor not only established drugs but also these new NPS which are constantly appearing on the illegal market.
The determination of DOAs in toxicological and forensic analyses has gained more importance in recent years, and as such, there is growing interest in developing multi-residue methodologies able to determine these compounds in biological matrices at low levels of concentration (ng mL−1) [4,5,6,7,8]. Urine is one of the most frequently used biological matrices in this field because it offers a window of detection from minutes to days or weeks, which allows both parent compounds and their metabolites to be detected, from low levels of ng mL−1 to higher levels. Moreover, this biological sample type has other advantages such as the high volumes of urine that can be collected, in addition to the fact that no specialized personnel is needed to carry this out [9,10,11,12,13]. However, urine is a complex matrix, and it can contain different compounds that may interfere with the analytes of interest. For this reason, a pre-treatment step is usually performed in order to clean the sample and extract the compounds of interest. Even though there are some well-established extraction techniques such as liquid–liquid extraction (LLE) and solid phase extraction (SPE), which have been commonly used in different methodologies previously, the recent trend is to miniaturize the extraction for the purpose of increasing sample throughput and reducing sample and solvent consumption, thus highlighting its benefits in the context of green chemistry [14,15,16,17]. In this regard, different strategies derived from conventional SPE such as pipette tip SPE (PT-SPE), also known as disposable pipette extraction (DPX), have been employed, among others [16,18,19,20,21]. The PT-SPE is based on a µ-SPE in which the sorbent is placed in a tip between two filters of frites or cotton. Its main advantages are that it is easy to operate and low that it requires low volumes of sample, organic solvents, and sorbent. However, it also presents some drawbacks such as the scarcity of articles in this field and the limited availability of commercial sorbents in tip format, so as a result, some practitioners opt for homemade tips [16]. Some of the most important parameters in PT-SPE optimization are the type and amount of sorbent, and the volumes and cycles of loading, washing, and elution. There are two options for increasing the volume of sample loading, washing, and elution: by increasing the volume of the pipette, or by performing more cycles in the same step. Increasing the loading volume or cycle means increasing the pre-concentration factor [16,20,22,23,24,25].
PT-SPE has become an effective tool for the purification and preconcentration of different analytes in various matrices, as various authors have demonstrated. This technique has been employed in the determination of DOAs in biological matrices [20,23,24,25,26,27,28,29,30,31,32,33,34,35,36] and in some cases, it has been used in urine samples [27,28,30,32,33,34]. For example, Shi et al. [30] determined a group of four ATS in urine by gas chromatography (GC) coupled to tandem mass spectrometry (MS/MS) and in the pre-treatment, they used homemade PT based on a 3D ionic liquid ferrite functionalized graphene oxide nanocomposite sorbent. In the loading step, they performed at least ten aspirating/dispensing cycles to extract the analytes: two washing cycles and five eluting cycles. With this protocol, they achieved recovery values higher than 89% for the four ATS with limits of quantification (LOQs) between 8.4 and 27.5 ng mL−1. Ellison et al. [27] developed a method for the determination of 28 DOAs in urine by GC-MS and they performed an extraction of the analytes with a commercial PT made of sulfonated functional groups on a divinyl benzene sorbent. They loaded the sample in one cycle and equilibrated it for 20 s before washing it in two cycles and finally, they eluted the analytes using two organic solvents, one for acidic drugs and one for neutral drugs. The obtained recoveries ranged from 57 to 133% with limits of detection (LODs) between 1.04 and 74.0 ng mL−1. Montesano et al. [32] also performed a PT-SPE pre-treatment for the determination of cannabinoids and their metabolites in urine by liquid chromatography (LC) MS/MS. For the extraction, they used commercial OMIX C18 tips from Agilent and their protocol consisted of five aspirating/dispensing cycles of the sample, three cycles of washing, and five cycles of eluting the analytes. They achieved recoveries of between 65 and 85% with LODs and LOQs from 2 to 4 and 6 to 10 ng mL−1, respectively. Kumazawa et al. [33] also used a C18 tip for the PT-SPE procedure in the determination of amphetamine (AMP) and methamphetamine (MAMP) in urine. The extraction was performed by twenty-five aspirating/dispensing cycles of the sample, washing with one cycle, and eluting with five cycles. They obtained recovery values of between 78 and 88% and LODs of 0.08 and 0.10 ng mL−1 and LOQs of 0.50 ng mL−1.
As can be observed, different types of sorbents have been employed for the PT-SPE technique with very promising results. According to the previous experience of our research group, when both weak and strong mixed-mode cationic exchange sorbents were used for the same DOAs, excellent results were achieved. In particular, ExtraBond SCX sorbent was previously studied and proved effective for the extraction of different types of DOAs from urine but using conventional SPE and LC-MS/MS [37].
The present paper details a method based on a homemade PT-SPE followed by LC-MS/MS for the determination of a large group of DOAs and their metabolites in urine using a commercial mixed-mode SPE sorbent, ExtraBond SCX. Parameters such as the amount of sorbent and the volume and cycles of the loading, washing, and elution steps are optimized. Moreover, the developed method is applied to urine specimens from women who are starting a detoxification program. The results are also compared to the results obtained with conventional SPE pre-treatment to confirm this methodology as a reliable tool for use in toxicological and forensic analyses. As far as we know, this is the first time to date that the ExtraBond SCX sorbent has been used for determining a large group of DOAs and their metabolites in urine using a homemade PT-SPE.

2. Materials and Methods

2.1. Standards and Materials

The standards were purchased from Sigma-Aldrich (St. Louis, MO, USA) and LGC Standards (Luckenwalde, Germany). N-ethylcathinone (ethcathinone), 4-fluoromethcathinone (flephedrone), 3,4-methylenedioxy-N-ethylcathinone (ethylone), buphedrone, 4-methylmethcathinone (mephedrone), 2-methylmethcathinone (2-MMC), 3,4-methylenedioxymethcathinone (methylone), butylone, beta-ethylmethcathinone (pentedrone), 4-methylethcathinone (4-MEC), 3,4-dimethylmethylcathinone (3,4-DMMC), methylenedioxypyrovalerone (MDPV), alpha-pyrrolidinovalerophenone (alpha-PVP), 4-methxymethcathinone (methedrone), dimethylcathinone, pyrovalerone, methamphetamine (MAMP), amphetamine (AMP), 3,4.methylenedioxymethamphetamine (MDMA), 3,4-methylenedioxyamphetamine (MDA), morphine (MOR), 6-acetylmorphine (6-AM), cocaine (COC), benzoylecgonine (BZE), fentanyl, methadone, buprenorphine, heroin (HER), codeine (COD), 2-ethylidene-1,5-dimethyl-3,3-diphenylpyrrolidine (EDDP), diazepam, alprazolam, bromazepam, lorazepam, lysergic acid diethylamide (LSD), 2-oxo-3-hydroxy-LSD (oxo-LSD), ketamine (KET), norketamine, 4-methylephedrine, and hyoscine were used.
Stock solutions were prepared individually in methanol (MeOH) at concentrations of 100 mg L−1, 1000 mg L−1, and 2000 mg L−1, depending on the compound, and frozen at −20 °C. A mixture of these was also prepared in MeOH at 2 mg L−1 and kept in the freezer. Diluted working solutions were then prepared in water (H2O) for injection.
Acetonitrile (ACN) and H2O for LC-MS were purchased from Scharlab (Barcelona, Spain). MeOH was obtained from J.T. Baker (Deventer, The Netherlands). Hydrochloric acid (HCl) ≥ 37%, formic acid (HCOOH) ≥ 98%, and ammonium hydroxide (NH4OH) ≥ 28% were obtained from Sigma-Aldrich (St. Louis, MO, USA). Ultrapure water was purchased from a water purification system (Merck Millipore, Darmstadt, Germany).
ExtraBond SCX (1000 mg/6 mL) sorbents were purchased by Scharlab. A Transferpette® S micropipette from Brand (Wertheim, Germany) was used for the extraction. For evaporating the final solutions, a MiVac Duo sample concentrator from Genevac (Ipswich, UK) was used.

2.2. LC-MS/MS Conditions

An Agilent model 1200 series LC coupled with an Agilent 6460 series triple quadrupole mass spectrometer with electrospray ionization (ESI) interface from Agilent Technologies (Waldbronn, Germany) was used in the present study. For instrumental control and data analysis, the Agilent MassHunter Workstation Software version B.09.00 was used.
The LC-MS/MS conditions were the same as in the previous study in which the same group of drugs was determined in urine using SPE as pre-treatment [37]. A Luna Omega 5 μm Polar C18 (150 mm × 4.6 mm, 5 μm) column from Phenomenex (Torrance, CA, USA) with a Security Guard from Phenomenex was used for the chromatographic separation. An injection volume of 10 µL with a flow rate of 0.6 mL min−1 of the mobile phase was employed. The mobile phase was constituted by A: 0.1% HCOOH in H2O and B: 0.1% HCOOH in ACN in gradient mode. The gradient started at 15% B and was held for 5 min. It was increased to 35% in 7 min, to 80% in 13 min, and then to 100% in 1 min. It was maintained for 2 min before returning to the initial conditions in 1 min and finally held for 5 min.
The optimization of the MS/MS parameters was performed by injecting each compound at 1 mg L−1 in a mixture of H2O:MeOH (50:50, v/v). A multiple reaction monitoring (MRM) mode in positive polarity with ten different windows was employed for the acquisition. For this, the two most intensive transitions between the parent ion and the product ions were selected. The optimal MS/MS parameters were capillary voltage, 2500 V; gas temperature, 350 °C; gas flow rate, 13 L min−1; nebulizer pressure, 30 psi. The fragmentor was set between 50 and 125 V, and the collision energy (CE) was between 4 and 42 eV (Table S1).

2.3. Preparation of Homemade PT-SPE Tips

The homemade PT-SPE tips were prepared by using two pipette tips of 200 µL and 1000 µL, respectively, ExtraBond SCX sorbent and two small pieces of cotton. First, to construct the PT device, a small piece of cotton was placed inside the 200 µL tip and it was tightened. An amount of 10 mg of ExtraBond SCX sorbent was then introduced into the tip and finally, another small piece of cotton was inserted. These three layers were tightened to prevent sorbent loss both above and below the tip. Finally, the 1000 µL tip was inserted into the 200 µL and used with the 1000 µL Transferpette® S micropipette.

2.4. Urine Collection and PT-SPE Pre-Treatment

Urine was collected using polypropylene tubes and was kept in the freezer at −20 °C. Urine samples were then thawed and 250 µL of urine was mixed with 250 µL of ultrapure H2O at pH 4 (adjusted with HCOOH ≥ 98%). For the PT-SPE, the sorbent was conditioned and activated using one aspirating/dispensing cycle of 500 µL of MeOH and 500 µL of ultrapure H2O at pH 4, respectively. One cycle of 250 µL of the urine mixture: H2O at pH 4 (50:50, v/v) was then aspirated and dispensed, washed with one cycle of 500 µL of MeOH, and eluted with one cycle of 1000 µL of 5% NH4OH in MeOH. After the PT-SPE process, 100 µL of 1% HCl ≥ 37% in MeOH was added to the final solution. The methanolic extracts were evaporated to dryness using a MiVac sample concentrator, reconstituted with 250 µL of mobile phase at initial conditions and filtered through a 0.45 µm polytetrafluoroethylene (PTFE) syringe filter before the analysis.

2.5. Validation

The European guidelines for workplace drug testing in urine were followed for the method validation [38]. The validated parameters were sensitivity, selectivity, linearity, instrumental and method detection and quantification limits (IDLs and IQLs and MDLs and MQLs, respectively), matrix effect (ME), apparent recoveries (Rapp), precision as reproducibility (inter-day) and repeatability (intra-day), stability and accuracy. Moreover, tolerances for retention times and ion ratios of ±2.5% and ±20% were considered [39].
The instrumental linearity was evaluated by using different working solutions of drugs with neat standards between 0.01 and 250 ng mL−1 considering the determination coefficient (r2). IDLs were considered the lowest detectable point with a signal-to-noise (S/N) ratio ≥ 3 and IQLs as the lowest concentration in the calibration curve with S/N ≥ 10.
Different matrix-matched calibration curves were studied with a mixture of drugs in urine at concentrations of between 0.01 and 125 ng mL−1. The method linearity, MDLs, and MQL criteria were considered the same as for the instrumental ones, but for extracted samples. The Rapp, ME, repeatability, and reproducibility were evaluated at three concentration levels: 2 ng mL−1 (low), 20 ng mL−1 (medium), and 65 ng mL−1 (high) by using five replicates (n = 5). Reproducibility (n = 5 during five days) and repeatability (n = 5 in the same day) were evaluated as relative standard deviation (%RSD).
The parameters of selectivity and specificity were studied considering the possible endogenous and exogenous interferences from urine. The stability was studied for 50 h at 10 °C by analysis replicates of 2, 20, and 65 ng mL−1 in urine (n = 5). The accuracy was evaluated by analyzing three blind samples which had been spiked by a member of the laboratory staff before all experimental procedures had been carried out and calculating the error between the obtained concentration and the real one.
Twenty-two urine samples from anonymous women starting a drug detoxification program at the Centre Català de la Solidaritat (CECAS), in Tarragona, Spain, were analyzed using the methodology developed. Urine samples were collected in polypropylene tubes at the moment of admission and frozen at −20 °C prior to the PT-SPE sample pre-treatment.

3. Results

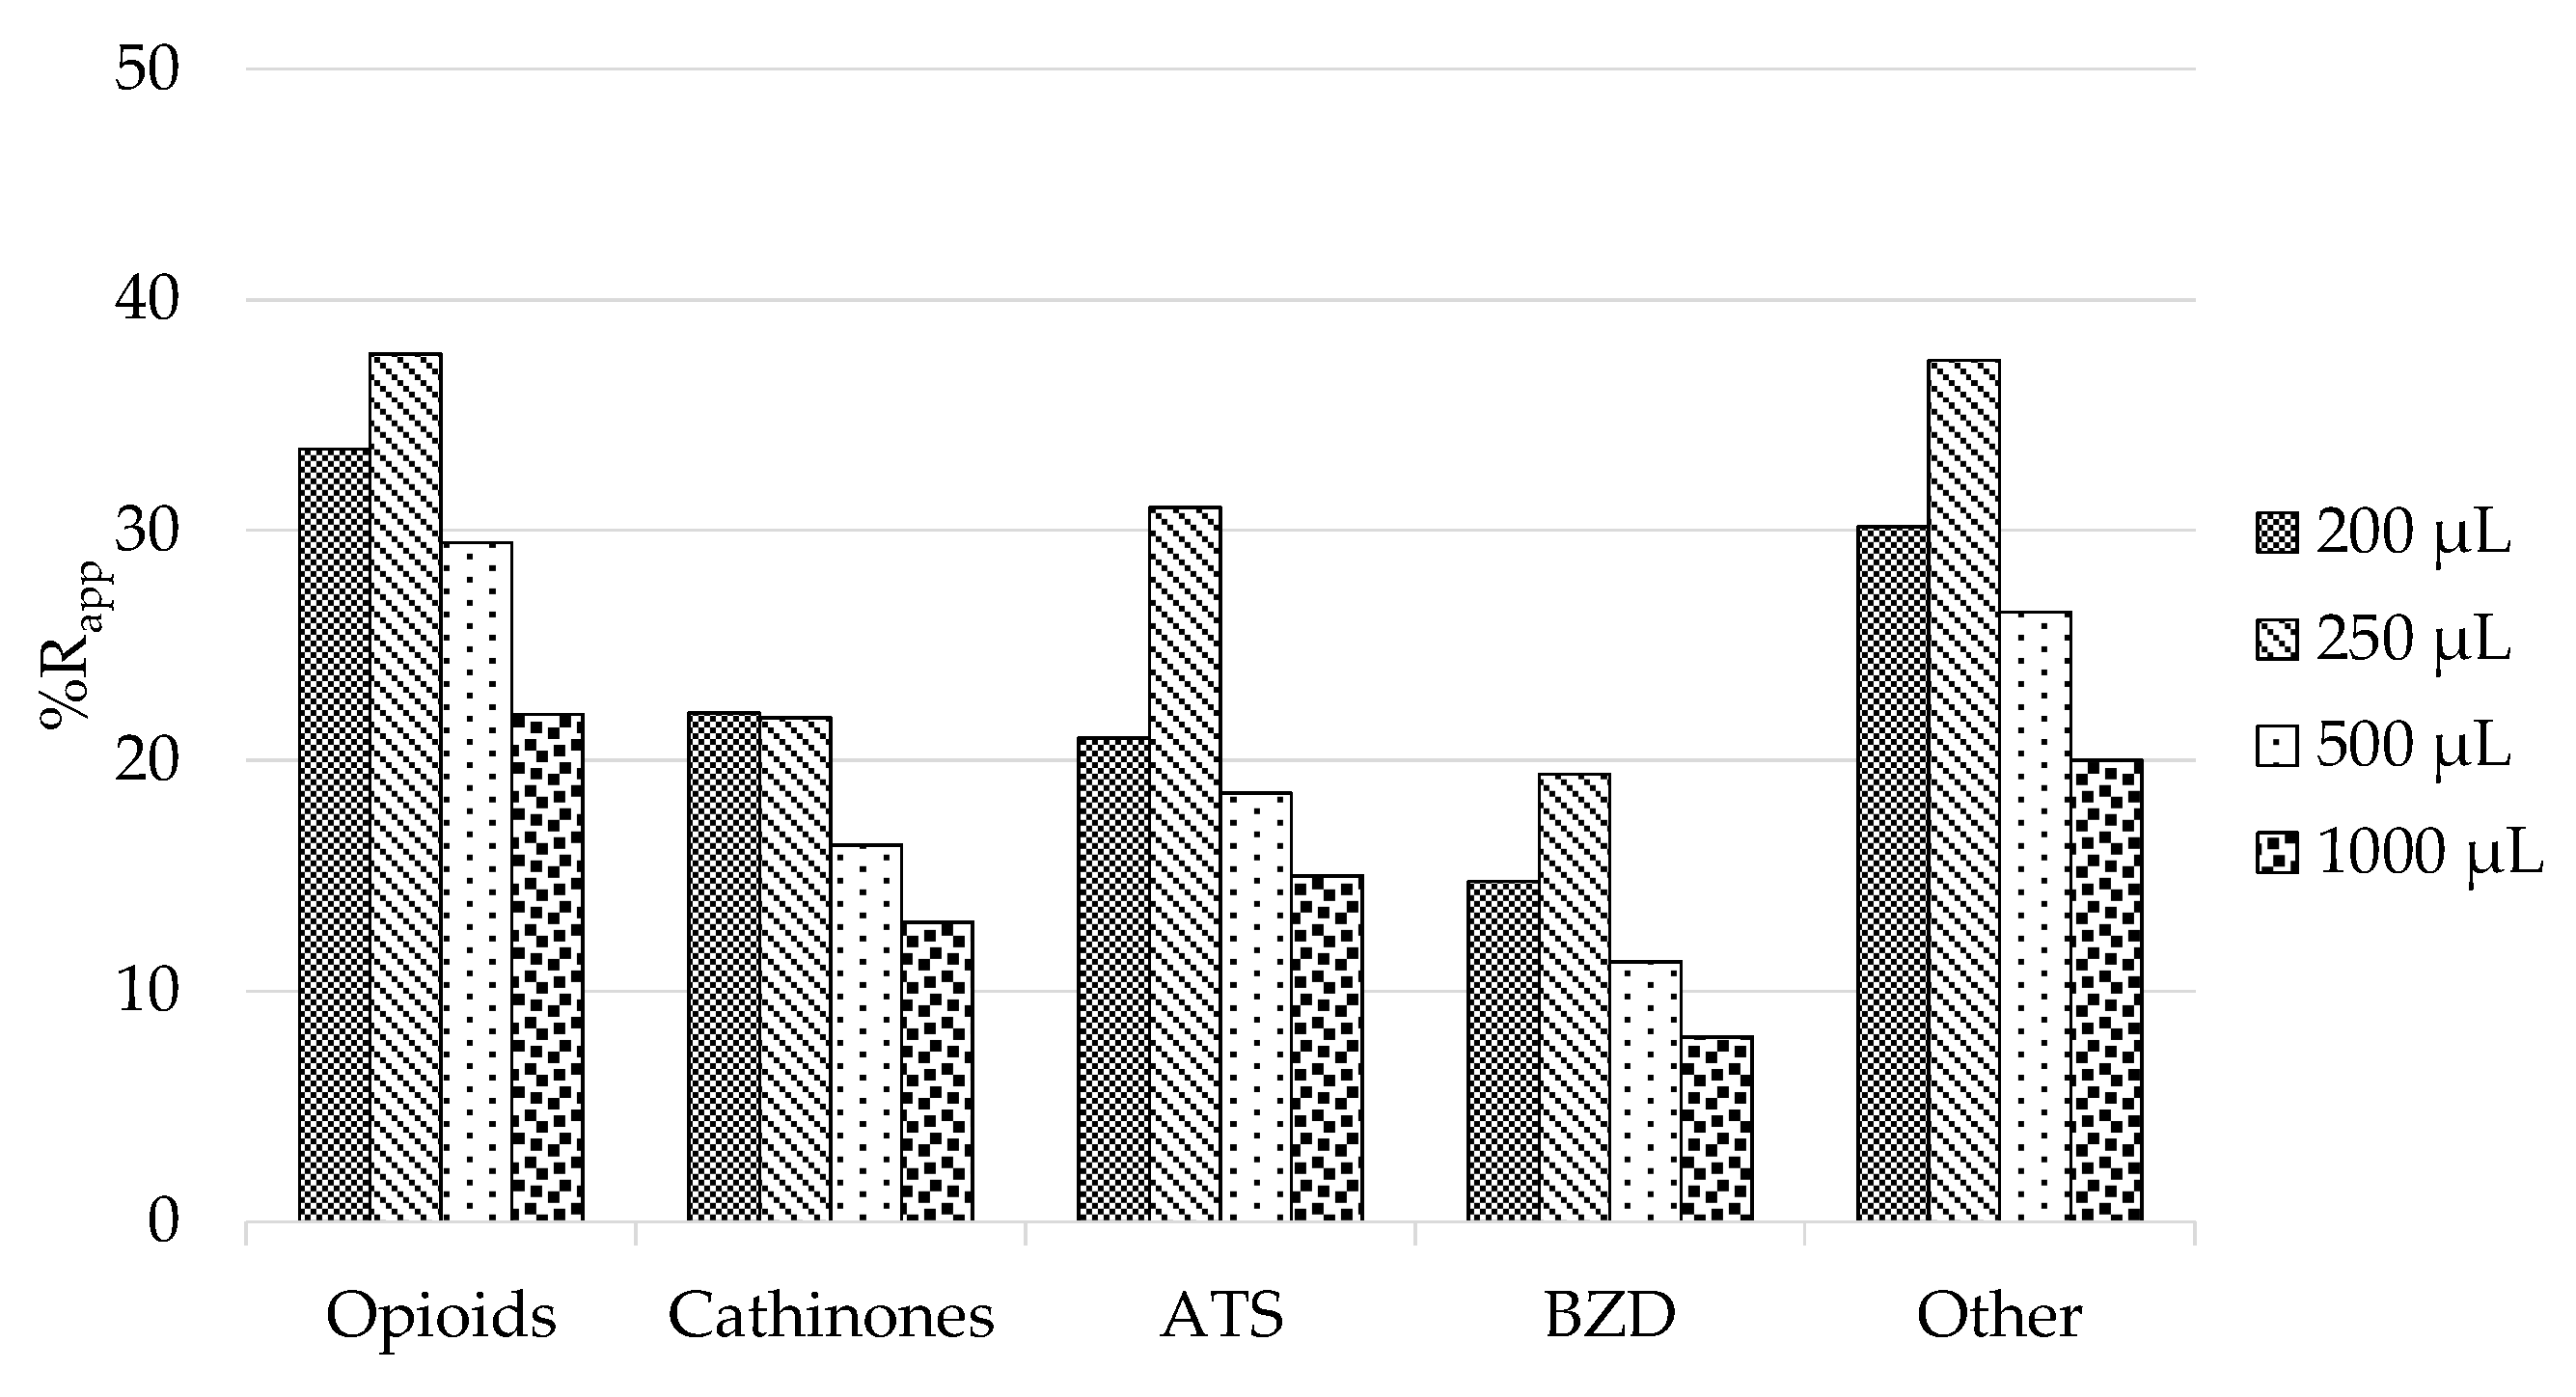
3.1. PT-SPE Optimization

As previously mentioned in Section 1, several authors have used the PT-SPE strategy to extract different compounds from urine [20,24]. In the different reported strategies, several parameters have been demonstrated to affect extraction efficiency and for that reason, the present research examines the influence of these parameters in order to achieve the best extraction efficiency for the DOAs under study. The parameters evaluated were the amount of sorbent, the volumes and the aspirating/dispensing cycles of the loading, washing, and elution steps, and the reusability of the tips.
A general scheme of the PT-SPE procedure is shown in Figure 1. The extraction procedure is the same as in conventional SPE but in the case of PT-SPE, the solvents are not percolated through the sorbent, but instead are aspirated and dispensed. The term aspirate refers to filling up the pipette with the volume indicated while dispensing means emptying the pipette of the volume aspirated. This combination is known as one aspirating/dispensing cycle. This action can be performed several times and thus several aspirating/dispensing cycles can be carried out. In this sense, a volume is aspirated, then it is dispensed to waste, again another volume is aspirated and dispensed, and this action is performed a fixed number of times (cycles). In the same way as for conventional SPE, the first step of pre-treatment is conditioning the sorbent, the second step is loading the sample, the next step is washing, and the final step is eluting the analytes.
The starting conditions for optimization were based on a previous study in which the same group of DOAs was determined in urine by SPE and LC-MS/MS [37]. These conditions were adapted with slight modifications to the PT-SPE methodology and were as follows: one cycle of 1 mL MeOH and one cycle of 1 mL H2O pH 4 adjusted with HCOOH ≥ 98% (conditioning), one cycle of loading 1 mL of a mixture of urine:H2O pH 4 (50:50, v/v) (loading), one cycle of 1 mL MeOH (washing) and one cycle of 1 mL 5% NH4OH in MeOH (elution). An amount of 100 µL of 1% HCl in MeOH was added to the methanolic solution. It was then evaporated to dryness with the MiVac, and finally reconstituted with 250 µL of initial mobile phase and filtered through a 0.45 µm PTFE filter prior to its injection in the LC-MS/MS. A drug-free urine sample spiked at 50 ng mL−1 containing the DOAs under study was used for this purpose and each analysis was performed in triplicate.
Amount of sorbent. Based on the previous study in which different sorbents were tested and compared for the SPE of the same analytes in urine, ExtraBond SCX was selected for the present PT-SPE strategy [37]. The amount of this sorbent was evaluated and 5, 10, 15, 20, 25, and 30 mg were all considered suitable for the 200 µL tip. Problems with blocking and operational difficulty were observed when 25 and 30 mg were used. The results for the other tested conditions can be seen in Figure 2, in which the mean area of all the studied compounds is represented for 5, 10, 15, and 20 mg of sorbent. As can be observed in Figure 2, the results showed that the adsorption ability of the sorbent increased by increasing the amount of sorbent to 10 mg, and for this amount of sorbent, the maximum peak area values were obtained and then decreased. This suggests that 5 mg of sorbent was not enough for this sample volume while amounts higher than 10 mg probably need more volume to elute the analytes and thus the areas were reduced. In general, the areas obtained with the optimal amount were around 8% higher compared to 5 mg, around 11% higher compared to 15 mg, and around 32% higher compared to 20 mg. Therefore 10 mg of ExtraBond SCX sorbent was chosen as the optimal amount.
Sample loading volume. With 10 mg of sorbent, the sample loading volume was evaluated and for this purpose 200, 250, 500, and 1000 µL of urine:H2O pH 4 (50:50, v/v) were studied. Even though a low %Rapp was achieved with all the tested volumes, as Figure 3 shows, the one which provided the best results was 250 µL. To better illustrate this, the DOAs in the figure are divided into five different families: opioids, cathinones, ATS, BZD, and other DOAs, and the mean %Rapp of each family is shown. In the case of 250 µL of loading volume, %Rapp of 38, 22, 31, 19, and 37% were obtained, respectively, for the aforementioned families. The figure also shows that the %Rapp increases to 250 µL and then, for higher volumes, a lower %Rapp was obtained. The lowest %Rapp values were obtained for BZD. This can be explained by the difference between their pKa (around 2 for some of them, except for lorazepam and bromazepam) compared to the pKa values of most of the DOAs under study (between 7 and 10). Therefore, as was also observed in the previous SPE strategy [37], at a pH of 4, some BZDs are not charged and they are only retained by reversed-phase interactions, while the other compounds are also retained by ionic interactions. However, at a pH lower than 4, the %Rapp of the other families decreased and thus pH 4 was used for the further procedure.
Aspirating/dispensing cycles of sample loading volume. The number of aspirating/dispensing cycles of loading volume is of great importance in the PT-SPE technique since the adsorption of the analytes may vary after some cycles and there is no agreement about this issue in the literature, as was mentioned in the Introduction [27,28,30,32,33,34]. For this reason, one, two, and three aspirating/dispensing cycles of the sample loading volume were evaluated. Figure 4 shows that one cycle achieved the best results for all families except for opioids, which achieved slightly better %Rapp with two cycles (4% more). However, as the general trend was a decrease in the %, Rapp, as the aspirating/dispensing cycles increased, one cycle was found to be the optimal number. This could be because the retention strength was not sufficient to retain the analytes with more than one cycle or because after several cycles, the elution volume was not sufficient to elute all the analytes. Therefore, increasing the number of cycles, which means increasing the volume, led to lower retention, as was also observed in the study of the loading sample volume. Moreover, if two cycles of 250 µL are compared to one cycle of 500 µL, similar results can be observed, except in the case of opioids, where two cycles of 250 achieved better %Rapp.
Washing volume and cycles. The washing volume was also studied and 250, 500, and 1000 µL of MeOH were tested. The general trend between these volumes was that lower %Rapp was obtained for 250 µL whereas higher and similar values were obtained for 500 and 1000 µL. As these two volumes achieved similar %Rapp, and as a lower volume of organic solvent was used with 500 µL, this was selected washing as the volume. In particular, values of 39, 34, 38, 26, and 43% were obtained for opioids, cathinones, ATS, BZD, and other DOAs. It was observed that the %Rapp of BZD increased by decreasing the washing volume. In particular, using 250 µL of MeOH, BZD achieved %Rapp of 32%, maybe because, as mentioned above, they are not retained as much as other DOAs due to their pKa value. However, as the %Rapp of the other families decreased with 250 µL, 500 µL of MeOH was considered the optimal volume. In addition, the washing cycles were also studied and one, two, and three cycles of 500 µL of MeOH were evaluated. One washing cycle achieved the best results compared to two and three cycles, maybe because the retention strength decreased when the cycles were increased. In these cases, two cycles achieved similar or slightly lower %Rapp for opioids and cathinones (37 and 34%, respectively), but lower %Rapp for ATS, BZD, and other DOAs (30, 15, and 33%, respectively). If two cycles of 500 µL are compared to one cycle of 1000 µL, similar results were obtained for most families except for ATS, which was 8% higher for one cycle of 1000 µL. Therefore, one cycle of 500 µL of MeOH was finally selected.
Elution volume and cycles. An amount of 500 and 1000 µL of 5% NH4OH in MeOH were the initial elution volumes studied. It was observed that the best results in terms of %Rapp were achieved with 1000 µL of elution solvent compared to 500 µL (between 1 and 17% higher). As 1000 µL was the maximum volume of the micropipette used, more cycles were evaluated to see if the %Rapp could be increased. In particular, the combination of one cycle of 1000 µL with one cycle of 500 µL (total volume of 1500 µL) and two cycles of 1000 µL (total volume 2000 µL) were studied. Results showed similar results of %Rapp for these two combinations and both of them were similar to one cycle of 1000 µL (up to 5% more for the total volumes of 1500 µL and 2000 µL). Considering the similar %Rapp achieved and that the extraction time with one cycle is shorter than when two cycles are combined, one cycle of 1000 µL of 5% NH4OH in MeOH was selected as the optimal elution step.
Reusability. The possibility of reusing the tips to save costs was also investigated by analyzing five samples with the same tip and five samples with different tips. The deviation in terms of %RSD of the %Rapp achieved was compared in both cases. It was observed that a higher %RSD was obtained by reusing the same tip (between 14 and 27%) than by using new ones (between 8 and 20%). One possible explanation is that after the first use, the particles of sorbent move and they are not as compressed between the two pieces of cotton as in the first use; thus, the retention is different than when they are first pressed. Therefore, due to the higher changes when the tip was reutilized and the low cost of a new tip, tips were not reutilized in order to avoid wider variation in the results.
Table 1 shows a summary of the extraction conditions used for the PT-SPE procedure. After the extraction, 1% HCl in MeOH was added to the methanolic solution prior to its evaporation to dryness with the MiVac. It was reconstituted with 250 µL of mobile phase at initial conditions, filtered through a 0.45 µm PTFE syringe filter, and finally analyzed with the LC-MS/MS.

3.2. Method Validation

The instrumental linearity of the present method was between the IQL and 125, 200, or 250 ng mL−1 depending on the DOA. The method achieved IDLs from 0.01 to 1.5 ng mL−1 and IQLs between 0.1 and 5.0 ng mL−1 for the DOAs under study. To evaluate the possible endogenous or exogenous interferences, different drug-free urine samples from laboratory staff members were analyzed. In particular, the exogenous interferences studied involved some benzodiazepines and some sex-related drugs. The results showed that no interferences could be observed at the same retention times of the DOAs under study. The validation parameters are shown in Table 2.
The calibration model was adjusted to one or two matrix-matched calibration curves from the MQL to 75 or 100 ng mL−1, depending on the DOA, all with r2 higher than 0.990. The MDLs of the present method were between 0.025 to 0.500 ng mL−1, while the MQLs were between 0.100 and 1.500 ng mL−1. The %Rapp, ME, repeatability, and reproducibility were studied at low (2 ng mL−1), medium (20 ng mL−1), and high (65 ng mL−1) levels of concentration. In the case of %Rapp, values were between 11 and 55% (2 ng mL−1), from 12 to 58% (20 ng mL−1), and from 16 to 62% (65 ng mL−1). %ME achieved values between −18 and −50%, −12 and −48%, and between −11 and −47%, for 2, 20, and 65 ng mL−1, respectively. For reproducibility and repeatability, values lower than 20% were obtained for the three levels of concentration. Stability was evaluated for 50 h at 10 °C by analysis replicates of 2, 20, and 65 ng mL−1 in urine (n = 5) without evidence of degradation in this period. %RSD values lower than 7% for the mentioned calibration levels were obtained by injecting each calibrator sample every 10 h. The method was then tested with blind urine samples spiked at three different concentrations by a laboratory staff member. They were spiked at 6 ng mL−1, 32 ng mL−1, and 58 ng mL−1 in urine, and the accuracy was calculated as the error between the concentration calculated with the matrix-matched calibration curve and the concentration spiked in the same sample. These errors were between 9 and 18% for 6 ng mL−1, from 9 to 17% for 32 ng mL−1, and from 3 to 14% for 58 ng mL−1.
Even though the MDLs and MQLs are not as low as with the previously conventional SPE strategy developed for the same group [37], the present PT-SPE methodology achieved the usual levels at which these compounds can be found in urine samples from drug abusers by means of a simple, quick, green technique with high throughput.

3.3. PT-SPE LC-MS/MS Application to Real Cases

With drug rehabilitation programs, it is important to be able to provide useful methods for controlling patient admissions and monitoring throughout the program. As Table 3 shows, the PT-SPE technique developed was applied to twenty-two urine specimens from women starting a detoxification program and the results were compared to the results obtained by the conventional SPE methodology [37]. A total of 20 positive samples out of 22 analyzed were confirmed, finding COC, BZE, HER, diazepam, lorazepam, bromazepam, MDMA, MDA, MOR, 6-AM, and fentanyl. As Table 3 shows, different compounds were found, which can be attributed to the polyconsumption of DOAs. This could be detected in 14 specimens and most of them were due to the consumption of COC with a BZD and/or HER. All concentrations out of the linear range were diluted for their correct quantification. COC was the most frequently detected substance due to its presence in 16 specimens and the presence of its main metabolite BZE in 19, which could be found in some specimens where COC could not be detected. Concentrations of COC were between <MQL and 540 ng mL−1, while for BZE this ranged from <MQL to 9585 ng mL−1. The BZD diazepam, lorazepam, and bromazepam were found in seven, four, and one specimen, respectively. HER was found in seven samples while other compounds such as MOR, 6-AM, MDMA, MDA, and fentanyl were detected in one specimen.
Table 3 also compares the results of the present study with those obtained using the previously developed SPE methodology [37]. As can be observed, variations lower than 10% in most cases and up to 18% were achieved between the two methodologies. However, some compounds could not be quantified due to the higher MQLs achieved in the present methodology compared to the previous SPE. This is the case with lorazepam in specimen 1 and BZE in specimen 8. Even so, the PT-SPE methodology has proven its reliability and suitability for determining a large number of DOAs and their metabolites in urine and can achieve similar results to a conventional SPE procedure but with a more environmentally friendly procedure.

4. Conclusions

A new strategy based on homemade PT-SPE for the simultaneous determination of 40 DOAs and some of their metabolites has been successfully developed. This is the first time that ExtraBond SCX sorbent has been used for the self-assembly PT-SPE pre-treatment for the extraction of a large group of drugs in a complex biological sample such as urine. The PT-SPE technique offers an easy, fast, and environmentally friendly pre-treatment for extracting a large group of substances from urine. In comparison to our previously reported SPE strategy, the present method uses lower volumes of urine and organic solvent with slightly higher MDLs and MQLs, which are suitable for determining these drugs in urine from drug abusers. Even though weaker sensitivity is achieved in the present study compared to other conventional SPE strategies, the technique is able to determine these compounds at low levels of ng mL−1 in urine samples, as was proven when the method developed was applied to real urine samples from women starting a detoxification program. In these samples, COC was the most frequently detected substance, its metabolite BZE being found in most of them and the polyconsumption of different DOAs was also observed, mainly due to the presence of COC with a BZD. Providing multiresidue methods which are able to determine different types of DOAs as well as their metabolites is highly significant, since some of them can be totally metabolized and can only be found due to the presence of their metabolites.
In the future, more methodologies based on the PT-SPE strategy should be developed for determining different types of DOAs as they offer easy, cheap, green pre-treatments. Moreover, different sorbents should be tested to evaluate their suitability with large groups of drugs and if possible, the proposed technique should be applied to more DOAs to expand its applicability.

Supplementary Materials

The following supporting information can be downloaded at: https://www.mdpi.com/article/10.3390/separations9090233/s1, Table S1: MRM parameters of the DOAs under study.

Author Contributions

Conceptualization, S.P.-C., F.B., C.A. and M.C.; methodology, S.P.-C.; software, S.P.-C.; validation, S.P.-C., C.A. and M.C.; formal analysis, S.P.-C., C.A. and M.C.; investigation, S.P.-C., C.A. and M.C.; resources, F.B., C.A. and M.C.; data curation, S.P.-C., C.A. and M.C.; writing—original draft preparation, S.P.-C.; writing—review and editing, S.P.-C., C.A. and M.C.; visualization, S.P.-C., C.A. and M.C.; supervision, C.A. and M.C.; project administration, F.B., C.A. and M.C.; funding acquisition, F.B., C.A. and M.C. All authors have read and agreed to the published version of the manuscript.

Funding

This research was funded by the Ministerio de Ciencia, Innovación y Universidades, the Fons Social Europeu, the Iniciativa d’Ocupació Juvenil (PEJ2018-003102-A), and the European Regional Development Fund (ERDF) (Project: PID2020-114587GB-I00).

Informed Consent Statement

Informed consent was obtained from all subjects involved in the study.

Data Availability Statement

Not applicable.

Acknowledgments

Authors would like to thank the CECAS foundation of Tarragona for the samples provided and their volunteers.

Conflicts of Interest

The authors declare no conflicts of interest.

References

  1. United Nations Office on Drugs and Crimes World Drug Report 2021. Global Overview: Drug Demand; Drug Supply. ISBN 9789211483611. 2021. Available online: https://www.unodc.org/res/wdr2021/field/WDR21_Booklet_2.pdf (accessed on 7 April 2022).
  2. United Nations Office on Drugs and Crimes World Drug Report 2021. Drug Market Trends: Cocaine; Amphetamine-Type Substances. ISBN 9789211483611. 2021. Available online: https://www.unodc.org/res/wdr2021/field/WDR21_Booklet_4.pdf (accessed on 7 April 2022).
  3. United Nations Office on Drugs and Crime World Drug Report 2021. Drug Market Trends: Cannabis. Opioids. Available online: https://www.unodc.org/res/wdr2021/field/WDR21_Booklet_3.pdf (accessed on 7 April 2022).
  4. Saito, K.; Saito, R.; Kikuchi, Y.; Iwasaki, Y.; Ito, R.; Nakazawa, H. Analysis of Drugs of Abuse in Biological Specimens. J. Health Sci. 2011, 57, 472–487. [Google Scholar] [CrossRef]
  5. Singh, Z. Forensic Toxicology: Biological Sampling and Use of Different Analytical Techniques. Forensic Res. Criminol. Int. J. 2017, 4, 117–120. [Google Scholar] [CrossRef]
  6. Young, G.M.; Lurie, I.S. Recent Forensic Applications of Enhanced Chromatographic Separation Methods. J. Sep. Sci. 2022, 45, 369–381. [Google Scholar] [CrossRef]
  7. Liu, L.; Wheeler, S.E.; Venkataramanan, R.; Rymer, J.A.; Pizon, A.F.; Lynch, M.J.; Tamama, K. Newly Emerging Drugs of Abuse and Their Detection Methods: An ACLPS Critical Review. Am. J. Clin. Pathol. 2018, 149, 105–116. [Google Scholar] [CrossRef]
  8. Pascual-Caro, S.; Borrull, F.; Calull, M.; Aguilar, C. Recent Chromatographic and Electrophoretic Based Methods for Determining Drugs of Abuse in Urine and Oral Fluid: A Review from 2018 to June 2021. Trends Anal. Chem. 2022, 156, 116705. [Google Scholar] [CrossRef]
  9. Substance Abuse and Mental Health Services Administration Clinical Drug Testing in Primary Care. Available online: https://store.samhsa.gov/sites/default/files/d7/priv/sma12-4668.pdf (accessed on 14 February 2022).
  10. Institóris, L.; Árok, Z.; Seprenyi, K.; Varga, T.; Sára-Klausz, G.; Keller, É.; Tóth, R.A.; Sala, L.; Kereszty, É.; Róna, K. Frequency and Structure of Stimulant Designer Drug Consumption among Suspected Drug Users in Budapest and South-East Hungary in 2012–2013. Forensic Sci. Int. 2015, 248, 181–186. [Google Scholar] [CrossRef]
  11. Kraemer, T.; Roditis, S.K.; Peters, F.T.; Maurer, H.H. Amphetamine Concentrations in Human Urine Following Single-Dose Administration of the Calcium Antagonist Prenylamine—Studies Using Fluorescence Polarization Immunoassay (FPIA) and GC-MS. J. Anal. Toxicol. 2003, 27, 68–73. [Google Scholar] [CrossRef]
  12. Rosano, T.G.; Ohouo, P.Y.; Wood, M. Screening with Quantification for 64 Drugs and Metabolites in Human Urine Using UPLC-MS-MS Analysis and a Threshold Accurate Calibration. J. Anal. Toxicol. 2017, 41, 536–546. [Google Scholar] [CrossRef]
  13. De Campos, E.G.; da Costa, B.R.B.; dos Santos, F.S.; Monedeiro, F.; Alves, M.N.R.; Santos Junior, W.J.R.; de Martinis, B.S. Alternative Matrices in Forensic Toxicology: A Critical Review. Forensic Toxicol. 2022, 40, 1–18. [Google Scholar] [CrossRef]
  14. Ramos, L. Critical Overview of Selected Contemporary Sample Preparation Techniques. J. Chromatogr. A 2012, 1221, 84–98. [Google Scholar] [CrossRef]
  15. Bylda, C.; Thiele, R.; Kobold, U.; Volmer, D.A. Recent Advances in Sample Preparation Techniques to Overcome Difficulties Encountered during Quantitative Analysis of Small Molecules from Biofluids Using LC-MS/MS. Analyst 2014, 139, 2265–2276. [Google Scholar] [CrossRef]
  16. Bordin, D.C.M.; Alves, M.N.R.; de Campos, E.G.; de Martinis, B.S. Disposable Pipette Tips Extraction: Fundamentals, Applications and State of the Art. J. Sep. Sci. 2016, 39, 1168–1172. [Google Scholar] [CrossRef]
  17. Meyer, M.R.; Maurer, H.H. Current Status of Hyphenated Mass Spectrometry in Studies of the Metabolism of Drugs of Abuse, Including Doping Agents. Anal. Bioanal. Chem. 2012, 402, 195–208. [Google Scholar] [CrossRef]
  18. Kole, P.L.; Venkatesh, G.; Kotecha, J.; Sheshala, R. Recent Advances in Sample Preparation Techniques for Effective Bioanalytical Methods. Biomed. Chromatogr. 2011, 25, 199–217. [Google Scholar] [CrossRef]
  19. Li, N.; Zhang, T.; Chen, G.; Xu, J.; Ouyang, G.; Zhu, F. Recent Advances in Sample Preparation Techniques for Quantitative Detection of Pharmaceuticals in Biological Samples. Trends Anal. Chem. 2021, 142, 116318. [Google Scholar] [CrossRef]
  20. Turoňová, D.; Kujovská Krčmová, L.; Švec, F. Application of Microextraction in Pipette Tips in Clinical and Forensic Toxicology. Trends Anal. Chem. 2021, 143, 116404. [Google Scholar] [CrossRef]
  21. Kataoka, H. Recent Developments and Applications of Microextraction Techniques in Drug Analysis. Anal. Bioanal. Chem. 2010, 396, 339–364. [Google Scholar] [CrossRef]
  22. Seidi, S.; Tajik, M.; Baharfar, M.; Rezazadeh, M. Micro Solid-Phase Extraction (Pipette Tip and Spin Column) and Thin Film Solid-Phase Microextraction: Miniaturized Concepts for Chromatographic Analysis. Trends Anal. Chem. 2019, 118, 810–827. [Google Scholar] [CrossRef]
  23. Sorribes-Soriano, A.; Valencia, A.; Esteve-Turrillas, F.A.; Armenta, S.; Herrero-Martínez, J.M. Development of Pipette Tip-Based Poly(methacrylic acid-co-ethylene glycol dimethacrylate) Monolith for the Extraction of Drugs of Abuse from Oral Fluid Samples. Talanta 2019, 205, 120158. [Google Scholar] [CrossRef]
  24. Carasek, E.; Morés, L.; Huelsmann, R.D. Disposable Pipette Extraction: A Critical Review of Concepts, Applications, and Directions. Anal. Chim. Acta 2021, 1192, 339383. [Google Scholar] [CrossRef]
  25. He, X.; Sun, T.; Wang, L.; Jiang, X. Pipette-Tip Micro-Solid Phase Extraction Based on Melamine-Foam@polydopamine Followed by Ultra-High-Performance Liquid Chromatography–Quadrupole–Time-of-Flight Mass Spectrometry for Detection of Psychotropic Drugs in Human Serum. J. Chromatogr. B 2021, 1163, 122499. [Google Scholar] [CrossRef]
  26. Carneiro Cruz, J.; Cabral Miranda, L.F.; Costa Queiroz, M.E. Pipette Tip Micro-Solid Phase Extraction (Octyl-Functionalized Hybrid Silica Monolith) and Ultra-High-Performance Liquid Chromatography-Tandem Mass Spectrometry to Determine Cannabidiol and Tetrahydrocannabinol in Plasma Samples. J. Sep. Sci. 2021, 44, 1621–1632. [Google Scholar] [CrossRef]
  27. Ellison, S.T.; Brewer, W.E.; Morgan, S.L. Comprehensive Analysis of Drugs of Abuse in Urine Using Disposable Pipette Extraction. J. Anal. Toxicol. 2009, 33, 356–365. [Google Scholar] [CrossRef] [PubMed]
  28. Schroeder, J.L.; Marinetti, L.J.; Smith, R.K.; Brewer, W.E.; Clelland, B.L.; Morgan, S.L. The Analysis of Δ9-Tetrahydrocannabinol and Metabolite in Whole Blood and 11-nor-Δ9-Tetrahydrocannabinol-9-Carboxylic Acid in Urine Using Disposable Pipette Extraction with Confirmation and Quantification by Gas Chromatography-Mass Spectrometry. J. Anal. Toxicol. 2008, 32, 659–666. [Google Scholar] [CrossRef]
  29. Vlčková, H.; Pilařová, V.; Novák, O.; Solich, P.; Nováková, L. Micro-SPE in Pipette Tips as a Tool for Analysis of Small-Molecule Drugs in Serum. Bioanalysis 2017, 9, 887–901. [Google Scholar] [CrossRef]
  30. Shi, J.W.; Zhou, J.F.; He, X.; Zhang, Y. Rapid Analysis of Four Amphetamines in Urine by Self-Made Pipette-Tip Solid-Phase Extraction Followed by GC-MS/MS. J. Chromatogr. Sci. 2020, 58, 569–575. [Google Scholar] [CrossRef] [PubMed]
  31. Mozaner Bordin, D.C.; Alves, M.N.R.; Cabrices, O.G.; de Campos, E.G.; de Martinis, B.S. A Rapid Assay for the Simultaneous Determination of Nicotine, Cocaine and Metabolites in Meconium Using Disposable Pipette Extraction and Gas Chromatography-Mass Spectrometry (GC-MS). J. Anal. Toxicol. 2014, 38, 31–38. [Google Scholar] [CrossRef]
  32. Montesano, C.; Sergi, M.; Odoardi, S.; Simeoni, M.C.; Compagnone, D.; Curini, R. A μ-SPE Procedure for the Determination of Cannabinoids and Their Metabolites in Urine by LC-MS/MS. J. Pharm. Biomed. 2014, 91, 169–175. [Google Scholar] [CrossRef]
  33. Kumazawa, T.; Hasegawa, C.; Lee, X.P.; Hara, K.; Seno, H.; Suzuki, O.; Sato, K. Simultaneous Determination of Methamphetamine and Amphetamine in Human Urine Using Pipette Tip Solid-Phase Extraction and Gas Chromatography-Mass Spectrometry. J. Pharm. Biomed. 2007, 44, 602–607. [Google Scholar] [CrossRef] [PubMed]
  34. Napoletano, S.; Montesano, C.; Compagnone, D.; Curini, R.; D’Ascenzo, G.; Roccia, C.; Sergi, M. Determination of Illicit Drugs in Urine and Plasma by Micro-SPE Followed by HPLC-MS/MS. Chromatographia 2012, 75, 55–63. [Google Scholar] [CrossRef]
  35. Chen, X.; Wu, X.; Luan, T.; Jiang, R.; Ouyang, G. Sample Preparation and Instrumental Methods for Illicit Drugs in Environmental and Biological Samples: A Review. J. Chromatogr. A 2021, 1640, 461961. [Google Scholar] [CrossRef] [PubMed]
  36. Salazar Mogollón, N.G.; Quiroz-moreno, C.D.; Prata, P.S.; de Almeida, J.R.; Sof, A.; Augusto, F. New Advances in Toxicological Forensic Analysis Using Mass Spectrometry Techniques. J. Anal. Methods Chem. 2018, 2018, 4142527. [Google Scholar] [CrossRef]
  37. Pascual-Caro, S.; Borrull, F.; Aguilar, C.; Calull, M. Development of a Liquid Chromatography—Tandem Mass Spectrometry Method for the Simultaneous Determination of 40 Drugs of Abuse in Human Urine: Application to Real Cases. J. Anal. Toxicol. 2022, bkac020. [Google Scholar] [CrossRef] [PubMed]
  38. Taskinen, S.; Beck, O.; Bosch, T.; Brcak, M.; Carmichael, D.; Fucci, N.; George, C.; Piper, M.; Salomone, A.; Schielen, W.; et al. European Guidelines for Workplace Drug Testing in Urine. Drug Test. Anal. 2017, 9, 853–865. [Google Scholar] [CrossRef] [PubMed]
  39. Official Journal of the European Communities EC/96/23 Commission Decision of 12 August 2002 Implementing Council Directive 96/23/EC Concerning the Performance of Analytical Methods and the Interpretation of Results. ISBN 9788578110796. 2002. Available online: http://extwprlegs1.fao.org/docs/pdf/eur49615.pdf (accessed on 7 April 2022).
Figure 1. A scheme of the PT-SPE procedure.
Separations 09 00233 g001
Figure 2. Effect of mg of sorbent on the area obtained by the analytes under study.
Separations 09 00233 g002
Figure 3. Evaluation of different loading volumes of urine:H2O at pH 4 (50:50, v/v) at a spiked concentration of 50 ng mL−1.
Separations 09 00233 g003
Figure 4. Evaluation of different aspirating/dispensing loading cycles of urine:H2O at pH 4 (50:50, v/v) at a spiked concentration of 50 ng mL−1.
Separations 09 00233 g004
Table 1. Extraction conditions of the PT-SPE procedure for the determination of 40 DOAs in urine by LC-MS/MS.
ParameterOptimum Condition
Type of sorbentExtraBond SCX
Amount of sorbent10 mg
Conditioning1 cycle of 500 µL of MeOH and 1 cycle of 500 µL of H2O at pH 4
Loading sample volume and cycles1 cycle of 250 µL of the mixture urine:H2O at pH 4 (50:50, v/v)
Washing volume and cycles1 cycle of 500 µL of MeOH
Elution volume and cycles1 cycle of 1000 µL of 5% NH4OH in MeOH
Table 2. Validation parameters of the DOAs under study.
CompoundMDL aMQL aLinear Range a%Rapp b%ME b%Rapp c%MEc%Rapp d%ME d
1MOR0.0500.2500.25–5 5–10055−5055−4254−47
2COD0.0500.2500.25–5 5–7542−4158−3653−27
3Methylephedrine0.5001.5001.5–7540−3442−3547−34
4DMC0.2501.0001–7515−2212−2416−21
5Methylone0.0500.2500.25–5 5–7545−3145−2752−24
6Flephedrone0.2501.0001–7519−4621−4819−45
7AMP0.2501.0001–7525−3331−2729−26
8Ethcathinone0.2501.0001–7529−2433−1936−22
9Hyoscine0.1501.0001–7546−1848−1451−15
106-AM0.2500.7500.75–7543−3853−3456−24
11MDA0.2501.0001–7534−2436−2542−22
12MAMP0.2500.7500.75–5 5–10032−3331−2636−16
13Methedrone0.1000.5000.5–7545−2847−2652−18
14Ethylone0.2500.7500.75–10048−3245−2949−21
15Buphedrone0.2500.7500.75–7522−3326−3029−21
16MDMA0.1000.5000.5–5 5–10041−2939−2448−19
17Oxo-LSD0.5001.5001.5–7517−2635−2243−18
182-MMC0.2501.0001–7518−3122−2626−23
19Butylone0.2500.7500.75–10038−2537−2248−20
20Mephedrone0.1000.5000.5–5 5–10033−3538−3245−25
21Norketamine0.2501.0001–10020−3129−2735−25
22KET0.2501.0001–10035−3238−2443−20
23BZE0.0750.2500.25–5 5–10037−3348−2151−21
244-MEC0.0750.2500.25–5 5–10027−2132−2041−18
25Pentedrone0.1000.5000.5–5 5–10020−3325−2735−21
263,4-DMMC0.1000.5000.5–5 5–10036−3637−3542−23
27HER0.1000.5000.5–5 5–7512−3314−2817−26
28Alpha-PVP0.0250.1000.1–5 5–7529−3433−3041−22
29COC0.0300.1000.1–5 5–10052−1958−1262−11
30MDPV0.0300.1000.1–5 5–10047−2550−2254−16
31LSD0.0300.1000.1–5 5–10039−2945−2754−19
32Pyrovalerone0.0300.1000.1–5 5–7531−1933−1736−11
33Fentanyl0.1000.5000.5–5 5–10049−2251−2253−17
34Bromazepam0.5001.5001.5–7554−3258−2661−22
35Buprenorphine0.5001.5001.5–7534−2936−2738−25
36EDDP0.0750.2500.25–5 5–10040−2944−2549−21
37Methadone0.1500.5000.5–5 5–10030−2834−2641−17
38Lorazepam0.5001.5001.5–10011−3219−2821−18
39Alprazolam0.5001.5001.5–10047−2653−2457−21
40Diazepam0.0250.1000.1–5 5–10046−1947−1853−16
a ng mL−1; b 2 ng mL−1; c 20 ng mL−1; d 65 ng mL−1.
Table 3. Concentration of the DOAs detected in urine samples from women starting a detoxification program and comparison with the SPE methodology.
SpecimenAnalyte DetectedConcentration Found with the PT-SPE Method (ng mL−1)Concentration Found with the SPE Method (ng mL−1) [37]
1Lorazepam<MQL0.531 ± 0.020
Diazepam137 ± 4144 ± 3
2COC2.45 ± 0.052.11 ± 0.06
BZE16.2 ± 0.515.6 ± 0.4
HER3.0 ± 0.12.64 ± 0.06
3COC0.45 ± 0.050.48 ± 0.06
BZE17.8 ± 0.518.2 ± 0.4
4COC<MQL<MQL
BZE7.5 ± 0.57.64 ± 0.11
5BZE4.4 ± 0.14.56 ± 0.07
Lorazepam4.91 ± 0.084.73 ± 0.03
6COC5.2 ± 0.34.90 ± 0.09
BZE1970 ± 221993 ± 17
7COC2.92 ± 0.052.97 ± 0.07
BZE58 ± 154.1 ± 0.4
8COC<MQL<MQL
BZE<MQL0.39 ± 0.05
Lorazepam14.1 ± 0.313.71 ± 0.08
Diazepam5.3 ± 0.25.3 ± 0.3
9---
10COC7.6 ± 0.37.72 ± 0.14
BZE9.2 ± 0.48.8 ± 0.1
11COC<MQL<MQL
BZE43.2 ± 0.842.4 ± 0.4
12COC122 ± 4119 ± 2
BZE262 ± 5257.8 ± 0.4
Diazepam2.45 ± 0.152.21 ± 0.09
13HER57 ± 158.3 ± 0.8
MOR2.1 ± 0.31.78 ± 0.11
6-AM9.9 ± 0.79.4 ± 0.3
COC6.0 ± 0.36.34 ± 0.10
BZE232 ± 4235.5 ± 0.4
Diazepam9.8 ± 0.610.3 ± 0.3
14BZE1.8 ± 0.11.69 ± 0.04
HER<MQL<MQL
Bromazepam3.4 ± 0.33.74 ± 0.14
15COC1.87 ± 0.181.94 ± 0.11
BZE111.8 ± 0.9112.4 ± 0.4
HER6.1 ± 0.66.5 ± 0.3
16COC1.4 ± 0.11.31 ± 0.09
BZE49 ± 147.8 ± 0.4
HER33 ± 230.9 ± 0.8
Lorazepam3.3 ± 0.43.03 ± 0.03
17COC10.7 ± 0.310.9 ± 0.3
BZE260 ± 4257.9 ± 0.4
Diazepam2.6 ± 0.42.8 ± 0.2
18COC540 ± 5535 ± 2
BZE9585 ± 249572 ± 1
HER5.9 ± 0.66.5 ± 0.3
MDMA1.5 ± 0.11.52 ± 0.03
MDA<MQL<MQL
19BZE23.1 ± 0.822.2 ± 0.4
HER6.0 ± 0.76.5 ± 0.3
Diazepam12.0 ± 0.612.1 ± 0.4
20COC<MQL<MQL
BZE24.5 ± 0.424.4 ± 0.4
Diazepam14.7 ± 0.715.1 ± 0.5
21COC14.7 ± 0.714.5 ± 0.6
BZE61 ± 160.4 ± 0.4
Fentanyl40 ± 142.2 ± 0.7
22---
Publisher’s Note: MDPI stays neutral with regard to jurisdictional claims in published maps and institutional affiliations.

