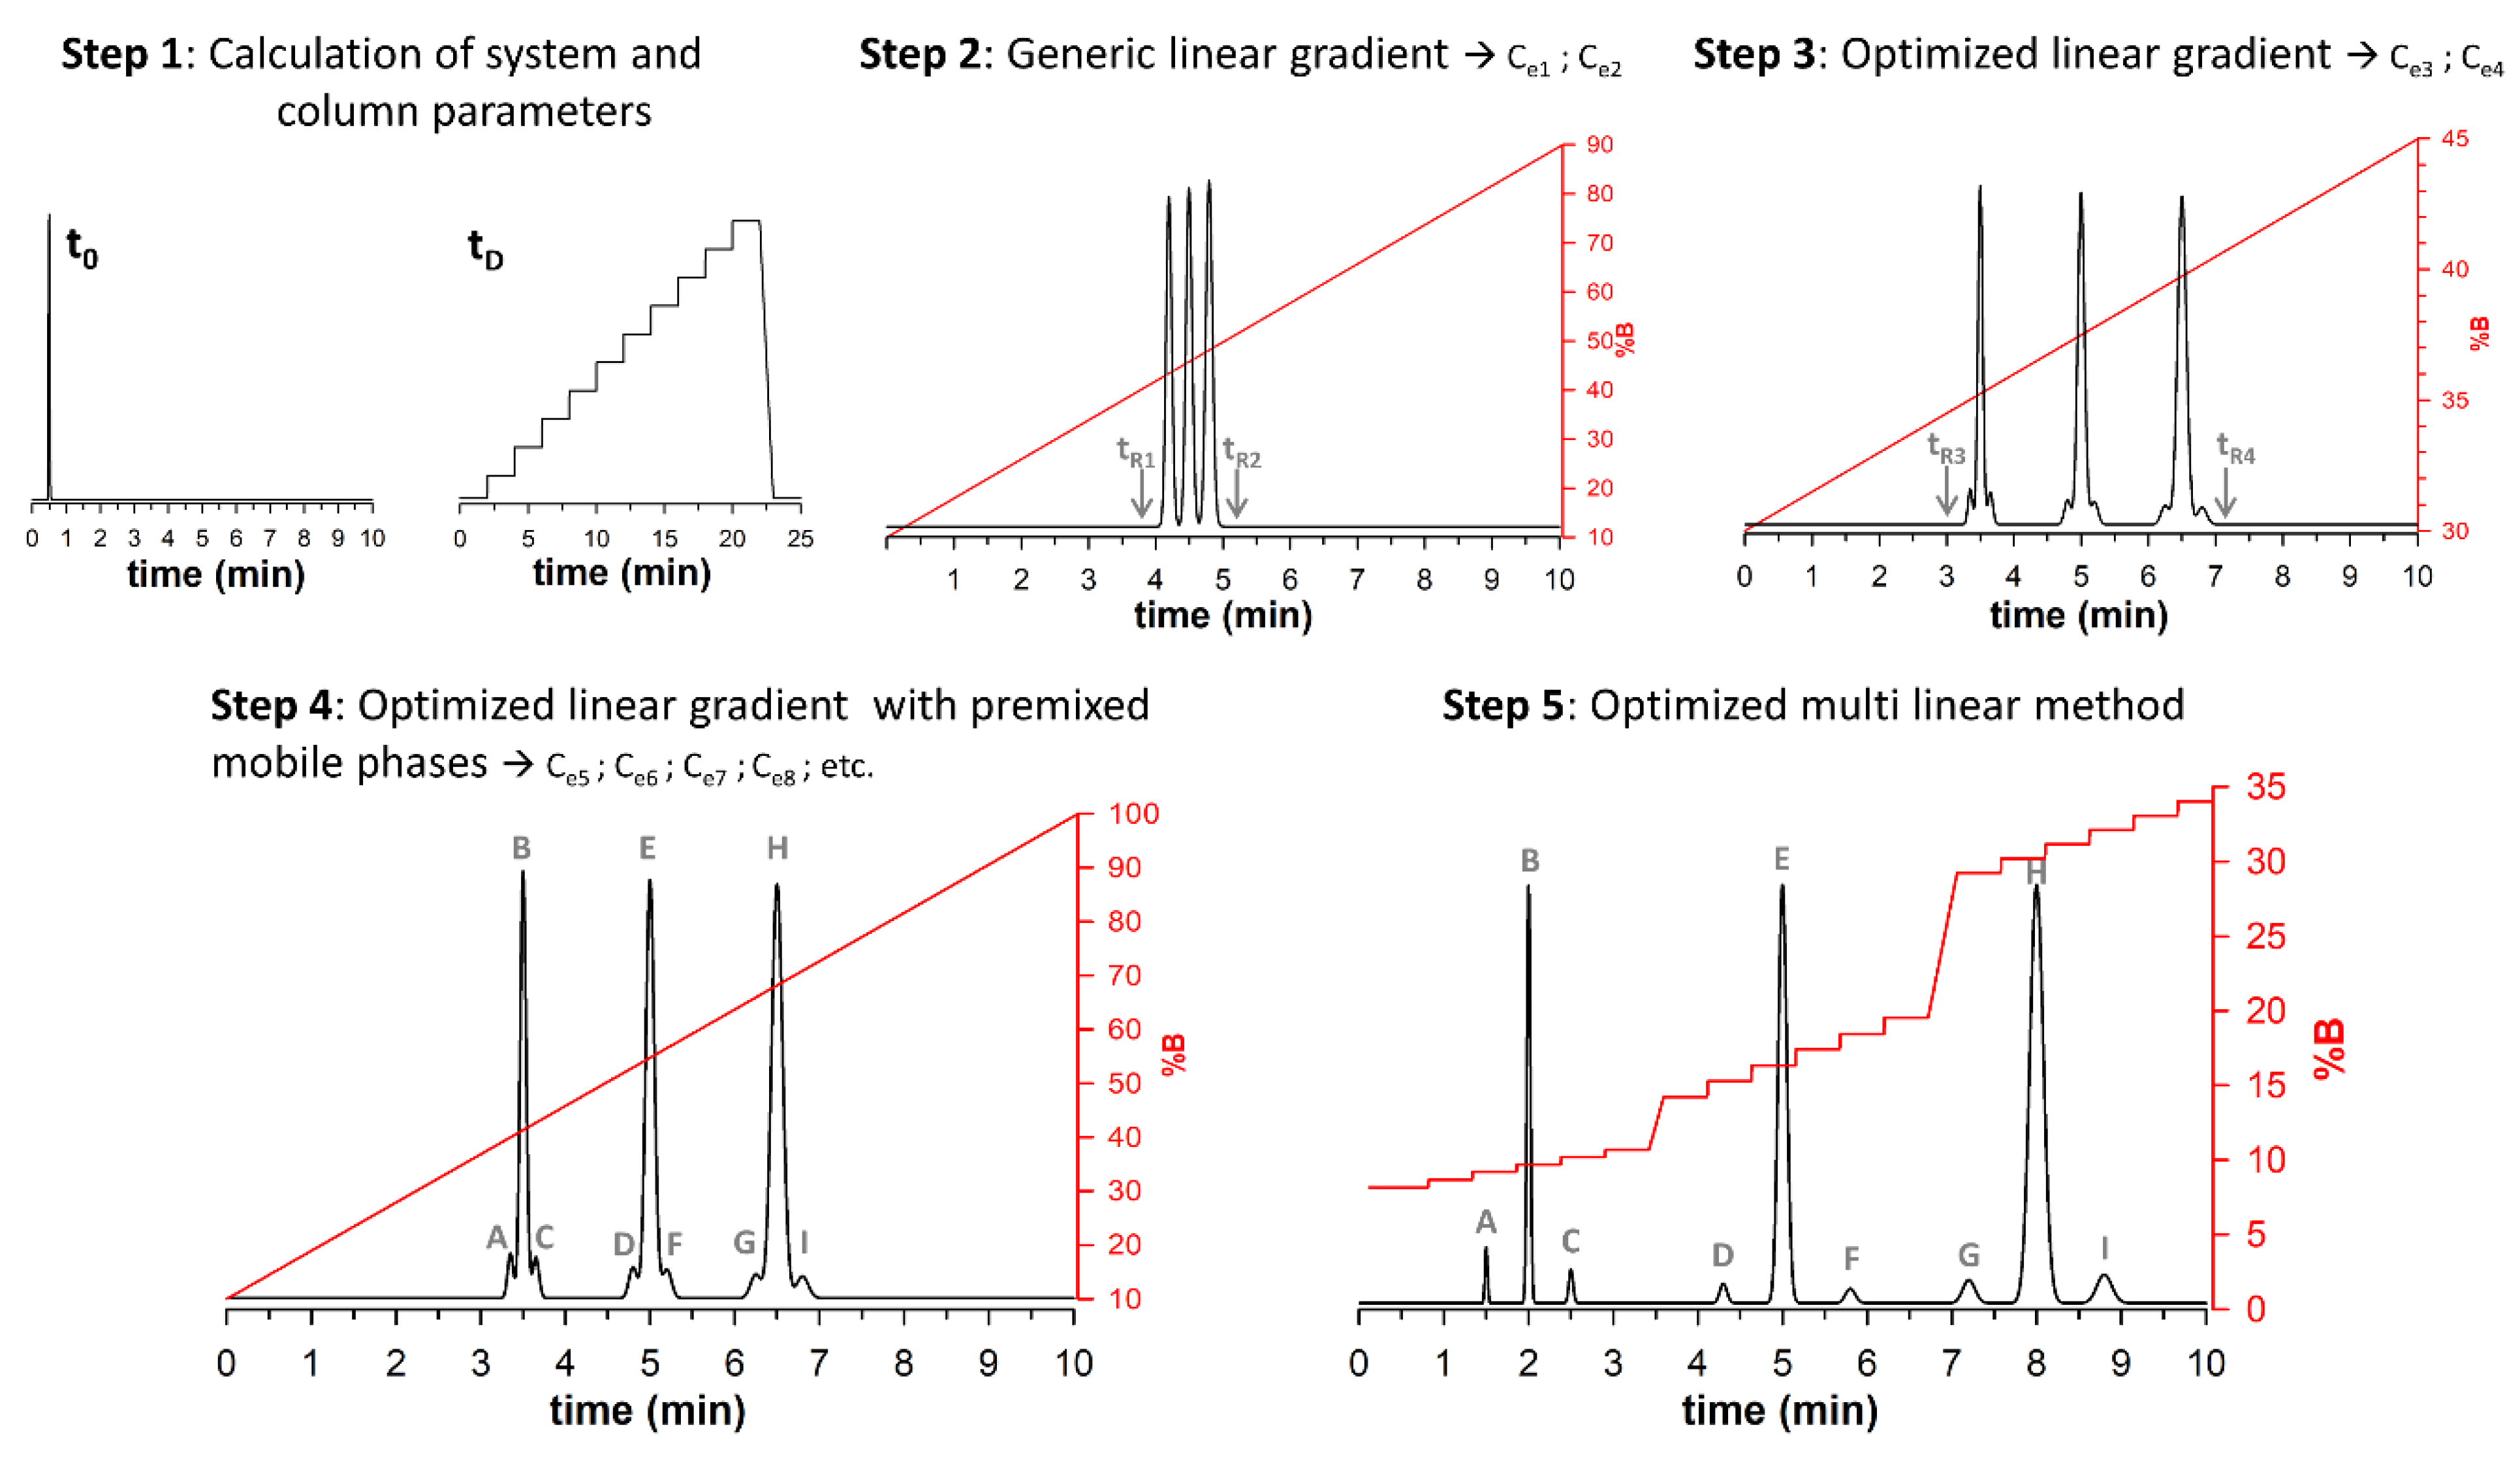
3.1. Workflow to Develop an Optimal Multi-Isocratic Method
First, we wanted to justify why the method was called the multi-isocratic elution mode rather than the multi-step gradient. In a multi-step gradient, the analyzed compounds are eluted during parts of the gradient having different slopes or possibly during isocratic parts. In the multi-isocratic elution mode, the principle is rather different. Indeed, gradient profiles include parts of the gradient with a very strong slope (change in composition was performed in only 0.02 min) followed by relatively long isocratic parts (equal to 1.5 min); this allows sufficient selectivity between the successive peaks. This means that the isocratic sections are 75-fold more important in time than the gradient sections. In other words, isocratic steps constitute more than 95% of the total gradient time; hence, the importance we wish to give to the isocratic steps by calling this method the “multi-isocratic elution mode” to differentiate it from a more classical “multi-step gradient”.
To develop an optimized multi-isocratic method in RPLC, without the need for modelling software (Drylab, Chromsword, etc.), preliminary experiments following the five steps listed below are required; these are also summarized in
Figure 1:
The first step is straightforward and consists of measuring the system and column parameters, namely system dwell time (
tD) and column dead time (
t0). For this purpose, some generic procedures already described elsewhere can be followed [
10,
11].
The second step is also quite simple and consists in performing a first generic linear gradient experiment. For successful operation, water + 0.1% trifluoroacetic acid (TFA), formic acid (FA) or DFA should be used as mobile phase A; while mobile phase B is composed of ACN + 0.1% of the same additive. Then, a generic gradient program from 10 to 90% B is performed at a column temperature of 60–90 °C, with a gradient time of 10 min. These conditions are in line with what is commonly used for the analysis of protein biopharmaceuticals [
12]. Based on this initial experiment, the retention times at the start of the first peak and the end of the last peak are obtained. These two retention times values (
tr1 and
tr2) are then transformed into elution compositions (
Ce1 and
Ce2) using the following equation:
where
Ci and
Cf represent the initial and final composition of the initial gradient, respectively, and
tg is the gradient time.
In a third step, an optimized linear gradient is performed using the elution compositions (Ce1 and Ce2) calculated with equation 1 as the initial and final compositions; while the gradient time remains constant (10 min). Again, from this gradient, the retention times corresponding to the start of the first peak and the end of the last peak (tr3 and tr4, respectively) are transformed into elution compositions (Ce3 and Ce4) using Equation (1).
The fourth step consists of performing an experiment with the optimized linear gradient using
Ce3 and
Ce4 as the initial and final compositions; however, using premixed mobile phases rather than a purely aqueous or organic mobile phase to have the most precise mobile phase delivery. Indeed, it is important to keep in mind that very small variations of mobile phase composition are required in the multi-isocratic elution method (see step 5). This will improve the repeatability and robustness of the final method. This step is important since modifications of the compound elution can take place between non-premixed and premixed mobile phases; this is because the pump does not work always identically in a narrow vs. large composition range. To provide a sufficient level of flexibility when preparing the premixed mobile phases, the initial elution composition of the optimized linear gradient (
Ce3) has to be decreased by 5%; while the final elution composition found at step 3 (
Ce4) should be increased by 5%. With this premixed mobile phase, the final and initial compositions (
Ci2 and
Cf2) of the optimized linear gradient from step 3 can be recalculated using the following equations:
Once the gradient is performed, it may contain several zones of interest corresponding to different regions containing peaks that require resolution improvement. For each zone of interest, it is required to estimate the retention times at the beginning and end of the zone that can both be transformed into elution compositions using equation 1. For example, if there are three zones of interest, the user will need to calculate Ce5, Ce6 and Ce7 as start compositions of each zone; and Ce8, Ce9 and Ce10 as end compositions of each zone.
The last step of the process consists of finding the optimal multi-isocratic method based on the different values found at step 4, namely Ce5, Ce6, Ce7, Ce8, Ce9 and Ce10. However, it is also important to consider some additional parameters in each zone, namely the number of isocratic steps that will be required to improve the selectivity in each zone (generally comprised between 3 and 6); the duration of each step (usually comprised between 0.5 and 1.5 min); and the time required to move from one step to the next one (usually 0.01 min). Finally, it is also important to define the time between each zone (usually 1 min). From all of these values, the gradient profile can then be constructed either in an automatic way using an Excel spreadsheet or manually.
As highlighted in the next sections, the gradient profile complexity increases with the number of zones of interest and the number of isocratic steps in each zone.
3.2. Application to mAb-Cytokine Fusion Protein Sample
In the first instance, the multi-isocratic workflow described in
Section 3.1 was applied to a complex mAb-cytokine fusion protein sample [
13] of about 165 kDa that was reduced and temperature-stressed using the procedures described in the experimental section (the corresponding gradient conditions are summarized in
Tables S1–S3). For this complex molecule, the chemical reduction with DTT should generate three different sub-units corresponding to two identical light chains (LC
A) of about 24 kDa; one heavy chain (HC
H) having a size of 50 kDa; and one heavy chain linked to a cytokine (HC
K), corresponding to a size of 66 kDa. As expected, three main peaks were observed in the RPLC chromatograms obtained using the optimized linear gradient (
Figure 2A; gradient conditions provided in
Table S2) and the optimized multi-isocratic gradient (
Figure 2B; gradient conditions provided in
Table S3). The elution order of the different sub-units was LC
A, followed by HC
H and HC
K.
The chromatogram shown in
Figure 2A corresponds to that obtained at step 4 of the workflow described in
Section 3.1, using premixed mobile phases, as well as optimized initial and final mobile phase conditions. Combining 0.05% DFA as a mobile phase additive [
14], a temperature of 70 °C [
15] and a modern stationary phase [
16], very good resolving power and sharp peaks can be obtained under RPLC conditions. However, the forced degraded sample [
17] also contains numerous minor species that were only partially separated from the three main sub-units. The resolving power of the method proved too limited to obtain sufficient separation for all these variants.
In this context, a multi-isocratic method was developed to further improve the selectivity for the minor variants. In this example, three zones of interest (each corresponding to the elution of a sub-unit species) were considered. These three zones cover the ranges 1.50 to 2.20 min; 3.50 to 4.20 min; and 6.95 to 8.60 min in the chromatogram shown in
Figure 2A. In each of these zones, six isocratic steps of 1.5 min were added to further improve the selectivity and overall separation quality. The mobile phase composition range over a given zone was divided by 5 and this number (rounded) was used to create six steps of equally incrementing composition. As an example, in the first zone, the initial and final retention times of 1.5 and 2.2 min were transformed into mobile phase compositions of 16% and 25.9% using equation 1. Then, the six isocratic steps were performed at 16, 18, 20, 21.9, 23.9 and 25.9%. The change between each mobile phase composition was performed in only 0.01 min. The same strategy was applied to the two other zones and the final gradient conditions are provided in
Table S3 of the Supplementary Material.
As shown in
Figure 2B, the separation can be improved when applying the multi-isocratic vs. linear gradient approach. This is illustrated with the different arrows highlighting the much better separation observed with the multi-isocratic method; this leads to an easier deconvolution of the signals with MS and better characterization of the sample. It is important to note that sensitivity remains comparable between the two chromatograms; in addition, no additional peak broadening was noticed with the multi-isocratic method, despite the addition of several isocratic steps. This observation is clearly due to the on–off retention mechanism observed for proteins and the strong compressibility factor under gradient conditions. It is, however, important to notice that the analysis time became longer when adding numerous isocratic steps during the run. Therefore, to have a fair comparison and obtain comparable retention times between the multi-isocratic and linear gradient approach, we also performed a 30 min long linear gradient using the mAb-cytokine fusion protein sample stressed for 2 weeks at 40 °C. As shown in
Figure S1, selectivity was not improved when extending the analysis time for the optimized linear gradient; moreover, the overall separation was evidently not better than the one corresponding to the multi-isocratic elution mode. In conclusion, the addition of several isocratic steps during the run provides a clear added value in terms of chromatographic selectivity.
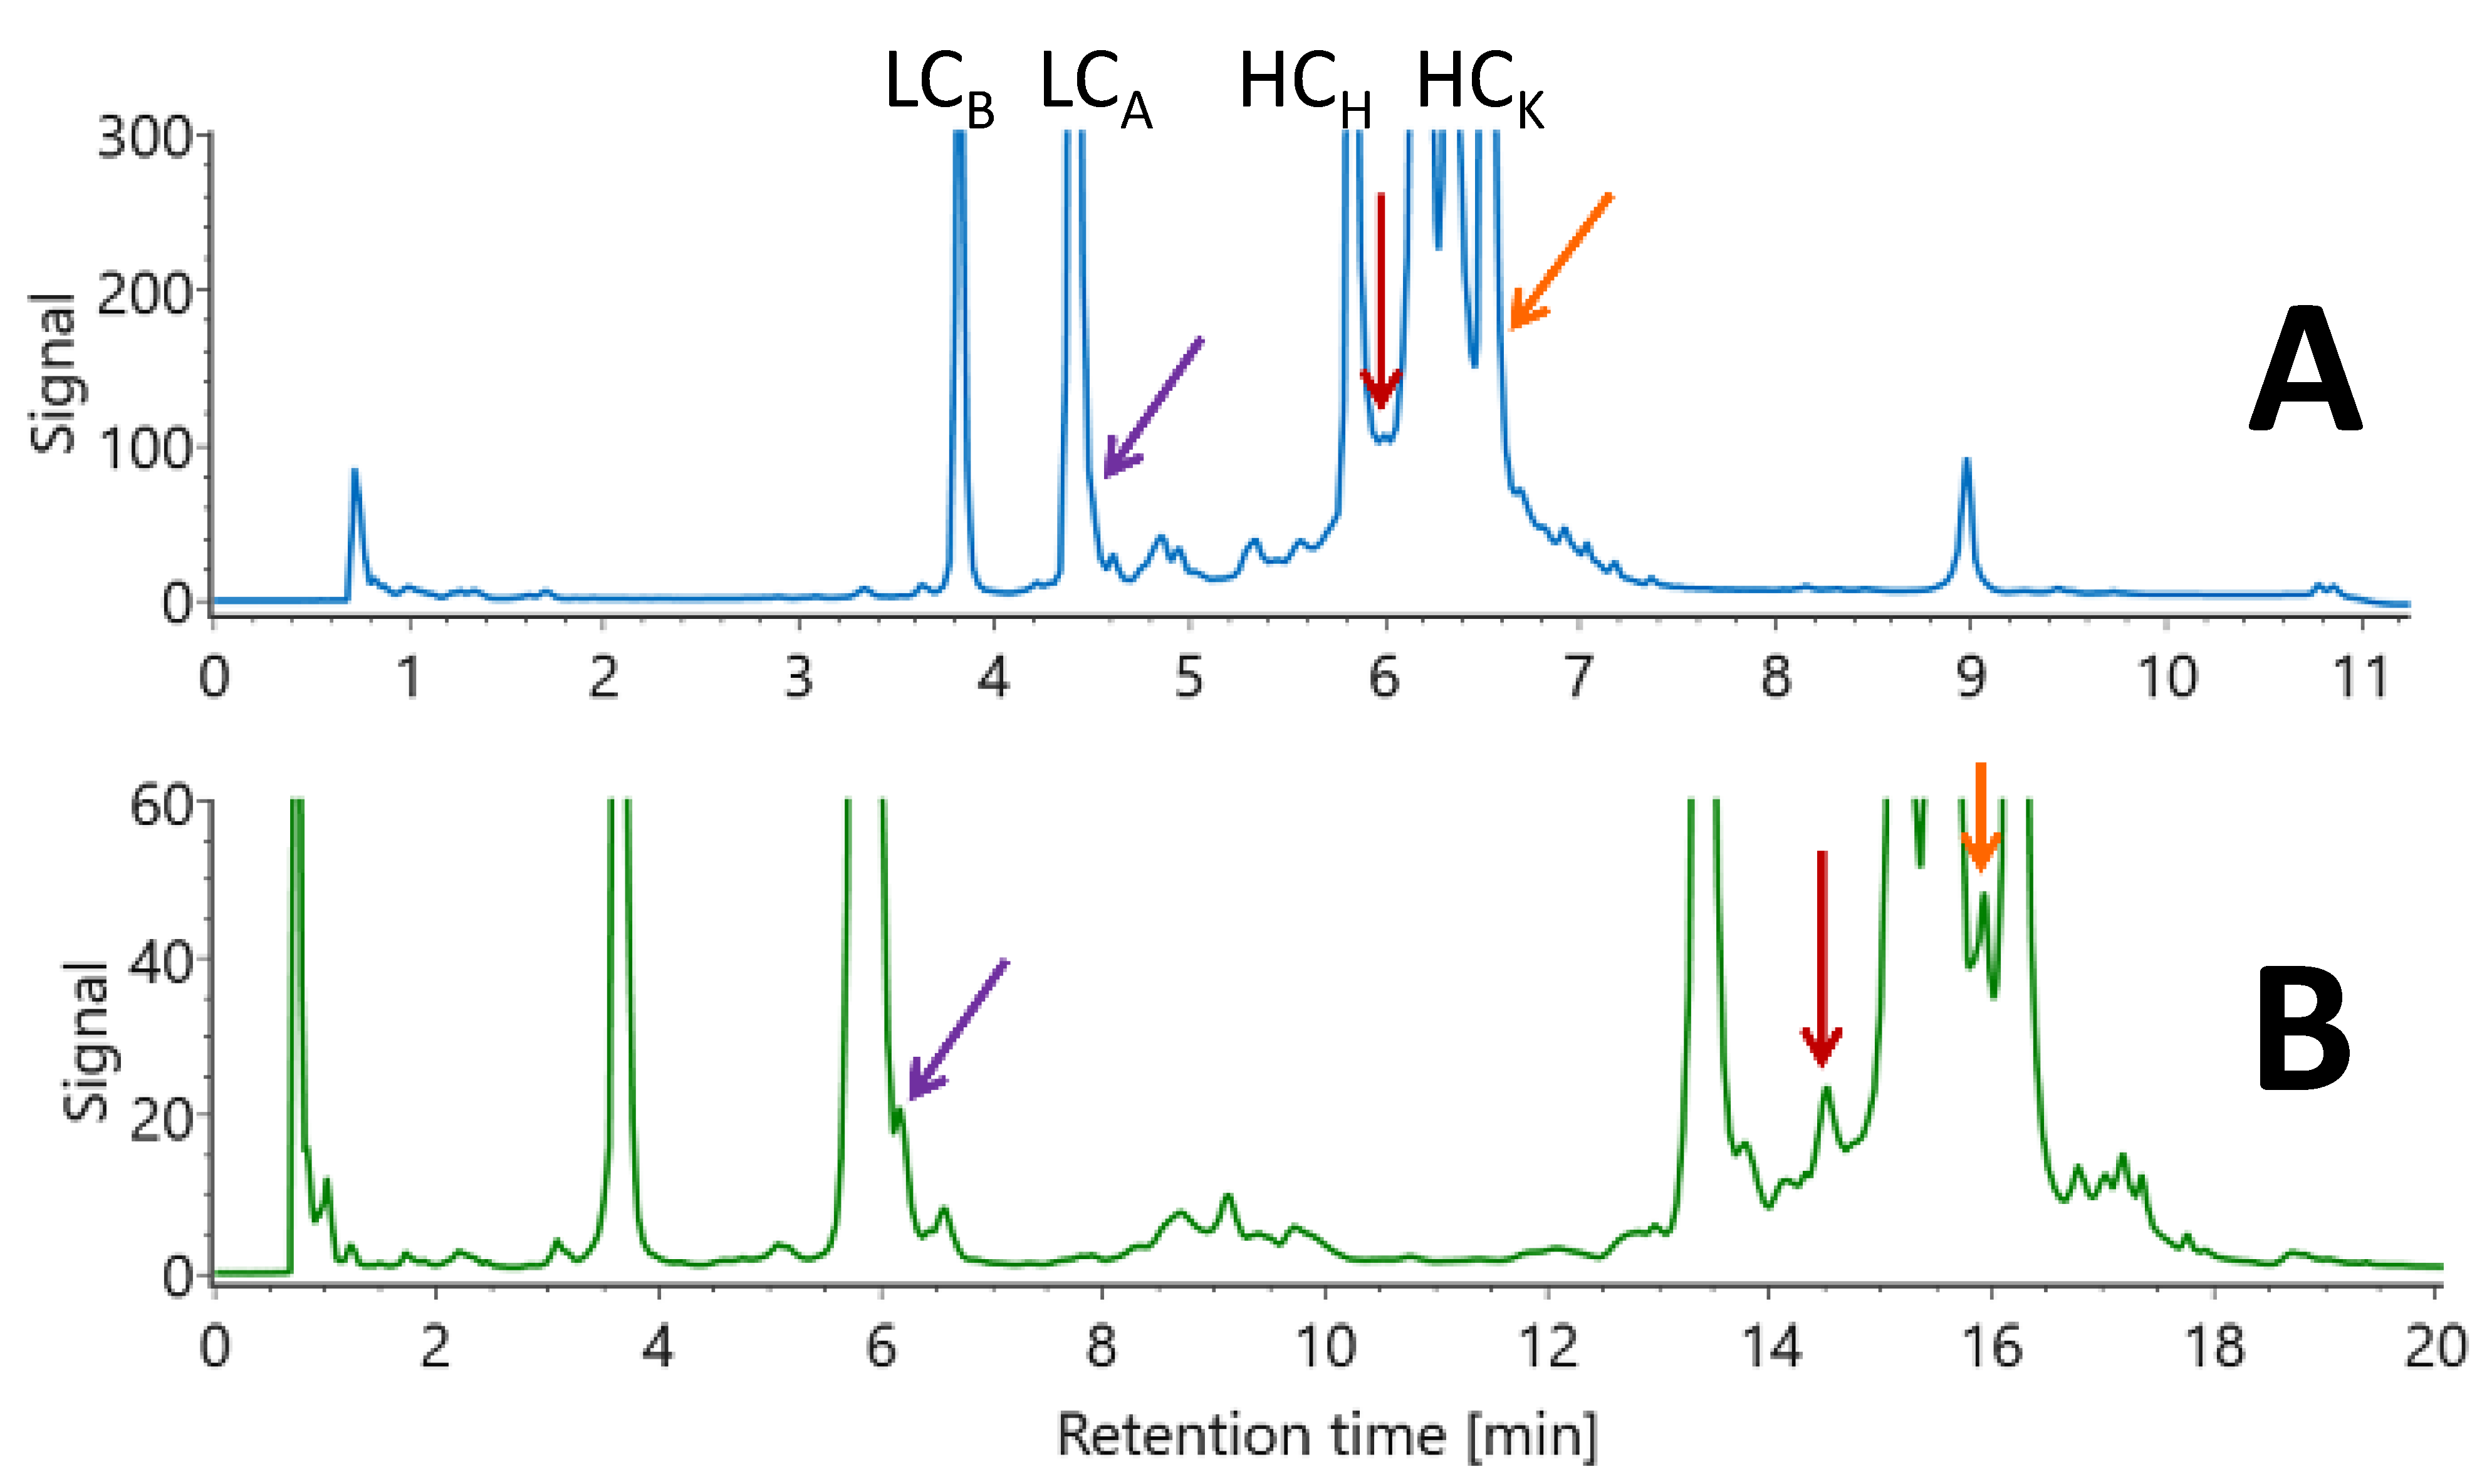
3.3. Application to mAb-Domain-Fusion (C-Terminal) Protein Sample
The same strategy was also applied to another complex biopharmaceutical product; namely a bispecific antibody [
2,
18] consisting in a mAb-domain fusion at the C terminal, having a size of about 200 kDa (the corresponding gradient conditions are summarized in
Tables S4–S6). For this molecule, the chemical reduction with DTT generated four different sub-units, corresponding to two identical light chains (LC
A) of about 24 kDa; another light chain (LC
B) of 22 kDa; one heavy chain (HC
H), corresponding to a size of 50 kDa; and one heavy chain linked with domain fusion (HC
K), having a size of 76 kDa.
With this bispecific antibody, the elution order of the different sub-units is expected to be LC
B, followed by LC
A, HC
H and HC
K. However, a significant hydrophobicity difference was noticed between the two light chains and the two heavy chains; therefore, two groups of peaks were observed under RPLC conditions (see
Figure 3A). Only one major species was observed for each of the LC
B, LC
A and HC
H chains; however, several major variants were observed for the HC
K chain, generating at least three main species eluted towards the end of the gradient. It is important to note that the analyzed sample was stressed for 12 weeks at 40 °C, attributing to the heterogeneity of the species observed.
The chromatogram reported in
Figure 3A corresponds to the one obtained at the step 4 of the workflow described in
Section 3.1; using premixed mobile phases (mobile phases A and B were composed of 26 and 42% ACN, respectively), as well as optimized initial and final mobile phase conditions (linear gradient from 33 to 100% B in 10 min; full gradient conditions are provided in
Table S5). Several minor species were observed near the six major peaks and all the major peaks were not fully resolved.
Since the peaks can be grouped into two distinct zones in the chromatogram shown in
Figure 3A, a multi-isocratic method was developed; this expanded the elution over 3.55 to 5.20 min and 5.20 to 7.40 min. The chromatogram shown in
Figure 3B corresponds to the optimized multi-isocratic method obtained by using six isocratic steps over the two zones of elution, using the procedure explained in
Section 3.1 and already applied to the mAb-cytokine fusion sample. The final gradient conditions were provided in
Table S6 of the Supplementary Material.
As previously observed, the separation of the hydrophobicity variants was improved using the multi-isocratic vs. linear gradient; as highlighted with the different arrows reported on
Figure 3. However, it is important to note that the gradient becomes quite complex when adding several isocratic steps in different zones of elution (see
Tables S3 and S6 of the Supplementary Material). Even if the mobile phases were premixed to improve pump delivery precision, method robustness may be compromised due to the highly precise mobile phase compositions that are required for the gradient. Experimentally, we observed that retention times remain stable (RSD values were lower than 1% for all the peaks when performing three replicate analysis) in multi-isocratic experiments during one single day of experiments, when using the same mobile phase. Such RSD values are in line with what is commonly obtained under UHPLC conditions and correspond exclusively to the variability of the pumping system. However, when performing experiments over several days (with the instrument being switched off at the end of each day and a new mobile phase prepared daily), the variability of the pumping system is superimposed with the precision of the mobile phase preparation. Therefore, the chromatographic profile can vary, both in terms of selectivity and retention times. When performing the same experiment over three consecutive days, inter-day variability on retention times for the different peaks observed on the chromatogram of the reduced mAb-domain-fusion (C-terminal) protein sample was comprised between 2 and 4%. Here, the non-negligible variation of retention times was mostly attributed to the preparation of the mobile phase. Indeed, premixed mobile phases are quite difficult to prepare precisely. In our opinion, the premixed mobile phases should ideally be prepared by gravimetric rather than volumetric method to further decrease RSD values on retention times.
This means that such a complex multi-isocratic method is not recommended for routine use such as quality control environments; however, when applied in R&D laboratories, it offers significant benefits in order to gain as much information as possible on unknown samples.


 ,
, 