Article

Development of a Novel HPLC-MS Method to Separate Polar and Non-Polar Compounds in Biodiesel/Petrodiesel Mixtures

Max-Planck-Institut für Kohlenforschung, Kaiser-Wilhelm-Platz 1, D-45470 Mülheim an der Ruhr, Germany
*
Author to whom correspondence should be addressed.
Separations 2022, 9(8), 214; https://doi.org/10.3390/separations9080214
Submission received: 4 July 2022 / Revised: 25 July 2022 / Accepted: 9 August 2022 / Published: 11 August 2022
(This article belongs to the Section Analysis of Energies)

Abstract

:
Due to a trend to higher sustainability, biodiesel is often mixed into petrodiesel. The analysis of these blends on a molecular level is not trivial, since huge differences in concentrations and polarity of the analytes require a large dynamic range of the analytical method, as well as the ability to investigate molecules of widely different polarities. A combination of high-performance liquid chromatography (HPLC) with high resolution mass spectrometry (HRMS) was identified as a promising method and a normal-phase (NP)-HPLC using amino-functionalized silica gel-based stationary phase delivered the best results with very fast (under 4 min) measurements, with distinct separation of the compounds and clean mass spectra of singular compounds. This method can also be easily modified to elute all FAMEs (fatty acid methyl esters) in one singular peak, thus making the separation even faster (under 3 min).

1. Introduction

Though fossil fuels still have the highest share of all energy sources used worldwide they are accompanied by a number of problems [1]. First of all they are a finite resource, thus determined to deplete in the future causing huge social turmoil [2,3]. Secondly, burning these fuels produces great amounts carbon dioxide, which increases global warming, causing severe ramifications for the environment and humanity [4,5,6]. This results in a sociological and economical shift to renewable energies, causing fossil fuels to be less profitable and increases the need for renewable energy sources [7,8]. The transport sector is one of the biggest emitters of CO2 and reliant on liquid energy sources, but most renewable energy sources produce electricity [1,9]. Since the majority of the newly registered cars in Germany are still fuel powered, the renewable energy content in transportation is very low [10,11]. To lessen the carbon footprint of the transport sector one can replace petro based fuel with fuel made from renewable sources, e.g., biodiesel. Biodiesel is in its physical properties very similar to petrodiesel fuel and is therefore mixed into commercial diesel fuel in many countries, sometimes by law as in Germany [12]. Due to its similar physical properties, biodiesel can be implemented into the current energy mix for the transport sector, still using the existing infrastructure for storage and transportation. Compared to petrodiesel, biodiesel produces less carbon dioxide, less particulate matter (PM) and shows better lubricious traits [13,14,15]. The downside of biodiesel usage is a small increase in NOx emissions upon combustion [15,16,17,18,19]. In contrast to petrodiesel, biodiesel is made from animal or plant lipids, processed via alkali-hydroxide-catalyzed transesterification to fatty acid methyl esters (FAMEs) [20]. The source materials highly influence the FAME distribution in biodiesel and with it the characteristics and aging properties of the fuel [19]. Feedstocks for biodiesel production vary greatly and are often dependent on local climate and infrastructure. This makes rapeseed oil and used cooking oils the two main origin materials for biodiesel production in Germany [21]. Biodiesel are categorized based on their source material. If they are made from edible sources, and thus compete with food production, like rapeseed methyl ester (RME), they are categorized as a first generation biodiesel. [22] Since UCOME (used cooking oils methyl ester—UCOME) is recycled from old cooking fats, normally a waste product, and therefore does not interfere with food production it is mostly considered a second generation biofuel. [23] The main constituents of biodiesel are five methylesters of fatty acids, namely C16:0 and C18:0-3 (Figure 1). They are categorized by the length of the fatty acid chain (C16:0) and the number of unsaturated carbon bonds (C16:0). The distribution of these five FAMEs is defined by the source material used [24]. On the other hand, petrol based diesel consists of a great variety of different compounds, possibly in the range of tens of thousands of different molecules, with a limited number identified so far. This means, that a single compound in diesel is only present in minor concentrations [25,26,27,28]. Although biodiesel is only blended into diesel up to 7% according to DIN EN 590, this means that the five esters possess much higher concentrations in the resulting blend than the petro diesel compounds. This discrepancy in concentration between the different compounds, bears an analytical problem and leads to the necessity of an analytical method with high dynamic range, which limits the choice for analysis greatly. Furthermore the five biodiesel compounds are very polar [29], whereas petrodiesel mainly consists of non or low polar hydrocarbons (Figure 1). This bears another analytical problem, since there is almost no single analytical method which covers such a wide discrepancy in dynamic range and polarity. To facilitate this problem, we studied the capabilities of different chromatographic separation methods that are coupled to high resolution mass spectrometry (HRMS) [30,31,32,33,34,35] and tested them on separating and analyzing bio-/petrodiesel blends. HRMS has shown itself to be invaluable in analyzing complex energy related mixtures [36,37,38], and we chose high performance liquid chromatography (HPLC) as the best suitable separation method. Among the HPLC approaches we tested were reverse phase HPLC (RP-HPLC) with an octadecylsilane stationary phase and Ag-HPLC, where the stationary phase has been functionalized with silver ions. Ag-HPLC has been used in FAME separation before [39,40] and showed great potential in separating FAMEs and even different FAME stereoisomers, but exhibited long separation times and delivered unreliable results in our testing. RP-HPLC has been used in biodiesel production quality control [41,42] and was tested here as well, but the interaction of unsaturated esters with the stationary phase was too strong and prevented suitable separations.
In the end, a normal-phase chromatography (NP-HPLC) method based on adulteration analysis experiments [43] was developed and tested for its ability to enhance information gathered from mass spectrometric measurements of blends compared to direct injection, and is presented here. The ultimate goal was to provide a fast method that is able to cleanly and efficiently separate the bio- from the petro-diesel components in fuel blends to circumvent suppression effects in mass spectrometric analysis, ideally with a FAME separation as well to allow for individual FAME detection, and which can also be adapted to other fields, where simultaneous detection of polar and non-polar compounds is necessary.

2. Materials and Methods

Sample preparation. Two different samples, a pure rapeseed methyl ester (RME) and a blend of 10% RME in petrodiesel were used here. The biodiesel FAME content is presented in Table 1. Small amounts of fuel samples were gathered and diluted in either methanol to 100 ppm (direct injection) or in n-heptane to 1000 ppm (HPLC).
Mass spectrometry. As a detector for the experiments an Orbitrap Elite mass spectrometer (Thermo Scientific, Bremen, Germany) with a resolution setting of R = 480,000 (FWHM (full width at half maximum) at m/z 400), scanning from m/z 200–1000.
Direct injection. To test the application of different ionization methods, direct injection mass spectrometry experiments were carried out on an Orbitrap Elite (Thermo Scientific, Bremen, Germany) with the settings mentioned above. For APPI(+) (atmospheric pressure photo ionization) and APCI(+) (atmospheric pressure chemical ionization) the flow rate was 10 µL/min. APCI(+) was set to a discharge current of 4.0 µA and APPI(+) used a Krypton-VUV lamp (Syagen, Tustin, CA, USA) emitting at 10.0 and 10.6 eV. For ESI(+) measurements the flow rate was reduced to 5 µL/min and the voltage was set to 4 kV. The standard substance methyl oleate (>99%, Sigma-Aldrich Chemie GmbH, Taufkirchen, Germany) was measured with ESI(+). All direct injection samples were either dissolved in methanol (Standard 100 ppm, diesel 100 ppm) or n-heptane (blend 1000 ppm). The solvents used for this were n-heptane (Sigma-Aldrich Chemie GmbH, LiChrosolv HPLC grade) or methanol (J.T.Baker, Ultra HPLC Grade).
HPLC. All HPLC separation were conducted with an UltiMate 3000 HPLC system (Thermo Fischer Scientific, Bremen, Germany) housing a binary pump, column thermostat and UV/PDA (ultraviolet/photo diode array) detector.
Normal phase chromatography (NP-HPLC). The column used for NP-HPLC separations was a Hypersil GOLD Amino-LC with a particle size of 1.9 µm and a size of 2.1 × 100 mm (Thermo Fischer Scientific, Bremen, Germany). The mobile phase system consisted of A. n-heptane (Sigma-Aldrich Chemie GmbH, LiChrosolv HPLC grade) as base solvent and MTBE (tert-butyl methyl ether) (Sigma-Aldrich Chemie GmbH, CHROMASOLV Plus HPLC) as solvent B. The flow rate was set to a flow of 0.4 mL/min. Gradient systems are presented in Table 2. Ionization source for these measurements was APPI(+) with a Krypton-VUV lamp (Syagen, Tustin, CA, USA) emitting at 10.0 and 10.6 eV. The detector was an Orbitrap Elite mass spectrometer with the specifications mentioned above.
Data. All data analysis was carried out with Xcalibur 2.2 software (Thermo Fischer Scientific, Bremen, Germany).

3. Results

The analytical challenge of analyzing a blend of biodiesel/petrodiesel has, as mentioned above, one problem in regards to the dynamic range and another one due to different polarities. Considering the dynamic range, the standard mixture rate of biodiesel in a blend is not more than 10%. This 10% is divided among 5 different chemical compounds resulting in an average concentration of about 2% for each FAME (fatty acid methyl ester). The remaining 90% is divided among hydrocarbons and related chemicals from the fossil fuel, which can easily reach more than 10,000 different compounds. This is only an estimation but it would result in an average concentration of 0.009% per compound. In this estimation, diverging concentration patterns and response factors that might influence the intensity distribution were left aside. It reveals, however, that an average difference in concentration of at least four orders of magnitude, has to be dealt with.
In addition to this, the different compound types exhibit different polarities, a factor which greatly influences ionization in mass spectrometry. Based on polarity, each of the three major atmospheric pressure ionization (API) methods will have some type of discrimination or suppression against certain compounds [44,45,46]. Therefore, a careful evaluation of the most suitable ionization technique for this project is necessary. To this end a biodiesel/petrodiesel blend sample has been used in direct injection experiments with an Orbitrap Elite mass spectrometer, comparing electrospray ionization (ESI(+)) with atmospheric pressure photo ionization (APPI(+)) and atmospheric pressure chemical ionization (APCI(+)) as ionization methods. The main results are summarized in Figure 2. This is a good example for the problems caused by the large differences in polarity and concentration as mentioned above. For polar substances such as the esters in biodiesel, an electrospray ionization would be preferred, and indeed the usage of ESI(+) gives high intensities of all polar compounds in the spectrum, as seen in Figure 2A, but no non-polar substances were recorded. Alternative ionization methods such as APPI(+) and APCI(+) reveal a different picture. These ionizations methods are usually the method of choice for the analysis of non-polar compounds, since these methods are not as dependent on acidity as ESI(+).
The same blend was measured with APPI(+) and APCI(+) as shown in Figure 2B,C and the results from both methods show a great variety of hydrocarbon signals, the main constituent of petrodiesel, but data sets are still dominated by the ester signals, intensity wise, and here especially C18:1 is showing the highest intensity. These results show that, in this application, the small non-polar compounds are still suppressed to a certain degree. All measured signals represent one mass-to-charge ratio and since high resolution is used a corresponding elemental composition can be assigned with high confidence. The assigned formulas were sorted into groups, regarding their functional groups (class) and are displayed in Figure 3. Population in this case is the number of assigned elemental compositions and relative intensity represents the sum of intensity for all signals in the corresponding class. This reveals two major differences between ESI and APPI/APCI. First, ESI(+) detects oxygen compounds as sodium adducts, as opposed to protonated molecules in APPI/APCI, and ESI(+) can detect small intensities of compounds with higher oxygen contents. The population of these compounds is constant and the elemental compositions show that these are FAMEs with additional oxygen. The second major difference is that ESI(+) cannot detect pure hydrocarbons. These are only visible in APPI or APCI measurements. Furthermore, the original stated problem, of high numbers of compounds with low intensities, is confirmed here. Although APPI/APCI show low relative intensities for hydrocarbons compared to oxygenated compounds, the population (the number of assigned compounds) is considerably higher for hydrocarbons than for oxygen compounds. APPI and APCI produce very similar results and are both effective methods for the analysis of biodiesel/petrodiesel blends, but since APPI is detecting slightly more compounds in every class except for O2 [H] it is considered the ionization method of choice for further HPLC experiments.
Chromatographic separation. The direct injection experiments illustrated the challenges of measuring complex mixtures with huge differences in polarities and concentrations. One way to better investigate such blends is if the compound classes that show different characteristics are not detected together. To achieve this, a chromatographic separation based on polarity, sorting the constituents of the sample in different polarity windows, is an effective tool. HPLC offers high versatility with different stationary materials and corresponding mobile phases to adjust to the exact need for specific samples [47,48]. Here, different chromatographic methods that allow a baseline separation of the polar biodiesel compounds in combination with separating them from the fossil diesel as well, have been tested beforehand. The best application for this problem seems to be a normal phase separation with an amino-coated silica column.
De Matos et al. successfully used normal-phase-HPLC (NP-HPLC) for the separation of adulterants in biodiesel blends which makes it an interesting candidate for this application [43]. Here, we implemented an aminopropyl-functionalized column, with n-heptane as the mobile phase and a MTBE gradient for the separation of the five different FAME compounds. Using the NP-HPLC (Figure 4) results in a very fast separation, where the separation is finished after only 4 min. All three unsaturated esters elute in base line separated sharp peaks and even C16:0 and C18:0 begin to elute separately; the first half of the split peak at around 2.3 min is dominated by C18:0 and the latter by C16:0.
Separation of biodiesel/petrodiesel blends. The separation of different FAMEs based on their polarity is promising, but the major incentive of chromatography is to separate the polar from the non-polar compounds in blends. This allows for separate mass spectrometric detection to avoid ionization competition and suppression of some ions. In Figure 5 the Amino-NP-HPLC separation of a 10% blend of RME in diesel is depicted, which has been investigated via direct injection earlier. The chromatogram shows that this method can easily separate the petrodiesel from biodiesel and furthermore is still able to separate the five esters present in biodiesel, also. The diesel components with low polarity elute first and are still baseline separated from the first biodiesel components. However, due to the diesel compounds’ low polarity, which is relatively even among the large number of compounds, the interaction with the stationary phase is too weak to truly separate singular diesel components. Since this method is finished after only 4 min, this separation technique is incredibly fast and allows for the further investigation via mass spectrometry.
Mass spectrometry. The separation is evaluated in detail (Figure 6) by comparing the mass spectra of the C18:1 (methyl oleate) peaks seen in Figure 4 and Figure 5 as well as a C18:1 standard. Interestingly enough, in all spectra apart from the main C18:1 (C19H36O2) peak in every spectrum there are two more peaks visible, C18H32O and C18H30. After such a chromatographic separation these substances would not elute together, and they are also visible in the standard compound. The most likely explanation is that fragmentation can cause the loss of methanol (C18H32O) and an additional water loss (C18H30). But since all the spectra look alike, the conclusion is, that this method works for the separation of the biodiesel components and the esters are cleanly separated and can be measured with MS in good intensities after separation.
The petrodiesel spectra generated from the chromatographic peak in the blend separation (Figure 5) are compared to the direct injection of the petrodiesel in the MS (Figure 7). In general, the direct injection measurements of petrodiesel (Figure 7A) show a variety of signals in the mass range between m/z 200 to 350, mainly representing homologous series of different hydrocarbons, as expected, since these are the main components of petrodiesel. After separation from a blend (Figure 7B), all these signals are again visible and the signals above m/z 350 are in even better intensities compared to the direct injection. This is a huge success, showing that the separation does indeed improve the mass spectrometric investigation of blends compared to a direct injection measurement (Figure 2) and reveals a reasonable representation of the sample.
After validation, mass spectra for the peak from 0.8–2.0 min (Peak A) and the group of ester peaks from 2.2–3.6 min (Peak B) were generated and elemental compositions were assigned based on the exact masses of detected compounds. A class distribution of these can be seen in Figure 8. Peak A now exhibits highest intensity in the hydrocarbon class, with only minor intensities in oxygenated compounds. The population is distributed more evenly over different groups although still dominated by protonated hydrocarbons. But most importantly the number of assigned compounds is significantly higher than in the direct injection of the blend (Figure 3); it was almost doubled from 40 compounds compared to 92 in the protonated hydrocarbon group alone. Furthermore, many more oxygen containing diesel components could be detected with one or two oxygen atoms, as seen in the high population of these two groups in Peak A. These have not been detected at all in the direct injection. Peak B, representing all FAMEs, shows very similar results compared to the APPI measurements from direct injection. The peak is still dominated by O2 compounds, intensity wise. The population pattern shows small changes because, amongst others, the saturated esters C16:0 and C18:0 are now detected also, though they have not been detected in direct injection. Detection of oxidized FAME compounds is still inferior to ESI(+), but overall the chromatographic separation greatly increases mass spectrometric coverage of molecules in the biodiesel/diesel blend.
Bulk separation. By further modification of the aforementioned method, namely increasing the MTBE gradient, the separation can be adjusted to a bulk separation, where all FAMEs elute together (Figure 9). Separation of diesel and biodiesel compounds is completed after 3 min and thus this method is useful for faster separations, where no individual investigation of the FAMEs is necessary. The resulting mass spectra for both diesel compounds and FAMEs are comparable to what was measured for individual FAME separation.
The class distribution graphs (Figure 10) also show very similar results to Figure 8, but with protonated plain hydrocarbons dominating the diesel peak both intensity wise and in population. Even more protonated hydrocarbon compounds were measured in the bulk measurement but information was lost on oxygen containing diesel components. The FAME peak contains nearly the same information as before in regard to mass spectrometry data and class distribution, although there are lower numbers of oxygenated FAME compounds detected. All in all, separation Method 2 is fast and delivers very similar information compared to Method 1, but loses the chromatographic information about the esters.

4. Conclusions

Due to the inherent problems of investigating biodiesel/petrodiesel blends, namely because of the necessary large dynamic range, and even more importantly, significant differences in polarity and concentration, the implementation of HPLC separation into HRMS methods was tested to address these problems. Test measurements with different ionization methods showed the severe impact of these parameters on detected compounds and the suppression effect of oxygenated compounds. Amino-NP-HPLC-HRMS has been shown to be an adequate tool and provided the clean separation of petrodiesel and biodiesel compounds, with additional separation of FAMEs in under 4 min, with sharp peaks. Contamination free mass spectra could be generated from all major eluted peaks. The corresponding class distribution data showed a sharp increase in detected compounds compared to direct injection. The number of pure hydrocarbon compounds detected has more than doubled. Furthermore, the separation method can easily be modified. Here, the gradient was altered, so that the separation resulted in only two peaks, one containing all petrodiesel and the other all biodiesel compounds. This separation is finished after only 3 min. Class distribution for relative intensities and population of the compounds measured within these peaks show very few information loss, so this method is a valid and faster alternative if chromatographic separation of the different esters is not necessary.

Author Contributions

Investigation, data interpretation, writing—original draft preparation, D.H.; writing—review and editing, supervision, project administration, funding acquisition, W.S. All authors have read and agreed to the published version of the manuscript.

Funding

The authors are thankful for generous financial funding from the Bundesministerium für Wirtschaft und Energie through the IGF Project (IGF 19965N by DGMK 791).

Acknowledgments

The authors thank David Stranz (Sierra Analytics, Modesto, CA, USA) for access to new data handling software.

Conflicts of Interest

The authors declare no conflict of interest.

References

  1. BP. Statistical Review of World Energy 2020; BP p.l.c.: London, UK, 2020. [Google Scholar]
  2. Andruleit, H.; Meßner, J.; Pein, M.; Rebscher, D.; Schauer, M.; Schmidt, S.; von Goerne, G. Status, Daten und Entwicklungen der globalen Energieversorgung. Z. Energiewirtsch. 2018, 42, 179–191. [Google Scholar] [CrossRef]
  3. Bardi, U. Peak oil: The four stages of a new idea. Energy 2009, 34, 323–326. [Google Scholar] [CrossRef]
  4. Carr, P.H. Weather extremes from anthropogenic global warming—Special issue—Global warming. Nat. Sci. 2013, 5, 130–134. [Google Scholar] [CrossRef] [Green Version]
  5. Islam, B. Climate change, global warming and its impacts on oceans. Int. J. Chem. Sci. 2013, 11, 1426–1436. [Google Scholar]
  6. Kurane, I. The Effect of Global Warming on Infectious Diseases. Osong Public Health Res. Perspect. 2010, 1, 4–9. [Google Scholar] [CrossRef] [PubMed] [Green Version]
  7. Coady, D.; Parry, I.; Sears, L.; Shang, B. How large are global fossil fuel subsidies? World Dev. 2017, 91, 11–27. [Google Scholar] [CrossRef]
  8. Warner, K.J.; Jones, G.A. The climate-independent need for renewable energy in the 21st century. Energies 2017, 10, 1197. [Google Scholar] [CrossRef] [Green Version]
  9. Eurostat. Energy, Transport and Environment Statistics 2020 Edition; Publications Office of the European Union: Luxembourg, 2020. [Google Scholar] [CrossRef]
  10. Kraftfahrt-Bundesamt. Fahrzeugzulassungen (FZ) Bestand an Kraftfahrzeugen nach Umwelt-Merkmalen; FZ 13; Kraftfahrt-Bundesamt: Flensburg, Germany, 2021. [Google Scholar]
  11. Bundesministerium für Wirtschaft und Energie. Energiedaten: Gesamtausgabe; Bundesministerium für Wirtschaft und Energie: Berlin, Germany, 2019. [Google Scholar]
  12. Bundesministerium für Justiz. Gesetz zum Schutz vor Schädlichen Umwelteinwirkungen durch Luftverunreinigungen, Geräusche, Erschütterungen und ähnliche Vorgänge (Bundes-Immissionsschutzgesetz-BImSchG); Bundesministerium für Justiz: Berlin, Germany, 2021. [Google Scholar]
  13. Szybist, J.P.; Song, J.; Alam, M.; Boehman, A.L. Biodiesel combustion, emissions and emission control. Fuel Process. Technol. 2007, 88, 679–691. [Google Scholar] [CrossRef]
  14. Knothe, G.; Steidley, K.R. Lubricity of components of biodiesel and petrodiesel. The origin of biodiesel lubricity. Energy Fuels 2005, 19, 1192–1200. [Google Scholar] [CrossRef]
  15. Monyem, A.; Van Gerpen, J.H. The effect of biodiesel oxidation on engine performance and emissions. Biomass Bioenergy 2001, 20, 317–325. [Google Scholar] [CrossRef] [Green Version]
  16. Chen, H.; Xie, B.; Ma, J.; Chen, Y. NOx emission of biodiesel compared to diesel: Higher or lower? Appl. Therm. Eng. 2018, 137, 584–593. [Google Scholar] [CrossRef]
  17. Karmakar, R.; Kundu, K.; Rajor, A. Fuel properties and emission characteristics of biodiesel produced from unused algae grown in India. Pet. Sci. 2018, 15, 385–395. [Google Scholar] [CrossRef] [Green Version]
  18. Varatharajan, K.; Cheralathan, M. Influence of fuel properties and composition on NOx emissions from biodiesel powered diesel engines: A review. Renew. Sustain. Energy Rev. 2012, 16, 3702–3710. [Google Scholar] [CrossRef]
  19. Pinzi, S.; Rounce, P.; Herreros, J.M.; Tsolakis, A.; Dorado, M.P. The effect of biodiesel fatty acid composition on combustion and diesel engine exhaust emissions. Fuel 2013, 104, 170–182. [Google Scholar] [CrossRef]
  20. Knothe, G.; Krahl, J.; Van Gerpen, J. The Biodiesel Handbook; Elsevier: Amsterdam, The Netherlands, 2015. [Google Scholar]
  21. Bundesanstalt für Landwirtschaft und Ernährung. Evaluations- und Erfahrungsbericht für das Jahr 2018; Bundesanstalt für Landwirtschaft und Ernährung: Bonn, Germany, 2019. [Google Scholar]
  22. Lee, R.A.; Lavoie, J.-M. From first-to third-generation biofuels: Challenges of producing a commodity from a biomass of increasing complexity. Anim. Front. 2013, 3, 6–11. [Google Scholar] [CrossRef]
  23. Foteinis, S.; Chatzisymeon, E.; Litinas, A.; Tsoutsos, T. Used-cooking-oil biodiesel: Life cycle assessment and comparison with first- and third-generation biofuel. Renew. Energy 2020, 153, 588–600. [Google Scholar] [CrossRef]
  24. Orsavova, J.; Misurcova, L.; Ambrozova, J.V.; Vicha, R.; Mlcek, J. Fatty acids composition of vegetable oils and its contribution to dietary energy intake and dependence of cardiovascular mortality on dietary intake of fatty acids. Int. J. Mol. Sci. 2015, 16, 12871–12890. [Google Scholar] [CrossRef] [PubMed]
  25. Ghosh, P.; Jaffe, S.B. Detailed composition-based model for predicting the cetane number of diesel fuels. J. Ind. Eng. Chem. 2006, 45, 346–351. [Google Scholar] [CrossRef]
  26. Wang, F.C.Y.; Robbins, W.K.; Greaney, M.A. Speciation of nitrogen-containing compounds in diesel fuel by comprehensive two-dimensional gas chromatography. J. Sep. Sci. 2004, 27, 468–472. [Google Scholar] [CrossRef] [PubMed]
  27. Liang, F.; Lu, M.; Keener, T.C.; Liu, Z.; Khang, S.-J. The organic composition of diesel particulate matter, diesel fuel and engine oil of a non-road diesel generator. J. Environ. Monit. 2005, 7, 983–988. [Google Scholar] [CrossRef]
  28. Alexandrino, G.L.; Malmborg, J.; Augusto, F.; Christensen, J.H. Investigating weathering in light diesel oils using comprehensive two-dimensional gas chromatography–High resolution mass spectrometry and pixel-based analysis: Possibilities and limitations. J. Chromatogr. A 2019, 1591, 155–161. [Google Scholar] [CrossRef] [PubMed]
  29. M’Peko, J.-C.; Reis, D.L.; De Souza, J.E.; Caires, A.R. Evaluation of the dielectric properties of biodiesel fuels produced from different vegetable oil feedstocks through electrochemical impedance spectroscopy. Int. J. Hydrogen Energy 2013, 38, 9355–9359. [Google Scholar] [CrossRef]
  30. Rüger, C.P.; Sklorz, M.; Schwemer, T.; Zimmermann, R. Characterisation of ship diesel primary particulate matter at the molecular level by means of ultra-high-resolution mass spectrometry coupled to laser desorption ionisation—Comparison of feed fuel, filter extracts and direct particle measurements. Anal. Bioanal. Chem. 2015, 407, 5923–5937. [Google Scholar] [CrossRef] [PubMed]
  31. Neumann, A.; Kafer, U.; Groger, T.; Wilharm, T.; Zimmermann, R.; Ruger, C.P. Investigation of Aging Processes in Bitumen at the Molecular Level with High-Resolution Fourier-Transform Ion Cyclotron Mass Spectrometry and Two-Dimensional Gas Chromatography Mass Spectrometry. Energy Fuels 2020, 34, 10641–10654. [Google Scholar] [CrossRef]
  32. Jones, H.E.; Palacio Lozano, D.C.; Huener, C.; Thomas, M.J.; Aaserud, D.J.; DeMuth, J.C.; Robin, M.P.; Barrow, M.P. Influence of Biodiesel on Base Oil Oxidation as Measured by FTICR Mass Spectrometry. Energy Fuels 2021, 35, 11896–11908. [Google Scholar] [CrossRef]
  33. Miettinen, I.; Kuittinen, S.; Paasikallio, V.; Mäkinen, M.; Pappinen, A.; Jänis, J. Characterization of fast pyrolysis oil from short-rotation willow by high-resolution Fourier transform ion cyclotron resonance mass spectrometry. Fuel 2017, 207, 189–197. [Google Scholar] [CrossRef]
  34. Hamacher, D.; Schrader, W. Investigating Molecular Transformation Processes of Biodiesel Components During Long-Term Storage Via High-Resolution Mass Spectrometry. ChemSusChem 2022, 15, e202200456. [Google Scholar] [CrossRef] [PubMed]
  35. Santos, J.M.; Vetere, A.; Wisniewski, A.; Eberlin, M.N.; Schrader, W. Comparing Crude Oils with Different API Gravities on a Molecular Level Using Mass Spectrometric Analysis. Part 2: Resins and Asphaltenes. Energies 2018, 11, 2766. [Google Scholar] [CrossRef] [Green Version]
  36. Vetere, A.; Schrader, W. Mass spectrometric coverage of complex mixtures: Exploring the carbon space of crude oil. ChemistrySelect 2017, 2, 849–853. [Google Scholar] [CrossRef]
  37. Vetere, A.; Profrock, D.; Schrader, W. Quantitative and Qualitative Analysis of Three Classes of Sulfur Compounds in Crude Oil. Angew. Chem. Int. Ed. 2017, 56, 10933–10937. [Google Scholar] [CrossRef]
  38. Palacio Lozano, D.C.; Gavard, R.; Arenas-Diaz, J.P.; Thomas, M.J.; Stranz, D.D.; Mejía-Ospino, E.; Guzman, A.; Spencer, S.E.F.; Rossell, D.; Barrow, M.P. Pushing the analytical limits: New insights into complex mixtures using mass spectra segments of constant ultrahigh resolving power. Chem. Sci. 2019, 10, 6966–6978. [Google Scholar] [CrossRef] [PubMed]
  39. Adlof, R. Separation of conjugated linoleic acid methyl esters by silver-ion high performance liquid chromatography in semi-preparative mode. J. Chromatogr. A 2004, 1033, 369–371. [Google Scholar] [CrossRef] [PubMed]
  40. Momchilova, S.M.; Nikolova-Damyanova, B.M. Advances in silver ion chromatography for the analysis of fatty acids and triacylglycerols—2001 to 2011. Anal. Sci. 2012, 28, 837–844. [Google Scholar] [CrossRef] [Green Version]
  41. Türkan, A.; Kalay, Ş. Monitoring lipase-catalyzed methanolysis of sunflower oil by reversed-phase high-performance liquid chromatography: Elucidation of the mechanisms of lipases. J. Chromatogr. A 2006, 1127, 34–44. [Google Scholar] [CrossRef] [PubMed]
  42. Holčapek, M.; Jandera, P.; Fischer, J.; Prokeš, B. Analytical monitoring of the production of biodiesel by high-performance liquid chromatography with various detection methods. J. Chromatogr. A 1999, 858, 13–31. [Google Scholar] [CrossRef]
  43. de Matos, T.S.; dos Santos, R.C.; de Souza, C.G.; de Carvalho, R.C.; de Andrade, D.F.; D’ávila, L.A. Determination of the Biodiesel Content on Biodiesel/Diesel Blends and Their Adulteration with Vegetable Oil by High-Performance Liquid Chromatography. Energy Fuels 2019, 33, 11310–11317. [Google Scholar] [CrossRef]
  44. Schmitt-Kopplin, P.; Englmann, M.; Rossello-Mora, R.; Schiewek, R.; Brockmann, K.J.; Benter, T.; Schmitz, O.J. Combining chip-ESI with APLI (cESILI) as a multimode source for analysis of complex mixtures with ultrahigh-resolution mass spectrometry. Anal. Bioanal. Chem. 2008, 391, 2803–2809. [Google Scholar] [CrossRef] [PubMed] [Green Version]
  45. Cho, Y.J.; Na, J.G.; Nho, N.S.; Kim, S.; Kim, S. Application of Saturates, Aromatics, Resins, and Asphaltenes Crude Oil Fractionation for Detailed Chemical Characterization of Heavy Crude Oils by Fourier Transform Ion Cyclotron Resonance Mass Spectrometry Equipped with Atmospheric Pressure Photoionization. Energy Fuels 2012, 26, 2558–2565. [Google Scholar] [CrossRef]
  46. Gaspar, A.; Zellermann, E.; Lababidi, S.; Reece, J.; Schrader, W. Impact of Different Ionization Methods on the Molecular Assignments of Asphaltenes by FT-ICR Mass Spectrometry. Anal. Chem. 2012, 84, 5257–5267. [Google Scholar] [CrossRef]
  47. Arboleda, P.H.; Dettman, H.D.; Lucy, C.A. Hydrocarbon Group Type Separation of Gas Oil Resins by High Performance Liquid Chromatography on Hyper-Cross-Linked Polystyrene Stationary Phase. Energy Fuels 2015, 29, 6686–6694. [Google Scholar] [CrossRef]
  48. Jiang, P.; Lucy, C.A. Coupling normal phase liquid chromatography with electrospray ionization mass spectrometry: Strategies and applications. Anal. Methods 2016, 8, 6478–6488. [Google Scholar] [CrossRef]
Figure 1. Formulas of C16:0, C18:0, C18:1, C18:2, C18:3, from top to bottom (left side) and a selection of diesel components (right side).
Separations 09 00214 g001
Figure 2. Spectra of blend 1, measured with different ionization techniques; (A): ESI(+) reveals only a very limited numbers of non-polar diesel compounds, (B): APPI(+); here some non-polar diesel compounds can be detected although the polar biodiesel compounds significantly influence the intensity, (C): APCI(+) shows similar results, as petrodiesel compounds are present in low intensity while biodiesel compounds appear with higher intensities.
Separations 09 00214 g002
Figure 3. Comparison of direct injection measurements regarding class distribution for different hydrocarbon classes with rel. intensities (left) and population (right) which represents the number of assigned elemental compositions. Classes are describing hydrocarbons with different (number of) heteroatoms. Square brackets contain the adduct type, no brackets represents radical ions.
Separations 09 00214 g003
Figure 4. Chromatogram of RME, separated via an Amino-Column with Method 1.
Separations 09 00214 g004
Figure 5. Chromatogram of the blend separated and measured with Method 1.
Separations 09 00214 g005
Figure 6. Spectra of C18:1 Peak: A: RME Min: 2.46–2.73, B: Blend Min: 2.62–2.94, C: Methyl oleate standard full scan.
Separations 09 00214 g006
Figure 7. Spectra of diesel compounds: (A) direct injection of diesel 1, (B) diesel compounds in blend 1 from 0.8–1.6 min.
Separations 09 00214 g007
Figure 8. Comparison of major peaks in blend separation regarding class distribution for different hydrocarbon classes with rel. intensities (left) and population (right) which represents the number of identified compounds. Classes are describing hydrocarbons with different (amounts of) heteroatoms. Square brackets contain the adduct type, no brackets represents radical ions.
Separations 09 00214 g008
Figure 9. Chromatogram of blend, separated via the amino functionalized NP-HPLC with Method 2.
Separations 09 00214 g009
Figure 10. Comparison of major peaks in blend bulk separation regarding class distribution for different hydrocarbon classes with rel. intensities (left) and population (right) which represents the number of identified compounds. Classes are describing hydrocarbons with different (amounts of) heteroatoms. Square brackets contain the adduct type, no brackets represents radical ions.
Separations 09 00214 g010
Table 1. Properties of the biodiesel used in this study.
ParameterRME
Water content (mg/kg)264
Ester content (%w/w)
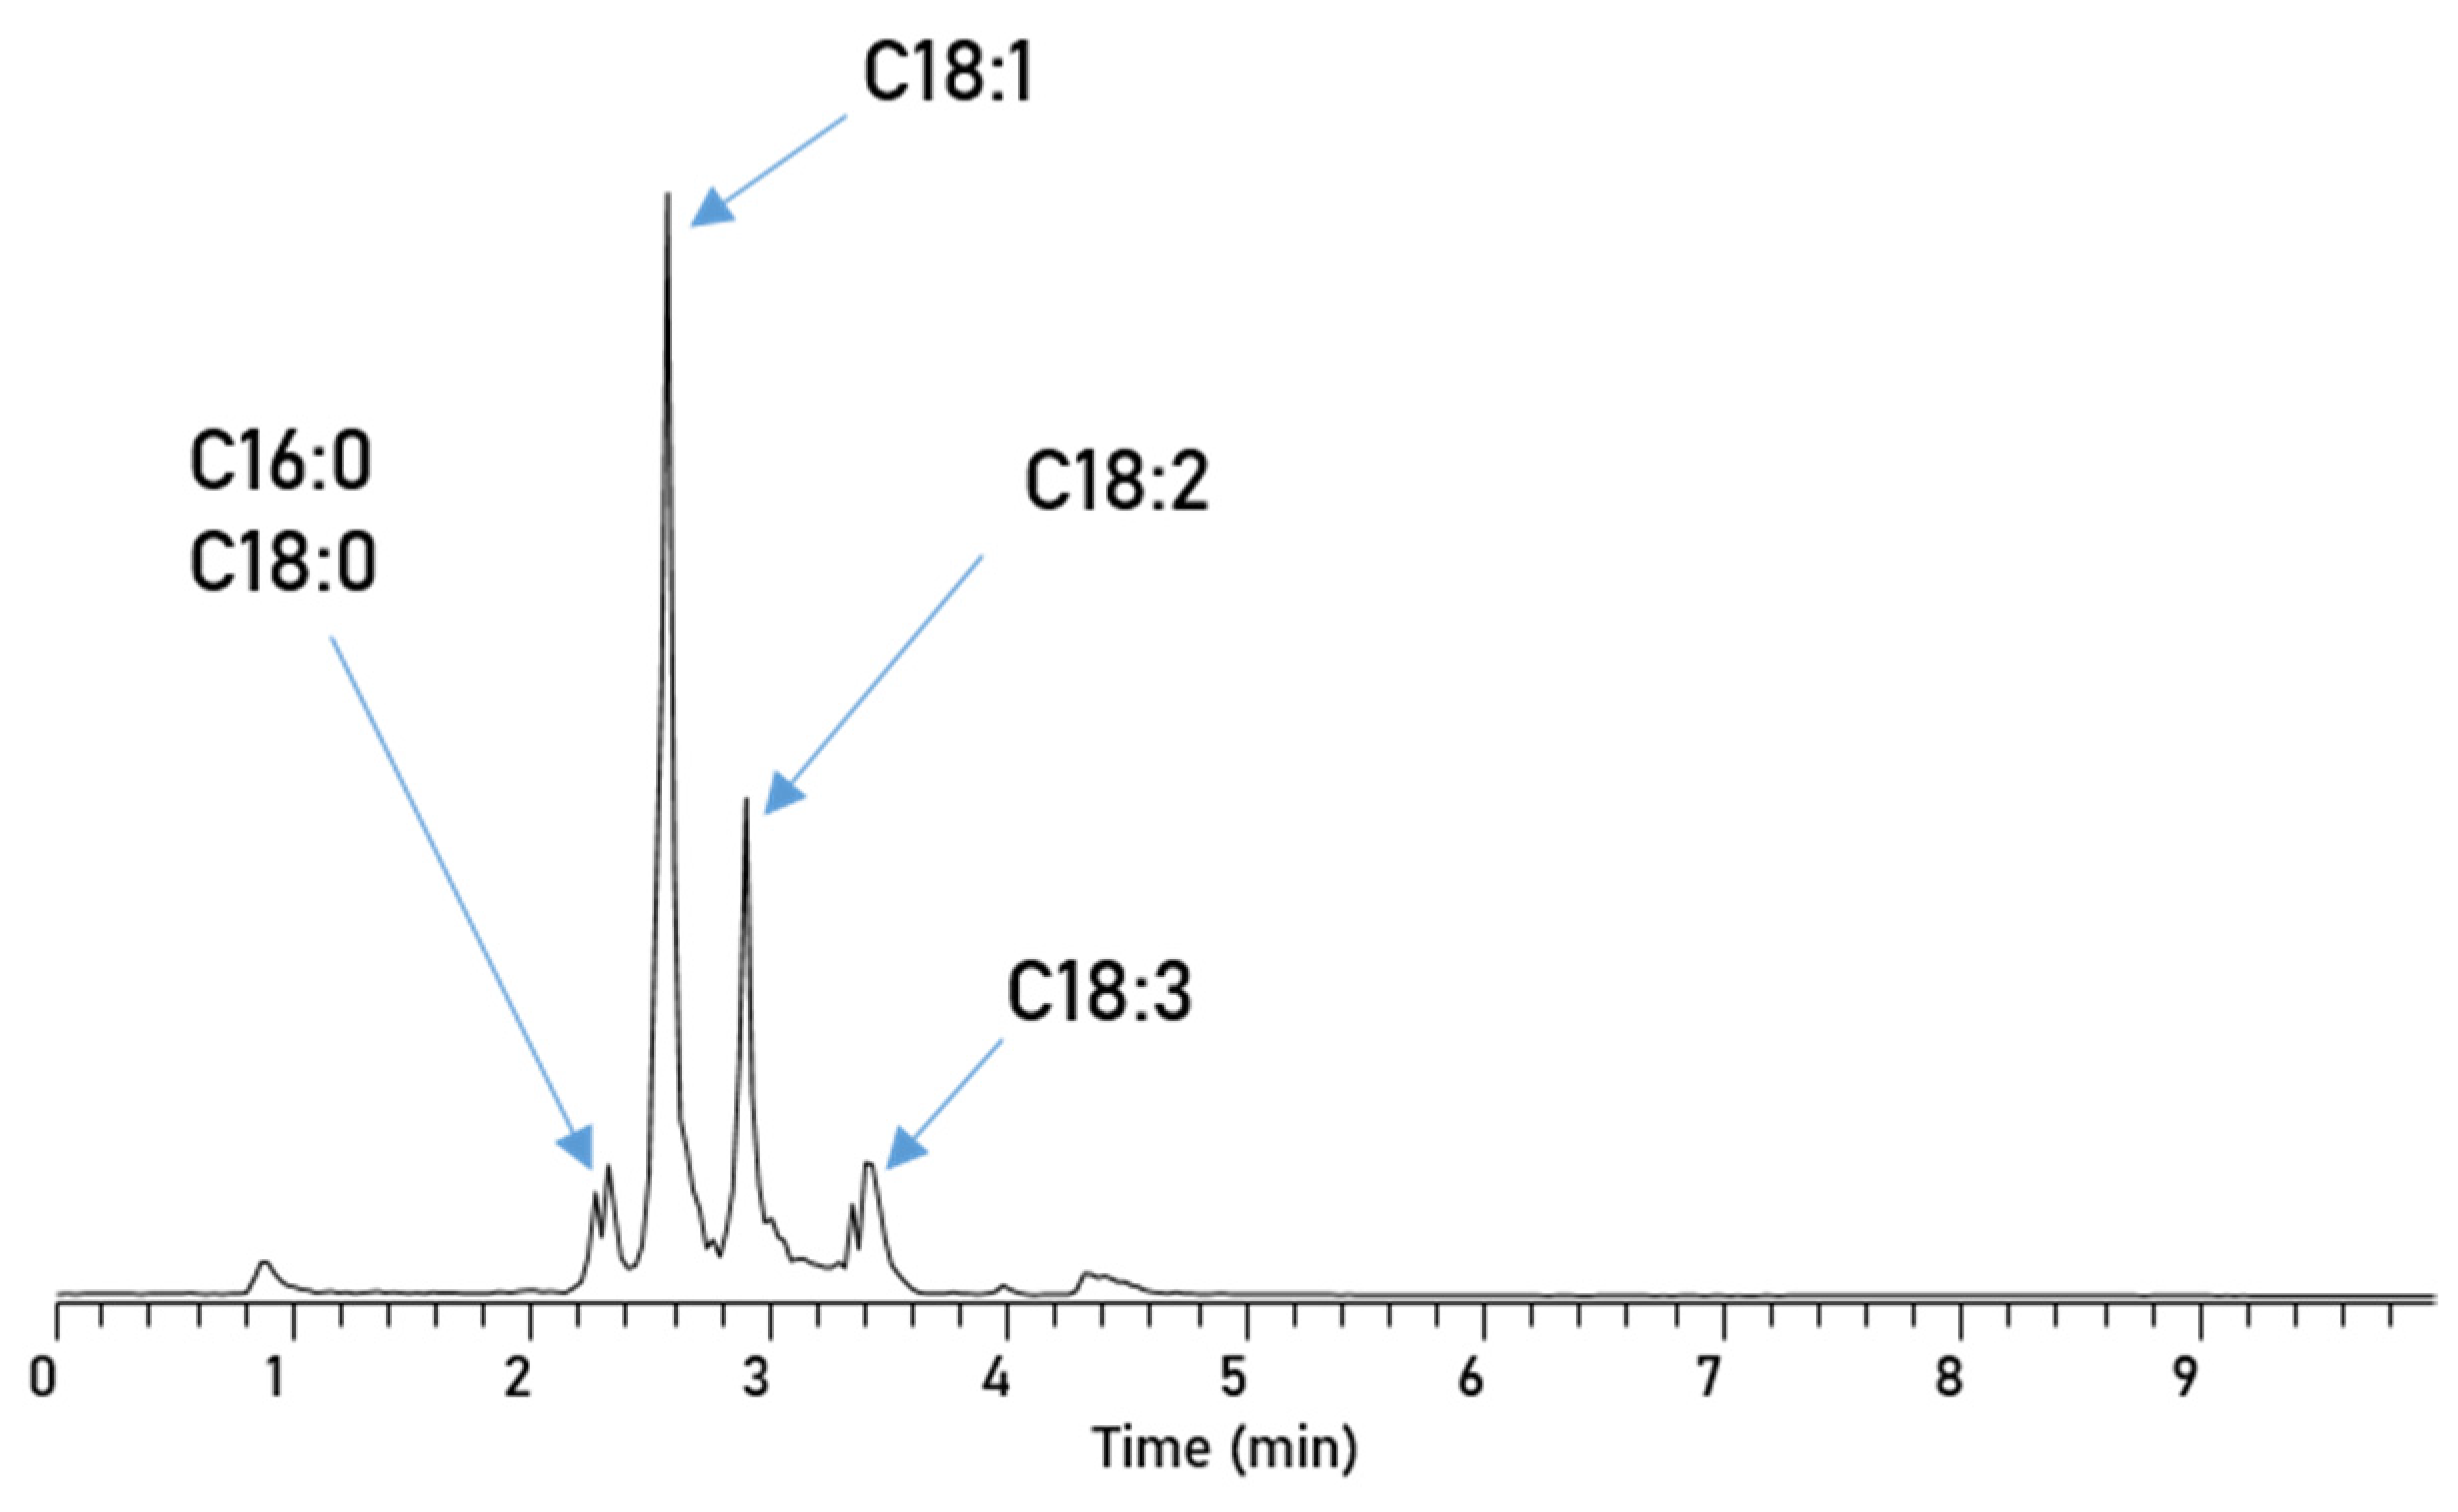
C16:04.1
C18:01.8
C18:156.2
C18:219.7
C18:310.0
Table 2. Solvent gradients for the different HPLC methods.
Method 1 Method 2
Time (min)B (%)Time (min)B (%)
0000
10120
1.5108.520
5309.50
830190
100
290
Publisher’s Note: MDPI stays neutral with regard to jurisdictional claims in published maps and institutional affiliations.

