Article

Synergistic Effect of NiO-Ga2O2-Graphene Heterostructures on Congo Red Photodegradation in Water

1
Al-Bilad Bank Scholarly Chair for Food Security in Saudi Arabia, Deanship of Scientific Research, The Vice Presidency for Graduate Studies and Scientific Research, King Faisal University, Al Ahsa 31982, Saudi Arabia
2
Department of Physics, College of Science, King Faisal University, P.O. Box 400, Al-Ahsa 31982, Saudi Arabia
3
Physics Department, Faculty of Science, Assiut University, Assiut 71516, Egypt
4
Physics Department, Faculty of Science, University of Tabuk, Tabuk 71491, Saudi Arabia
*
Authors to whom correspondence should be addressed.
Separations 2022, 9(8), 201; https://doi.org/10.3390/separations9080201
Submission received: 8 July 2022 / Revised: 23 July 2022 / Accepted: 30 July 2022 / Published: 2 August 2022

Abstract

:
We studied the effect of the mixed phase of nickel oxide–gallium oxide–graphene (NiO-Ga2O2/G) heterostructure nanocomposite on the photocatalytic degradation of Congo red dye. The effect was investigated based on NiO-Ga2O2 junction, NiO-graphene, and Ga2O2-graphene contacts. The laser-induced graphene was embedded into NiO and NiO-Ga2O2. Raman spectra confirmed the fabrication of disordered graphene and the mixed phase between the oxides and graphene. HRTEM showed that very fine nanoparticles for both NiO and Ga2O2 with a size of ~7–10 nm were synthesized. Elemental compositional expressed the formation mixed phase. The effect of graphene content was investigated at 2 and 10% wt with NiO and the heterojunction of NiO-Ga2O2. The photocurrent studies was measured of these nanocomposite film deposited on two interdigitated gold electrodes, biased by 5.0 V and irradiated by the UV source. The results of photocatalysis measurements indicated an improvement occurred upon the heterojunction between Ga2O2 and NiO, however, a dramatic improvement was observed with the addition of graphene of 10%. The results expressed that the ternary phase of p-NiO/n-Ga2O2/graphene is promising in the photocatalytic application toward Congo red decomposition.

1. Introduction

Regarding the safe drinking and cleansing of water, there are still certain unanswered questions that need to be addressed on a priority basis in the relevant study fields. Recently, the development of environmentally friendly, supportable nanomaterials with distinctive advantages such as superior efficiency, selectivity, and achievable stability have emerged as a top priority [1]. At this time, it was found that it is necessary to introduce and develop highly effective and sensitive techniques to remove pollutants from water. Therefore, it has been confirmed that catalytic oxidation is one of the effective techniques for organic pollutants [2]. There are many industries, including the leather, paper, plastics, textiles, food processing, printing, cosmetics, pharmaceuticals, and other industries that deal with organic and inorganic dyes. These pigments, when present in wastewater, can negatively affect the surrounding water environment, including others. These dyes can cause serious health problems for humans and animals, such as mutations and cancer [3]. It is known that the use of sunlight in the photolysis of wastewater is an energy-saving method, especially to get rid of organic dye [4]. It is known that photocatalysis has gained high interest in the use of semiconductor materials due to its many applications in many areas such as hydrogen production, removal of heat-resistant pollutants, as well as the self-cleaning of surfaces. However, the wide bandgap of metal oxides may reduce their ability to absorb visible light. Therefore, researchers are making great efforts to improve these materials with materials such as metallic or non-metallic activators [3,5]. NiO NPs powders have various applications in many industrial fields such as the production of films, magnetic materials, the production of catalysts, the production of batteries, and supercapacitors, and it is also used for the oxidation of a wide range of organic compounds [6,7]. The size, shape, and crystallinity of the particles affect the catalytic property [8,9,10,11,12]. Materials consisting of carbon buttons such as graphene and low graphene oxide (RG) are important materials in many fields such as lithium-ion batteries, nanosensors, and energy storage applications due to their important properties such as high surface area [13,14,15,16]. Regarding Congo red, it is a substance that has a complex aromatic composition and is resistant to decomposition, and therefore it is important to find ways to remove it from wastewater. This dye is considered one of the main pollutants in the water of textile industries [17]. A conventional semiconducting photoelectrode may be activated by photons with energy equal to or greater than the bandgap energy when exposed to light [18]. The nanostructures can be used as excellent materials for dye degradation due to the band gap and absorption in Uv-Vis regions. However, the low separation efficiency and fast recombination of the charge carriers, i.e., electron/hole pairs, is still a challenge. Tireless attempts have been made to enhance the catalytic activity of many materials by dopants and other nanostructures [19,20,21]. Among these attempts is the use of materials with heterogeneous interactions, which showed a significant improvement in the decomposition of dyes. Substances based on heterojunctions and activators play a vital role in enhancing the photocatalytic activity in the degradation of dyes [22].
The fundamental mechanism of photogenerated carrier recombination and the impairment of photogenerated carrier recombination to photocatalytic performance should be taken into account. Therefore, it could be that focusing on the main strategies for regulating the behavior of photogenerated carriers is interesting. These photogenerated carriers from the aspect of the driving force for the separation and transfer of photogenerated carriers are including heterojunction design, construction of an intramolecular donor-acceptor (D–A) system, exciton regulation, and electron spin regulation [23]. Single-site metal atoms or clusters (SMCs) present high potential to enable the exploration of energetics and kinetics in heterogeneous photocatalysis owing to their unique properties. Ref. [24] showed that in situ diffuse reflectance infrared Fourier transform spectroscopy, low-coverage calculated isosteric heat, and theoretical studies unveil that the direct cluster/substrate conjunction provides a driving force for interfacial electronic modification and dynamic cooperation. moreover, their Cu clusters-mediated CdS nanorods showed the ability to serve as carrier providers, which allows the photogenerated electrons to transfer from CdS to Cu clusters.
In this work, NiO-graphene or NiO-Ga2O2-graphene (for simplicity Ga2O2 will be called Ga2O2) heterostructure nanocomposites are prepared by the chemical precipitation reaction technique and milling method to study the effect of heterojunction and graphene content on the photocatalytic performance toward Congo red. The structural composition is investigated by HRTEM, EDX, and confocal Raman spectroscopy. The efficiency was calculated for various compositions to elucidate the effect of the ternary composition. The first-order reaction is examined to explain and clarify the catalytic performance.

2. Materials and Methods

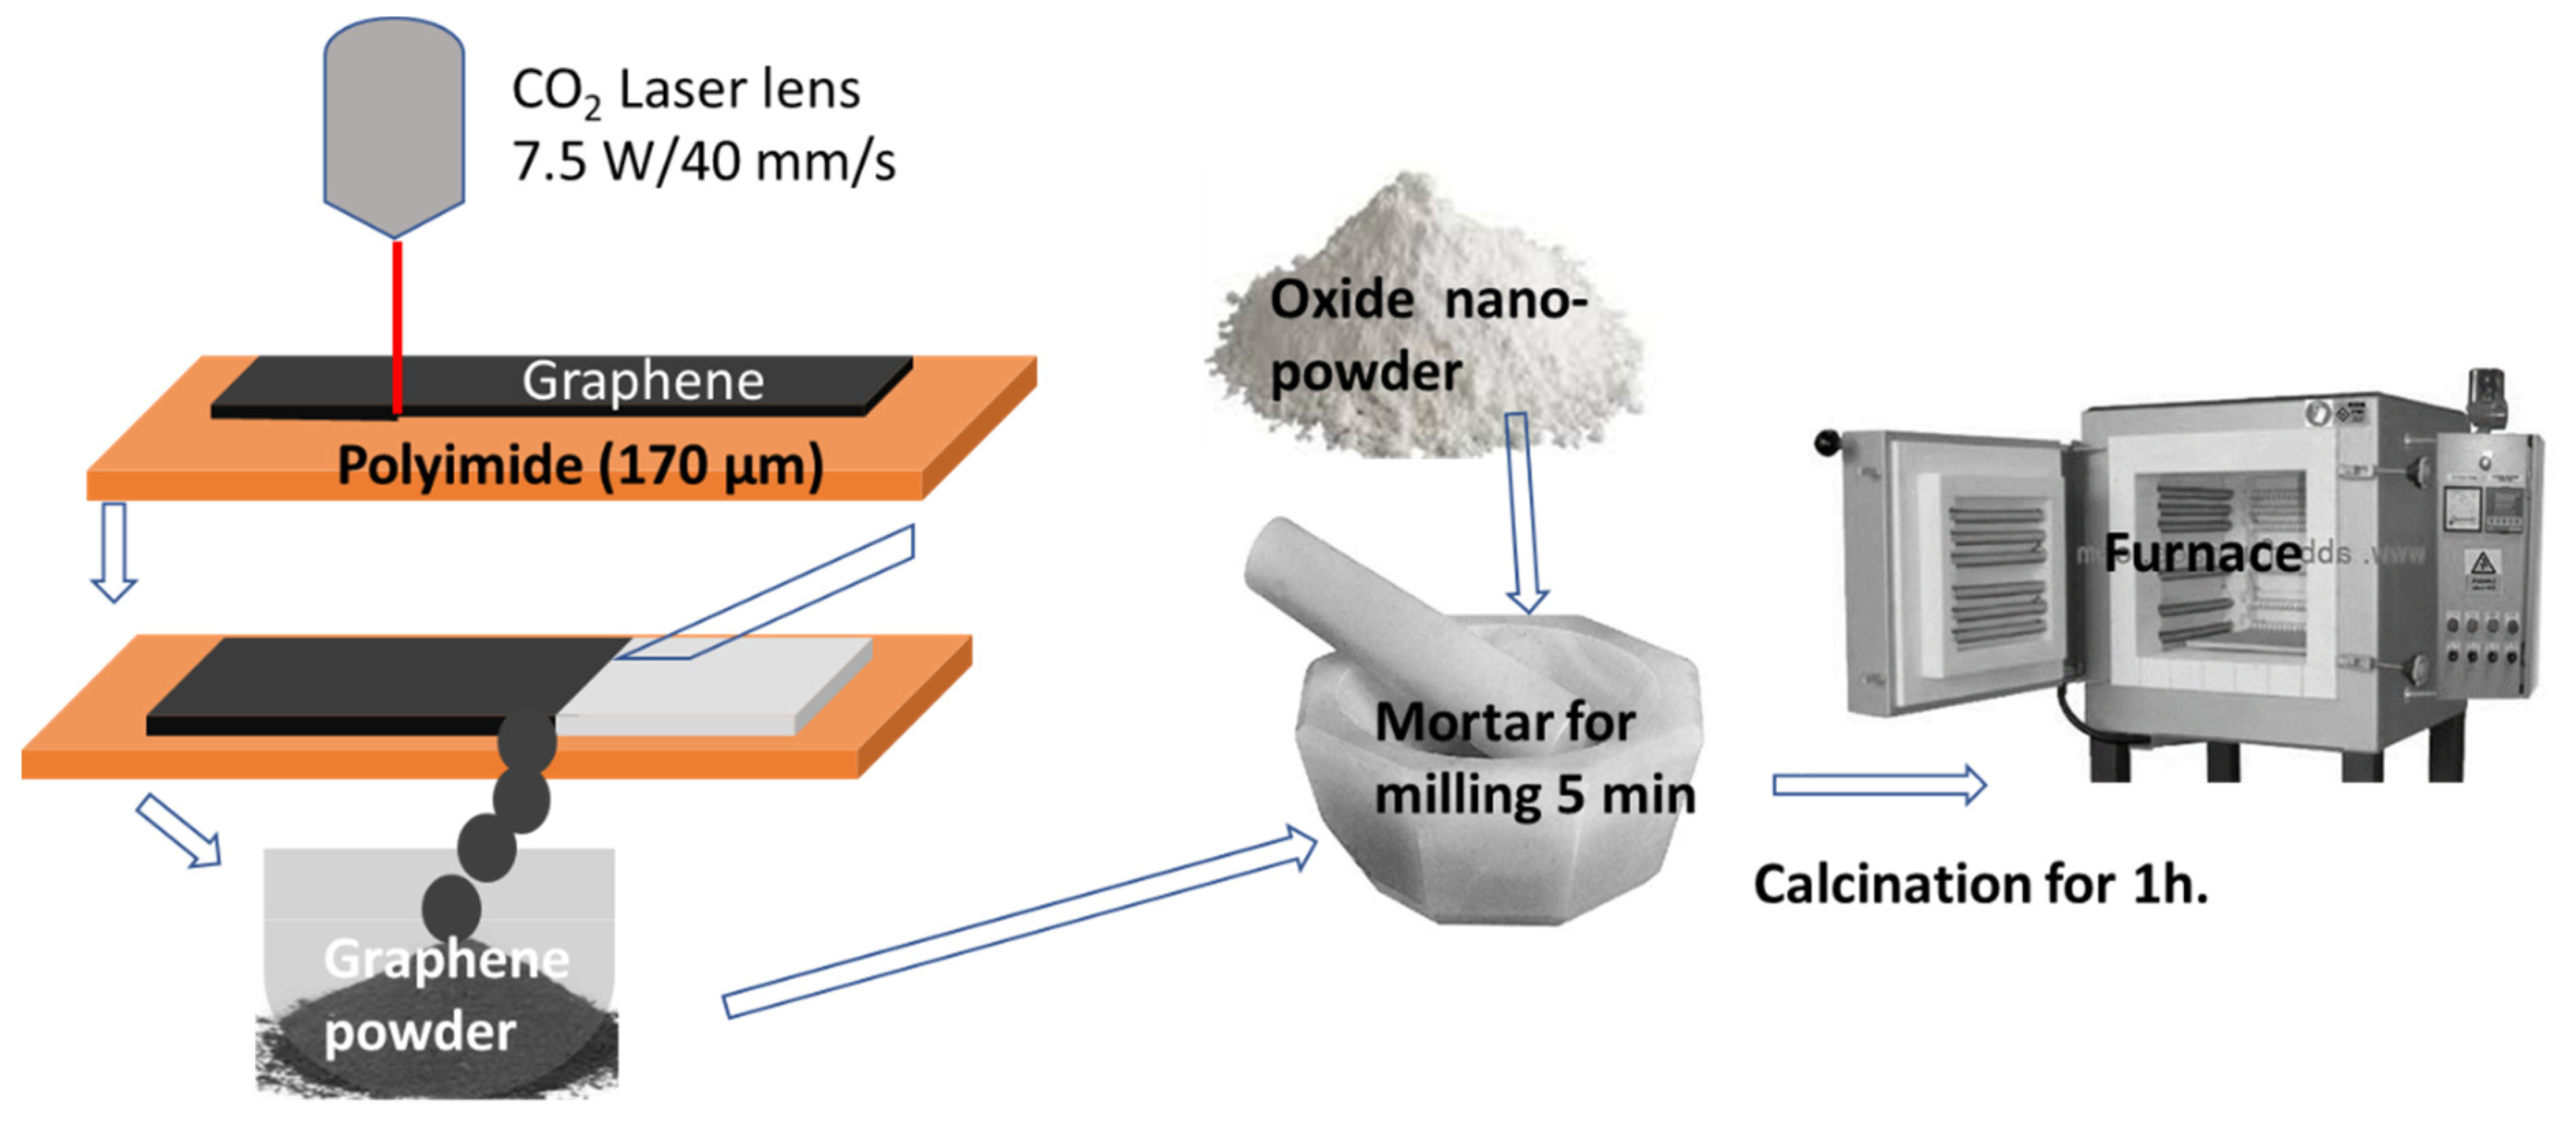
2.1. Materials Preparation

In the present method of preparation, in a beaker, 25 mL of a solution of 0.2 M Nickle nitrate (Ni(NO3)2) are added to 25 mL of a 0.2 M water solution of urea (CO(NH2)2). For less than 10 min, this mixture was reacted in a microwave system. After this period inside the microwave, a fine black powder of NiO NCs is extracted. This powder is washed with distilled water using centrifugation several times [25]. The same procedure has been done for preparing Ga2O2 Using Ga(NO3)3 as a mother solution. The NiO and GaO nanoparticles denoted to NiO and Ga2O2, respectively in the figures. The graphene nanopowder was prepared by using the CO2 laser machine through steps shown in Figure 1. A CO2 laser machine with a maximum power of 40 W and a maximum speed of 400 mm/s was used. Firstly, DuPont Kapton Polyimide Film (TapeCase, Elk Grove Village, IL, USA) of 170 µm (5.0 mil) in thickness was well cleaned. The sheet was placed on the laser machine and exposed to a power of 7.5 W at speed of 40 mm/s. The laser beam was applied to a large area of the polyimide film, and a large quantity (in mg) of graphene powder was obtained. The graphene powder was then mixed with the oxide materials in specific weight percentages, such as 5.0, and 10% of graphene. The mixture was well-milled for 5 min in mortar, so that the color of the mixture was changed to light black color. The product was subjected to the sintering process in an electric furnace at 400 °C for one hour.

2.2. Characterizations

For the high transmission electronic microscopy (HRTEM) measurement, the sample was sonicated for 10 min, then 5 μL of the dispersed solution was dried on a carbon-coated copper grid. The equipment (JEOL, JEM-2100F, Tokyo, Japan) works with 200 kV was used for HRTEM. The elemental composition was analyzed by the EDX technique attached to the TEM system. The products were also investigated by a confocal Raman Spectroscopy (Lab RAM-HR800) connected with a charge-coupled detector (CCD). The excitation light of HeNe with 633 nm-wavelength and 20 mW-output power was used. For Raman spectrum measurements, a configuration of backscattering at room temperature with a 0.8 cm−1 spectral resolution was used. According to our previous research [26,27], the catalytic study was taken to the test in the following way: A solution of 1 L of Congo red blue (CR), C16H18ClN3S, was prepared and then dilute to prepare two concentrations of 5 mg/L, and 10 mg/L of MB dye. A fixed quantity of oxide with different content of graphene of 2 mg was employed. The solution was shifted to a UV lamp with a time started from 0 to 3.0 h. The CR dye concentration in the solution was determined at room temperature with a Jenway 6300 UV-visible spectrophotometer at 490 nm of wavelength.

3. Results and Discussion

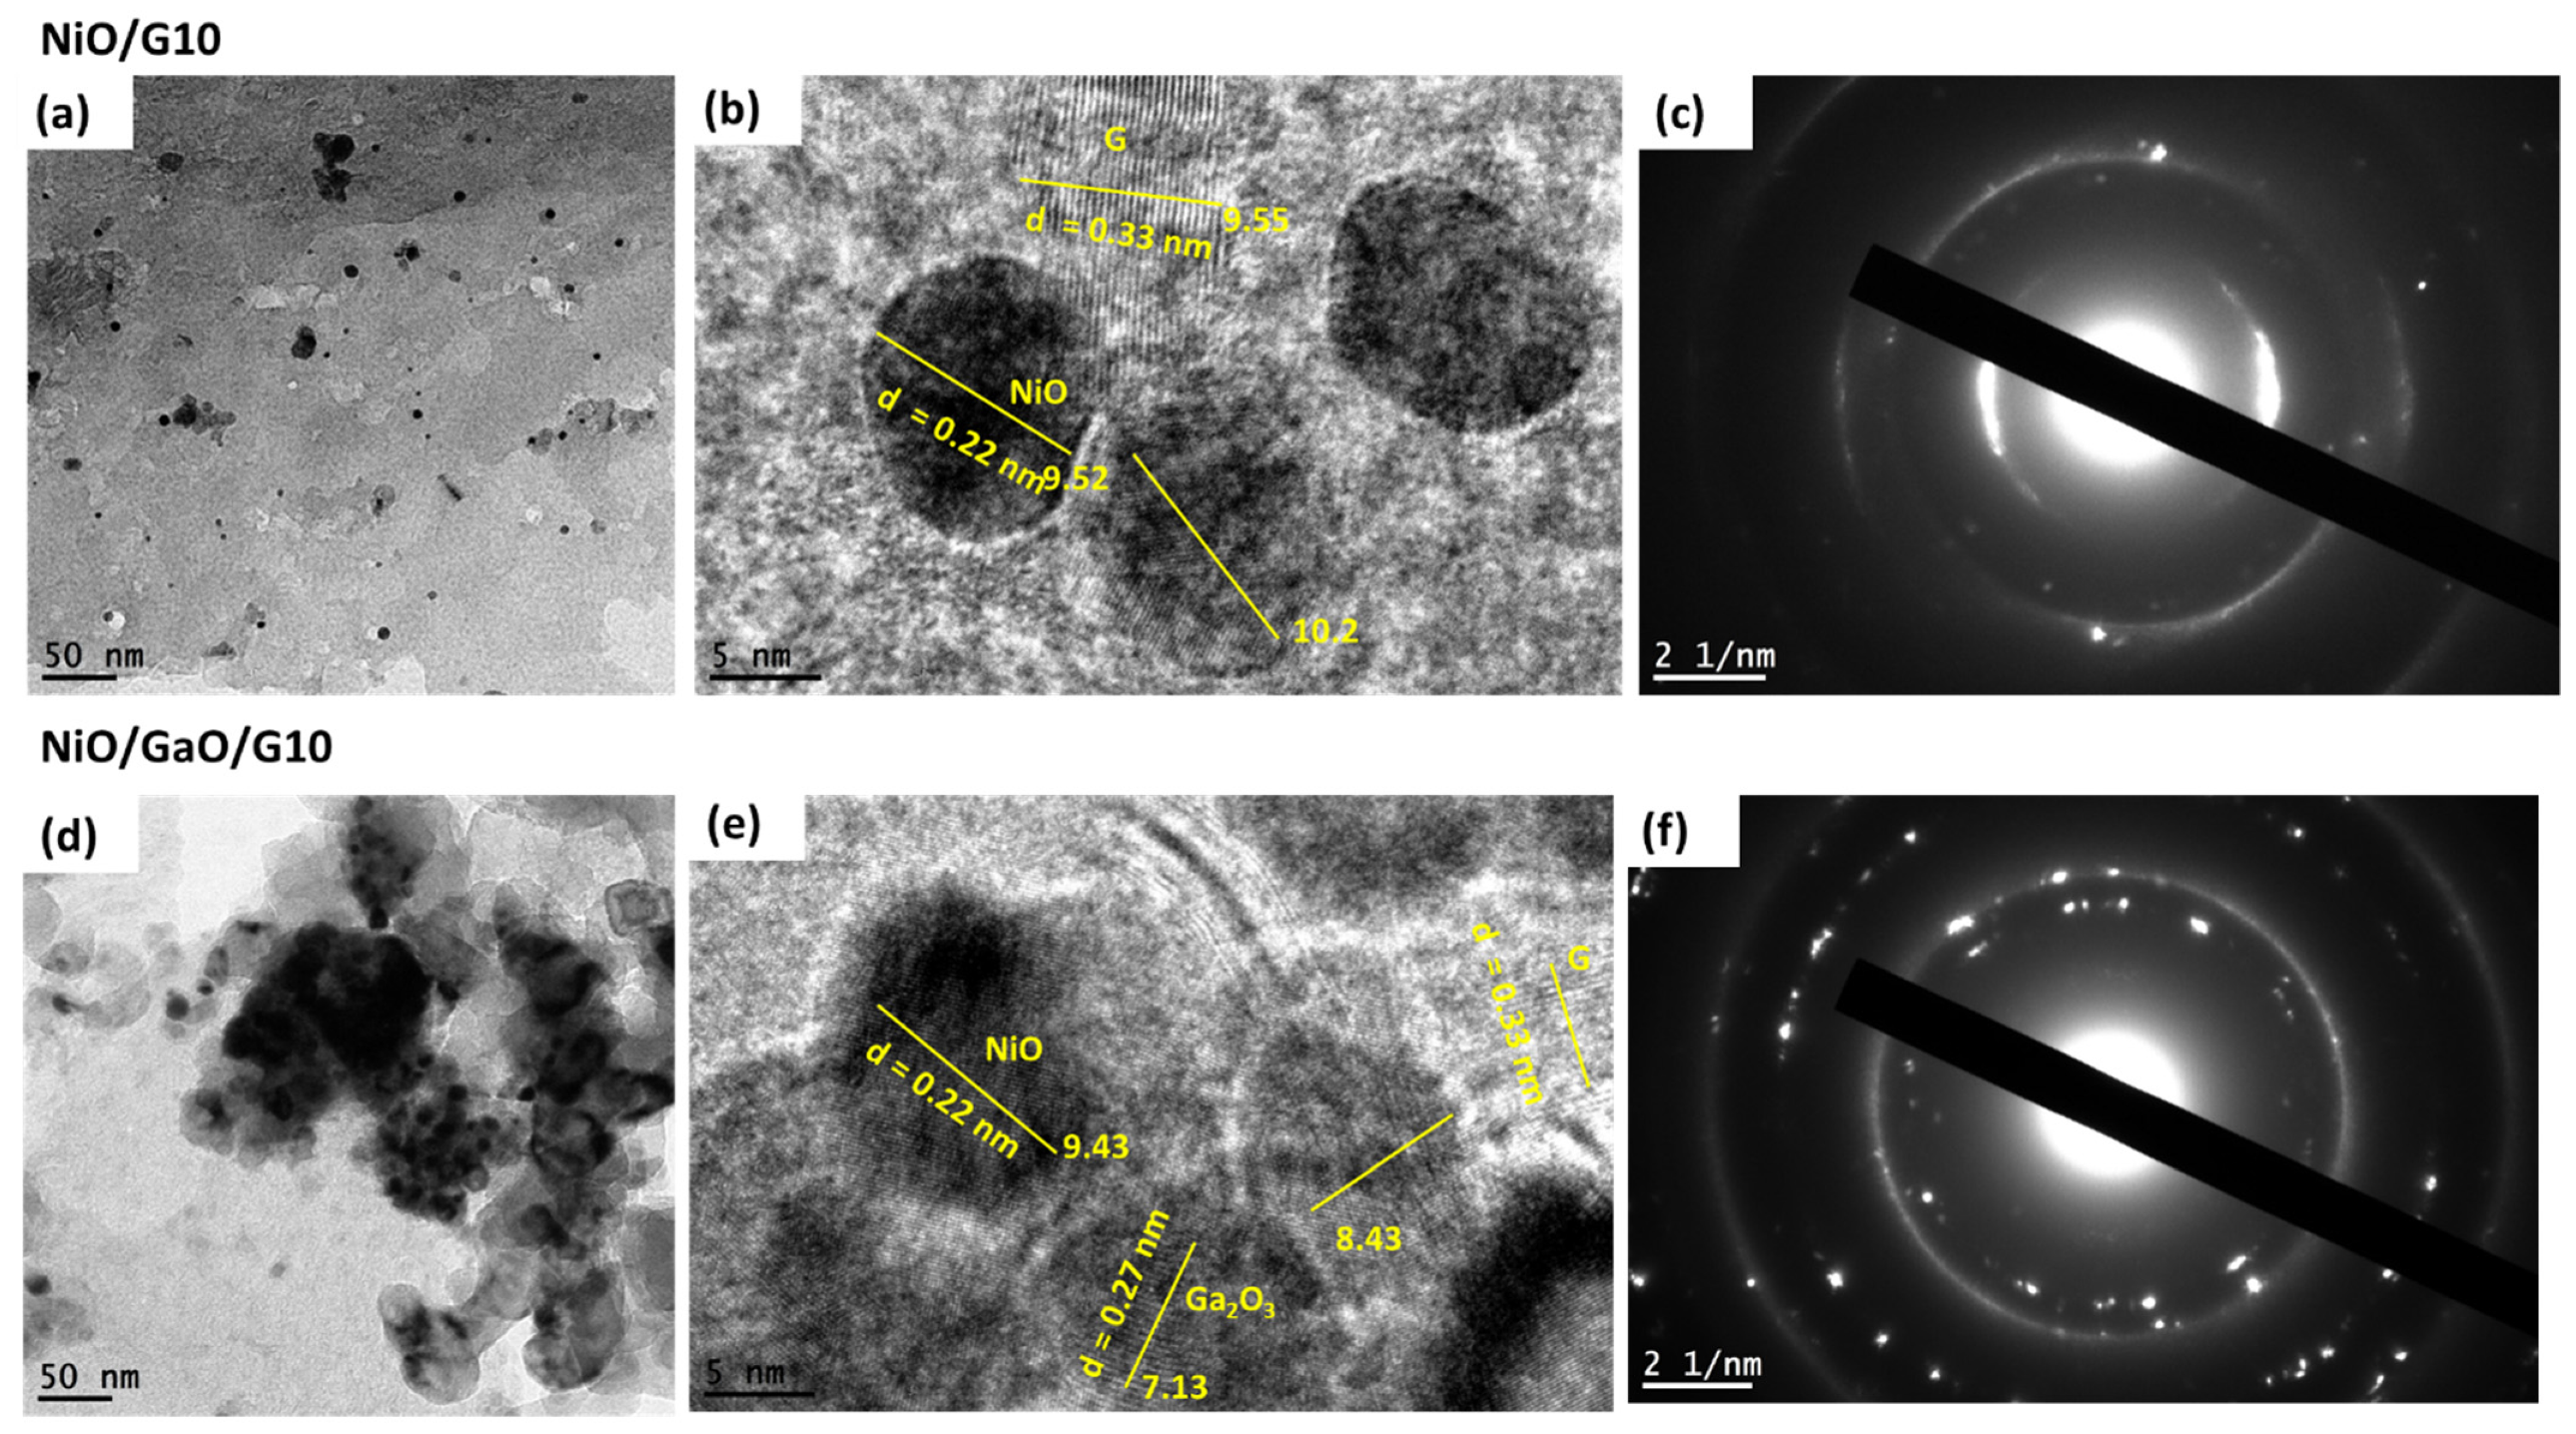
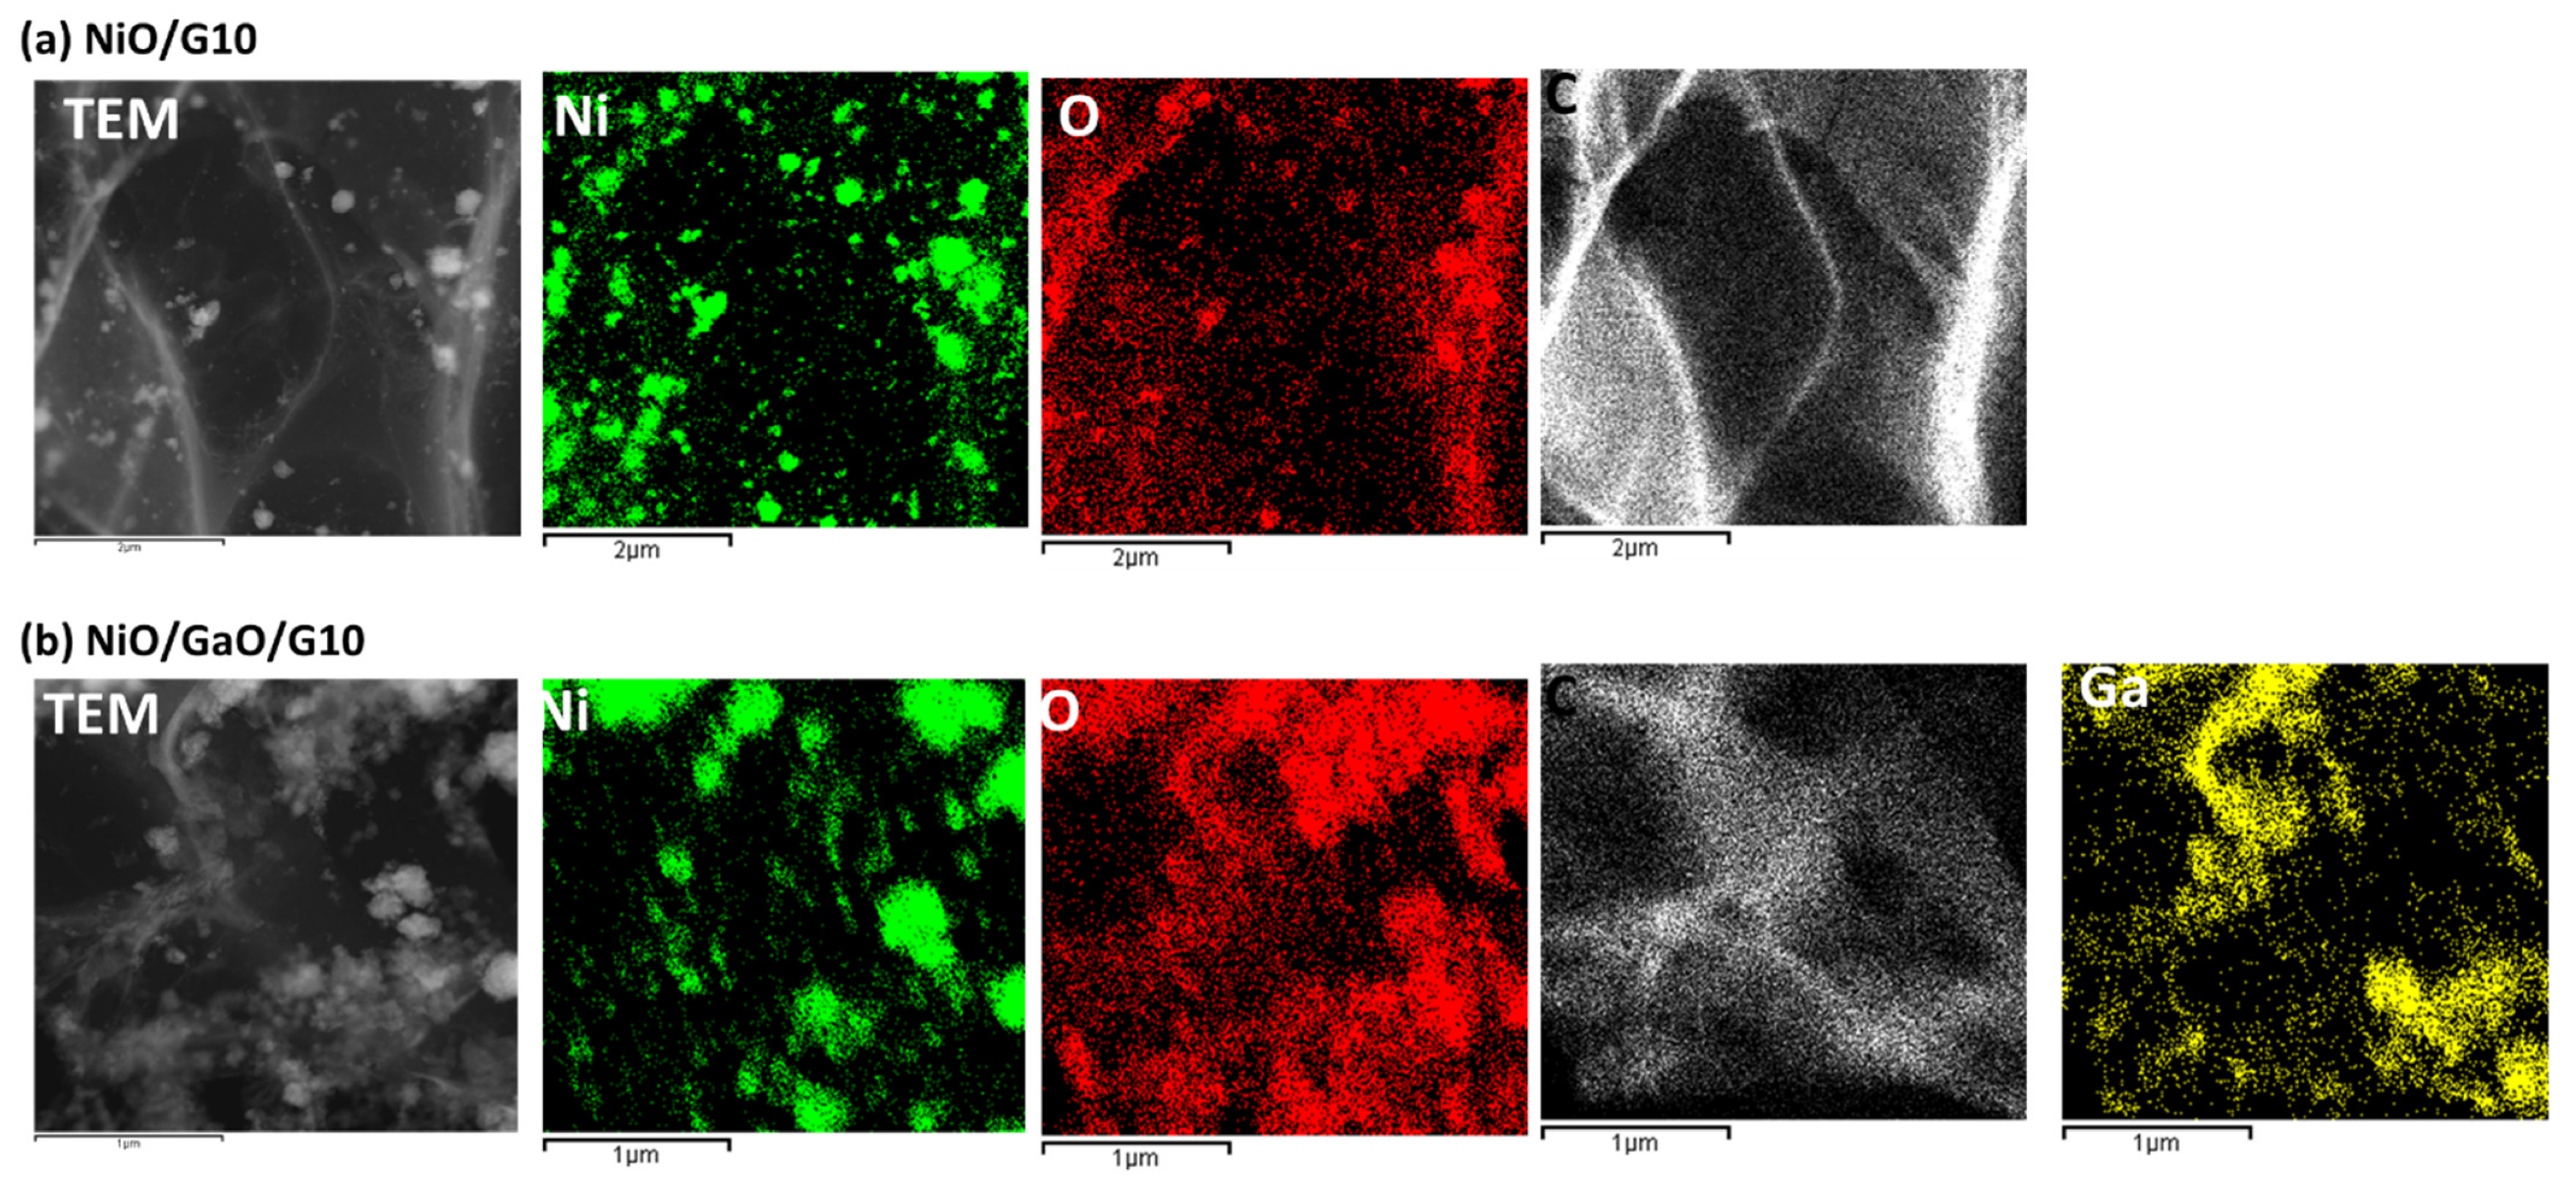
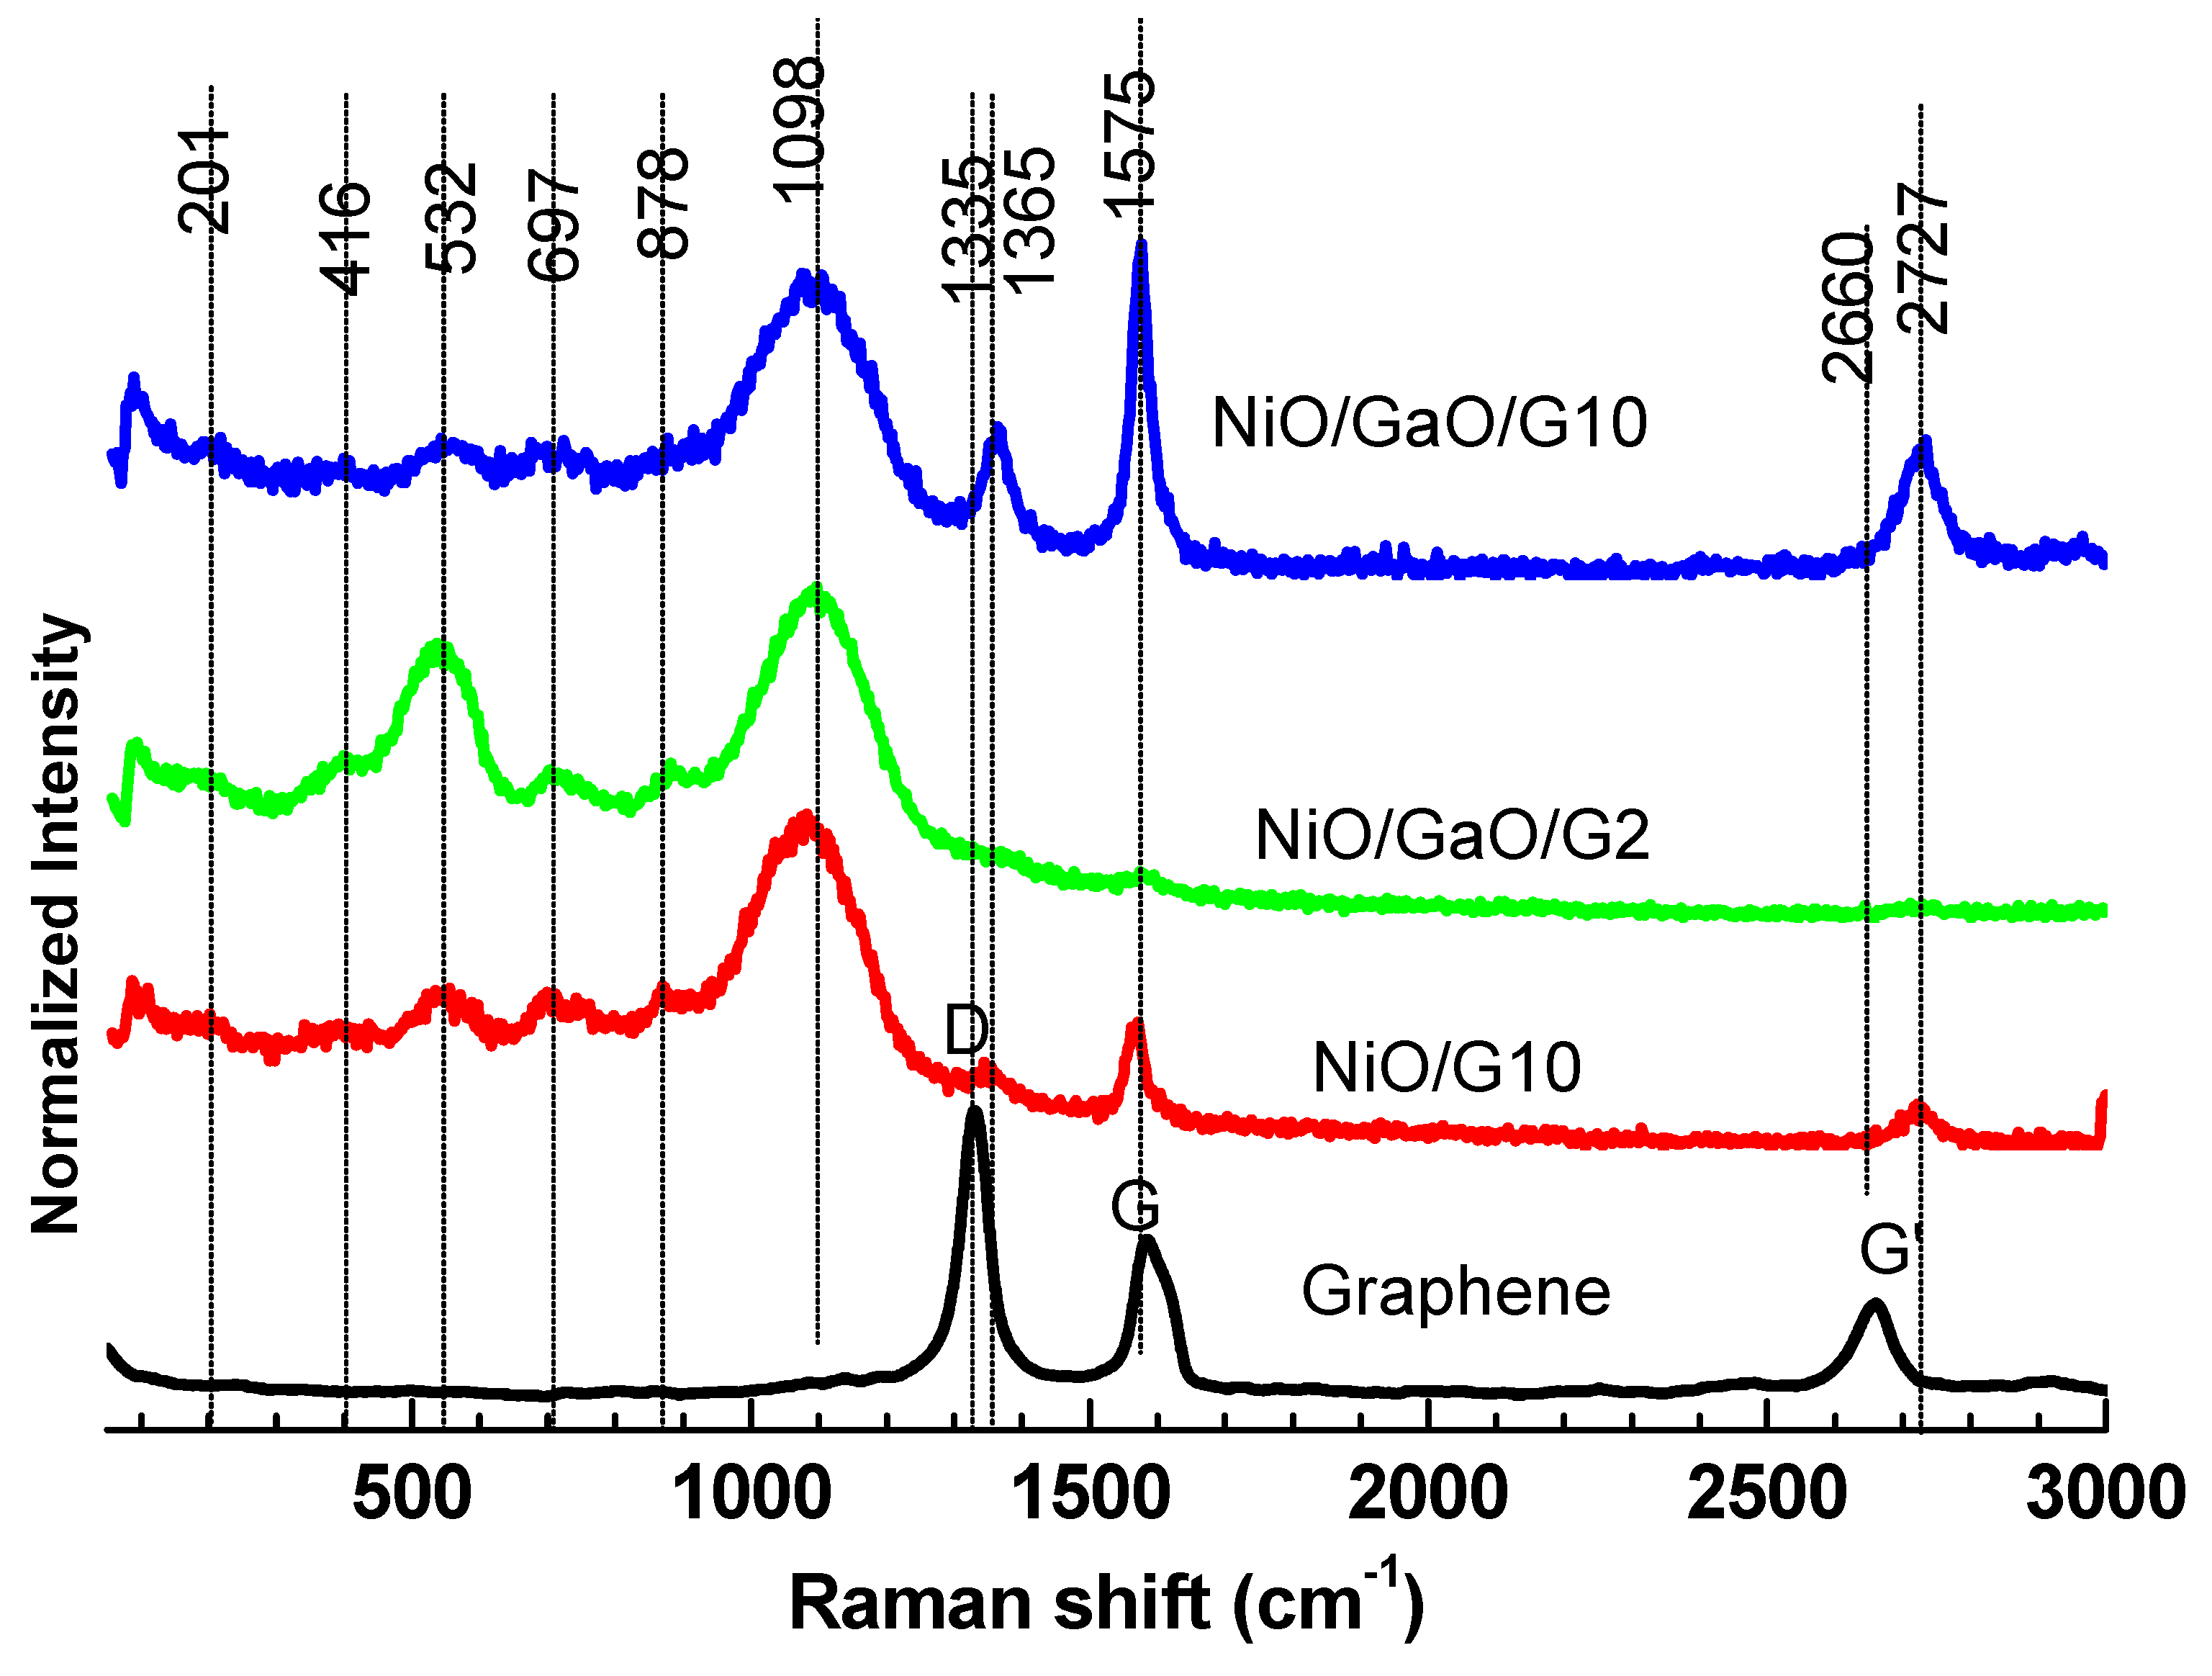
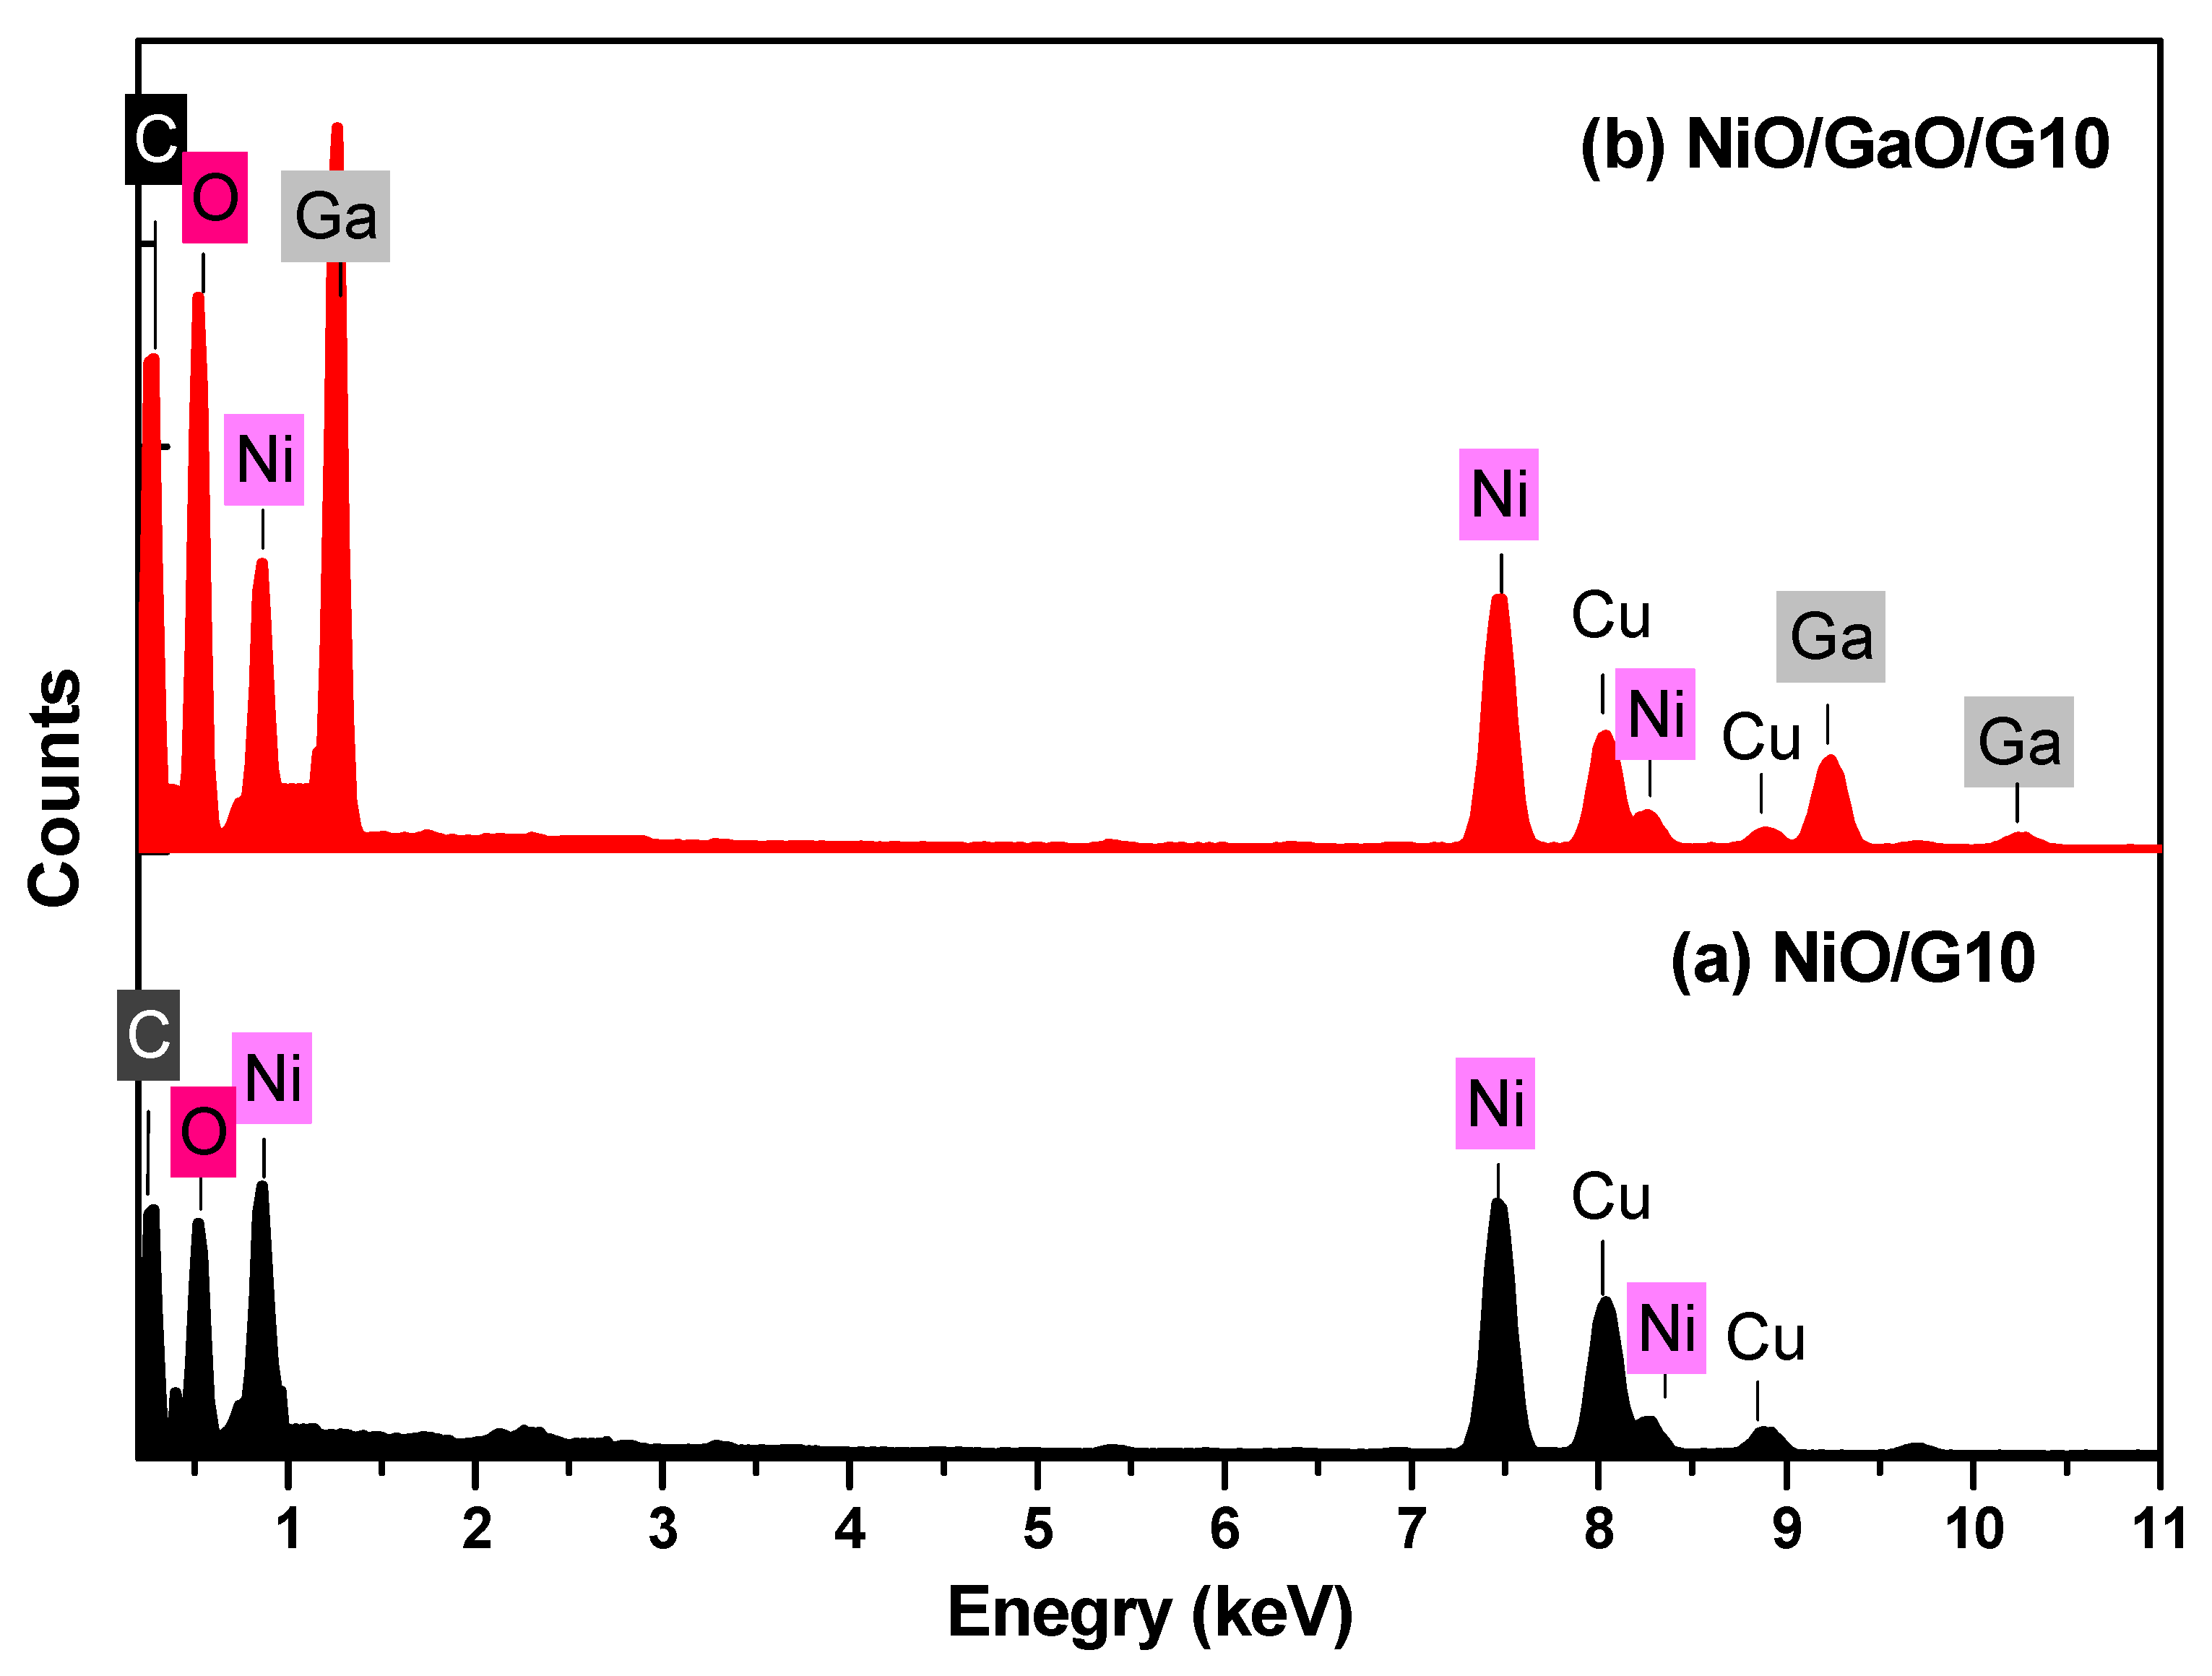
3.1. Structural Analysis

HRTEM images and lattice images for the NiO/G10 and NiO/Ga2O2/G10 are shown in Figure 2. For NiO/G10 nanocomposite is hard to see boundaries between particles at a 50 nm scale where the material is aggregated in a compact film-like structure. However, very fine crystals like quantum dots with sizes 9.55 to 10.2 nm were observed in Figure 2b. The HRTEM images also show the fringe pattern and the d-spacing values calculated from the fringe pattern are 0.22 nm for NiO nanoparticles which correspond to the (220) plane of face-centered cubic NiO [28]. Large crystal-like sheets with a width of 9.55 nm were also observed, as shown in Figure 2b. The d-spacing of this lattice is about 0.33 nm, which is correlated to the graphene nanostructure of the plane (002) [29]. Figure 2c shows the selected area electron diffraction (SAED) pattern of NiO/G10 nanocomposite. The observed rings of the samples show that the sample is polycrystalline nature and is of face-centered cubic phase with the plane (111) for NiO, (002), and (100) for graphene. Figure 2d–f shows the images of ternary composite, where aggregated nanoparticles are observed in Figure 2d but hard to distinguish the boundaries. Fringe patterns showed three lattices corresponding to NiO, Ga2O2, and graphene, which is confirmed in the complicated SAED patterns. The effect of Ga2O2 fine crystals appears in SAED with round spots, corresponding to various planes of NiO, Ga2O2, and graphene. It is evident from the electron diffraction analysis that synthesized Ga2O2 nanostructures are in general crystalline. The d-spacing in Figure 2e is about 0.27 nm and corresponds to the distance between (104) planes of Ga2O2. From the fringe patterns, we can conclude the contact boundaries between the three compounds, confirming the heterojunction connection for the composite.
A deep investigation of the distribution of the elements inside the nanocomposite can be observed by EDX-mapping, as shown in Figure 3. Figure 3a shows the qualitative distribution of Ni, O, and C elements on a 2 µm scale of NiO/G10. The Ni, O, and C are widely distributed and not aggregated inside the composite. We have to point out here that the level of C is higher than the base which was detected from the carbon-coated copper grid, as shown later in EXD spectra. Figure 3b confirmed the good distribution for all elements of Ni, Ga, O, and C for the ternary nanocomposite, confirming the connections between the compounds. The EDX spectra of the two samples prepared by NiO/G10 and NiO/Ga2O2/G10 are shown in Figure 4. The spectrum of NiO/G10 indicated the emission energy of the K-Ni, K-O, and K-C elements, in addition to the Cu energy coming from the carbon-coated copper grid, as shown in Figure 4a. The weight percentages of Ni and O were 54.07% and 22.59% in the sample NiO/G10, where the carbon weight percentage was 23.34%. in previous measurements, the weight percentage of carbon for the free-carbon sample was about 10–12%, as listed in Table 1. By subtracting this value, the weight percentage of carbon is about 10%, which is corresponding to the intended value. The corresponding atomic percentages of Ni, O, and C are 21.53, 33.0, and 44.47%, respectively. The EDX spectrum of NiO/Ga2O2/G10 ternary nanocomposite is shown in Figure 4b. The x-ray energies of Ni, Ga, O, and C are indicated on the charts. The element weight percentages of the ternary compound were also calculated and listed in Table 1. The weight percentages of Ni, O, C, and Ga elements were 27.43, 11.46, 22.92, and 38.2, corresponding to atomic percentages of 12.83, 19.67, 52.45, and 15.05, respectively. The result confirms the formation of binary and ternary composites as intended in this study.
Raman spectroscopy is a sensitive tool for the disorder and the degrees of crystallinity of the materials [30,31]. The graphene defects can be qualitatively characterized by Raman measurements. Graphene as a carbon material demonstrates three important modes described at their surface defects, impurity, and multilayers, as shown in Figure 5. These three modes were assigned to D-band, G-bound, and G’-band, respectively. The pronounced D band in graphene is due to a particular level because of the multilayer configuration and indicates further disorder in the structure. From Figure 5, the D-band is observed higher compared to G-band. In the present graphene, the ratio of D/G intensities expresses the more induced disorders [32]. The G-bond is assigned to the intra-bond of sp2 pairs hybridized carbons combined to E2g symmetry, while the D-band assigns to A1g symmetry of breathing mode owing to the disordering [30]. The ratio of G’ to G intensities indicates the multilayer carbons [33,34,35,36,37]. The G-band was indicated for NiO/G10 and NiO/Ga2O2/G10, which contain 10% of graphene, while slightly appears for NiO/Ga2O2/G2, which has 2% of graphene. However, D-band is hardly seen for NiO/G10 and NiO/Ga2O2/G2 but is seen for NiO/Ga2O2/G10 with low intensity. The mixed samples were subjected to calcination at 400 °C for 30 min. This might reduce the disordering in graphene which was surrounded by oxide materials. It is observed that redshift occurred for the G’-band and D-band upon doping. New vibration modes have been observed for the ternary nanocomposite including NiO and Ga2O2. Table 2 shows all Raman shifts observed for the samples. Table 3 shows the vibration modes reported in the literature for graphene [30,31,32], NiO [38,39,40], and Ga2O2 [41,42]. However, the observed shift in D-band and G’-band may be ascribed to the bound between the oxide and graphene at the interfaces, which may create new vibrations. This interface was observed for the nanocomposites in HRTEM images.

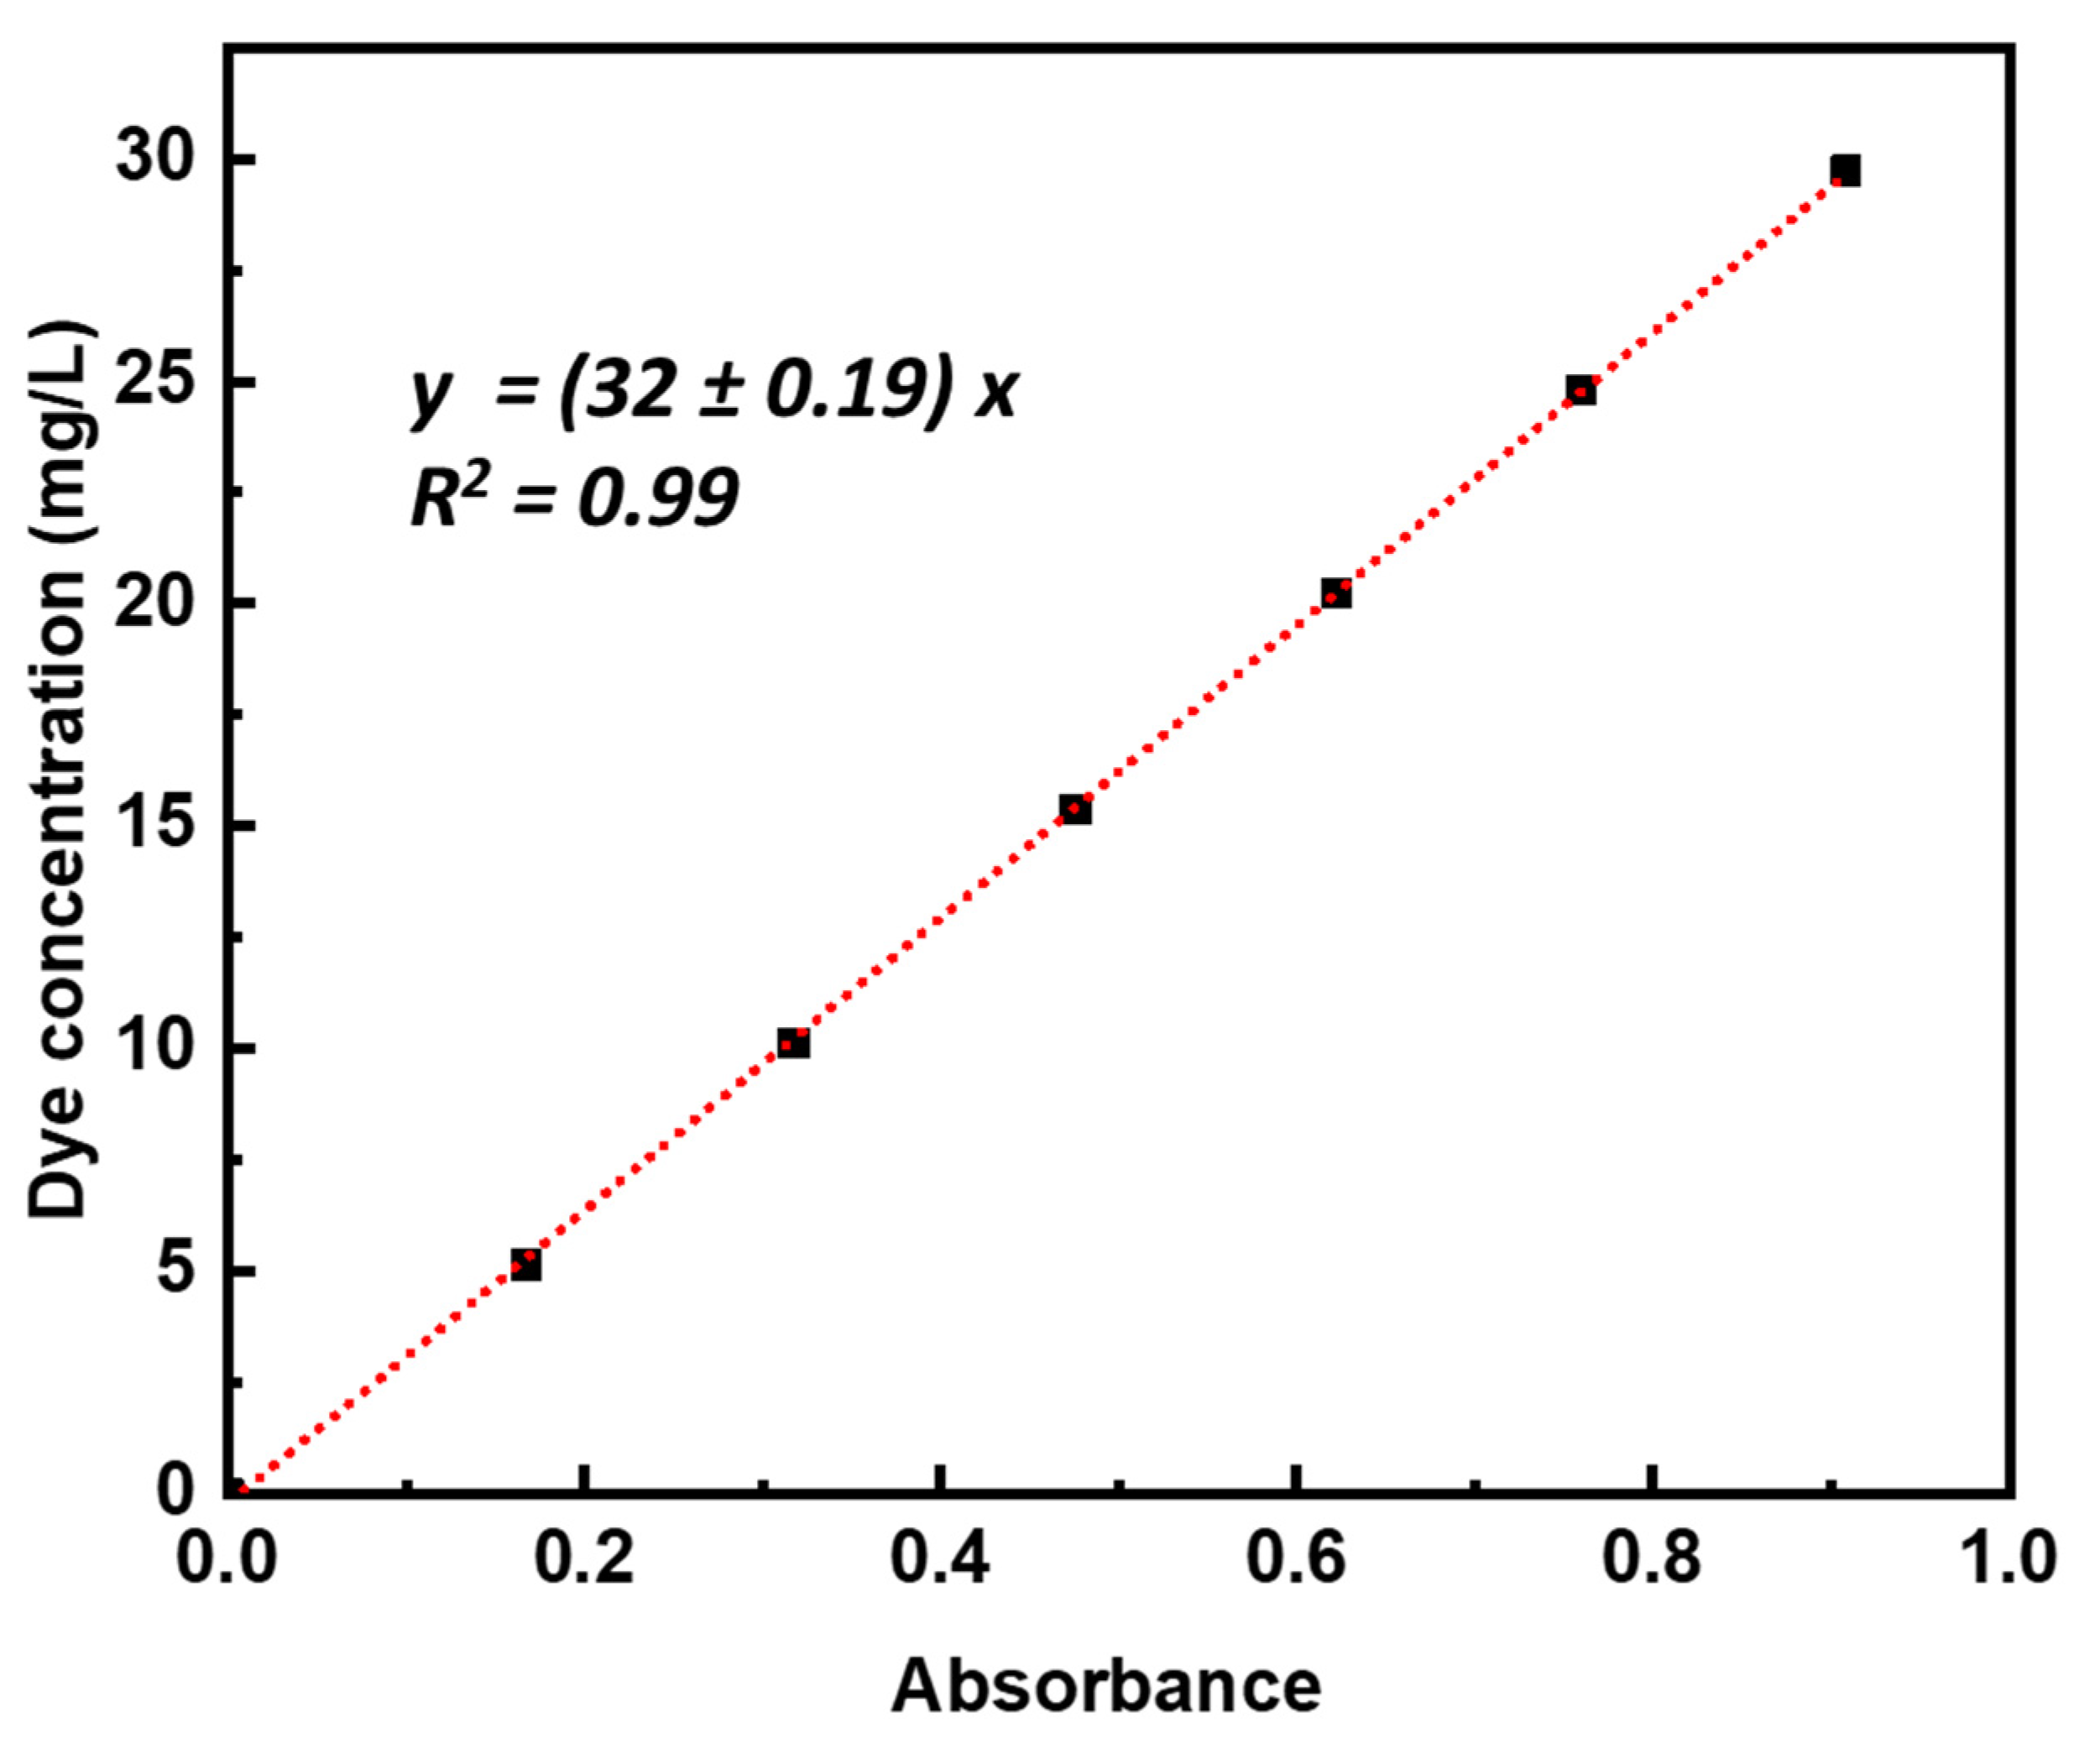
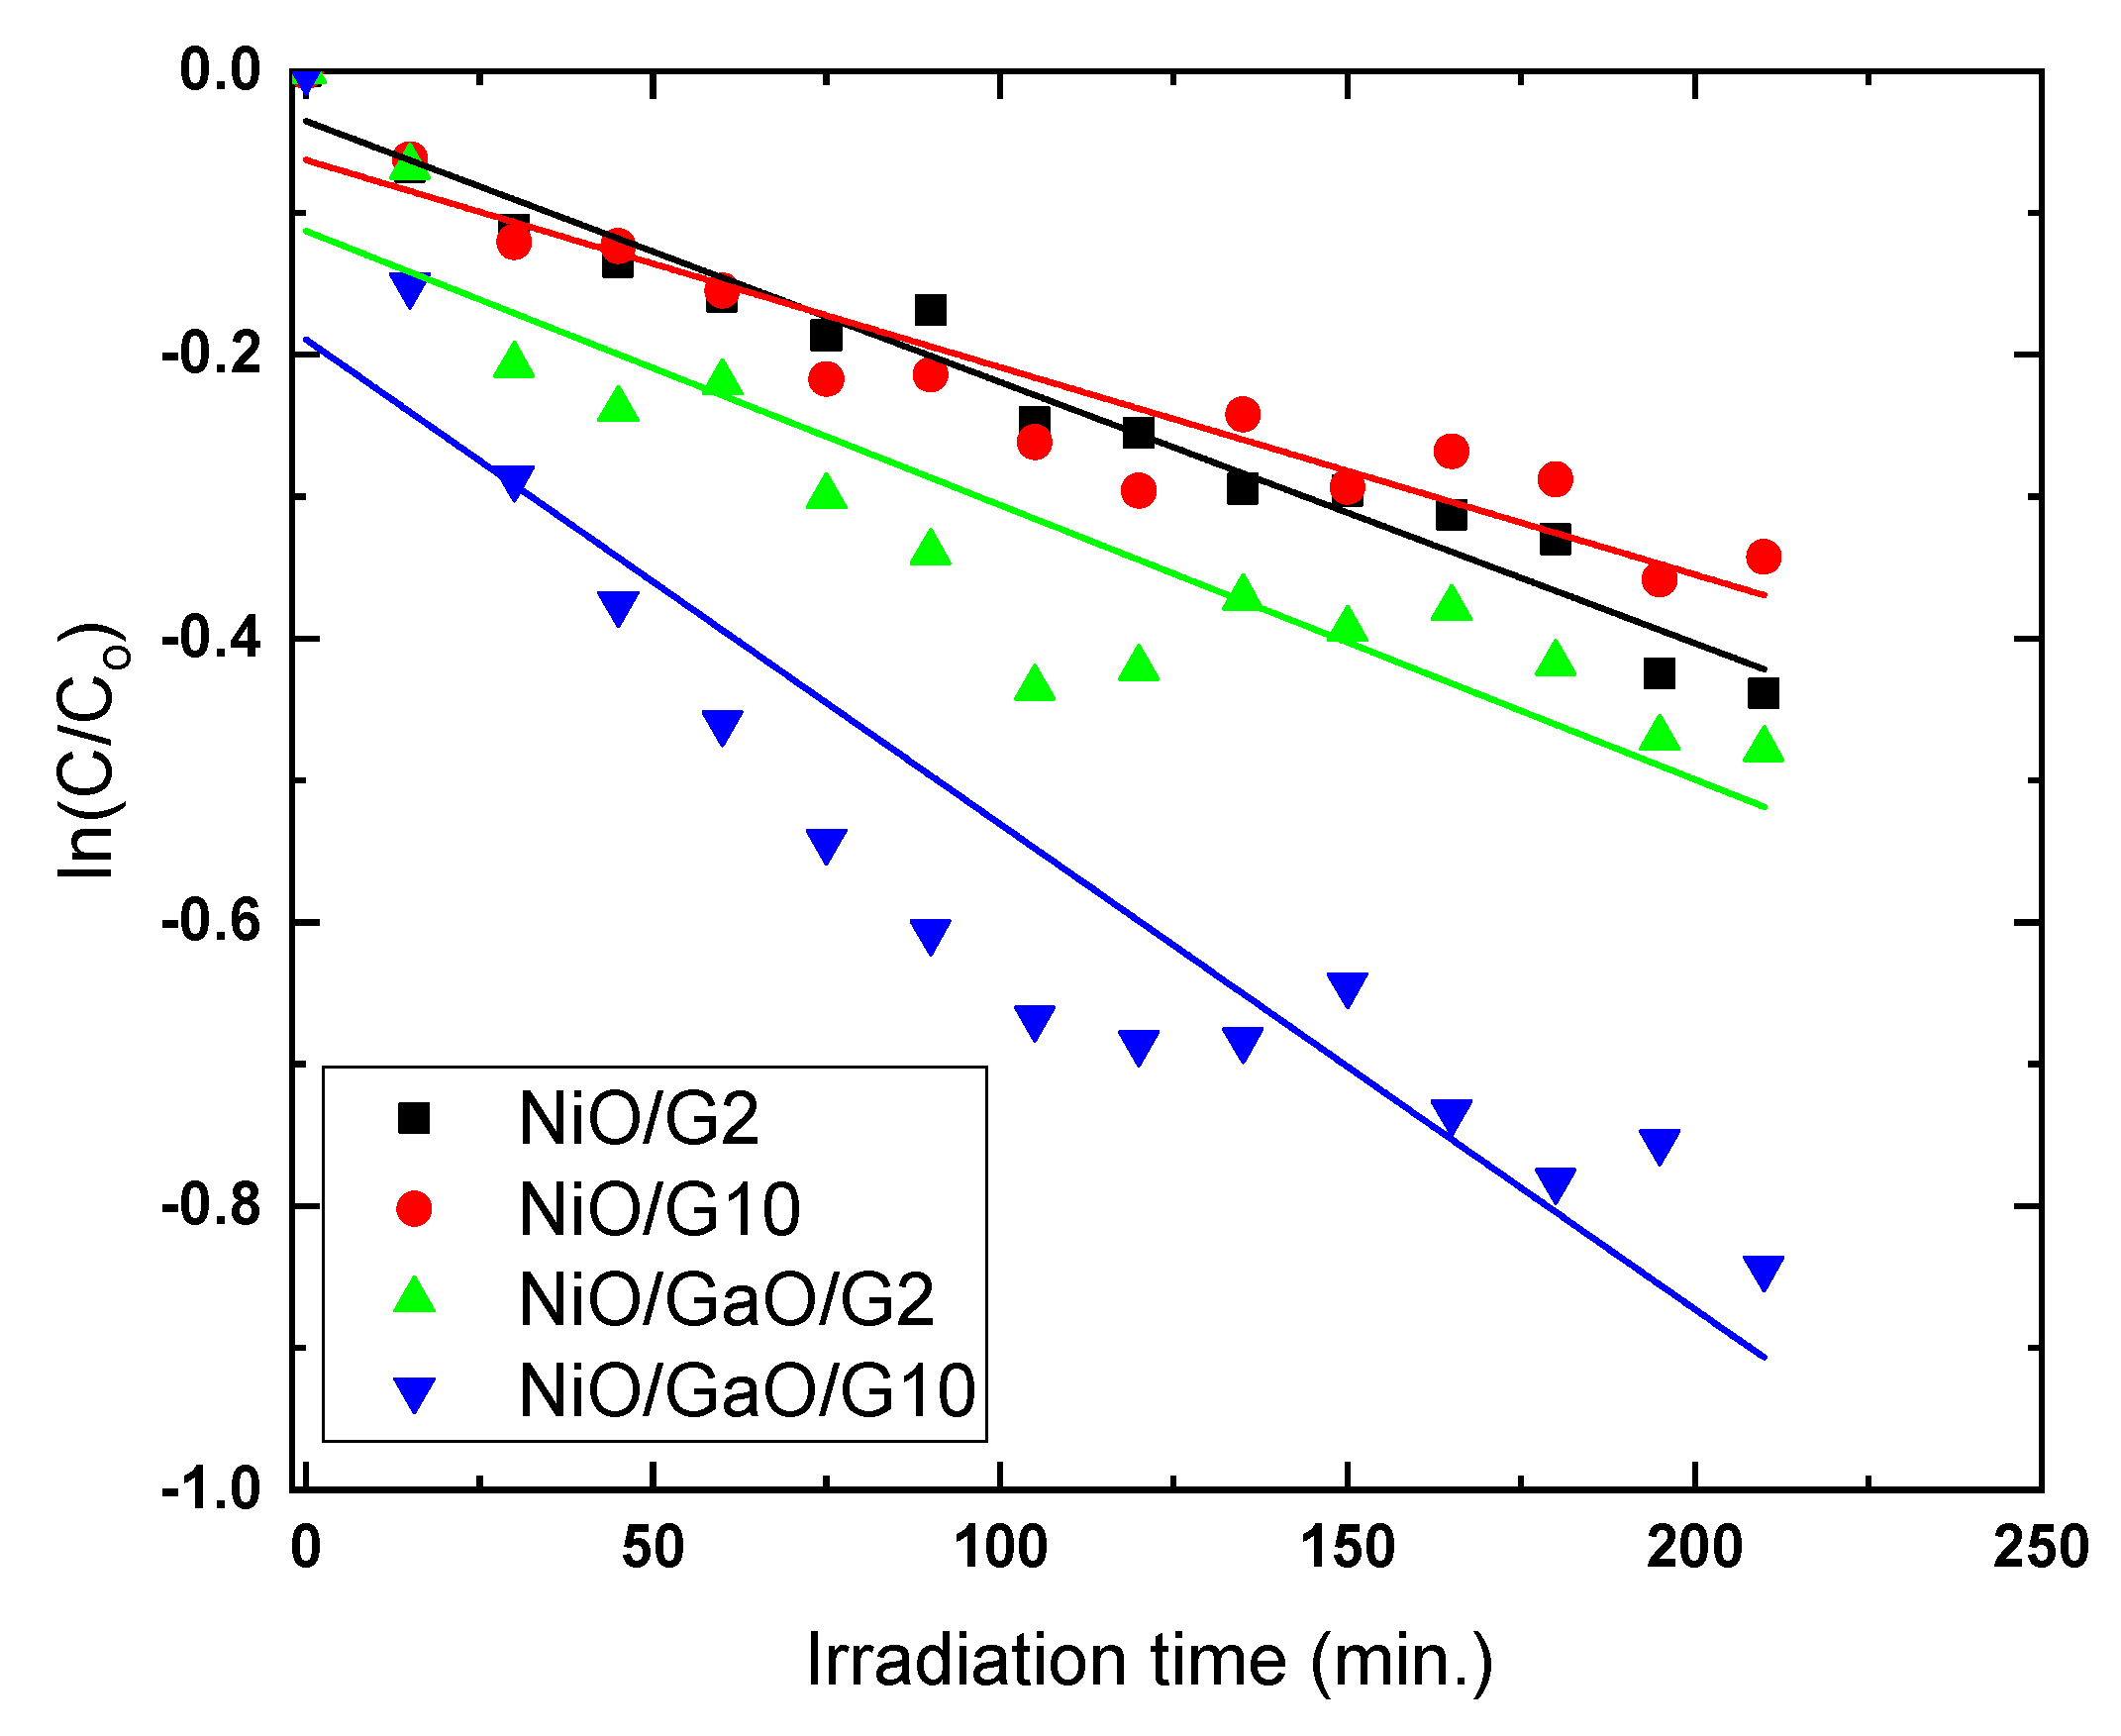
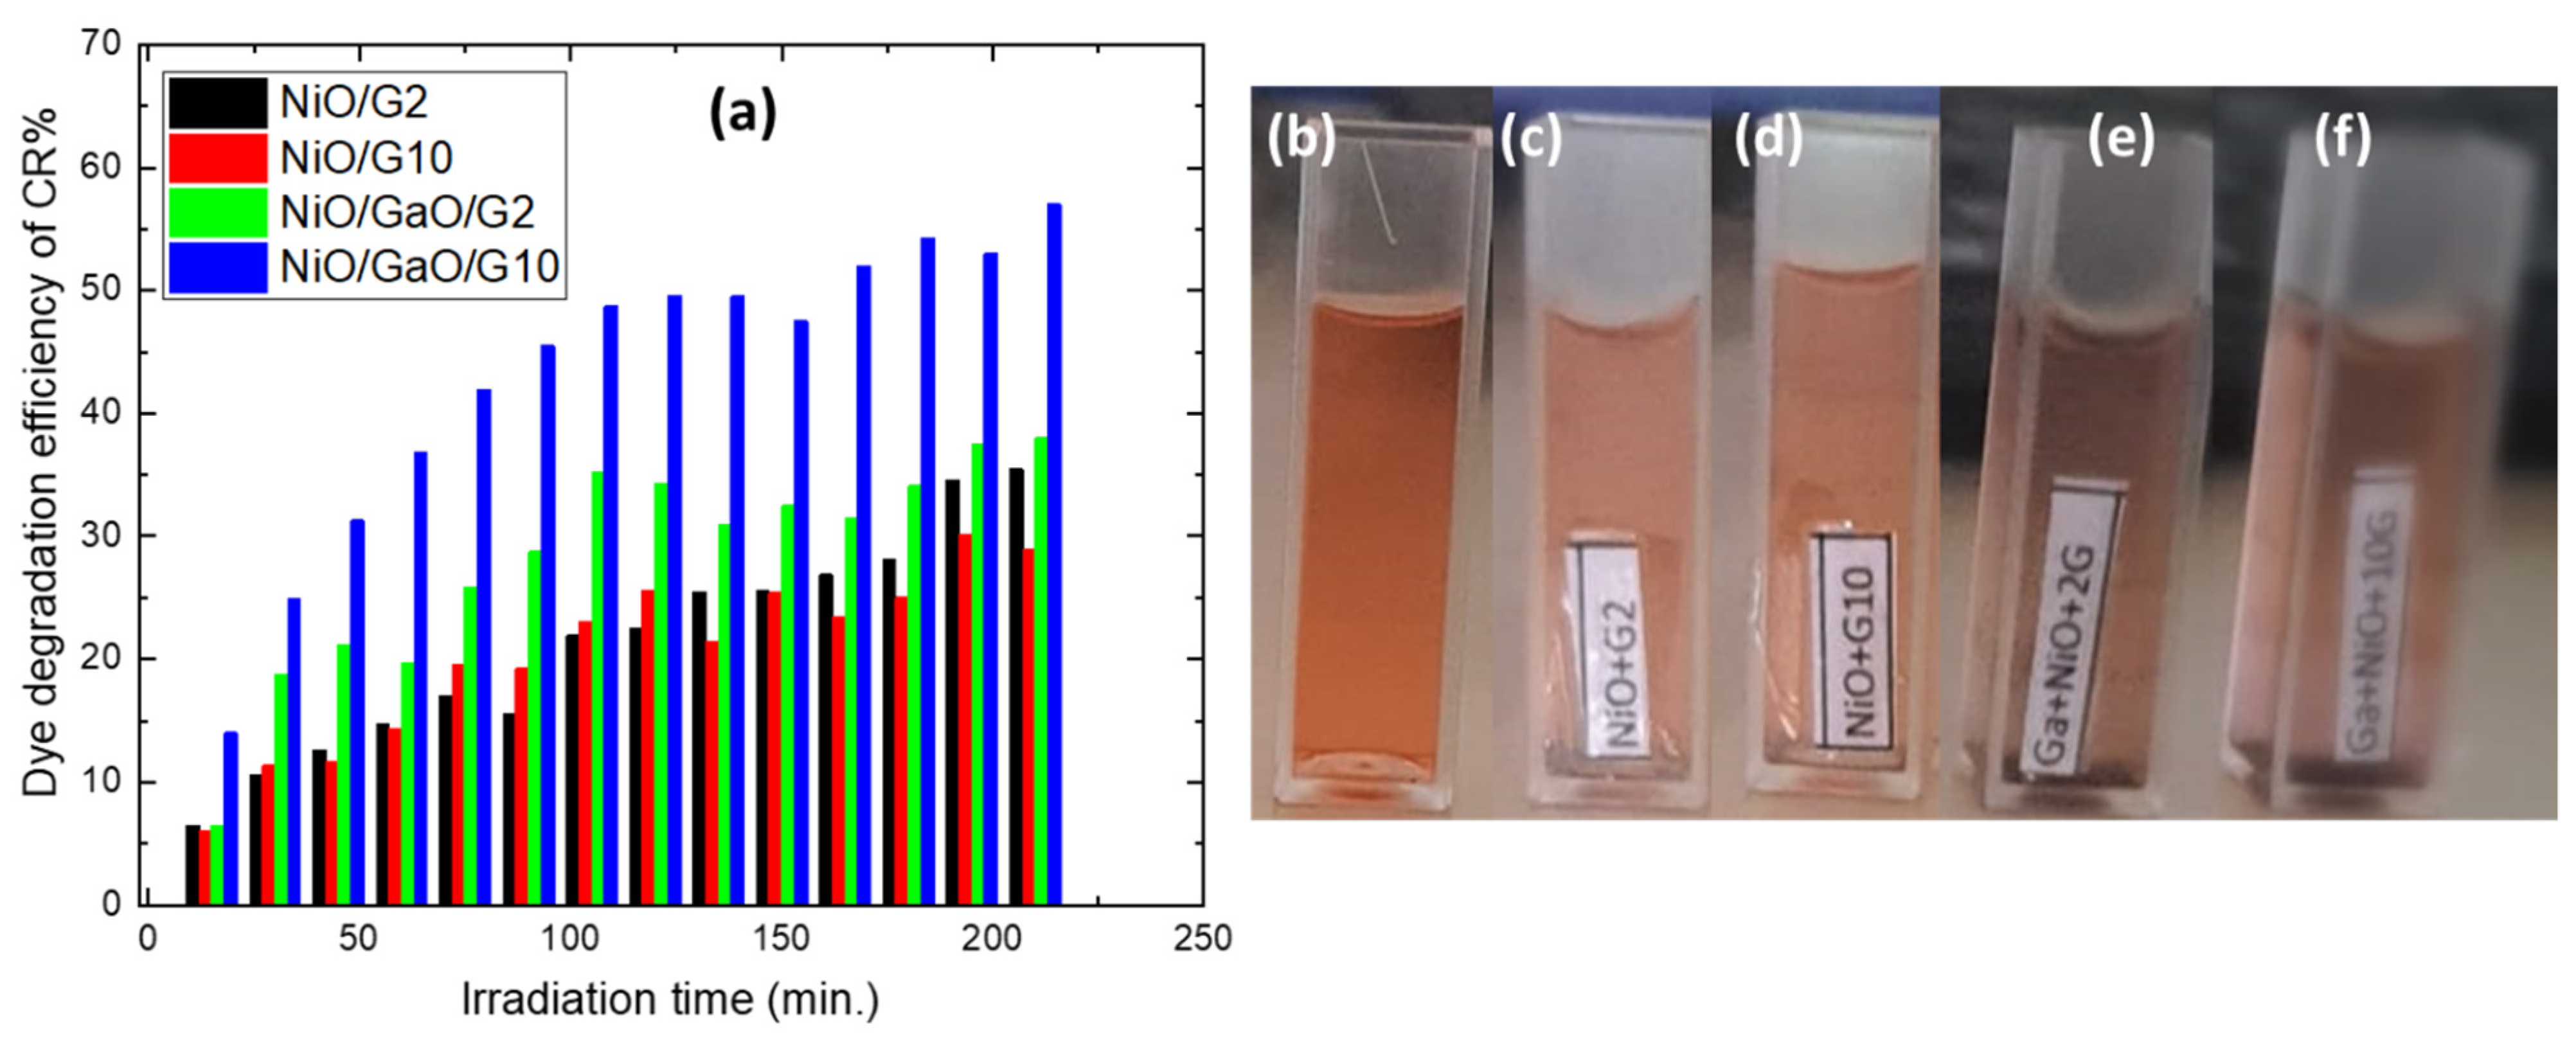
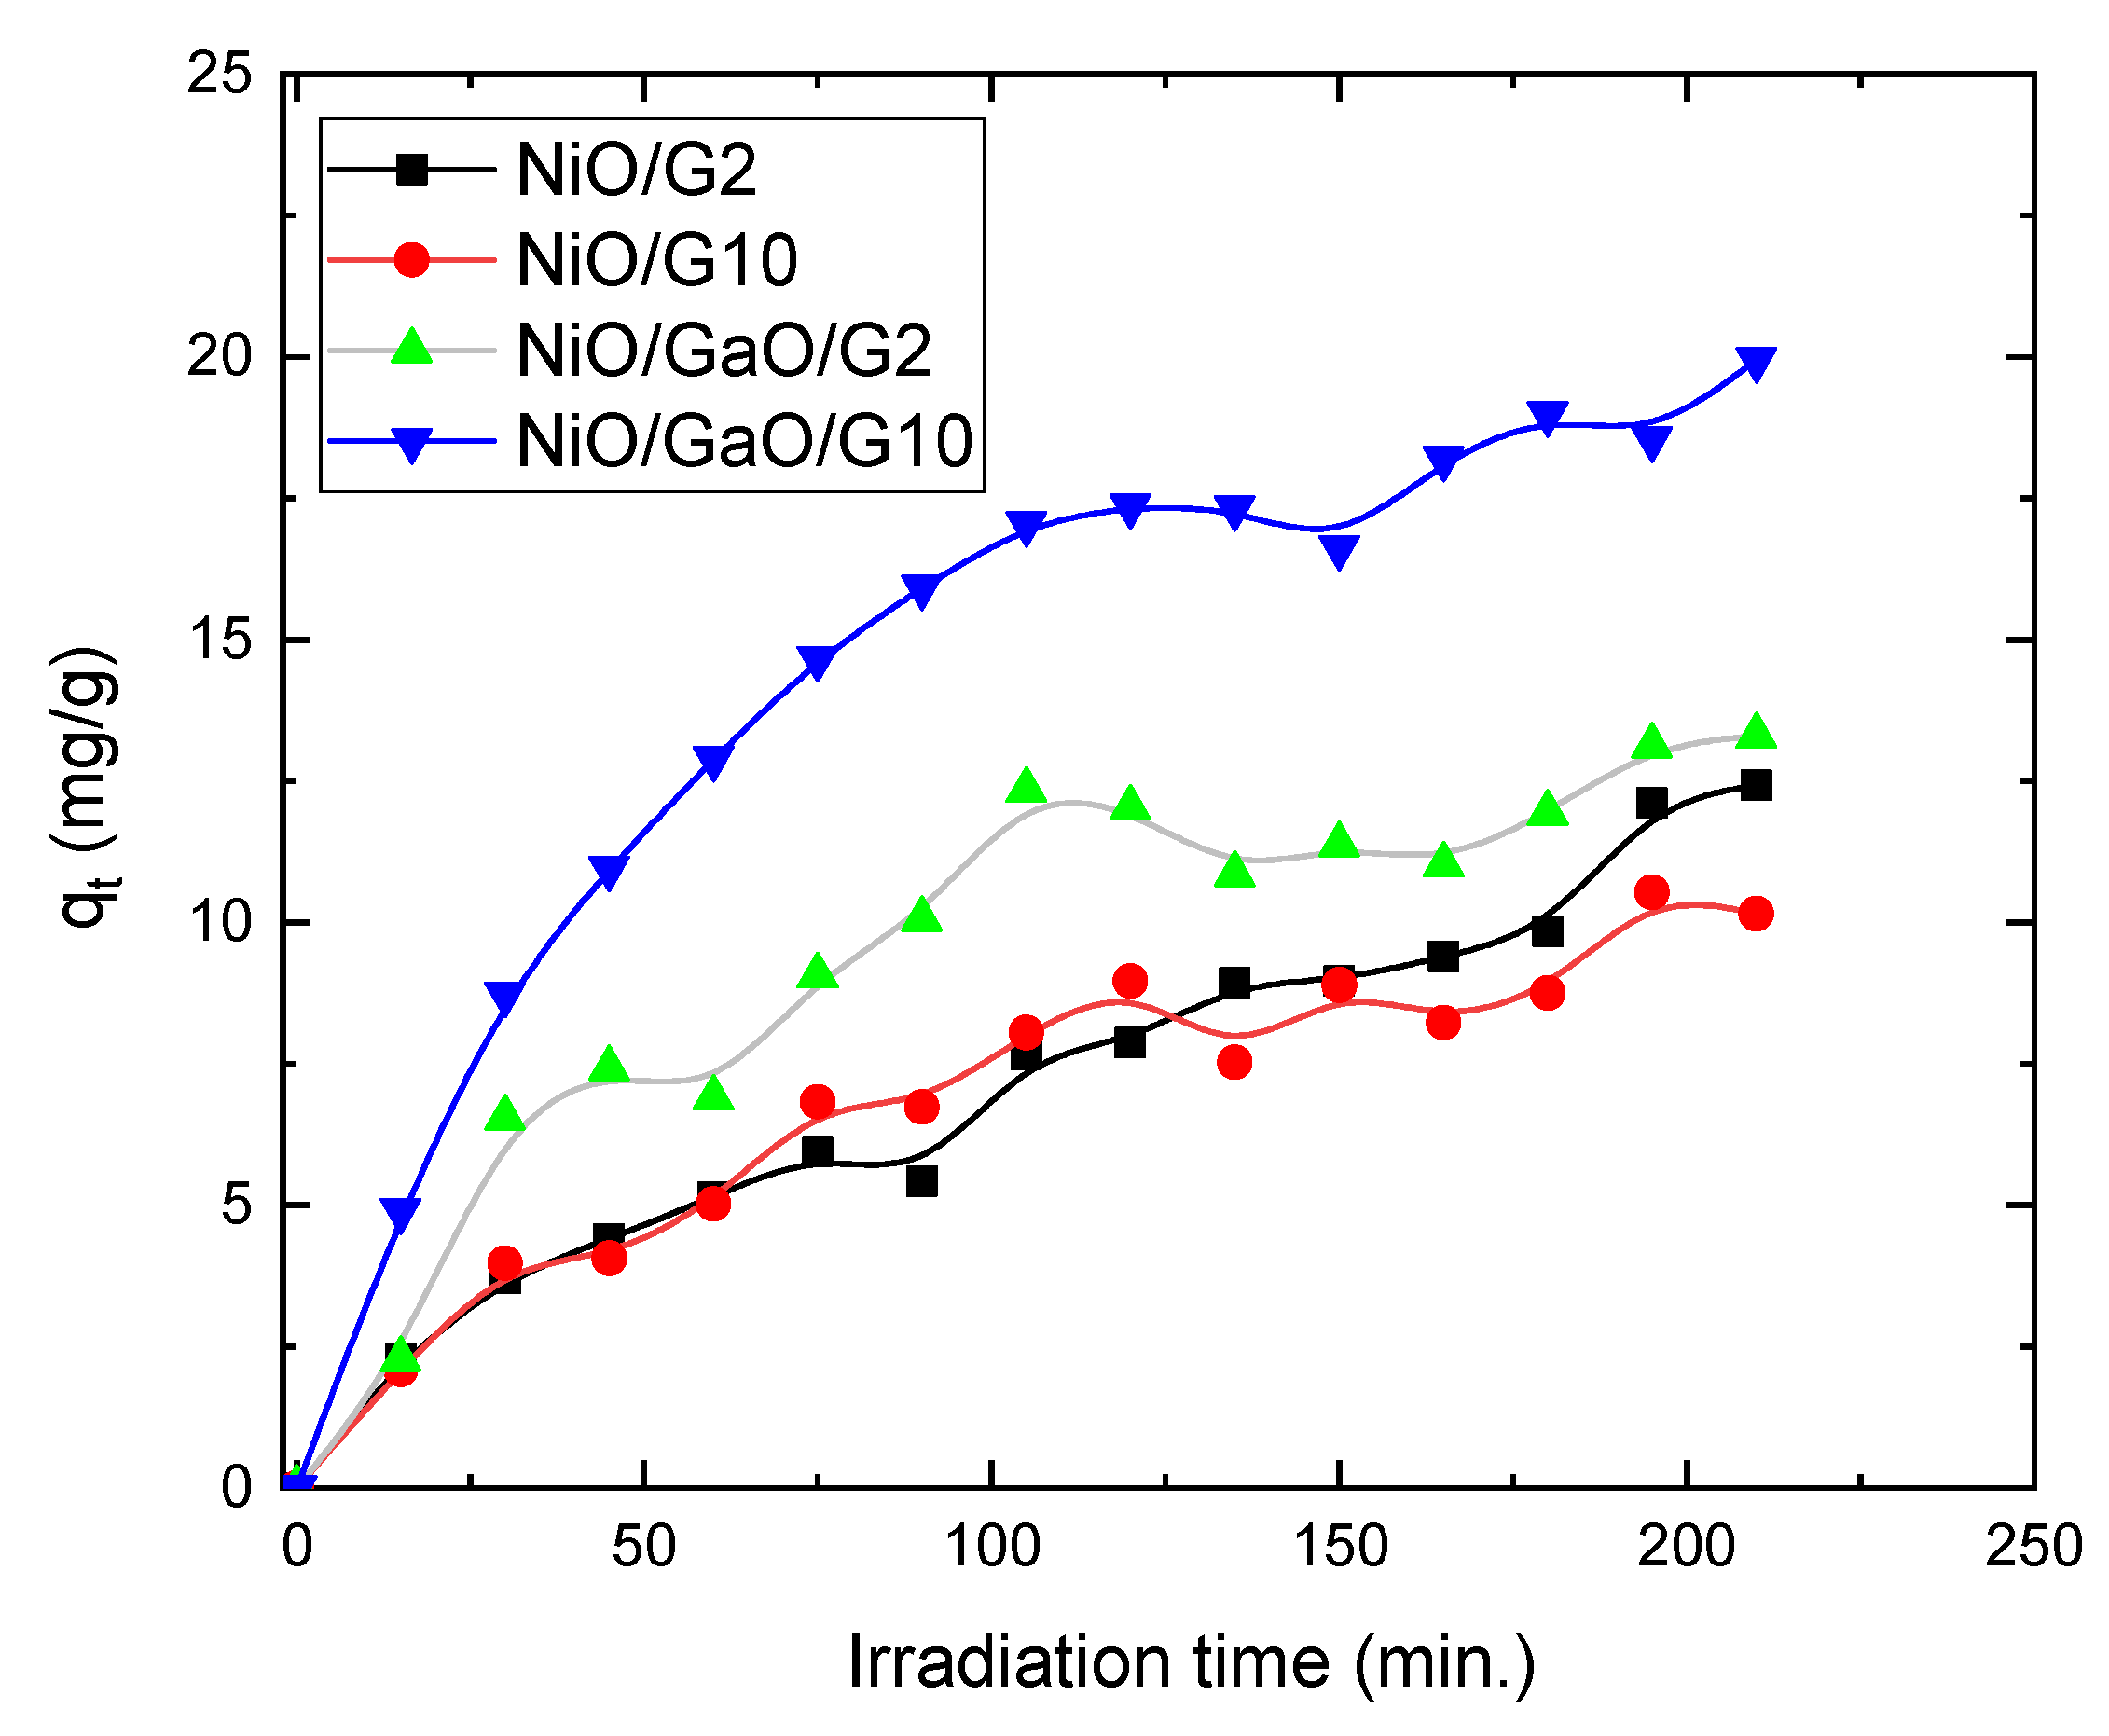
3.2. Photocatalytic Measurements

The photocatalysis properties were systematically investigated for Congo red at various irradiation times. The Congo red has an absorbance spectrum that shows two peaks at 490 and 970 nm. Various dye concentrations from 0.0 up to 30 mg/L were prepared to draw the calibration curve between the absorbance on the x-axis and dye concentration on the y-axis through the measurement of absorbance. It is well-known that the concentration of dye degradation is directly proportional to the optical absorbance values at a given wavelength. For this purpose, a primary experiment was done to find the correct and direct relationship between concentration and absorption of this dye. Figure 6 illustrated the relationship between the different concentrations of Congo red and the absorbance measured at that concentration for the main peak of 490 nm. It was found that the relationship between the concentration and the absorbance is linear with a straight line. The straight line passes through the origin point and its slope is 32 ± 0.19 mg/L and correlation factor R2 = 0.99. This calibration curve was recorded on the UV-vis spectrophotometer. Based on the calibration curve, the concentration of dye is given direct during the Uv-vis spectra measurement.
To confirm the photoreaction effect of Congo dye, the CR solution including the nanocomposite was kept in dark for a night before the measurement in illumination conditions. Based on the calibration curve in Figure 6 and the new measurement after every illumination interval, the new CR concentration was measured. This new concentration was used to calculate the photodegradation efficiency of CR over the nanocomposites. Figure 7 shows the degradation efficiency of 20 mg/L Congo red through 2.0 mg of the NiO/2G, NiO/10G, NiO/Ga2O2/2G, and NiO/Ga2O2/10G nanocomposite at various irradiation times. The efficiency was calculated by the following equation:
η % = C 0 C t C 0   ×   100
where C 0 is the Congo red initial concentration and C t   is the instant concentration at a specific irradiation time, t. The efficiency of graphene-doped NiO (NiO/G2 and NiO/G10) shows the lowest degradation efficiency of 25% over 210 min, which showed no difference with increasing the graphene content on the photocatalysis properties. The calculated efficiency was improved up to 40% by adding Ga2O2 nanoparticles to the first sample of NiO/G2. Much improvement in the degradation efficiency up to 60% was observed in the NiO/Ga2O2 composite upon the increase of graphene weight percentage of 10%. Figure 7b–f indicates the change in the watercolor, as an indicator of Congo red degradation, on the surface of NiO/2G, NiO/10G, NiO/Ga2O2/2G, and NiO/Ga2O2/10G nanocomposite after 210 min of UV exposure.
Consequently, the concentrations have been measured with different exposed UV light times. The linear relation of ln(C/C0) vs. the irradiation time, t, can be calculated using the following equation [43]:
ln ( C t C 0 ) = k K t + K C 0
k is the first-order reaction rate constant, and K is the degradation equilibrium constant at different UV light. The semi-logarithmic relation of the CR concentration as a function of the irradiation time results in a straight line using Equation (2), as it is shown in Figure 8 for CR dye. The degradation rate constant (k) and the degradation equilibrium constant (K) can be calculated from this relationship [43,44]. Both k and K constants were calculated and listed in Table 4. They were found to be dependent on the nanocomposites, where k decreased from 0.2616 down to 0.0905 and K varies from 0.007 up to 0.037 for NiO/G10 to NiO/Ga2O2/G10, as listed in Table 4.
From the above results, it seems that the amount of degraded CR on the nanocomposite surface is dependent on the nanocomposite type. Thus, the degraded dye capacity (qt in mg/g) upon exposure to the UV light can be instantaneously calculated [45]:
q t = ( C 0 C t ) m V
where m in g is the amount of nanocomposite used in the photocatalytic degradation, V in L is the irradiated solution volume. Figure 9 indicates the degradation dye capacity as a function of the radiation time for 20.0 mg/L of CR concentrations. The NiO/G2 sample showed the lowest reaction of dye on its surface and NiO/G10, as well. However, a slight improvement for NiO/Ga2O2/G2 was observed. The degraded capacity of dye was increased with increasing the irradiation time, and dramatic photoreaction occurred on the surface of NiO/Ga2O2/G10 nanocomposite.

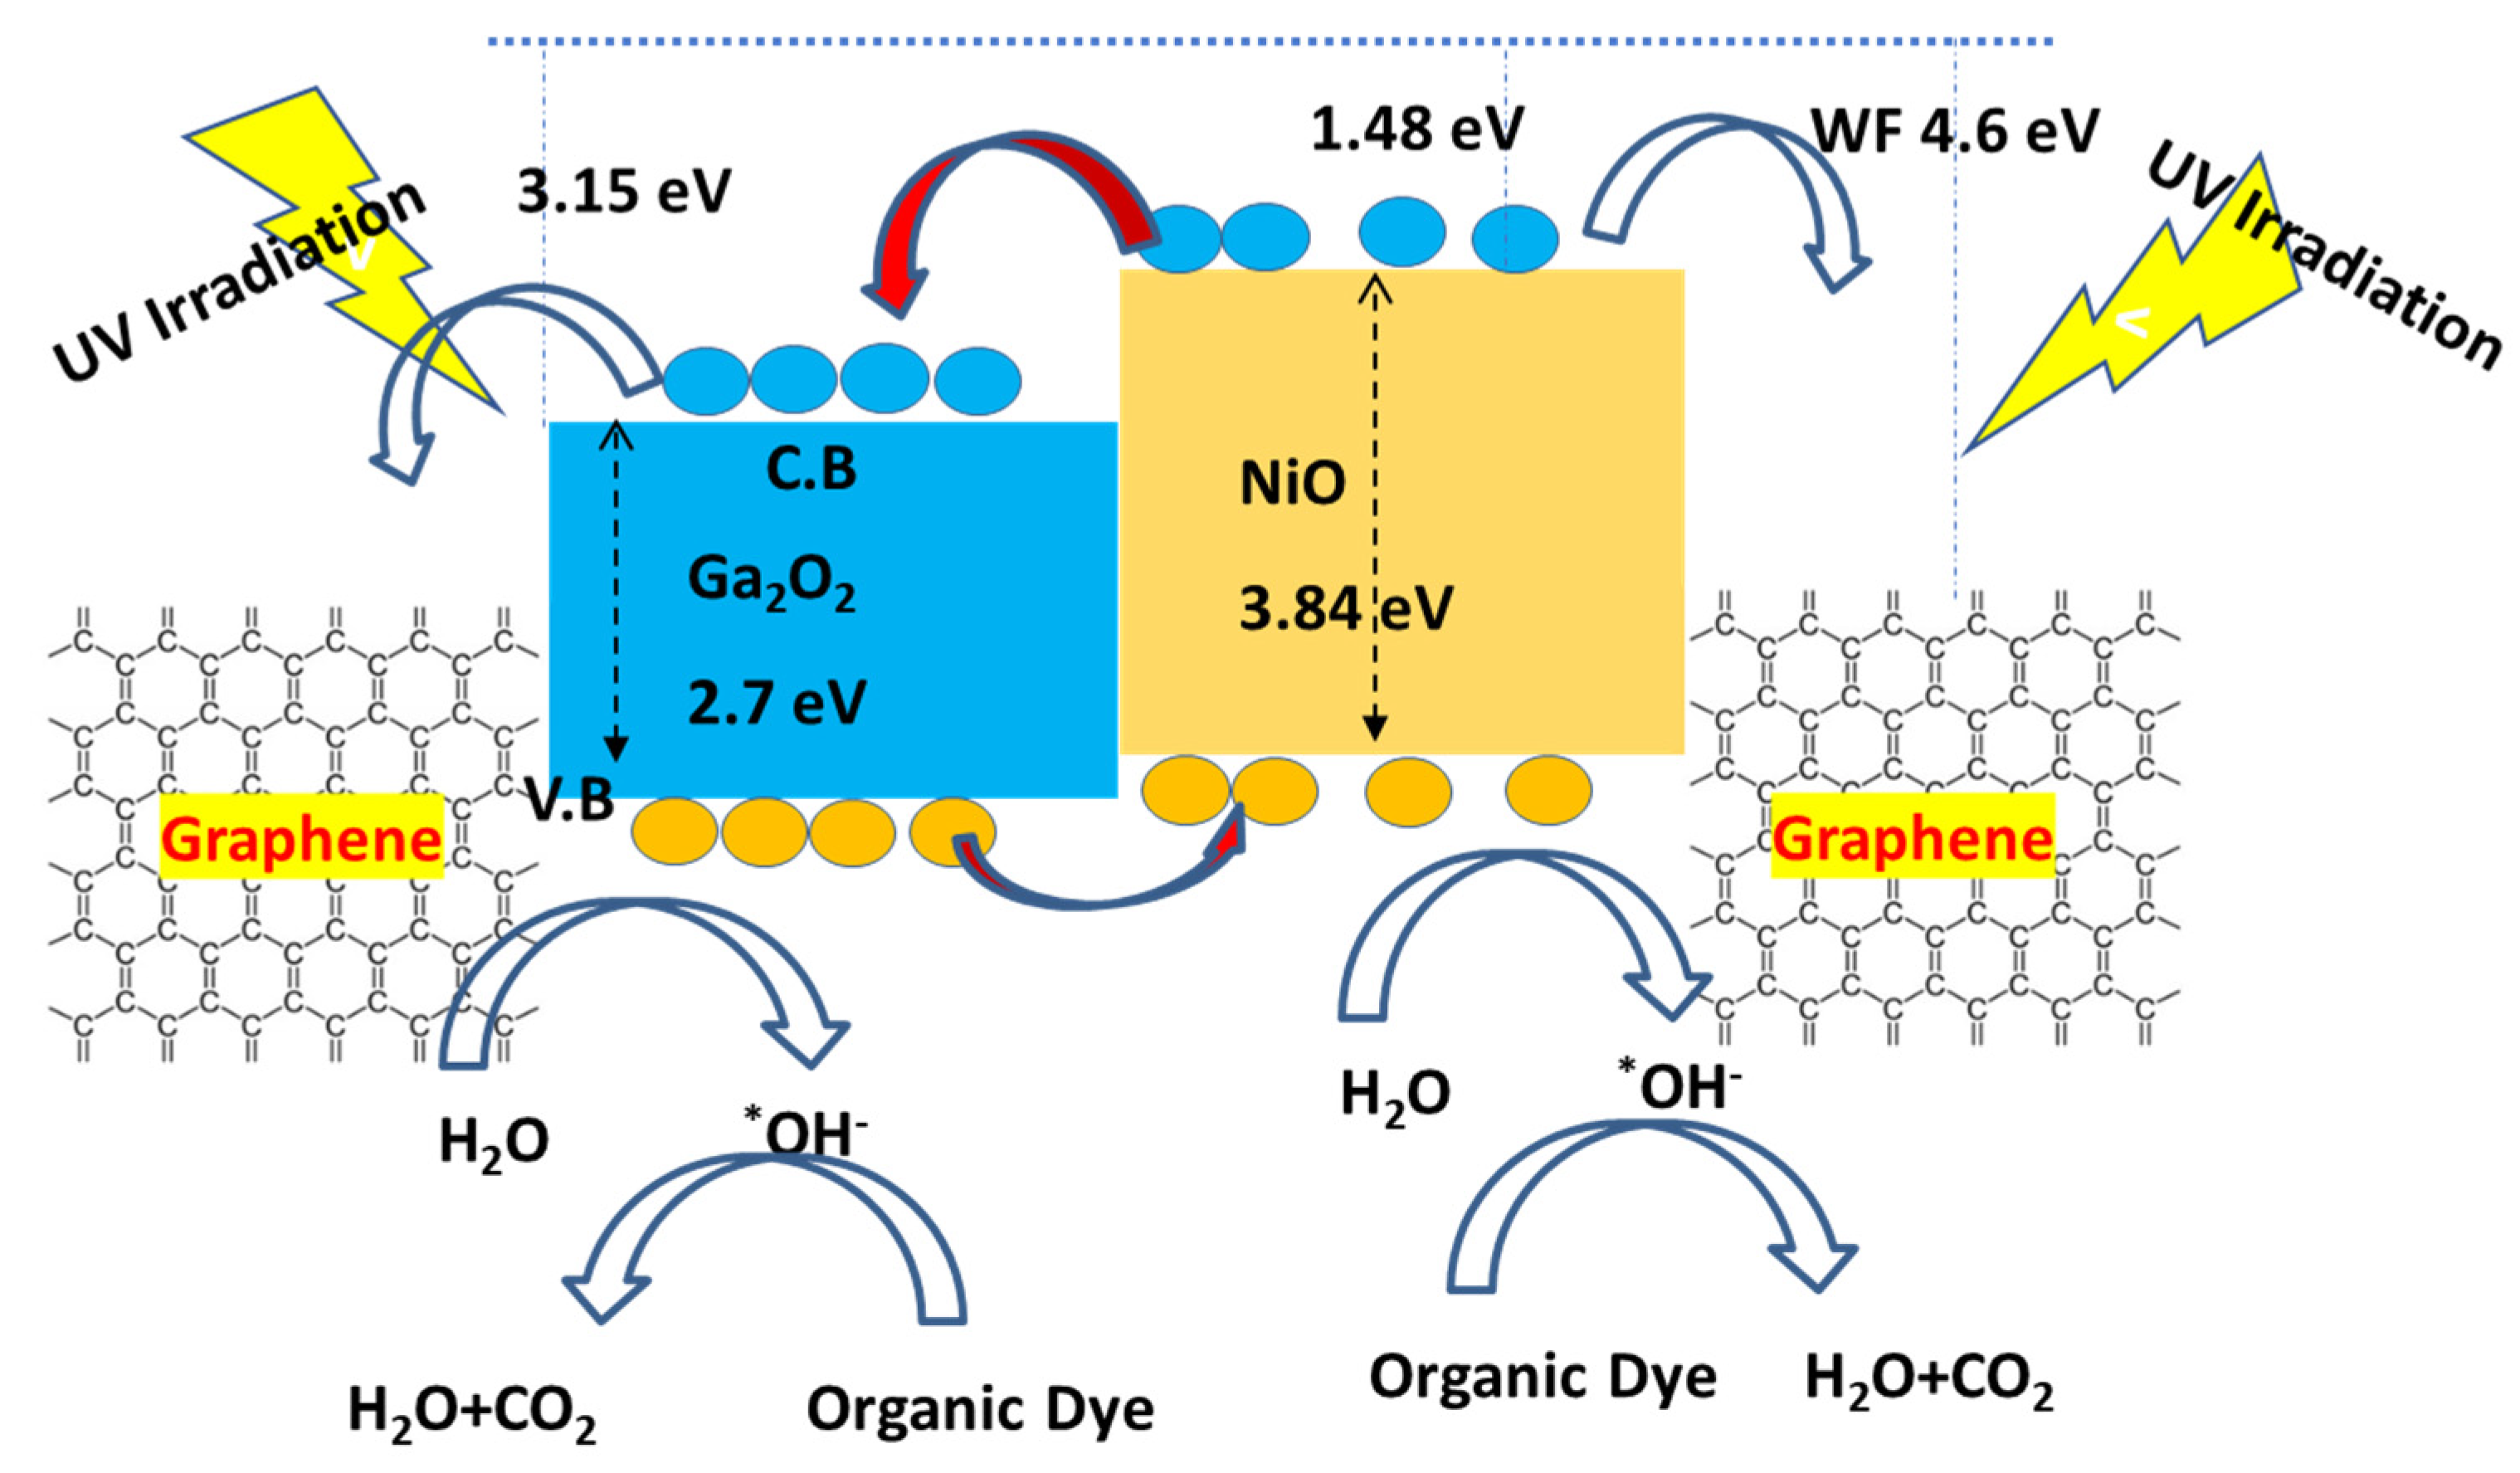
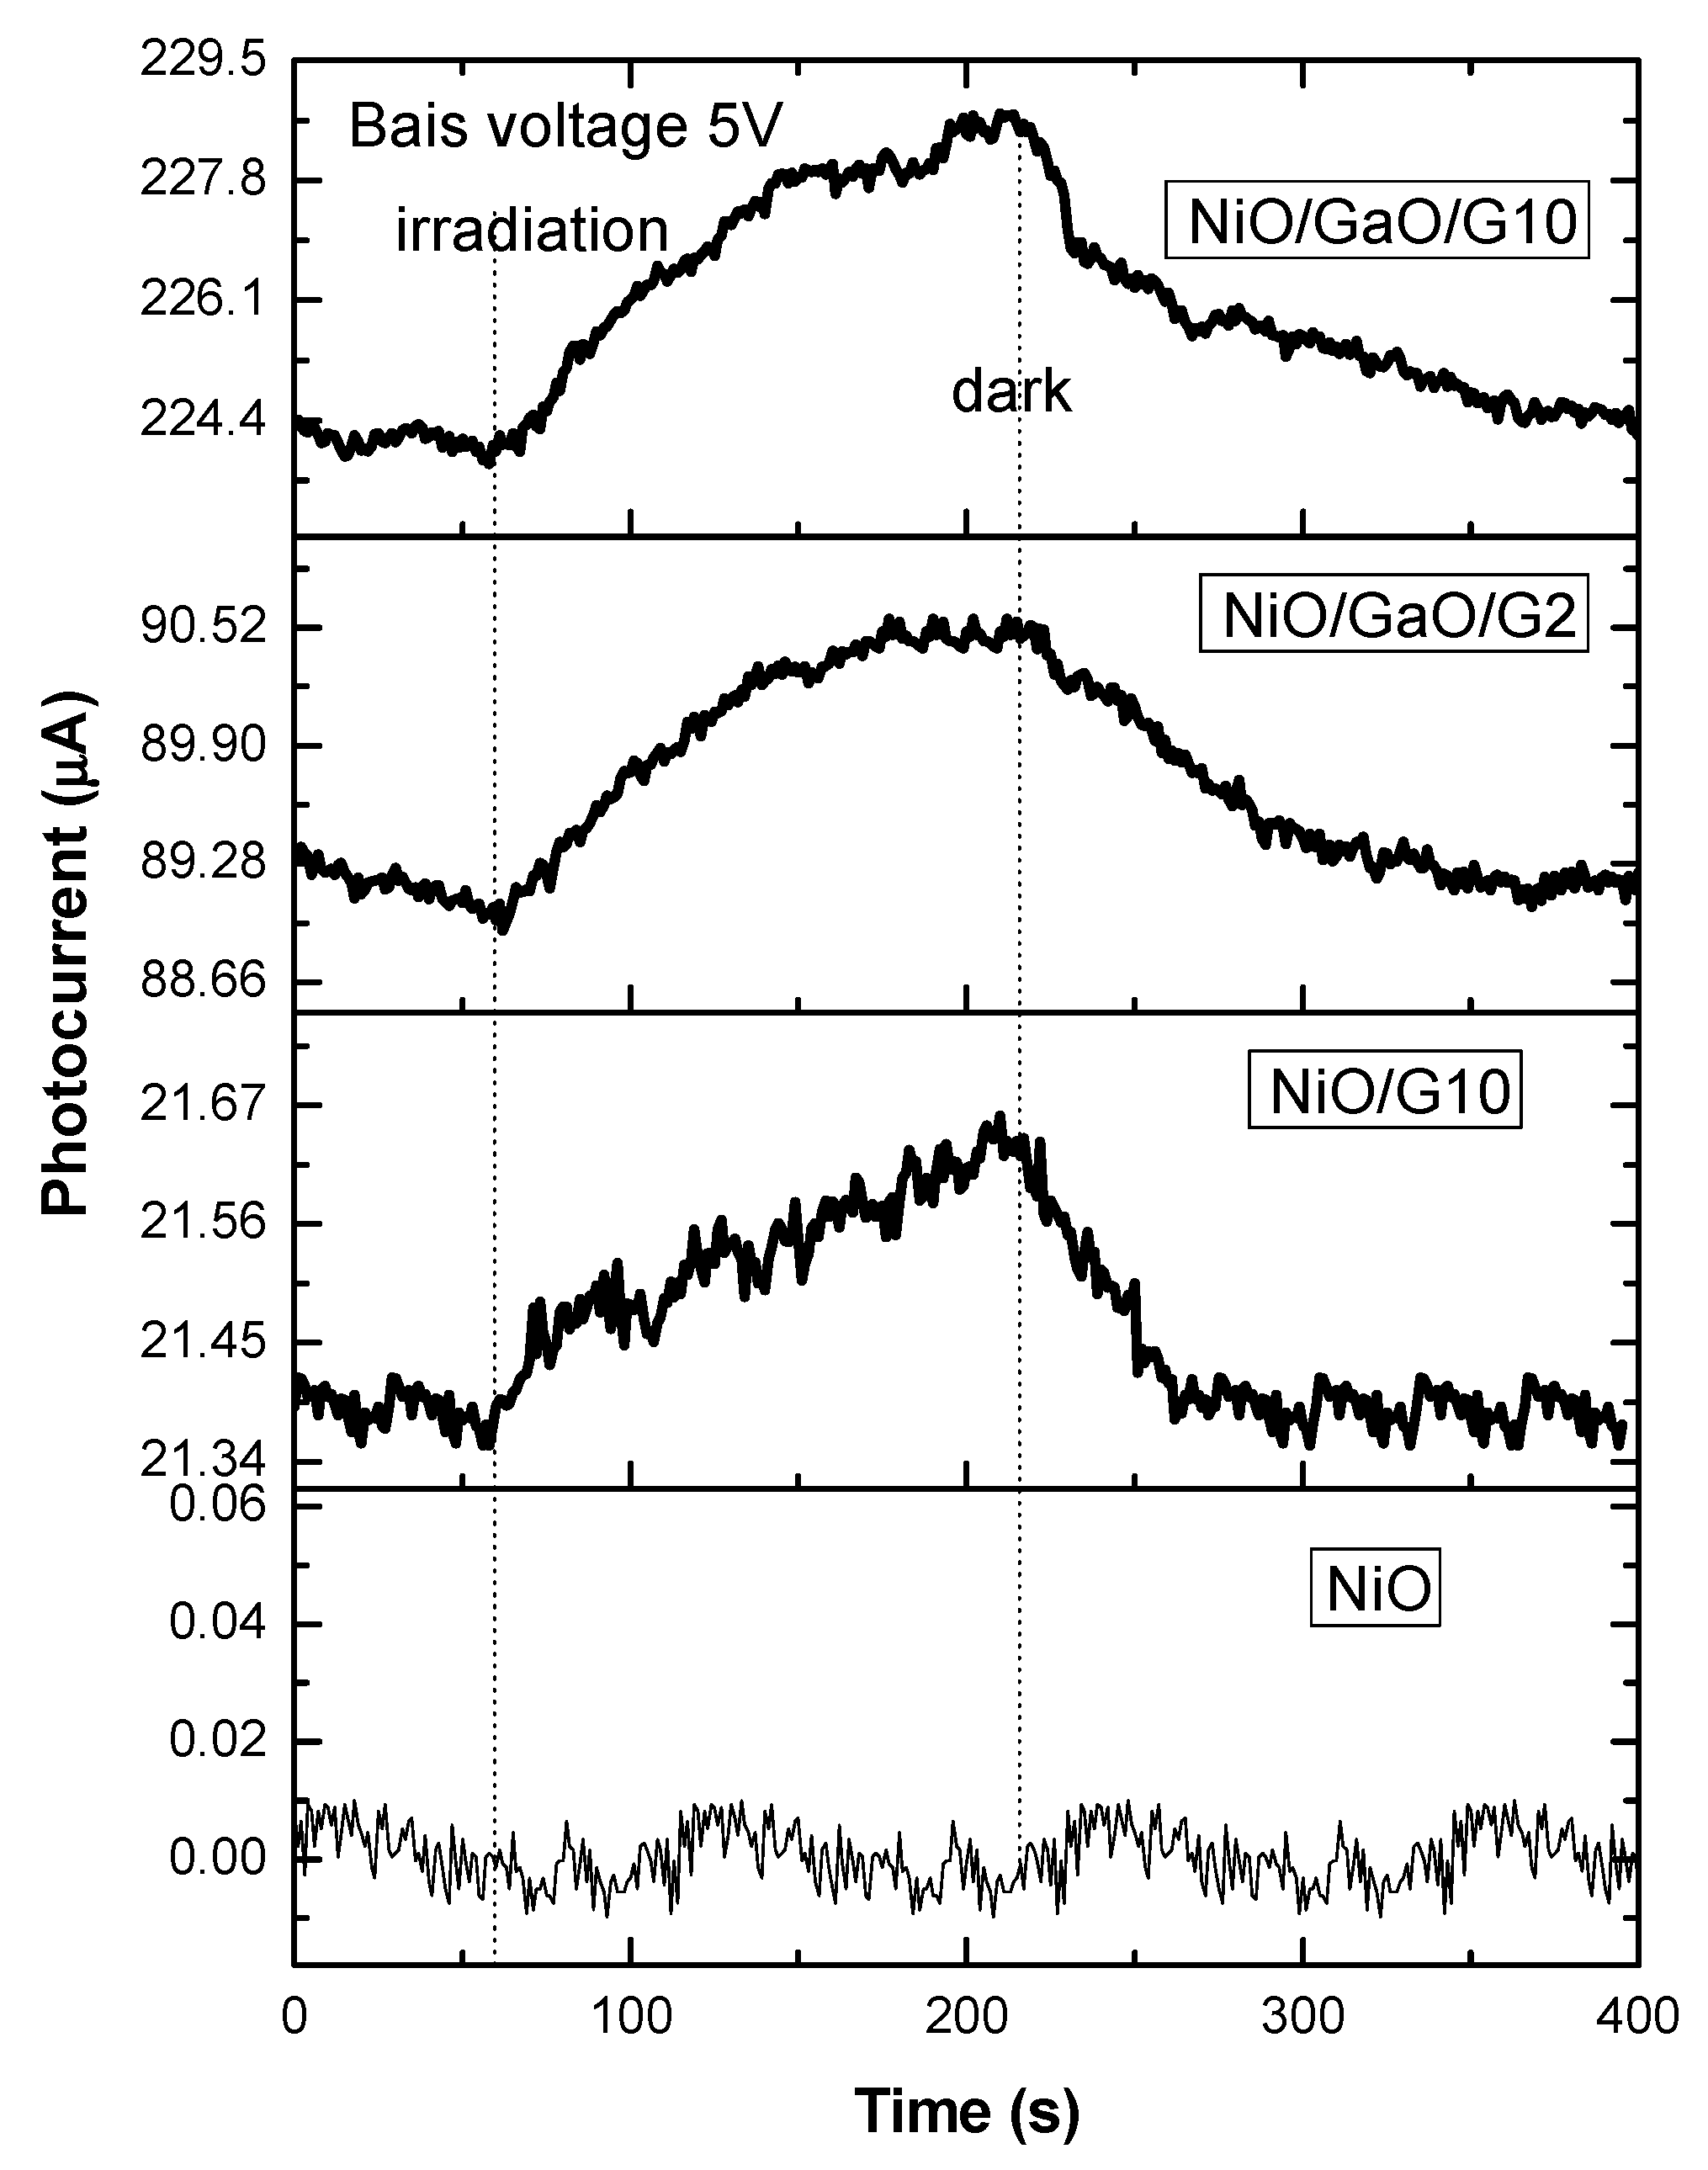
3.3. Photocatalytic Mechanism on Ternary Nanocomposite

We have proposed a typical catalytic mechanism for the photodegradation of Congo red on the surface of NiO/Ga2O2/G nanocomposite, as presented in Figure 10. The mechanism is based on the electronic band structure of the nanocomposite. In this mechanism, the dual effect of both p-NiO and n-Ga2O2 nanostructures connected with zero-band graphene is considered. The reported band gap of Ga2O2 and NiO are about 2.7 and 3.8 eV [46,47]. The electron affinities for p-NiO and n-Ga2O2 are −1.48 and −3.15 eV, respectively. When we draw the band structure of the composite, the conduction band of p-NiO was found to be higher than that of the Ga2O2 and the Fermi level of the graphene, as well. Thus, it is expected that when composited and exposed to UV light, the electrons of the NiO conduction band are captured by Ga2O2 and also by graphene. However, there is only one way of electron possible from Ga2O2 to graphene. The holes may transport in the opposite direction. Both mechanisms may affect the recombination rate of the excited pairs. It seems from the measured results in Figure 7, the photocatalytic activity of the NiO/Ga2O2 composite was improved with an additional amount of graphene, which was not achieved for NiO/G10 only. This confirms the dual effect of n- and p-type materials composite with graphene. The low photocatalytic of the pure NiO/Ga2O2 composite can be detected from the results observed for the same composite with low graphene content, confirming the high contribution of suite concentration of graphene in presence of the heterojunction.
For more experimental support to the proposed mechanism, the photocurrent of the samples with a simple method was measured, as shown in Figure 11. To obtain the Synergistic effect, the photocurrent of pure NiO was considered as well as NiO/G, and NiO/Ga2O2/G-based nanocomposites. The photocurrent results may support the mechanism and the photocatalytic properties of the present nanocomposites. The photocurrent was measured of nanocomposite film deposited on two interdigitated gold electrodes, which was biased by 5.0 V and irradiated by the UV source. It is observed that the sample prepared by NiO did not show a response or photocurrent to UV, and was slightly enhanced with graphene content under UV irradiation. It is observed that the photocurrent of the pure NiO is negligible. It may be due to the fast recombination of pair charges, and the high resistivity is due to the inter-grain boundaries. However, an improvement in the photocurrent signal was observed for NiO/Ga2O2/G2 heterojunction and much improvement was recorded with increasing the graphene content up to 10%. This improvement in the extracted charge under voltage bais upon exposure to UV irradiation can be described as the slow recombination due to graphene’s existence with NiO. This charge extraction was improved upon adding Ga2O2 to NiO due to the electric field of the heterojunction created at the contact. Also, it is observed that the recovery time for NiO/Ga2O2/G-based nanocomposites is longer than that observed for NiO/G-based nanocomposites. These results confirm the electron transfer mechanism proposed in Figure 10.
Based on the above band structure, we can continue to describe the photocatalytic degradation of dye on the surface of the nanocomposite. As it is known that the phenomena of photocatalytic reaction are well defined in previous reports [48,49]. The photodegradation of the dye in solution is initiated by the optical excitation of the wide band semiconductor, followed by the formation of an electron-hole pair on the surface of the catalyst, as in Equation (3).
composite + h ν composit   ( e + h + )
The high oxidizing potential of the hole in the catalyst allows direct oxidation of the dye to a reactive intermediate catalyst, as in Equation (4).
h + + dye dye . + oxidation   of   the   dye
Another reactive intermediate responsible for photolysis is the hydroxyl radical (OH·). It is formed either by the decomposition of water by the hole or by the reaction of the hole with (OH), as in Equations (5) and (6), respectively.
h + + H 2 O H + + · OH
h + + OH · OH
The electrons in the conduction band on the surface of the catalyst can reduce the molecular oxygen to the peroxide anion. It is also responsible to produce hydroxyl radicals.
e + O 2 · O 2
· O 2 + dye dye O O ·
· OH + dye   Photodegradation   of   the   dye
Hydroxyl radical species have been indicated as the primary reason for organic matter mineralization, as in Equation (9). The hydroxyl radical is a high oxidizer with an oxidation potential of 2.8 eV, and a non-selective oxidizer, resulting in partial or complete mineralization of many organic compounds [49]. Experimental results indicated that the photodegradation of Congo red on NiO/Ga2O2/G10 is faster than the photodegradation on the others, which is due to the low recombination of the exciting e-h pair. We expect that the graphene surface may receive the conduction electrons traveling from the high conduction band of NiO and as well Ga2O2. Also, the presence of graphene supports the effect of heterojunction between p-NiO and n-Ga2O2. This results in capturing the electron not recombining quickly back to the valence band of the oxide.

4. Conclusions

In summary, the phase of NiO-Ga2O2-graphene heterostructure nanocomposite was prepared to investigate the co-effect of oxide-oxide and oxide-graphene heterojunction on the photocatalytic degradation of Congo red dye. The defective graphene was fabricated by a CO2 laser and was embedded into NiO and NiO-Ga2O2. HRTEM showed that very fine crystallites for both NiO and Ga2O2 with a size of ~7–10 nm were synthesized. The effect of graphene content was investigated at 2% and 10% wt with NiO and the heterojunction of NiO-Ga2O2. The photocurrent showed that the pure NiO is negligible which may be due to the fast recombination of pair charges, and the high resistivity is due to the inter-grain boundaries. Moreover, there is an improvement in the photocurrent signal for NiO/Ga2O2/G2 heterojunction. The results of photocatalysis measurements indicated an improvement occurred upon the heterojunction of Ga2O2 and NiO with suitable graphene concentration. The results expressed that the ternary phase of p-NiO/n-Ga2O2/graphene is promising in the photocatalytic application toward the photodecomposition of Congo red.

Author Contributions

Conceptualization, N.M.S. and M.R.; methodology, M.R. and C.A.; software, N.M.S.; validation, N.M.S. and M.R.; formal analysis, N.M.S. and C.A.; investigation, M.R. and C.A.; resources, M.R.; data curation, N.M.S. and M.R.; writing—original draft preparation, N.M.S. and M.R.; writing—review and editing, N.M.S. and M.R.; visualization, N.M.S. and M.R.; supervision, N.M.S.; project administration, N.M.S.; funding acquisition, N.M.S., All authors have read and agreed to the published version of the manuscript.

Funding

This work was supported by [Al Bilad Bank Scholarly Chair for Food Security in Saudi Arabia], the Deanship of Scientific Research, Vice Presidency for Graduate Studies and Scientific Research, King Faisal University, Saudi Arabia [Grant No. CHAIR88].

Institutional Review Board Statement

Not applicable.

Informed Consent Statement

Not applicable.

Data Availability Statement

Not applicable.

Acknowledgments

The authors thank and acknowledge the Dean of the Deanship of Scientific Research for the development of DSR and technical support.

Conflicts of Interest

The authors declare no conflict of interest.

References

  1. Raza, A.; Altaf, S.; Ali, S.; Ikram, M.; Gao, L. Recent advances in carbonaceous sustainable nanomaterials for wastewater treatments. Sustain. Mater. Technol. 2022, 32, e00406. [Google Scholar] [CrossRef]
  2. Rizzo, L.; Selcuk, H.; Nikolaou, A.D.; Pagano, S.M.; Belgiorno, V. A comparative evaluation of ozonation and heterogeneous photocatalytic oxidation processes for reuse of secondary treated urban wastewater. Desalin. Water Treat 2014, 52, 1414–1421. [Google Scholar] [CrossRef]
  3. Jamal, N.; Radhakrishnan, A.; Raghavan, R.; Bhaskaran, B.; Access, O. Efficient photocatalytic degradation of organic dye from aqueous solutions over zinc oxide incorporated nanocellulose under visible light irradiation. Main Group Met. Chem. 2020, 43, 84–91. [Google Scholar] [CrossRef]
  4. Li, Z.; Chen, X.; Wang, M.; Zhang, X.; Liao, L.; Fang, T.; Li, B. Photocatalytic degradation of Congo red by using the Cu2O/α-Fe2O3. Compos. Catal. 2021, 215, 222–231. [Google Scholar] [CrossRef]
  5. Wang, Y.; Zhang, R.; Li, J.; Li, L.; Lin, S. First-principles study on transition metal-doped anatase TiO2. Nanoscale Res. Lett. 2014, 9, 46. [Google Scholar] [CrossRef] [PubMed] [Green Version]
  6. Darwish, A.A.A.; Rashad, M.; L-Aoh, H.A.A. Methyl orange adsorption comparison on nanoparticles: Isotherm, kinetics, and thermodynamic studies. Dye. Pigment. 2019, 160, 563–571. [Google Scholar] [CrossRef]
  7. El-Deen, A.G.; El-Shafei, M.H.; Hessein, A.; Hassanin, A.H.; Shaalan, N.M.; El-Moneim, A.A. High-performance asymmetric supercapacitor based hierarchical NiCo2O4@ carbon nanofibers//Activated multichannel carbon nanofibers. Nanotechnology 2020, 31, 365404. [Google Scholar] [CrossRef]
  8. Li, Y.; Xie, W.; Hu, X.; Shen, G.; Zhou, X.; Xiang, Y.; Zhao, X.; Fang, P. Comparison of dye photodegradation and its coupling with light-to-electricity conversion over TiO2 and ZnO. Langmuir 2010, 26, 591–597. [Google Scholar] [CrossRef]
  9. Shaalan, N.M.; Hamad, D.; Aljaafari, A.; Abdel-Latief, A.Y.; Abdel-Rahim, M.A. Preparation and Characterization of Developed CuxSn1−xO2 Nanocomposite and Its Promising Methane Gas Sensing Properties. Sensors 2019, 19, 2257. [Google Scholar] [CrossRef] [Green Version]
  10. De Jongh, P.E.; Meulenkamp, E.A.; Vanmaekelbergh, D.; Kelly, J.J. Charge carrier dynamics in illuminated, particulate ZnO electrodes. J. Phys. Chem. B 2000, 104, 7686–7693. [Google Scholar] [CrossRef]
  11. Cui, Y.; Lieber, C.M. Functional nanoscale electronic devices assembled using silicon nanowire building blocks. Science 2001, 291, 851–853. [Google Scholar] [CrossRef] [PubMed] [Green Version]
  12. Pal, S.; Mondal, S.; Maity, J.; Mukherjee, R. Synthesis and characterization of ZnO nanoparticles using Moringa oleifera leaf extract: Investigation of photocatalytic and antibacterial activity. Int. J. Nanosci. Nanotechnol. 2018, 14, 111–119. [Google Scholar]
  13. Kotan, G.; Kardaş, F.; Yokuş, Ö.A.; Akyıldırım, O.; Saral, H.; Eren, T.; Yola, M.L.; Atar, N. A novel determination of curcumin via Ru@ Au nanoparticle decorated nitrogen and sulfur-functionalized reduced graphene oxide nanomaterials. Anal. Methods 2016, 8, 401–408. [Google Scholar] [CrossRef]
  14. Yola, M.L.; Atar, N.; Eren, T.; Karimi-Maleh, H.; Wang, S. Correction: Sensitive and selective determination of aqueous triclosan based on gold nanoparticles on polyoxometalate/reduced graphene oxide nanohybrid. RSC Adv. 2015, 5, 72590–72591. [Google Scholar] [CrossRef] [Green Version]
  15. Atar, N.; Eren, T.; Yola, M.L.; Gerengi, H.; Wang, S. Fe@ Ag nanoparticles decorated reduced graphene oxide as ultrahigh capacity anode material for lithium-ion battery. Ionics 2015, 21, 3185–3192. [Google Scholar] [CrossRef]
  16. Atar, N.; Eren, T.; Yola, M.L. Ultrahigh capacity anode material for lithium ion battery based on rod gold nanoparticles decorated reduced graphene oxide. Thin Solid Film. 2015, 590, 156–162. [Google Scholar] [CrossRef]
  17. Ramakrishnan, R.; Kalaivani, S.; Joice, J.A.I.; Sivakumar, T. Photocatalytic activity of multielement doped TiO2 in the degradation of congo red. Appl. Surf. Sci. 2012, 258, 2515–2521. [Google Scholar] [CrossRef]
  18. Raza, A.; Zhang, X.; Ali, S.; Cao, C.; Rafi, A.A.; Li, G. Photoelectrochemical Energy Conversion over 2D Materials. Photochem 2022, 2, 272–298. [Google Scholar] [CrossRef]
  19. Rong, J.; Zhang, T.; Qiu, F.; Rong, X.; Zhu, X.; Zhang, X. Preparation of hierarchical micro/nanostructured Bi2S3-WO3 composites for enhanced photocatalytic performance. J. Alloy Compd. 2016, 685, 812–819. [Google Scholar] [CrossRef]
  20. Zhang, M.; Xu, Y.; Gong, Z.; Tao, J.; Sun, Z.; Lv, J.; Chen, X.; Jiang, X.; He, G.; Wang, P.; et al. Enhanced charge collection and photocatalysis performance of CdS and PbS nanoclusters co-sensitized TiO2 porous film. J. Alloy Compd. 2015, 649, 190–195. [Google Scholar] [CrossRef]
  21. Cui, W.; An, W.; Liu, L.; Hu, J.; Liang, Y. Novel PbS quantum dots sensitized flower-like BiOBr with enhanced photocatalytic properties under visible light. Mater. Lett. 2014, 132, 251–254. [Google Scholar] [CrossRef]
  22. Yuan, Y.; Guo, R.T.; Hong, L.F.; Ji, X.Y.; Lin, Z.D.; Li, Z.S.; Pan, W.G. A review of metal oxide-based Z-scheme heterojunction photocatalysts: Actualities and developments. Mater. Today Energy 2021, 21, 100829. [Google Scholar] [CrossRef]
  23. Li, F.; Cheng, L.; Xiang, J.F. Steering the behavior of photogenerated carriers in semiconductor photocatalysts: A new insight and perspective. J. Mater. Chem. A 2021, 9, 23765. [Google Scholar] [CrossRef]
  24. Cheng, L.; Li, B.; Yin, H.; Fan, J.; Xiang, Q. Cu clusters immobilized on Cd-defective cadmium sulfide nano-rods towards photocatalytic CO2 reduction. J. Mater. Sci. Technol. 2022, 118, 54. [Google Scholar] [CrossRef]
  25. Shaalan, N.M.; Rashad, M.; Abdel-Rahim, M.A. CuO nanoparticles synthesized by microwave-assisted method for methane sensing. Opt. Quantum Electron. 2016, 48, 2–12. [Google Scholar] [CrossRef]
  26. Rashad, M.; Al-Ghamdi, S.A.; Alzahrani, A.O.M.; Al-Tabaa, K.; Al-Osemi, S.; Al-Atawi, O.; Al-Anzi, N.; Issa, S.A.M.; Abd-Elnaiem, A.M. Zinc oxide nanoparticles for adsorption of potassium permanganate from wastewater using shaking method. Desalin. Water Treat. 2021, 229, 227–234. [Google Scholar] [CrossRef]
  27. Rashad, M.; L-Aoh, H.A.A. Promising adsorption studies of bromophenol blue using copper oxide nanoparticles. Desalin. Water Treat. 2019, 139, 360–368. [Google Scholar] [CrossRef]
  28. Ponnusamy, P.M.; Agilan, S.; Muthukumarasamy, N.; Velauthapillai, D. Effect of Chromium and Cobalt Addition on Structural, Optical and Magnetic Properties of NiO Nanoparticles. Z. Fur. Phys. Chemie 2016, 230, 1185–1197. [Google Scholar] [CrossRef]
  29. Matassa, R.; Orlanducci, S.; Tamburri, E.; Guglielmotti, V.; Sordi, D.; Terranova, M.L.; Passeri, D.; Rossi, M. Characterization of carbon structures produced by graphene self-assembly. J. Appl. Crystallogr. 2014, 47, 222–227. [Google Scholar] [CrossRef]
  30. Azammi, A.M.N.; Ilyas, R.A.; Sapuan, S.M.; Ibrahim, R.; Atikah, M.S.N.; Asrofi, M.; Atiqah, A. 3—Characterization studies of biopolymeric matrix and cellulose fibres based composites related to functionalized fibre-matrix interface. In Woodhead Publishing Series in Composites Science and Engineering; Goh, K.L., Aswathi, M.K., De Silva, R.T., Thomas, S., Eds.; Woodhead Publishing: Cambridge, UK, 2020; pp. 29–93. [Google Scholar] [CrossRef]
  31. Kaburagi, Y.; Yoshida, A.; Hishiyama, Y. Chapter 7—Raman Spectroscopy. In Materials Science and Engineering of Carbon; Inagaki, M., Kang, F., Eds.; Butterworth-Heinemann: Oxford, UK, 2016; pp. 125–152. [Google Scholar] [CrossRef]
  32. Lucchese, M.M.; Stavale, F.; Ferreira, E.H.M.; Vilani, C.; Moutinho, M.V.O.; Capaz, R.B.; Achete, C.A.; Jorio, A. Quantifying ion-induced defects and Raman relaxation length in graphene. Carbon N. Y. 2010, 48, 1592–1597. [Google Scholar] [CrossRef]
  33. Ferrari, A.C.; Robertson, J. Interpretation of Raman spectra of disordered and amorphous carbon. Phys. Rev. B 2000, 61, 14095–14107. [Google Scholar] [CrossRef] [Green Version]
  34. Ferrari, A.C. Raman spectroscopy of graphene and graphite: Disorder, electron–phonon coupling, doping and nonadiabatic effects. Solid State Commun. 2007, 143, 47–57. [Google Scholar] [CrossRef]
  35. Jorio, A.; Saito, R. Raman spectroscopy for carbon nanotube applications. J. Appl. Phys. 2021, 129, 21102. [Google Scholar] [CrossRef]
  36. Ferrari, A.C.; Meyer, J.C.; Scardaci, V.; Casiraghi, C.; Lazzeri, M.; Mauri, F.; Piscanec, S.; Jiang, D.; Novoselov, K.S.; Roth, S.; et al. Raman Spectrum of Graphene and Graphene Layers. Phys. Rev. Lett. 2006, 97, 187401. [Google Scholar] [CrossRef] [PubMed] [Green Version]
  37. Shaalan, N.M.; Ahmed, F.; Kumar, S.; Melaibari, A.; Hasan, P.M.Z.; Aljaafari, A. Monitoring Food Spoilage Based on a Defect-Induced Multiwall Carbon Nanotube Sensor at Room Temperature: Preventing Food Waste. ACS Omega 2020, 5, 30531–30537. [Google Scholar] [CrossRef] [PubMed]
  38. Mironova-Ulmane, N.; Kuzmin, A.; Sildos, I.; Pärs, M. Polarisation dependent Raman study of single-crystal nickel oxide. Cent. Eur. J. Phys. 2011, 9, 1096–1099. [Google Scholar] [CrossRef]
  39. Mironova-Ulmane, N.; Kuzmin, A.; Steins, I.; Grabis, J.; Sildos, I.; Pärs, M. Raman scattering in nanosized nickel oxide NiO. J. Phys. Conf. Ser. 2007, 93, 012039. [Google Scholar] [CrossRef]
  40. Rao, R.; Rao, A.M.; Xu, B.; Dong, J.; Sharma, S.; Sunkara, M.K. Blueshifted Raman scattering and its correlation with the [110] growth direction in gallium oxide nanowires. J. Appl. Phys. 2005, 98, 094312. [Google Scholar] [CrossRef]
  41. Dohy, D.; Lucazeau, G.; Revcolevschi, A. Raman spectra and valence force field of single-crystalline β Ga2O2. J. Solid State Chem. 1982, 45, 180–192. [Google Scholar] [CrossRef]
  42. Onuma, T.; Fujioka, S.; Yamaguchi, T.; Itoh, Y.; Higashiwaki, M.; Sasaki, K.; Masui, T.; Honda, T. Polarized Raman spectra in β-Ga2O2 single crystals. J. Cryst. Growth 2014, 401, 330–333. [Google Scholar] [CrossRef]
  43. Rashad, M.; Shaalan, N.M.; Abd-Elnaiem, A.M. Degradation enhancement of methylene blue on ZnO nanocombs synthesized by thermal evaporation technique. Desalin. Water Treat. 2016, 57, 26267–26273. [Google Scholar] [CrossRef]
  44. Yan, H.; Hou, J.; Fu, Z.; Yang, B.; Yang, P.; Liu, K.; Wen, M.; Chen, Y.; Fu, S.; Li, F. Growth and photocatalytic properties of one-dimensional ZnO nanostructures prepared by thermal evaporation. Mater. Res. Bull. 2009, 44, 1954–1958. [Google Scholar] [CrossRef]
  45. Rashad, M. Performance efficiency and kinetic studies of water purification using ZnO and MgO nanoparticles for potassium permanganate. Opt. Quantum Electron. 2019, 51, 291. [Google Scholar] [CrossRef]
  46. Shao, L.; Duan, X.; Li, Y.; Zeng, F.; Ye, H.; Ding, P. Two-dimensional Ga2O2 monolayer with tunable band gap and high hole mobility. Phys. Chem. Chem. Phys. 2021, 23, 666–673. [Google Scholar] [CrossRef] [PubMed]
  47. Shaalan, N.M.; Hanafy, T.A.; Rashad, M. Dual optical properties of NiO-doped PVA nanocomposite films. Opt. Mater. 2021, 119, 111325. [Google Scholar] [CrossRef]
  48. Asiri, A.M.; Al-Amoudi, M.S.; Al-Talhi, T.A.; Al-Talhi, A.D. Photodegradation of Rhodamine 6G and phenol red by nanosized TiO2 under solar irradiation. J. Saudi Chem. Soc. 2011, 15, 121–128. [Google Scholar] [CrossRef] [Green Version]
  49. Daneshvar, N.; Salari, D.; Khataee, A.R. Photocatalytic degradation of azo dye acid red 14 in water on ZnO as an alternative catalyst to TiO2. J. Photochem. Photobiol. A Chem. 2004, 162, 317–322. [Google Scholar] [CrossRef]
Figure 1. Steps for preparing laser-induced graphene powder by using a CO2 laser machine and preparing the oxide-graphene nanocomposites.
Separations 09 00201 g001
Figure 2. (a,d) TEM images; (b,e) fringe patterns; and (c,f) SAED patterns for NiO/G10 and NiO/Ga2O2/G10, respectively.
Separations 09 00201 g002
Figure 3. EDX-mapping for the distribution of Ni, Ga, O, and C elements for (a) NiO/G10, and (b) NiO/Ga2O2/G10 nanocomposites.
Separations 09 00201 g003
Figure 4. EDX spectra for the distribution of Ni, Ga, O, and C elements for (a) NiO/G10, and (b) NiO/Ga2O2/G10 nanocomposites.
Separations 09 00201 g004
Figure 5. Raman spectra as-prepared graphene, NiO/G10, NiO/Ga2O2/G2, and NiO/Ga2O2/G10 nanocomposites.
Separations 09 00201 g005
Figure 6. Concentration versus absorbance calibration curve for CR dye in water solution.
Separations 09 00201 g006
Figure 7. Photocatalytic degradation of Congo Red (CR) on the nanocomposites: (bf) change in watercolor including CR dye for (a) only CR; (b) NiO/G2; (c) NiO/G10; (d) NiO/Ga2O2/G2; and (e) NiO/Ga2O2/G10 after UV illumination for 210 min.
Separations 09 00201 g007
Figure 8. Semi-logarithmic graph of CR concentration vs. irradiation time in the presence of NiO/G2, NiO/G10, NiO/Ga2O2/G2, and NiO/Ga2O2/G10 nanocomposites.
Separations 09 00201 g008
Figure 9. Effect of the contact time on the degradation capacity of CR on NiO/G2, NiO/G10, NiO/Ga2O2/G2, and NiO/Ga2O2/G10 nanocomposites.
Separations 09 00201 g009
Figure 10. The proposed mechanism for the photodegradation of cationic dye by NiO/Ga2O2/Graphene nanocomposites.
Separations 09 00201 g010
Figure 11. The photocurrent signal as a function of time for NiO, NiO/G10, NiO/Ga2O2/G2, and NiO/Ga2O2/G10 nanocomposites.
Separations 09 00201 g011
Table 1. The weight and atomic percentages of the Ni, Ga, O, and C elements calculated from EXD spectra of NiO/G10 and NiO/Ga2O2/G10.
ElementNiO/G10NiO/Ga2O2/G10
wt.%at.%wt.%at.%
Ni54.0721.5327.4312.83
O22.5933.0011.4619.67
C23.3445.4722.9252.45
Ga----38.2015.05
Table 2. Raman vibration modes observed for graphene, NiO/G10, NiO/Ga2O2/G2, and NiO/Ga2O2/G10 nanocomposites.
Vib. Mode (cm−1)201416532697878109813351365157526602727
Sample
Graphene ------------O--OO--
NiO/G10----OOOO--OO--O
NiO/Ga2O2/G2OOOOOO----O----
NiO/Ga2O2/G10OOOOOO--OO--O
Table 3. Raman vibration mode observed for Graphene [32,33,34], NiO [38,39,40], and Ga2O2 [41,42].
Vib. Mode (cm−1)201416532697878109813351365157526602727
Sample
Graphene ------------O--OO--
β-Ga2O2OO--O--------------
NiO----O--OO----------
Table 4. The absolute values of first-order reaction rate constants (k) and the degradation equilibrium constant (K), experimental qe values for the 20 mg/L CR degradation at 303 K.
qe(exp)kK
NiO/G2 12.400.26160.00703
NiO/G10 10.150.11620.01256
NiO/Ga2O2/G2 13.300.08570.02252
NiO/Ga2O2/G10 19.950.09050.0378
Publisher’s Note: MDPI stays neutral with regard to jurisdictional claims in published maps and institutional affiliations.

