Article

Advanced Treatment of Palm Oil Mill Effluent Using Thermally Activated Persulfate Oxidation

by
Mohammed J. K. Bashir
1,*,
Ong Sue Sheen
1,
Choon Aun Ng
1,
Mohammed Shadi S. Abujazar
2,
Motasem Y. D. Alazaiza
3 and
Salim S. Abu Amr
4
1
Department of Environmental Engineering, Faculty of Engineering and Green Technology (FEGT), Universiti Tunku Abdul Rahman, Kampar 31900, Perak, Malaysia
2
Al-Aqsa Community Intermediate College, Al-Aqsa University, Gaza P.B. 4051, Palestine
3
Department of Civil and Environmental Engineering, College of Engineering, A’Sharqiyah University (ASU), Ibra 400, Oman
4
Health Safety and Environmental Management, International College of Engineering and Management, Seeb 111, Oman
*
Author to whom correspondence should be addressed.
Separations 2022, 9(7), 171; https://doi.org/10.3390/separations9070171
Submission received: 21 June 2022 / Revised: 4 July 2022 / Accepted: 6 July 2022 / Published: 8 July 2022
(This article belongs to the Section Environmental Separations)

Abstract

:
Advanced treatment of biologically processed palm oil mill effluent (BIOTPOME), which possesses a potential danger to the water sources is required to meet the Malaysian discharge standard, as BIOTPOME contains high level of chemical oxygen demand (COD), suspended solids and oil and grease even after going through conventional treatment process. The significant but insufficient treatment efficiency of ponding system in Malaysia urged an alternative method to treat the recalcitrant organic compounds. Thus, post-treatment of BIOTPOME using oxidation by thermally activated persulfate process was proposed to solve this issue. In order to maximize the removal of COD and color, the central composite design (CCD) module of the response surface approach was used to optimize the interactions of the process variables temperature, S2O82−/COD ratio, and reaction time. In order to identify the significant terms of interacting process factors, CCD performed a batch study from which statistical models of responses were created. All models were confirmed by analysis of variance (ANOVA) showing significances with Prob > F less than 0.1. The optimal performance was obtained at the temperature of 67.4 °C, S2O82−/COD ratio of 9.8 and reaction time of 120 min, rendering COD removal of 85.65% and color removal of 85.74%. The total cost for the treatment process was RM0.94 per liter.

1. Introduction

Elaeis guineensis, more commonly known as oil palm trees, has been established as an industrial crop since the 1960s when the plantation area was undergoing expansion from 54,674 hectares in 1960 to 5.9 million hectares in 2019. According to the report by the United States Department of Agriculture (USDA) in 2021, Malaysia accounted for 26.37% of the world’s palm oil production, falling behind Indonesia with 57.64% of the world’s palm oil production [1]. With government bodies such as MPOC and Malaysian Agricultural Research and Development Institute (MARDI), the palm oil industries in Malaysia are still flourishing nowadays. The process of palm oil extraction generates several types of waste in solid, liquid and gas forms during the milling process of the fresh fruit bunches. These by-products included but are not limited to: empty fruit bunches, oil palm shell and fuel ash, methane gas and palm oil mill effluent (POME), which can lead to serious environmental issues if it was directly discharged in the water streams [2,3]. Untreated POME is brown in color and full of colloidal suspension with an unpleasant and pungent smell, which consists of 95% water, 4% total solids and 0.7% oil [4]. As POME that is not treated properly will cause environmental pollution especially water pollution, it has to undergo treatment before being safety discharged. Since POME is rich in organic components, the industries mostly used anaerobic and aerobic lagoons to treat POME [2,5]. However, these methods did not achieve high efficiency in lowering the COD and total suspended solids (TSS) content, as well as removing the brownish color of the POME. In fact, the analysis of the POME from the ponds revealed that the removal of lignin along with other types of organic matters is significant but insufficient after going through the treatments of anaerobic ponds and anaerobic reactor. Therefore, the brownish color remains, and the biologically treated POME (BIOTPOME) is not appropriate to be safely discharged into water streams despite its non-toxic nature. Furthermore, the conventional open ponding system possess other disadvantages such as requirement of large land area (around 30–45 acres) and long hydraulic retention time (3 months) for the biological degradation process [6].
Due to the limitations experienced by ponding system, it can be observed that the current trend on POME studies had shifted towards investigating and exploring various polishing technologies of POME to expel the color and remaining organic compounds before being discharged into water bodies. Advanced oxidation process (AOP) mechanisms in the industries mainly utilize hydroxyl radical to destruct the structure of organic compounds [7]. Sulfate radical-based AOPs have gained attention in recent years to replace hydroxyl radical due to: higher redox potential, reaction in wider pH range and higher efficiency in oxidizing persistent organic pollutants with unsaturated bonds or aromatic rings that are difficult to be treated during microbial degradation [8]. The process of AOPs takes place in two steps: on-site generation of radicals, then proceeds with the reaction of radicals with organic or biological pollutants. Persulfate activation to form sulphate radicals can be achieved through several methods such as thermal, ultraviolet, ultrasound or heterogeneous and homogeneous catalysis [9]. Although sulfate radical-based research has been increasing, there is limited information on the thermally activated persulfate and its performance in treating treatment POME. Typically, thermal activation is one of the most effective methods for persulfate activation to generate reactive species. Since the bond energy of peroxide (O–O) in persulfate is 140–213.3 kJ mol−1, a thermal activation at >30 °C is enough to break the O–O bond for the generation of sulfate anion radicals (SO4•−). These SO4•− radicals can be further converted to hydroxyl radicals (OH), which are also an effective species in degrading organic contaminants.
In order to fulfil the discharge limit established by the Environmental Quality (Prescribed Premises) (Crude Palm Oil) Regulation 1977, this study focused on using an advanced oxidation process using a thermally activated sulfate radical (SR-AOP) for further polishing of biologically treated POME. The central composite design (CCD) module was used to statistically optimize this supplementary post treatment. To maximize COD and color treatment efficacy, POME temperature, S2O82−/COD ratio, and reaction duration were adjusted.

2. Materials and Methods

2.1. Treated POME Characteristics

The POME used in this study originated from a palm oil factory that is based in the state of Perak. The final treatment pond of the ponding system, from which water would eventually be pumped into the nearby water bodies, was where the POME samples were taken. To reduce biological and chemical alterations, the collected samples were delivered to an environmental laboratory and kept at 4 °C. Based on an analysis of the Standard Methods for the Examination of Water and Wastewater handbook [10], the characteristics of partially treated POME from ponding systems are shown in Table 1.

2.2. Setup of Laboratory-Scale Thermally Activated AOP System

Batch experiments were conducted for all via Schott bottle containing 100 mL of POME. Respective dosage of Na2S2O8 in crystalized powder form and a magnetic stirrer were added to the bottle, then the bottle was capped. The temperature of the stirring water bath with lid was set, and the bottle was placed in the water bath, making sure the water bath level exceeded the solution level, and the solution was heated for a designated duration of time. Following the completion of each batch experiment, the COD and color concentrations were analyzed, and the respective removal efficiencies were determined using Equation (1):
Removal   efficiency   ( % ) = ( C i C f C i ) × 100 %
where Ci and Cf refer to the initial and final concentrations of COD and color.

2.3. Experimental Design and Statistical Analysis

In this work, RSM was used to analyze and optimize the treatment of POME from ponding system using the Design-Expert® Version 7.0 software (Stat-Ease, Inc., Minneapolis, MN 55413, USA). The correlation between the process variable and the answer was assessed using the CCD module of RSM, which is the most often used module of RSM. According to Guven et al. [11], CCD is a useful design tool for sequential experimentation since it allows for a reasonable amount of information to be tested for lack of fit when there are enough experimental values available. Temperature (A), S2O82−/COD ratio (B), and reaction time (C) were the three important process factors in this study that needed to be adjusted. Each process variable was numerically altered from −1 to +1 coded value. The corresponding real value ranges, which were derived from early studies and supported by the literature, were 25 to 80 °C, 0.2 to 10.0 ratio, and 10.0 to 120.0 min [12,13,14] Six repeated batches were run at the midpoint of each process variable as part of the design by CCD, which resulted in a total of 20 batch tests for the purpose of determining the random error (Table 2). The simultaneous percentage reductions of COD and color at the end of each run were the monitored reactions. As shown in Equation (2), each response was then statistically modeled using a quadratic model via correlation with process variable terms.
Y = β 0 + i = 1 k β x i + i = 1 k β i i x i 2 + i = 1 k i   j = 1 k β i j x i x i j + ϵ
where the response is Y; the process variables are xi and xj, the constant coefficient is β0; βi, the interaction coefficients of linear are βii and βij quadratic and second order terms, respectively, the number of process variables is k and the random error component is ϵ .
The coefficient of determination (R2) value and F-test from analysis of variance (ANOVA) based on probability (p-value) of 95% confidence level were used to confirm the accuracy of the fitted model [15]. The best conditions for process variables focused on maximum removal efficiencies of COD and color of post-treated POME for discharge were then predicted using the models that represented their respective responses’ interaction.

3. Results and Discussion

In particular, Table 1 presents the ponding system’s treatment of POME performance. The Environmental Quality (Prescribed Premises) (Crude Palm Oil) Regulation 1977 of Malaysia was violated by the POME discharged to the nearby water sources since it still included excessive levels of COD, color, turbidity, suspended particles, and ammonia-nitrogen. This suggests that post-treatment of POME from ponding systems is essential, both to comply with the decree and to safeguard the environment’s health while receiving the discharged POME.

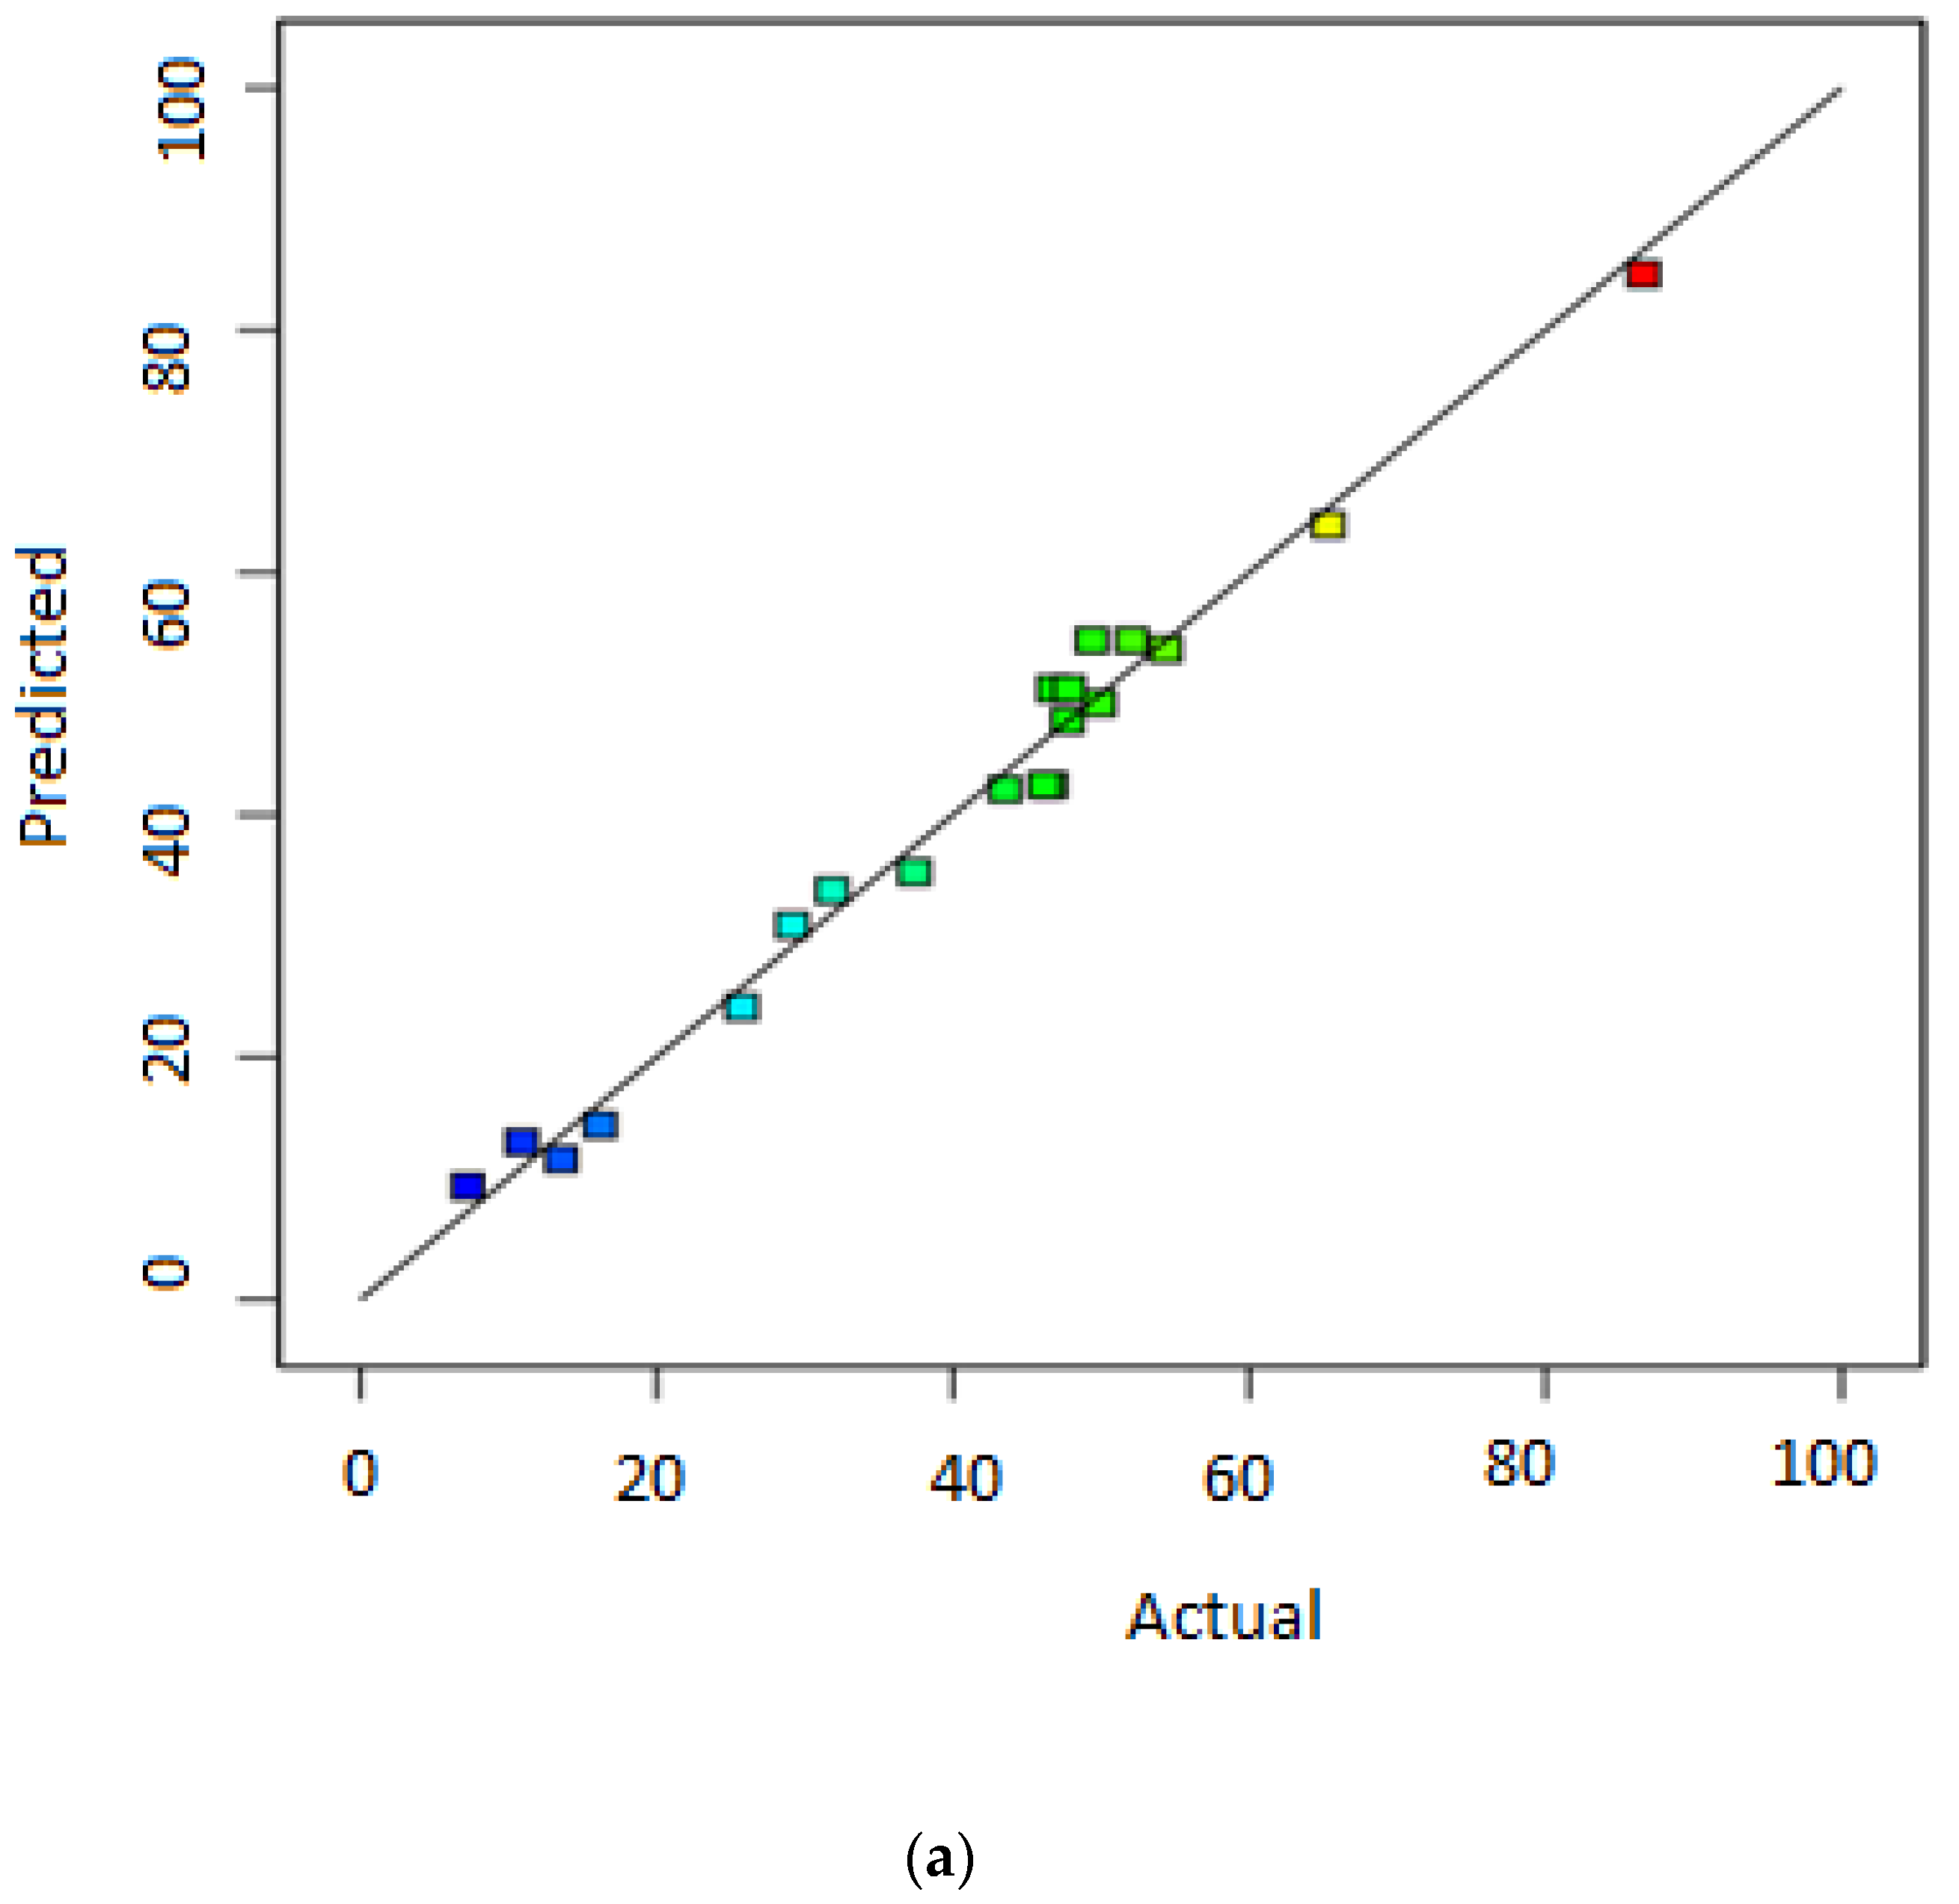
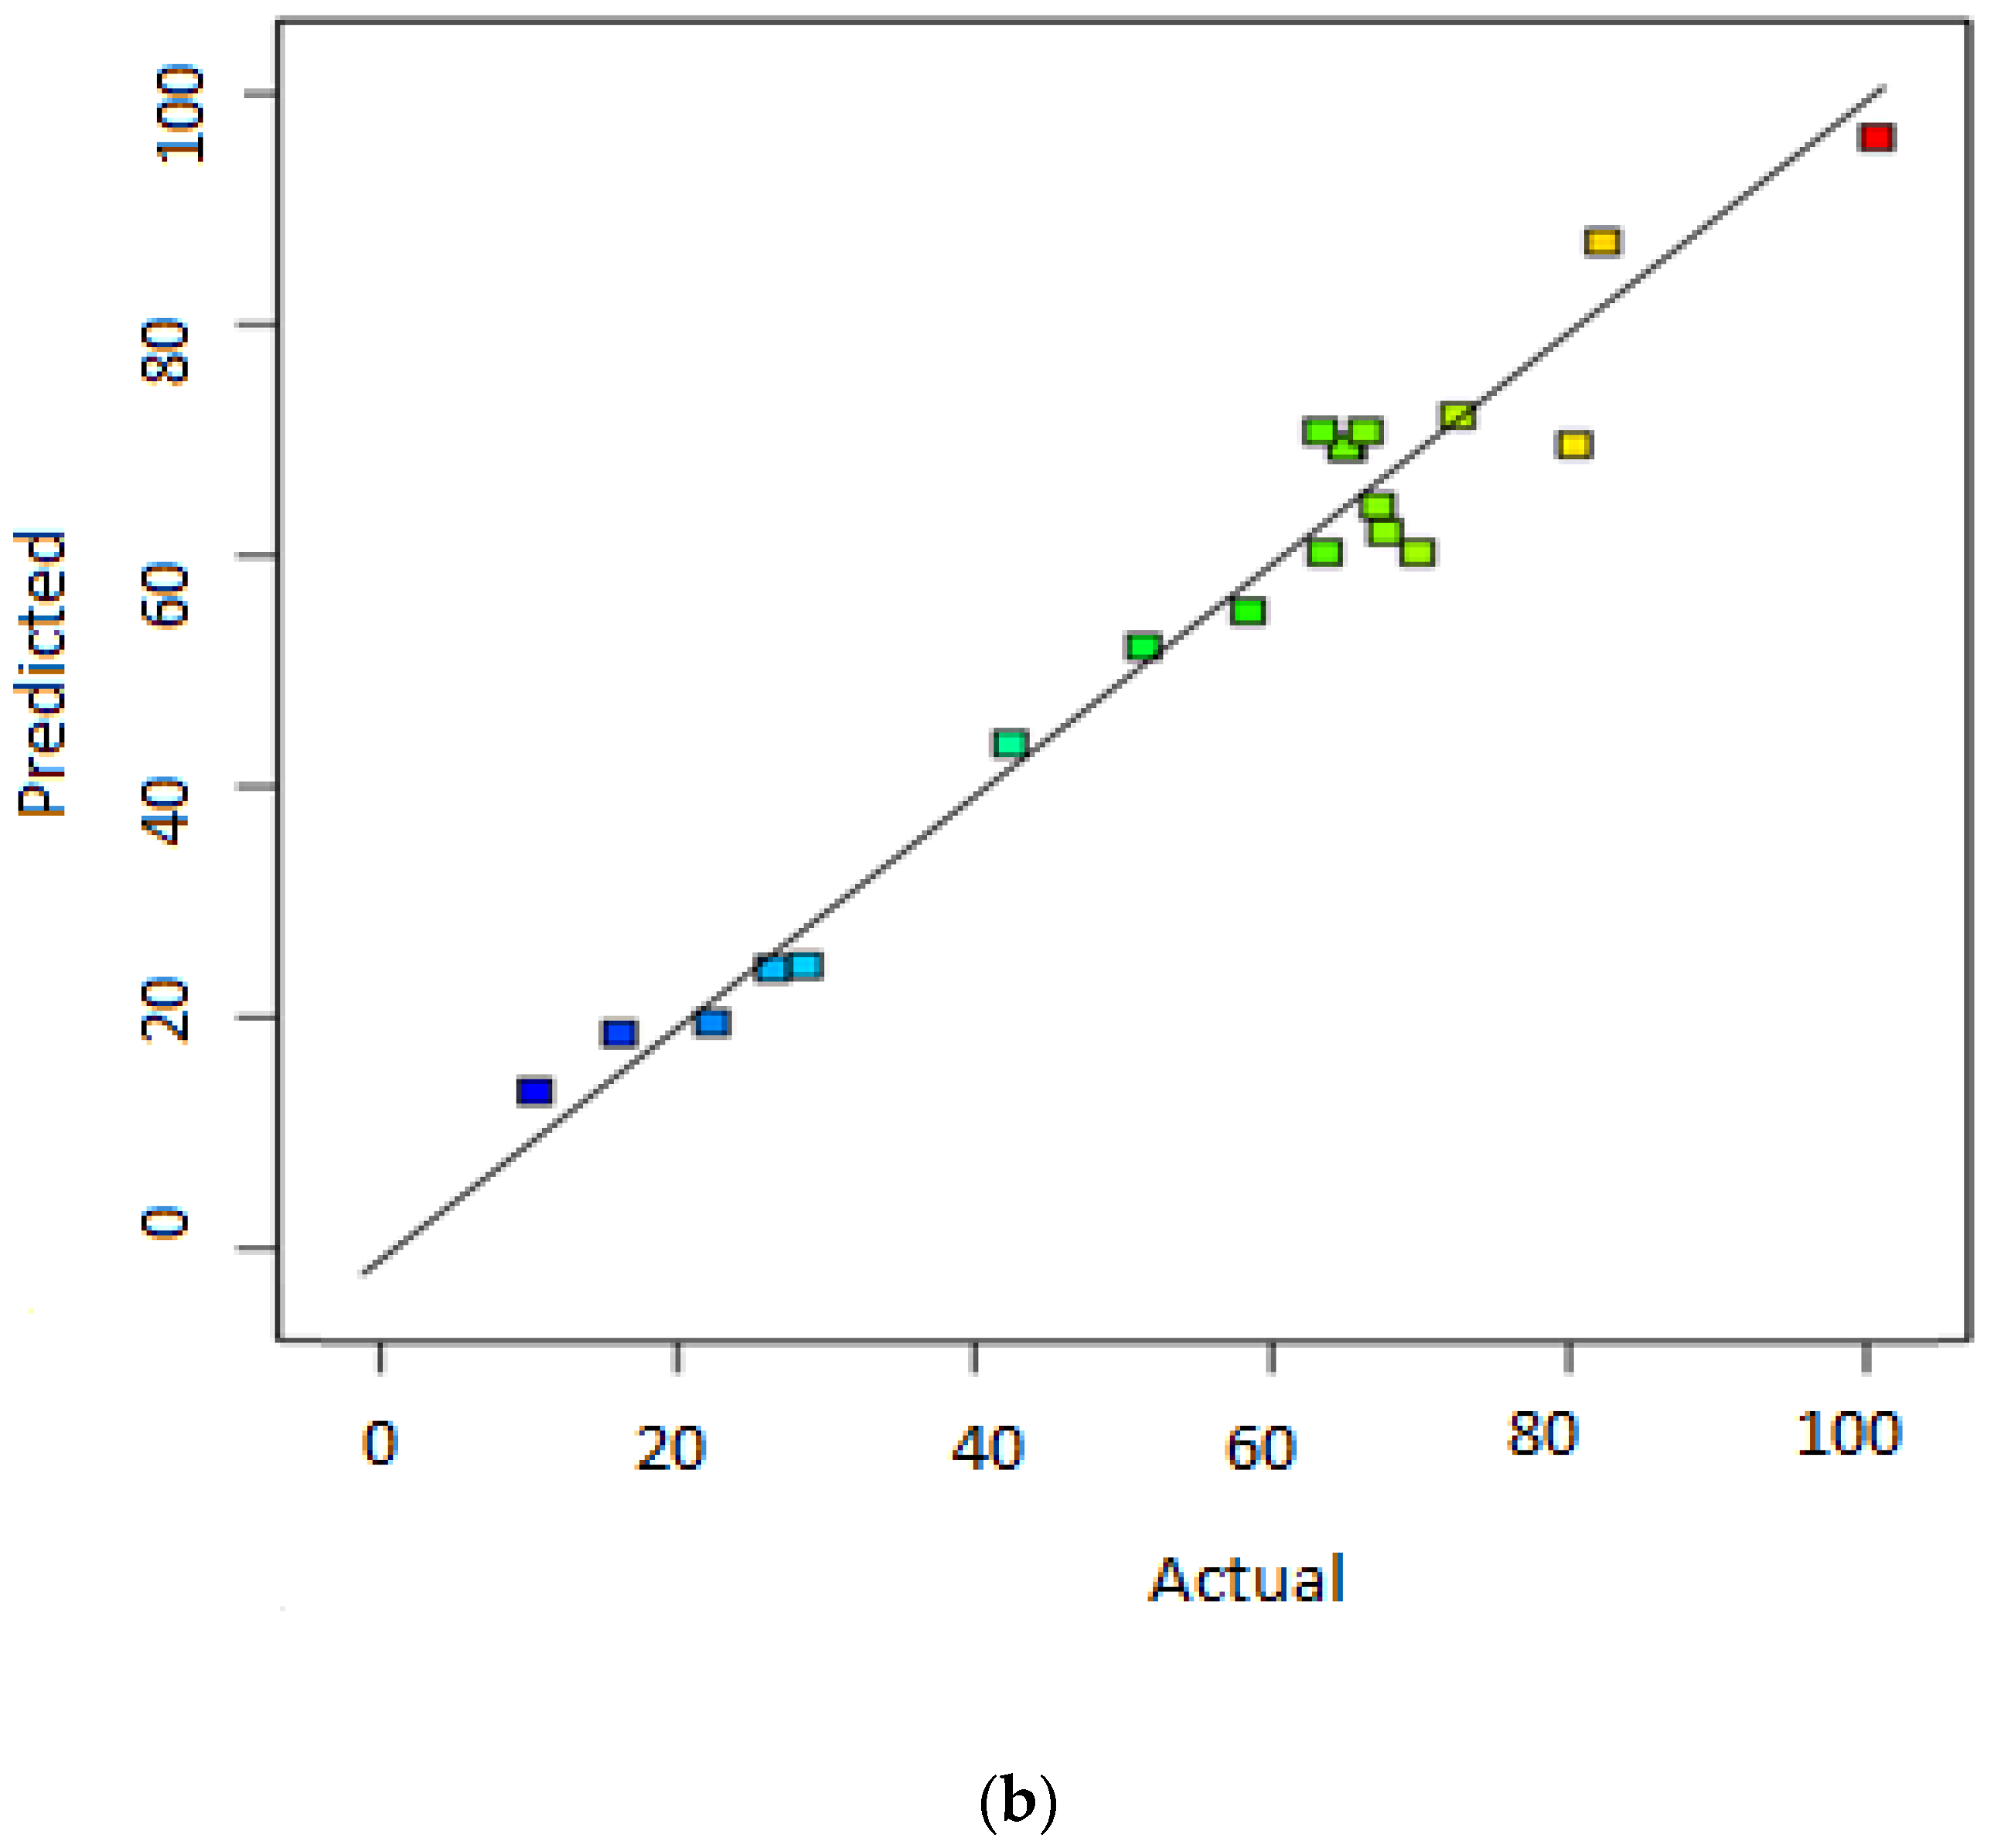
3.1. Statistical Significance of Responses’ Models

In this work, CCD of RSM optimized the use of thermally activated sulfate radical-based AOP process as a post-treatment technique of POME. Table 2 displays the response outcomes of batch trials created by CCD using statistically varying process factors. Based on the prediction of a parameter, the CCD module can provide an empirical design for associating response to a process variable [15]. Polynomial equations might be used to determine the relationship between responses and process factors by using factorial regression analysis to the experimental data in Table 2. Equations (3) and (4) illustrate the quadratic models that were obtained for each response after the statistically unimportant model terms were removed:
COD removal (%) = 49.093 + 12.50A + 10.25B + 7.10C − 35.48A2 + 33.66B2 − 18.90C2 + 8.73AB + 10.45AC
Color removal (%) = 66.987 + 6.84A + 6.21B + 11.95C +1.13AB + 6.78AC + 4.56BC
The model terms A, B, and C, respectively, stand in for the process variables temperature, S2O82−/COD ratio, and reaction time. The ANOVA study of two response quadratic models is explained in Table 3 and Table 4.
The Prob > F of less than 0.01 consistently indicated that the response quadratic models were adequate and significant. The coefficient of determination (R2) for each model showed that the quadratic models satisfactorily accounted for the experimental data. According to Myers et al. [16], a good fit model should have R2 > 0.8, which was demonstrated in this investigation. Myers et al. [16] claim that an R2 value that is closer to 1.0 is statistically preferable. Next, all of the models’ coefficients of variance were under 10%, indicating high model repeatability [12]. All models showed appropriate precisions of higher than 4.0, indicating that the models’ signals may be utilized to guide the design space [17]. As a result, the models that were created were sufficient for navigating the design space described by CCD and for predicting reactions [13]. On the other hand, the estimated standard deviation values of all below 10%, a normally acceptable variance, revealed the dispersion of data values around their respective means. In this regard, the resulting models’ anticipated responses could be seen scattering about the actual values of the responses, as shown in Figure 1, demonstrating that the variances were small in every case.

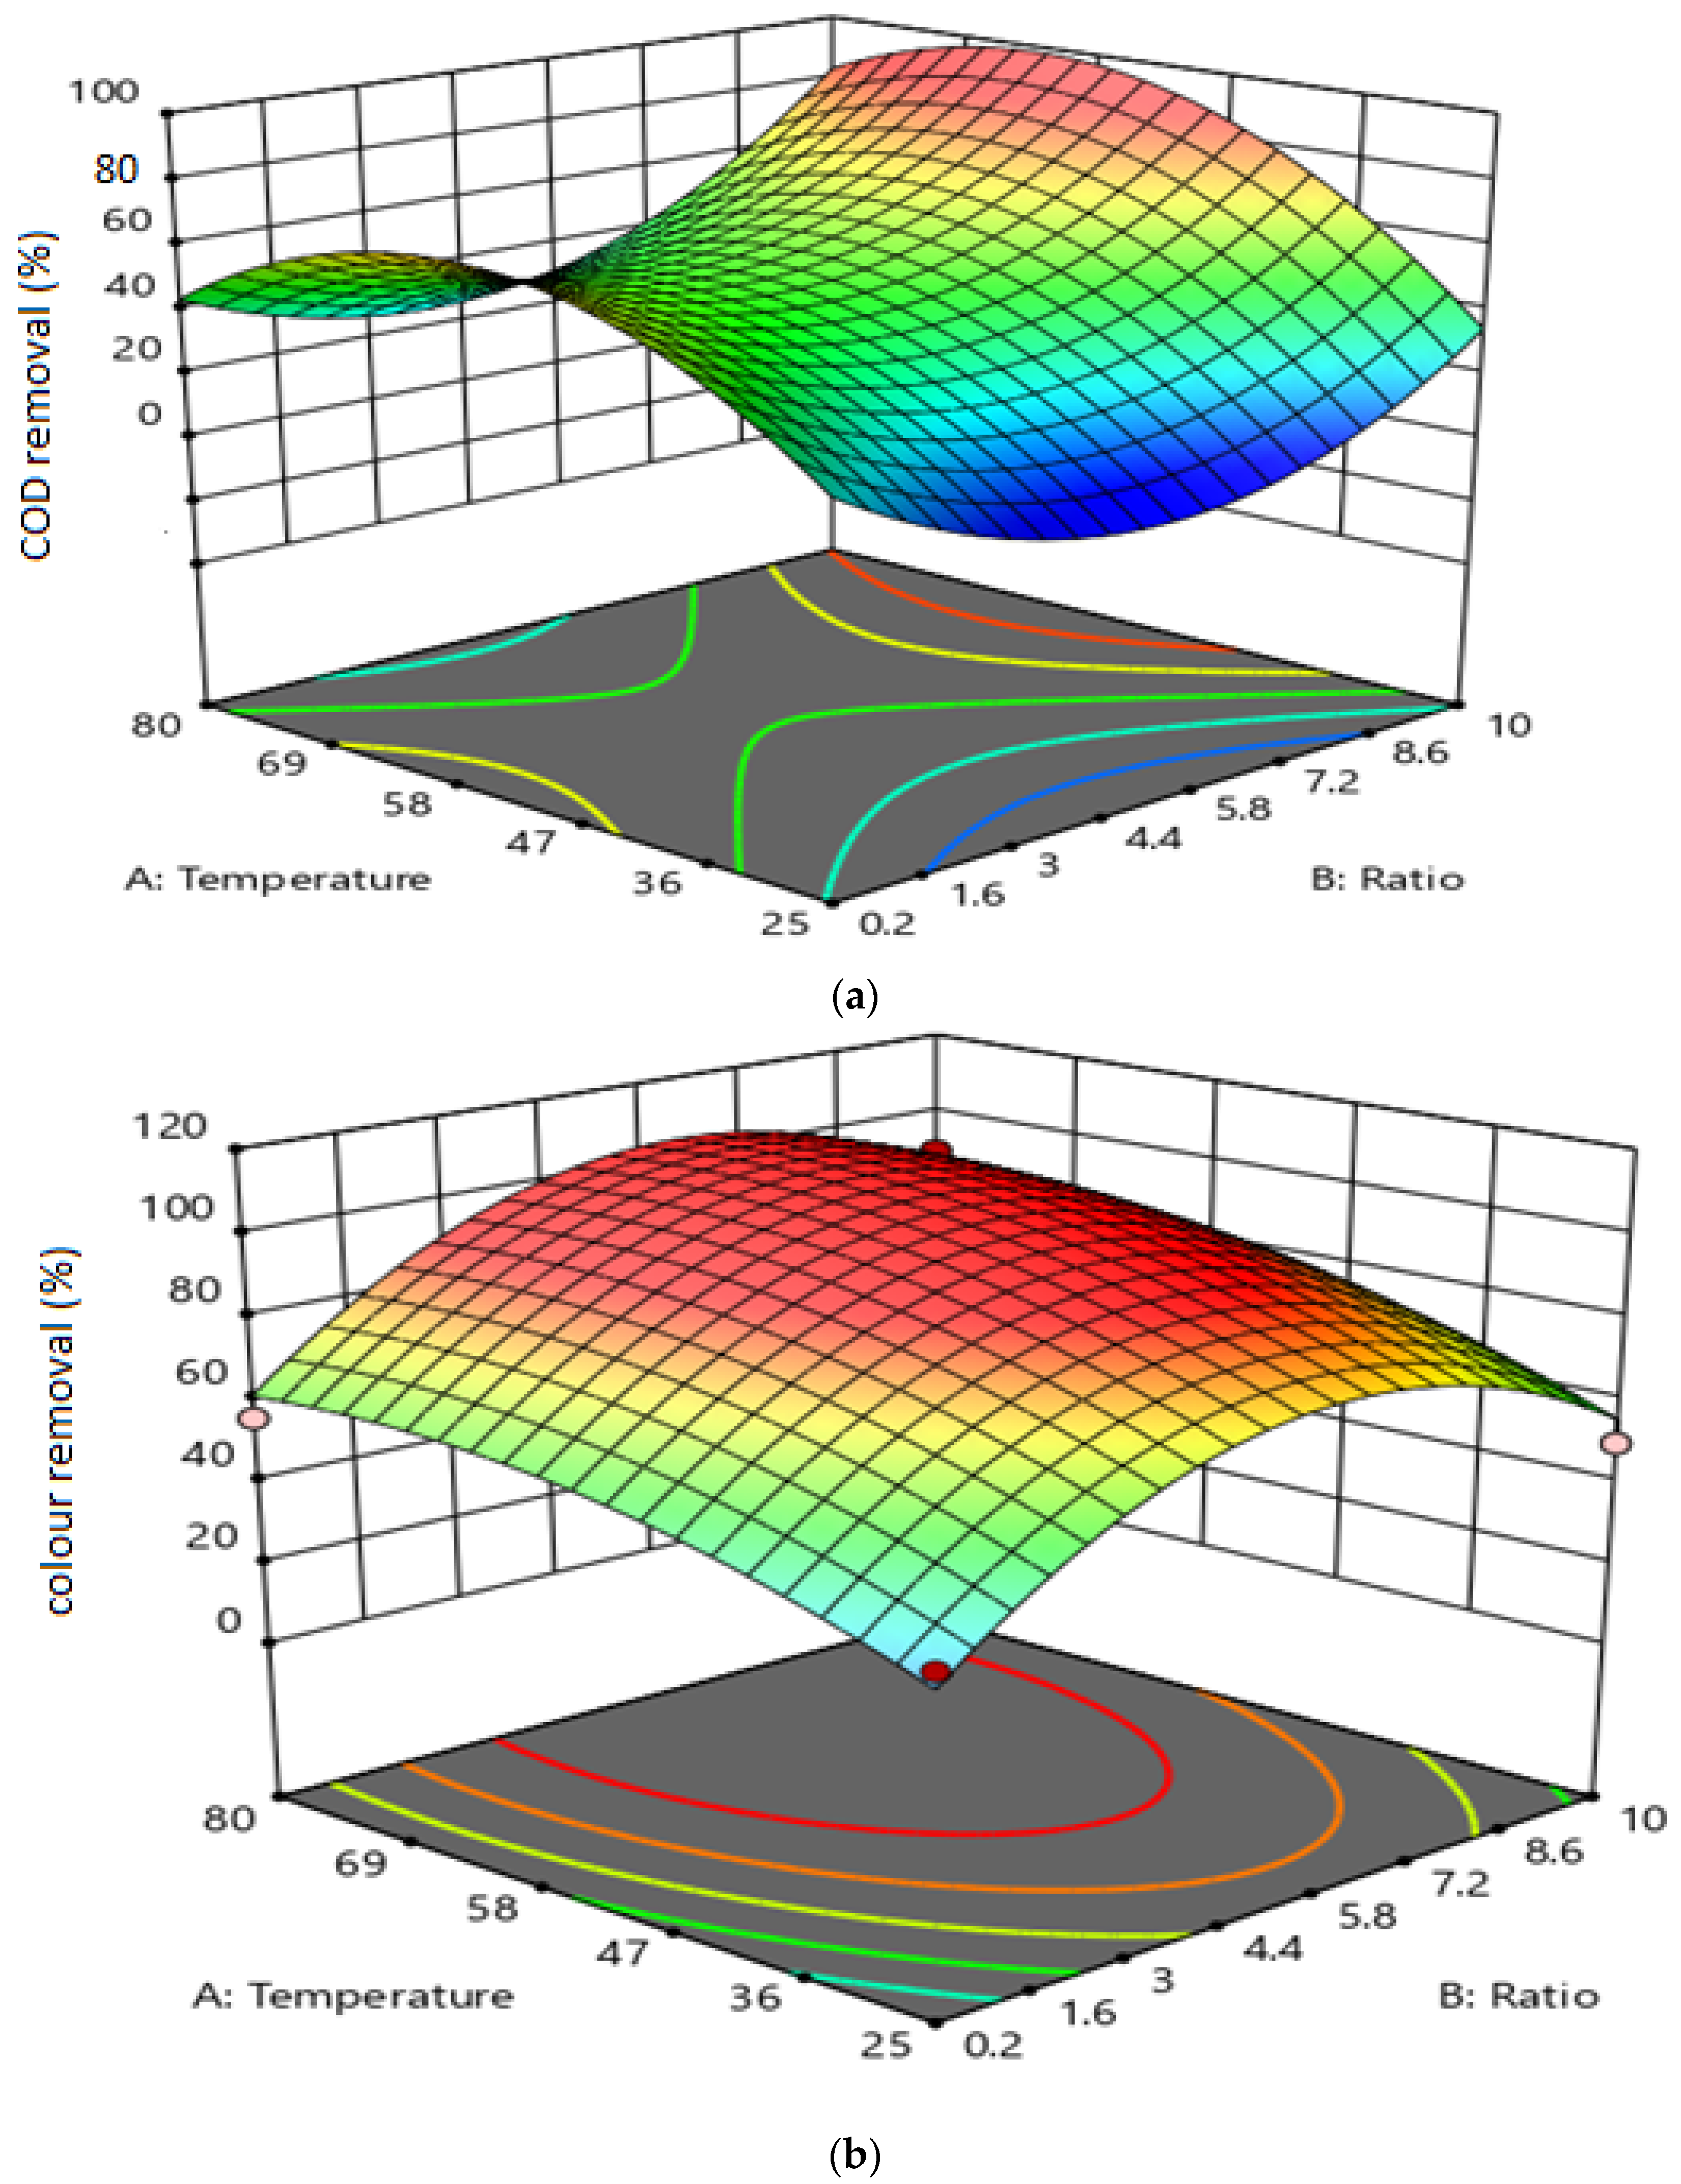
3.2. The Effect of Variable Interactions on Responses

The interactions of process factors (namely temperature, S2O82−/COD ratio, and reaction time) effecting the removal of color and COD of post-treated POME by thermally activated sulfate radical-based AOP method were then accessed using the fitted models (Equations (3) and (4)). In a 3D surface plot, steep curvature indicates an obvious interaction of process factors that results in a synergistic impact, and vice versa. The results of the interactions between the process variables are shown in Figure 2 and Figure 3 of this study for the various statistically expected responses of treated POME using the thermally activated sulfate radical-based AOP method. From 25.0 to 60.0 °C, the elimination of color and COD typically increased with temperature. The elimination of color (Figure 2) showed the biggest changes among them, going from 40% at 25.0 °C to 80% at 60.0 °C and then increasing to 100% at 80.0 °C, at the minimum temperature and the highest S2O82−/COD ratio. Likewise, Yabalak [18] found that the elevated temperatures supply sufficient energy to rupture the peroxide bonds in persulfate molecules, as well as produce SO4•− radicals for faster degradation of organic compounds. Other than that, the heat energy provided from the high temperature in the solutions can break the π bonds in the structure of the components that contributed the dark color of the BIOTPOME. This causes the structure to undergo changes and a decrease in color density.
In thermally activated SR-AOP process, the sulfate radical is activated when the heat supplied provides energy for the O–O bond to experience fission, as shown below.
S 2 O 8 2   h e a t   2   SO 4
HSO 5   h e a t   SO 4 + OH
As the heating temperature increases, the radical generation rate becomes higher, thus increasing the rate of removal of the targeted pollutants [19], which fits the Arrhenius equation as shown in Equation (5). However, extreme high temperature can contribute to high concentration of radicals which may result in reactions to occur among the radicals instead of the intended reactions of the radicals with the contaminants. Ultimately, an improved micropollutant degradation may not be achieved.
ln ( k ) = lnA E a RT d [ contaminant ] dt = k × [ contaminant ]
The red color of surface graph at a S2O82−/COD ratio of 5.10 has a wider spread as compared to that of higher S2O82−/COD ratio of 10. This may be due to the reason that S2O82− can act as a SO4•− radical scavenger after exceeding a certain concentration, therefore lowering the removal efficiency when the radical concentration in the high. This observation is similar to that of furfural degradation [20], agrochemical wastewater treatment [18] and penicillin G degradation [21] by heat activated persulfate oxidation. Under low ratio, the addition of time and temperature did not result in a major change in COD removal efficiency. This shows that a low temperature is unable to lower the COD level when there is an absence of persulfate radicals being added, as similar to bitumen effluents treatment [22]. The effect of temperature is just as significant as the time increment.
SO4•− + S2O82−  SO42− + S2O8•−

3.3. Optimizing the Interactions between Process Variables in the Electrocoagulation Process

The interactions between the process variables that were covered in the previous section provided some guidance for reducing the ranges of the variables while identifying the optimal conditions for the process to occur. As a result, the S2O82−/COD ratio and reaction time set in the RSM’s CCD were both limited to ranges of 0.2–10.0 and 20–120 min, respectively. On the other hand, a minimal temperature was intended to provide an economically viable post-treatment for POME without affecting the process’s viability. In the case of the replies, the COD and color removal were maximized in order to meet the discharge requirement and simultaneously minimize the adverse environmental effect of the POME discharge. At a temperature of 67.4 °C, an S2O82−/COD ratio of 9.8, and a reaction duration of 120 min, the ideal conditions were discovered. In this ideal situation, 85.65 percent of COD and 85.74 percent of color would be removed. According to the Environmental Quality (Prescribed Premises) (Crude Palm Oil) Regulation 1977 [23], the COD and color of post-treated POME were anticipated to be 598 mg/L and 560 Pt/Co, respectively, which are acceptable for discharge to the natural environment. The procedure was adjusted to attain optimal conditions and put into practice to validate the accuracy of expected outputs. The actual outcomes are displayed in Table 5. The reliability of the CCD tool in improving the thermally activated SR-AOP process was afterwards discovered by the calculation of the standard deviations between anticipated and actual values for each response.
Researchers had laboriously contributed to the literature vis-à-vis the use of thermally activated SR-AOP process for treatments other than POME. Ghauch et.al. [24] reported that with an initial ibuprofen concentration of 20.36 μM, S2O82− concentration of 2.0 mM, temperature of 60 °C, pH 7.0 at 60 min of reaction time had resulted in complete removal of ibuprofen concentration. Future attempts were planned under different conditions such as lower temperature of less than 40 °C in order to lower the operational cost. In the treatment of agrochemical wastewater, which had been reported containing chemical compounds possessing numerous health risks, Yabalak [18] confirmed that 70.2% and 100% of total organic carbon and color removal was achieved with 90 °C temperature, 100 min reaction time and S2O82− concentration of 80 mM. For the treatment of post oxidative effluents from production of petroleum bitumen under alkaline pH by Fernandes et al. [22], persulfate with a ratio of oxygen from oxidant and COD in the effluent (rox) of 1.28 at 60 °C achieved 33% COD reduction and 55% BOD reduction, respectively. This method was revealed to be effective for pre-treatment in terms of VOC degradation, and a secondary treatment was necessary for a cleaner production of petroleum bitumen.

3.4. Analysis of the Operational Cost

Cost analysis of biologically treated POME via thermally activated SR-AOP was caried out. Energy consumption and material cost is the main concern of thermally activated SR-AOP treatment. In this study, the operation costs were estimated for an applied temperature of 67.4 °C, 9.8 S2O82−/COD ratio and 120 min reaction time, which were the optimal operational conditions. Therefore, the sodium persulfate cost per liter of biologically treated POME was calculated by Equation (6), while the electricity cost was calculated by Equation (7). The cost of sodium persulfate was referred to the wholesale price of RM4.14 per kg, while the Malaysia electricity tariff was RM0.67 per kWh.
Sodium   persulfate   cost = c o s t   p e r   kg × r a t i o × C O D × m o l e c u l a r   w e i g h t   c o n v e r s i o n = RM 4.14 × 9.8 × 5400   mg L × 1   kg 10 6   mg × 238.1   g m o l N a 2 S 2 O 8 192   g m o l S 2 O 8 2 × 1 98 p u r i t y = RM 0.28 / L
Electricity   cost = c o s t × p o w e r × ( h e a t i n g   t i m e + r e a c t i o n   t i m e ) = RM 0.365 × 0.8   kW × ( 15   min + 120   min ) × 1   h 60   min = RM 0.66 / L
Per liter of POME, the computed total cost for heat activation of persulfate oxidation was RM0.94. The real dosage and electrical usage may vary depending on the POME influent quality.

4. Conclusions

Thermally activated persulphate was optimized for post-treatment of POME from ponding systems using the CCD of RSM. Temperature, S2O82−/COD ratio, and reaction time were three process factors that interacted and were simultaneously adjusted. The answers in the CCD module were programmed to remove COD and color as much as possible. The ANOVA test was used to confirm the developed response statistical models that demonstrated significant terms for interacting process variables. Each model had an R2 value that was closer to 1.0 and a Prob > F value that was less than 0.01. The optimum thermally activated SR-AOP process condition of 67.4 °C, 9.8 S2O82−/COD ratio and 120 min reaction time predicted 85.65% and 85.74% removal of COD and color. The total cost estimated per liter of BIOTPOME was RM0.94. The final quality of BIOTPOME satisfied the discharge limit under the Environmental Quality (Prescribed Premises) (Crude Palm Oil) Regulation 1977 with a COD level of 598 mg/L and a color level of 560 Pt/Co. Based on these results, a thermally activated SR-AOP process at a certain level may be employed as an efficient and effective post-treatment technique before discharge to suit the needs.

Author Contributions

M.J.K.B. came up with the concept; he conceptualized it with O.S.S. and C.A.N.; he wrote about the impact of treatment technologies on drinking water; M.Y.D.A. wrote about regulations and measurement-based data collected from different countries; M.S.S.A. and S.S.A.A. wrote about formatting and the conclusion. M.Y.D.A. and M.J.K.B. All authors have read and agreed to the published version of the manuscript.

Funding

The Higher Education Ministry’s fund (FRGS/1/2019/TK10/UTAR/02/3) provided funding for this project.

Institutional Review Board Statement

Not applicable.

Informed Consent Statement

Not applicable.

Data Availability Statement

Not applicable.

Acknowledgments

We sincerely thank the Higher Education Ministry for providing the funding (FRGS/1/2019/TK10/UTAR/02/3).

Conflicts of Interest

The authors declare no conflict of interest.

References

  1. Soybean Buyers Turn Attention to Brazil’s 2021 Harvest; United States Department of Agriculture: Washington, DC, USA, 2021; pp. 4–33.
  2. Isa, M.H.; Wong, L.P.; Bashir, M.J.; Shafiq, N.; Kutty, S.R.; Farooqi, I.H.; Lee, H.C. Improved anaerobic digestion of palm oil mill effluent and biogas production by ultrasonication pretreatment. Sci. Total Environ. 2020, 722, 137833. [Google Scholar] [CrossRef] [PubMed]
  3. Lin, C.K.; Bashir, M.J.K.; Abu Amr, S.S.; Sim, L.C. Post treatment of palm oil mill effluent (POME) using combined persulphate with hydrogen peroxide (S2O82−/H2O2) oxidation. Water Sci. Technol. 2016, 74, 2675–2682. [Google Scholar] [CrossRef] [PubMed]
  4. Ahmad, A.L.; Idris, I.; Chan, C.Y.; Ismail, S. Reclamation from palm oil mill effluent using an integrated zero discharge membrane-based process. Pol. J. Chem. Technol. 2010, 17, 49–55. [Google Scholar] [CrossRef] [Green Version]
  5. Bashir, M.J.K.; Hong, L.J.; Amr, S.S.A.; Wong, L.P.; Sim, Y.-L. Post treatment of Palm Oil Mill Effluent Using Electro-coagulation-peroxidation (ECP) Technique. J. Clean. Prod. 2019, 208, 716–727. [Google Scholar] [CrossRef]
  6. Omar, A.K.M.; Norsalwani, T.L.T.; Asmah, M.S.; Badrulhisham, Z.Y.; Easa, A.M.; Omar, F.M.; Hossain, S.; Zuknik, M.H.; Norulaini, N.A.N. Implementation of the supercritical carbon dioxide technology in oil palm fresh fruits bunch sterilization: A review. J. CO2 Util. 2018, 25, 205–215. [Google Scholar] [CrossRef]
  7. Bashir, M.J.; Mau Han, T.; Jun Wei, L.; Choon Aun, N.; Abu Amr, S.S. Polishing of treated palm oil mill effluent (POME) from ponding system by electro-oxidation process. Water Sci. Technol. 2016, 73, 2704–2712. [Google Scholar] [PubMed]
  8. Onn, S.W.; Bashir, M.J.K.; Sethupathi, S.; Amr, S.S.A.; Nguyen, T.T. Colour and COD Removal from Mature Landfill Leachate Using Electro-persulphate Oxidation Process. Mater. Today Proc. 2020, 31, 69–74. [Google Scholar] [CrossRef]
  9. Guerra-Rodríguez, S.; Rodríguez, E.; Singh, D.N.; Rodríguez-Chueca, J. Assessment of sulfate radical-based advanced oxidation processes for water and wastewater treatment: A review. Water 2018, 10, 1828. [Google Scholar] [CrossRef] [Green Version]
  10. APHA; AWWA; WEF. Standard Methods for the Examination of Water and Wastewater, 22nd ed.; American Public Health Association (APHA): Washington, DC, USA, 2012. [Google Scholar]
  11. Guven, G.; Perendeci, A.; Tanyolac, A. Electrochemical treatment of deproteinated whey wastewater and optimization of treatment conditions with response surface methodology. J. Hazard. Mater. 2008, 157, 69–78. [Google Scholar] [CrossRef] [PubMed]
  12. Bashir, M.J.K.; Aziz, H.A.; Yusoff, M.S.; Adlan, M.N. Application of response surface methodology (RSM) for optimization of ammoniacal nitrogen removal from semi-aerobic landfill leachate using ion exchange resin. Desalination 2010, 254, 154–161. [Google Scholar] [CrossRef]
  13. Mohajeri, S.; Aziz, H.A.; Isa, M.H.; Zahed, M.A.; Bashir, M.J.K.; Adlan, M.N. Application of the central composite design for condition optimization for semi-aerobic landfill leachate treatment using electrochemical oxidation. Water Sci. Technol. 2010, 61, 1257–1266. [Google Scholar] [CrossRef] [PubMed]
  14. Bashir, M.J.; Aziz, H.A.; Aziz, S.Q.; Abu Amr, S.S. An overview of electro-oxidation processes performance in stabilized landfill leachate treatment. Desalin. Water Treat 2013, 51, 2170–2184. [Google Scholar]
  15. Bashir, M.J.; Isa, M.H.; Kutty, S.R.M.; Bin Awang, Z.; Aziz, H.A.; Mohajeri, S.; Farooqi, I.H. Landfill leachate treatment by electrochemical oxidation. Waste Manag. 2009, 29, 2534–2541. [Google Scholar]
  16. Myers, R.H.; Montgomery, M.D.; Anderson-Cook, C.M. Response Surface Methodology, Process and Product Optimization Using Designed Experiments, 3rd ed.; John Wiley and Sons, Inc.: Hoboken, NJ, USA, 2009. [Google Scholar]
  17. Azmi, N.B.; Bashir, M.J.; Sethupathi, S.; Wei, L.J.; Aun, N.C. Stabilized landfill leachate treatment by sugarcane bagasse derived activated carbon for removal of color, COD and NH3-N–Optimization of preparation conditions by RSM. J. Environ. Chem. Eng. 2015, 3, 1287–1294. [Google Scholar] [CrossRef]
  18. Yabalak, E. Treatment of agrochemical wastewater by thermally activated persulfate oxidation method: Evaluation of energy and reagent consumption. J. Environ. Chem. Eng. 2021, 9, 105201. [Google Scholar] [CrossRef]
  19. Gao, H.; Chen, J.; Zhang, Y.; Zhou, X. Sulfate radicals induced degradation of Triclosan in thermally activated persulfate system. Chem. Eng. J. 2016, 306, 522–530. [Google Scholar] [CrossRef]
  20. Shokoohi, R.; Salari, S.B.M.; Shabanloo, A. Thermochemical degradation of furfural by sulfate radicals in aqueous solution: Optimization and synergistic effect studies. Environ. Sci. Pollut. Res. 2019, 26, 8914–8927. [Google Scholar] [CrossRef] [PubMed]
  21. Norzaee, S.; Taghavi, M.M.; Djahed, B.; Mostafapour, F.K. Degradation of Penicillin G by heat activated persulfate in aqueous solution. J. Environ. Manag. 2018, 215, 316–323. [Google Scholar] [CrossRef] [PubMed]
  22. Fernandes, A.; Makoś, P.; Boczkaj, G. Treatment of bitumen post oxidative effluents by sulfate radicals based advanced oxidation processes (S-AOPs) under alka-line pH conditions. J. Clean. Prod. 2018, 195, 374–384. [Google Scholar] [CrossRef]
  23. Environmental Quality (Prescribed Premises) (Crude Palm Oil) Regulation 1977. Malaysia Sewage and Industrial Effluent Discharge Standards. In Malaysia’s Environmental Law, Environmental Quality Act; 1974; Available online: https://www.env.go.jp/en/recycle/asian_net/Country_Information/Law_N_Regulation/Malaysia/Malaysia_mal13278.pdf (accessed on 1 July 2022).
  24. Ghauch, A.; Tuqan, A.M.; Kibbi, N. Ibuprofen removal by heated persulfate in aqueous solution: A kinetics study. Chem. Eng. J. 2012, 197, 483–492. [Google Scholar] [CrossRef]
Figure 1. Actual and predicted plots for (a) COD removal and (b) color removal.
Separations 09 00171 g001aSeparations 09 00171 g001b
Figure 2. The 3D response surface plots showing the effect of temperature vs. persulfate on (a) color removal and (b) COD removal (reaction time = 120 min).
Separations 09 00171 g002
Figure 3. The 3D response surface plots showing the effect of temperature vs. time on (a) color removal and (b) COD removal (S2O82−/COD Ratio: 10.00).
Separations 09 00171 g003
Table 1. Characterization of biologically treated POME.
ParameterUnitAverage Value
CODmg/L4020.0
N-NH3mg/L4810.0
ColorPtCo5400.0
TurbidityNTU1280
BOD5mg/L444.5
pH-7.6
Temperature°C32.9
Table 2. Summary of CCD batch experiments and their response values.
RunProcess VariablesResponses
Temperature (°C)S2O82−/COD RatioReaction Time (min)COD (%)Color (%)
125.00.2010.010.9027.96
225.00.20120.016.1940.37
325.010.0010.025.7538.89
425.010.00120.07.2449.81
580.010.0010.031.8431.85
680.010.00120.086.6289.63
780.00.2010.013.5636.11
880.00.20120.029.1555.93
952.52.6565.054.3560.74
1052.55.1065.046.6268.52
1152.55.1065.046.1964.26
1252.55.1065.052.0965.19
1352.55.1065.049.3865.37
1452.55.1065.047.8466.11
1552.55.1092.549.9077.04
1652.57.5565.065.3566.67
1766.35.1065.047.7470.37
1838.85.1065.037.3967.04
1952.55.1037.543.5175.74
2052.55.1065.046.7964.07
Table 3. ANOVA results for validating response surface quadratic models for COD removal.
SourceSum of SquaresDFMean SquareF ValueProb > FRemarks
COD Removal Efficiency
Model5638.009626.4441.83<0.0001significant
A1328.3711328.3788.70<0.0001
B893.441893.4459.65<0.0001
C428.411428.4128.600.0006
A2234.201234.2015.630.0042
B2210.801210.8014.070.0056
C266.45166.454.430.0682
AB609.871609.8740.720.0002
AC873.411873.4158.32<0.0001
BC29.60129.601.970.1971
Residual119.80814.97
Lack of Fit115.51523.1016.161180.0222
Pure Error4.2831.42
R2 = 0.9792, Adjusted R2 = 0.9559, Predicted R2 = −0.2774, C.V. = 9.5745%, Adequate Precision = 25.1211
Final equation in terms of coded factors:
COD removal efficiency = 49.093 + 12.50A + 10.25B + 7.10C − 35.48A2 + 33.66 B2 − 18.90C2 + 8.73AB + 10.45AC
Table 4. ANOVA results for validating response surface quadratic models for color removal.
SourceSum of SquaresDFMean SquareF ValueProb > FRemarks
Color Removal Efficiency
Model3637.4409404.1615.070.0004significant
A397.88281397.8814.830.0048
B327.67071327.6712.210.0081
C1213.9411213.9445.260.0001
A218.56118.560.690.4295
B2167.331167.336.230.0370
C280.10180.102.980.1221
AB10.28110.280.380.5529
AC368.151368.1513.720.0059
BC166.251166.256.190.0375
Residual214.55826.81
Lack of Fit203.38540.6710.920.0384
Pure Error11.1733.72
R2 = 0.9443, Adjusted R2 = 0.8816, Predicted R2 = −1.0842, C.V. = 8.7651%, Adequate Precision = 14.012
Final equation in terms of coded factors:
COD removal efficiency = 66.987 + 6.84A + 6.21B + 11.95C + 1.13AB + 6.78AC + 4.56BC
Table 5. Comparison between predicted and actual laboratory experiments.
ResponsePredicted ValueActual ValuePercentage of Error (%)
COD (%)86.6285.651.2
Color (%)87.3985.741.9
Publisher’s Note: MDPI stays neutral with regard to jurisdictional claims in published maps and institutional affiliations.

