Article

A Study of Copper (II) Ions Removal by Reverse Osmosis under Various Operating Conditions

by
Ramzi H. Harharah
1,*,
Ghassan M. T. Abdalla
2,
Abubakr Elkhaleefa
1,
Ihab Shigidi
1 and
Hamed N. Harharah
1
1
Department of Chemical Engineering, College of Engineering, King Khalid University, Abha 61421, Saudi Arabia
2
Department of Electrical and Electronic Engineering, Faculty of Engineering, University of Khartoum, Khartoum P.O. Box 10179, Sudan
*
Author to whom correspondence should be addressed.
Separations 2022, 9(6), 155; https://doi.org/10.3390/separations9060155
Submission received: 30 May 2022 / Revised: 15 June 2022 / Accepted: 17 June 2022 / Published: 20 June 2022
(This article belongs to the Special Issue Modeling, Simulation, and Optimization of Membrane Processes)

Abstract

:
The study aims to treat artificial wastewater contaminated with copper (II) ions by reverse osmosis using (SEPA CF042 Membrane Test Skid-TFC BW30XFR). Several concentrations of feedstock were prepared. Different operating pressure, temperature, and flow rate were applied. The effect of these operating conditions on both the amount of Cu (II) removal and the permeate flux was monitored. The results of the study revealed that both the permeate flux and Cu (II) removal amount were directly proportional to the operating pressure and feed temperature but inversely proportional to the feed concentration. In contrast, the feed flow rate showed a negligible effect on the permeate flux and Cu (II) removal amount. The temperature correction factor (TCF) of the membrane was calculated and was found to be directly proportional to the feed temperature but inversely proportional to the applied pressure. It was seen that the concentration and flow rate of that feed did not affect the temperature correction factor. Mathematical models have been developed based on these experimental data for both permeate flux and the Cu (II) removal. It was noted that the permeate flux model matched the experimental data, while the Cu (II) removal model did not show a perfect match. In addition to the above, the research highlights for subsequent studies the possibility of a deep link between experimental work and mathematical models.

1. Introduction

Nowadays, as a result of growing industrialization and urbanization, water is becoming increasingly polluted, where large quantities of contaminants are being released into the environment as a result of physical, chemical, and biological processes. Heavy metals are amongst the most harmful pollutants due to their non-degradable properties. They are toxic and carcinogenic agents that accumulate over time and cause problems to human health and the ecosystem [1].
Copper is one of these heavy metals. It has an atomic weight of 63.5 g/moL and a density of 8.96 g/cm3. It is present in a range of physical and chemical forms in ecosystems, and some are discharged from industrial processes and then accumulate in the environment [2]. Copper (II) in wastewater is discharged from many industries such as the electroplating industry, plastic industry, metal refining and industrial emissions [1]. Long-term exposure to copper irritates the nose, mouth, eyes, headache, stomachache, dizziness and diarrhea. The maximum contamination level (MCLs) of Cu (II) that has been set by the World Health Organization (WHO) is 2 mg/L [3].
Heavy metals such as copper should be eliminated from industrial wastewater before reaching the natural environment, and this can be accomplished through various treatment techniques including chemical precipitation [4], a flotation process [5,6], ion exchange [7,8], electrochemical treatment [9,10], adsorption [11,12,13,14,15] and membrane filtration [16,17,18,19,20,21,22,23]. Each of these methods has disadvantages and some limitations.
Membrane technology is an efficient process for wastewater treatment and has more advantages than other methods. It is a compact system, economically feasible and can be employed on large scales [24]. Reverse osmosis (RO) membranes are considered the most effective process for heavy metal removal due to their higher degree of purification and high rejection level of contaminates. RO has a wide range of applications including drinking water desalination from seawater, wastewater recycling and industrial process water purification [25].
Several studies have been conducted on the performance of the reverse osmosis membrane under different operating conditions in terms of pressure, flow rate [26], concentration and temperature [27]. Mostafa Ansari found that the permeate flux is directly proportional to feed pressure and negatively dependent on feed concentration [28].
The removal of copper (II) ions using RO membrane under various operating conditions has been studied by many researchers. Ahmed Algureiri concluded that the removal efficiency and the permeate flux were directly proportional to applied pressure, pH, feed temperature and feed flow rate, but were inversely to feed concentration, and the maximum Cu (II) rejection obtained was 96% [23]. Haider Aljendeel found that as the feed concentration increases, so does the permeate concentration, while water flow, recovery %, rejection % and mass transfer coefficient decrease, and the maximum Cu (II) rejection was 96.6%, while the maximum recovery percentage of 40.8% [21]. Table 1 summarizes studies on copper (II) ions removal using the membrane technique.
The temperature of the feed water is an important factor in the performance of the reverse osmosis membranes [29]. The higher the temperature, the higher the flow of permeate, this is due to the reduction in the solution’s viscosity and the increase in the diffusivity on the membrane surface [30].
This paper aims to study the removal of copper (II) ions by reverse osmosis using SEPA CF042 Membrane Test Skid-TFC BW30XFR under different operating pressures, temperatures, feed concentrations and feed flow rates. The temperature correction factor (TCF) was studied. This important factor, which has rarely been investigated, is related to the alternating operating conditions in a novel approach. Moreover, mathematical models were developed to predict the impact of the tested parameters and were validated with the experimental data, which are considered the novelty of this work.

2. Materials and Methods

2.1. Artificial Wastewater Preparation

A copper stock solution of 2000 (mg/L) was prepared from copper sulfate pentahydrate salt (CuSO4·5H2O) pharma-grade assay 99.0–100% obtained from Panreac Co. (Milano, Italy), and then diluted copper solutions were prepared to concentrations of 25, 50, 100 and 150 (mg/L).

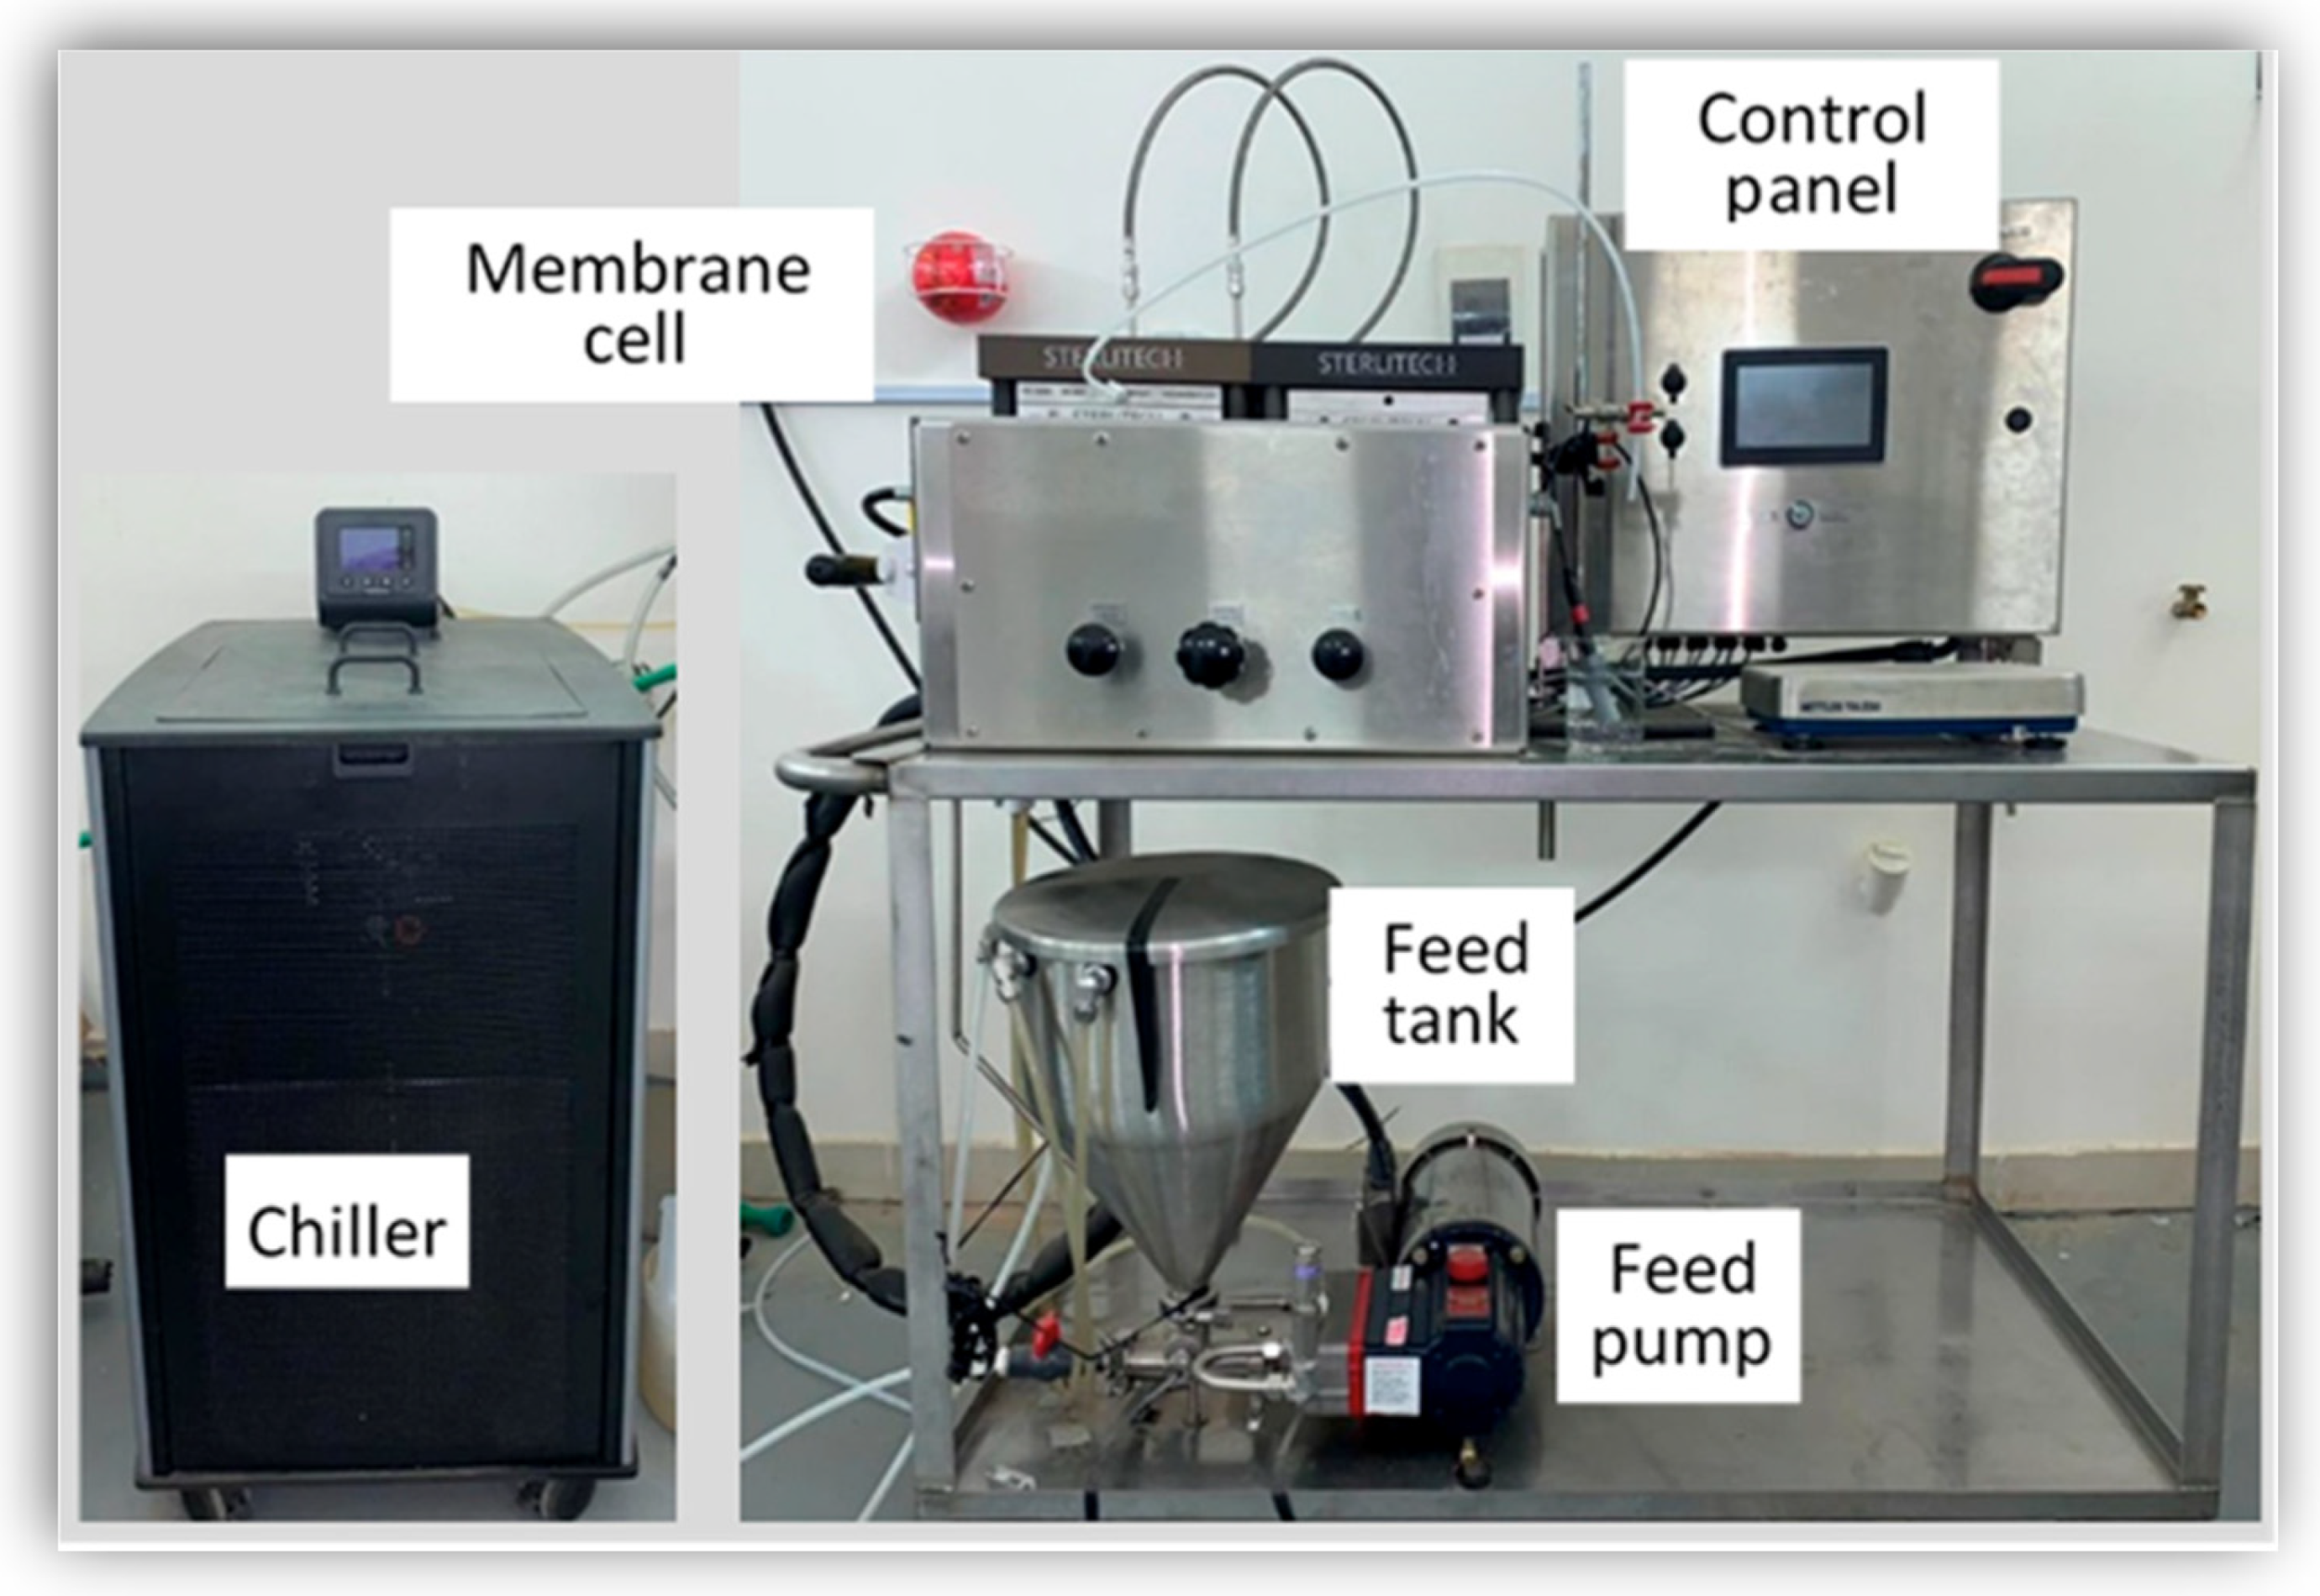
2.2. RO Membrane Setup

Experiments were conducted using (SEPA CF 042 Membrane Test Skid) from Sterlitech Co (Auburn, Al, USA)., which is a crossflow filtration unit that uses membranes for RO processes. The flat sheet membrane used in the device was Dow Polyamide TFC BW30XFR, with a pH range from 2–11, molecular weight cutoff (MWCO) of 100 Da with an effective membrane area of 140 cm2 (Figure 1).

2.3. Test Method

The experimental tests were performed on feed solutions of concentrations 25, 50, 100, and 150 ppm and operating pressures of 10, 20, 30 and 40 bar with regulated feed flow rates of 2, 3.2 and 4.4 L/min, while the temperature was gradually varied between 25, 35 and 45 °C. Every 10 min, the permeate water was collected and weighed to obtain the mass of permeate that would then be used to calculate the permeate flux and the metal rejection. The permeate and retentate water were continuously returned to the feed tank to maintain the feed concentration. A new membrane was replaced for each different feed concentration. The device was cleaned by running distilled water for at least 10 min before starting the new feed concentration. The product water samples were analyzed using a total dissolved solids (TDS) meter (VSTAR20, Thermo Scientific, Waltham, MA, USA).

2.4. Theoretical Calculations

The permeate flux is determined by Equation (1):
J p = m P   t × A M  
where: J p = The permeate flux (kg/h·m2), m P = the permeate mass (kg), t = process time (h), A M = the membrane surface area (m2)
Heavy metal rejection is determined using Equation (2):
R   % = [ 1   C P     C F   ] × 100 %
where: R   % = the metal rejection (percentage), C P = the concentration in permeate (ppm), C F = the concentration in feed solution (ppm).

3. Results and Discussion

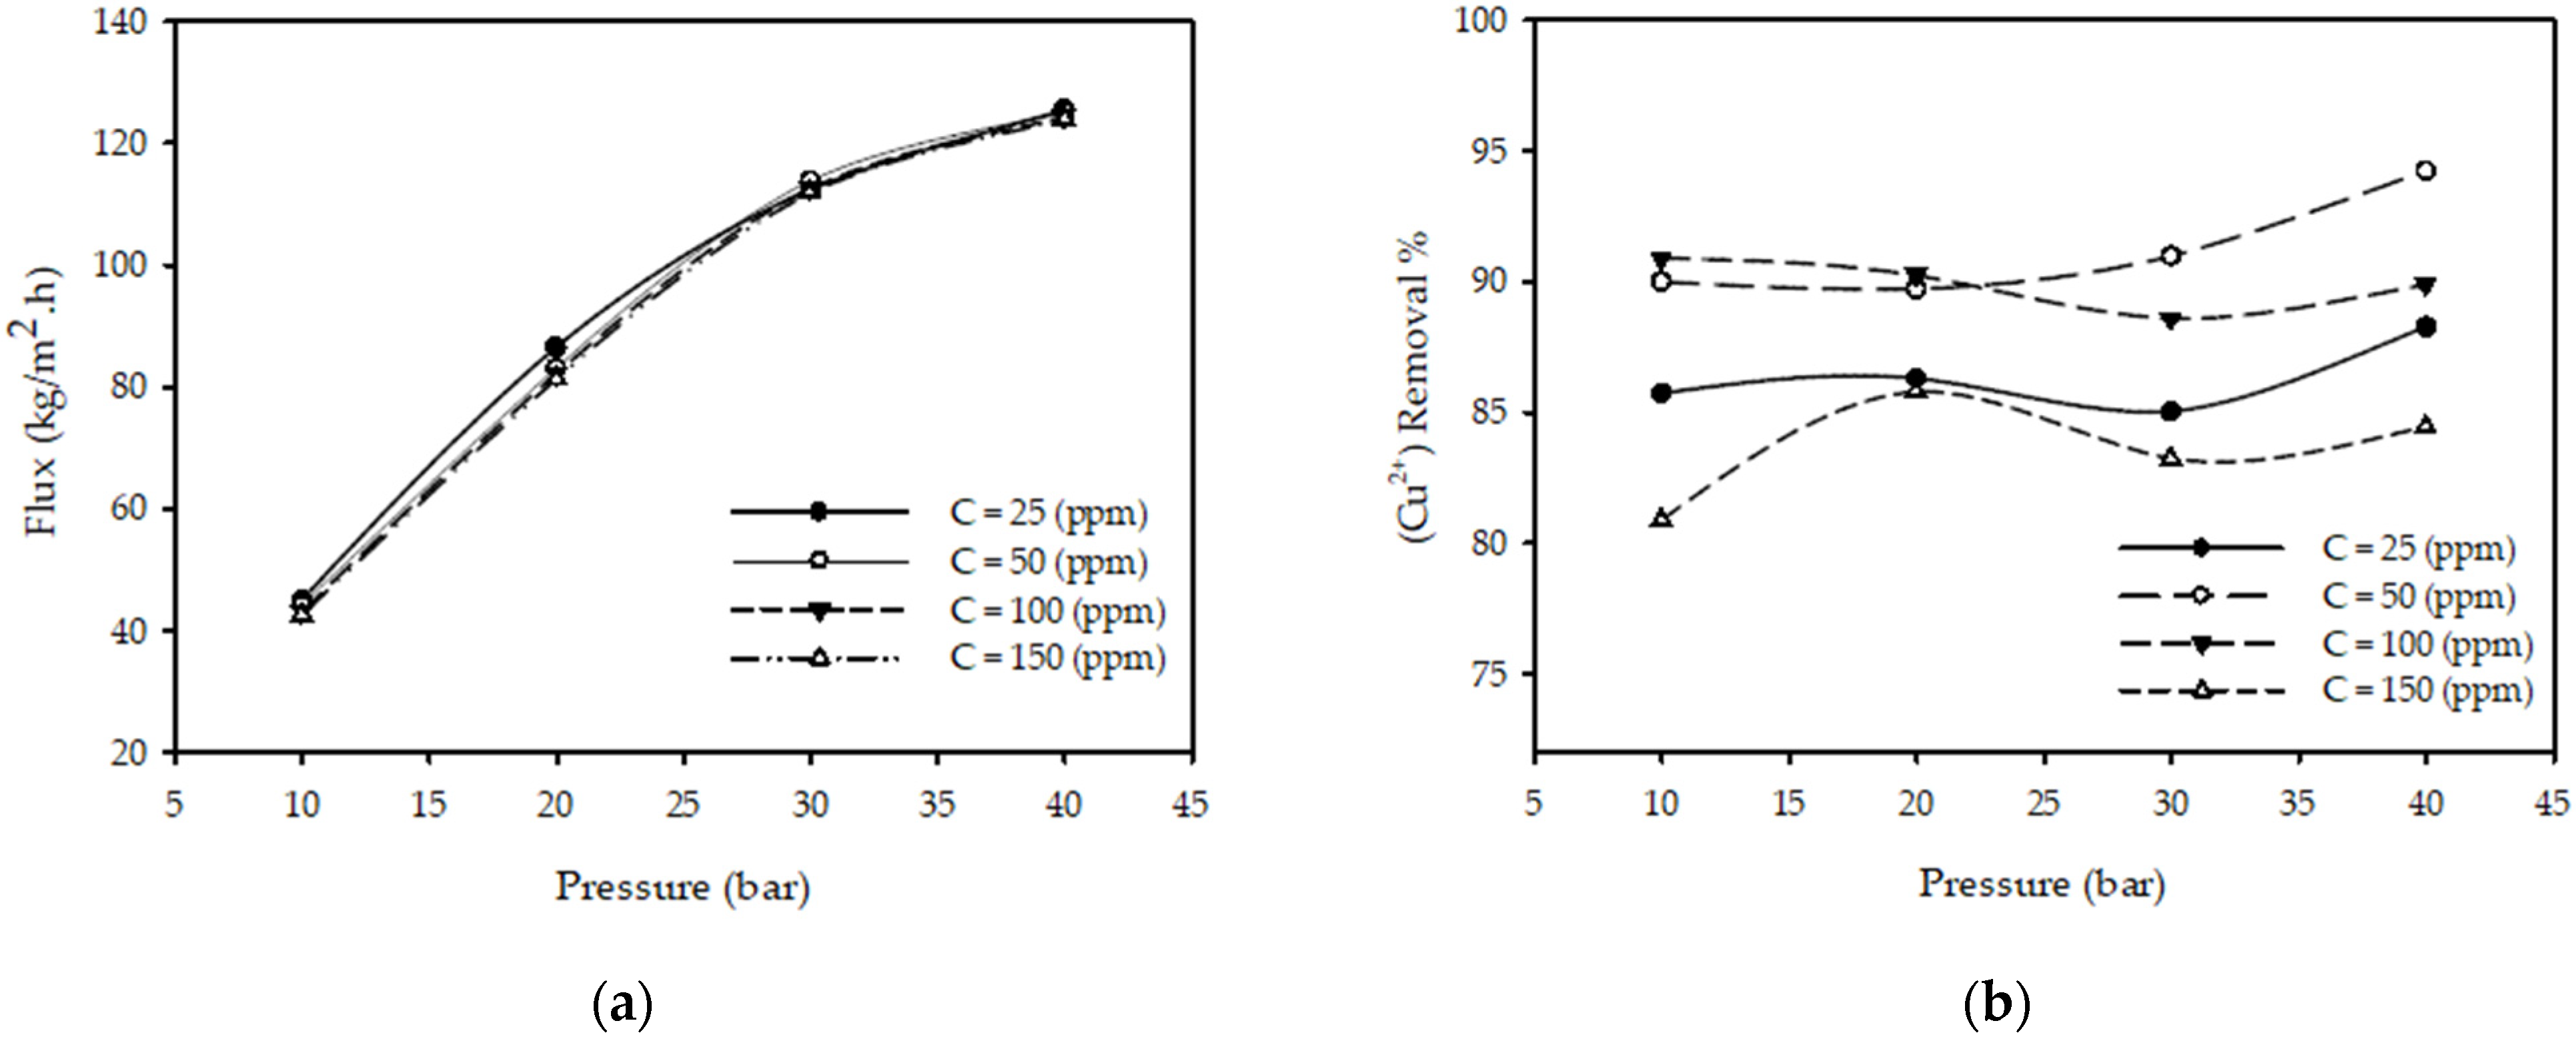
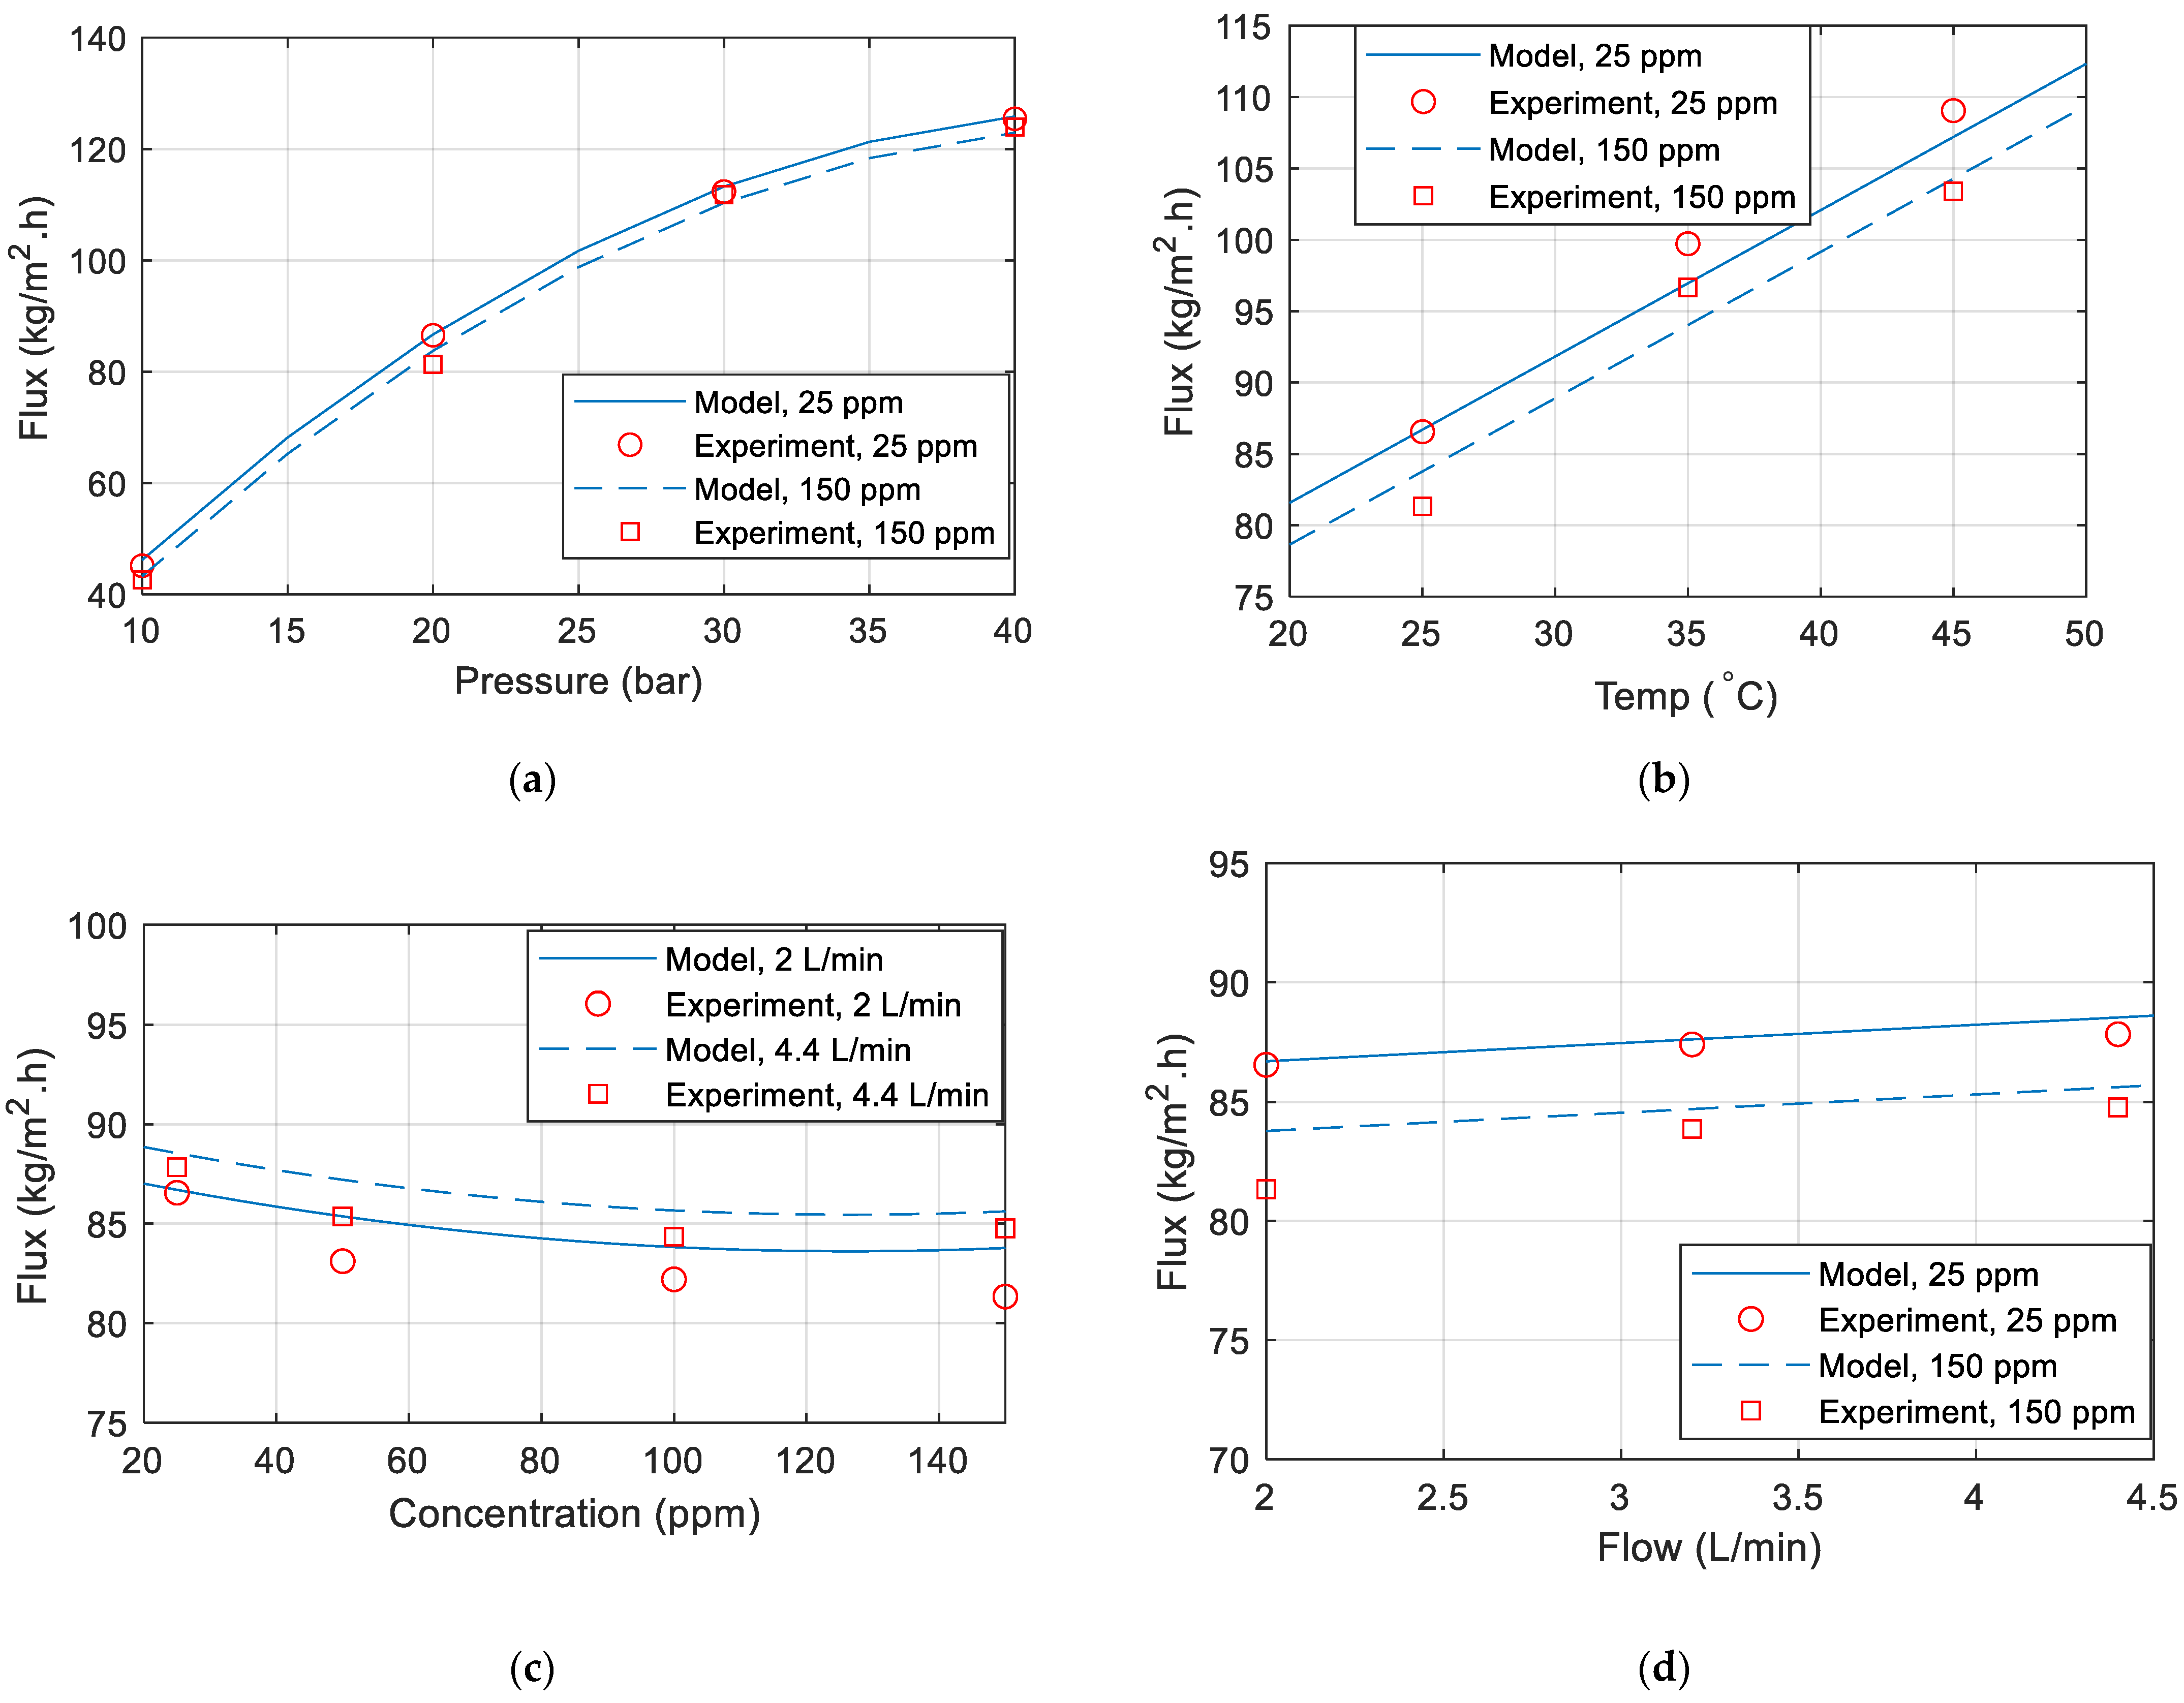
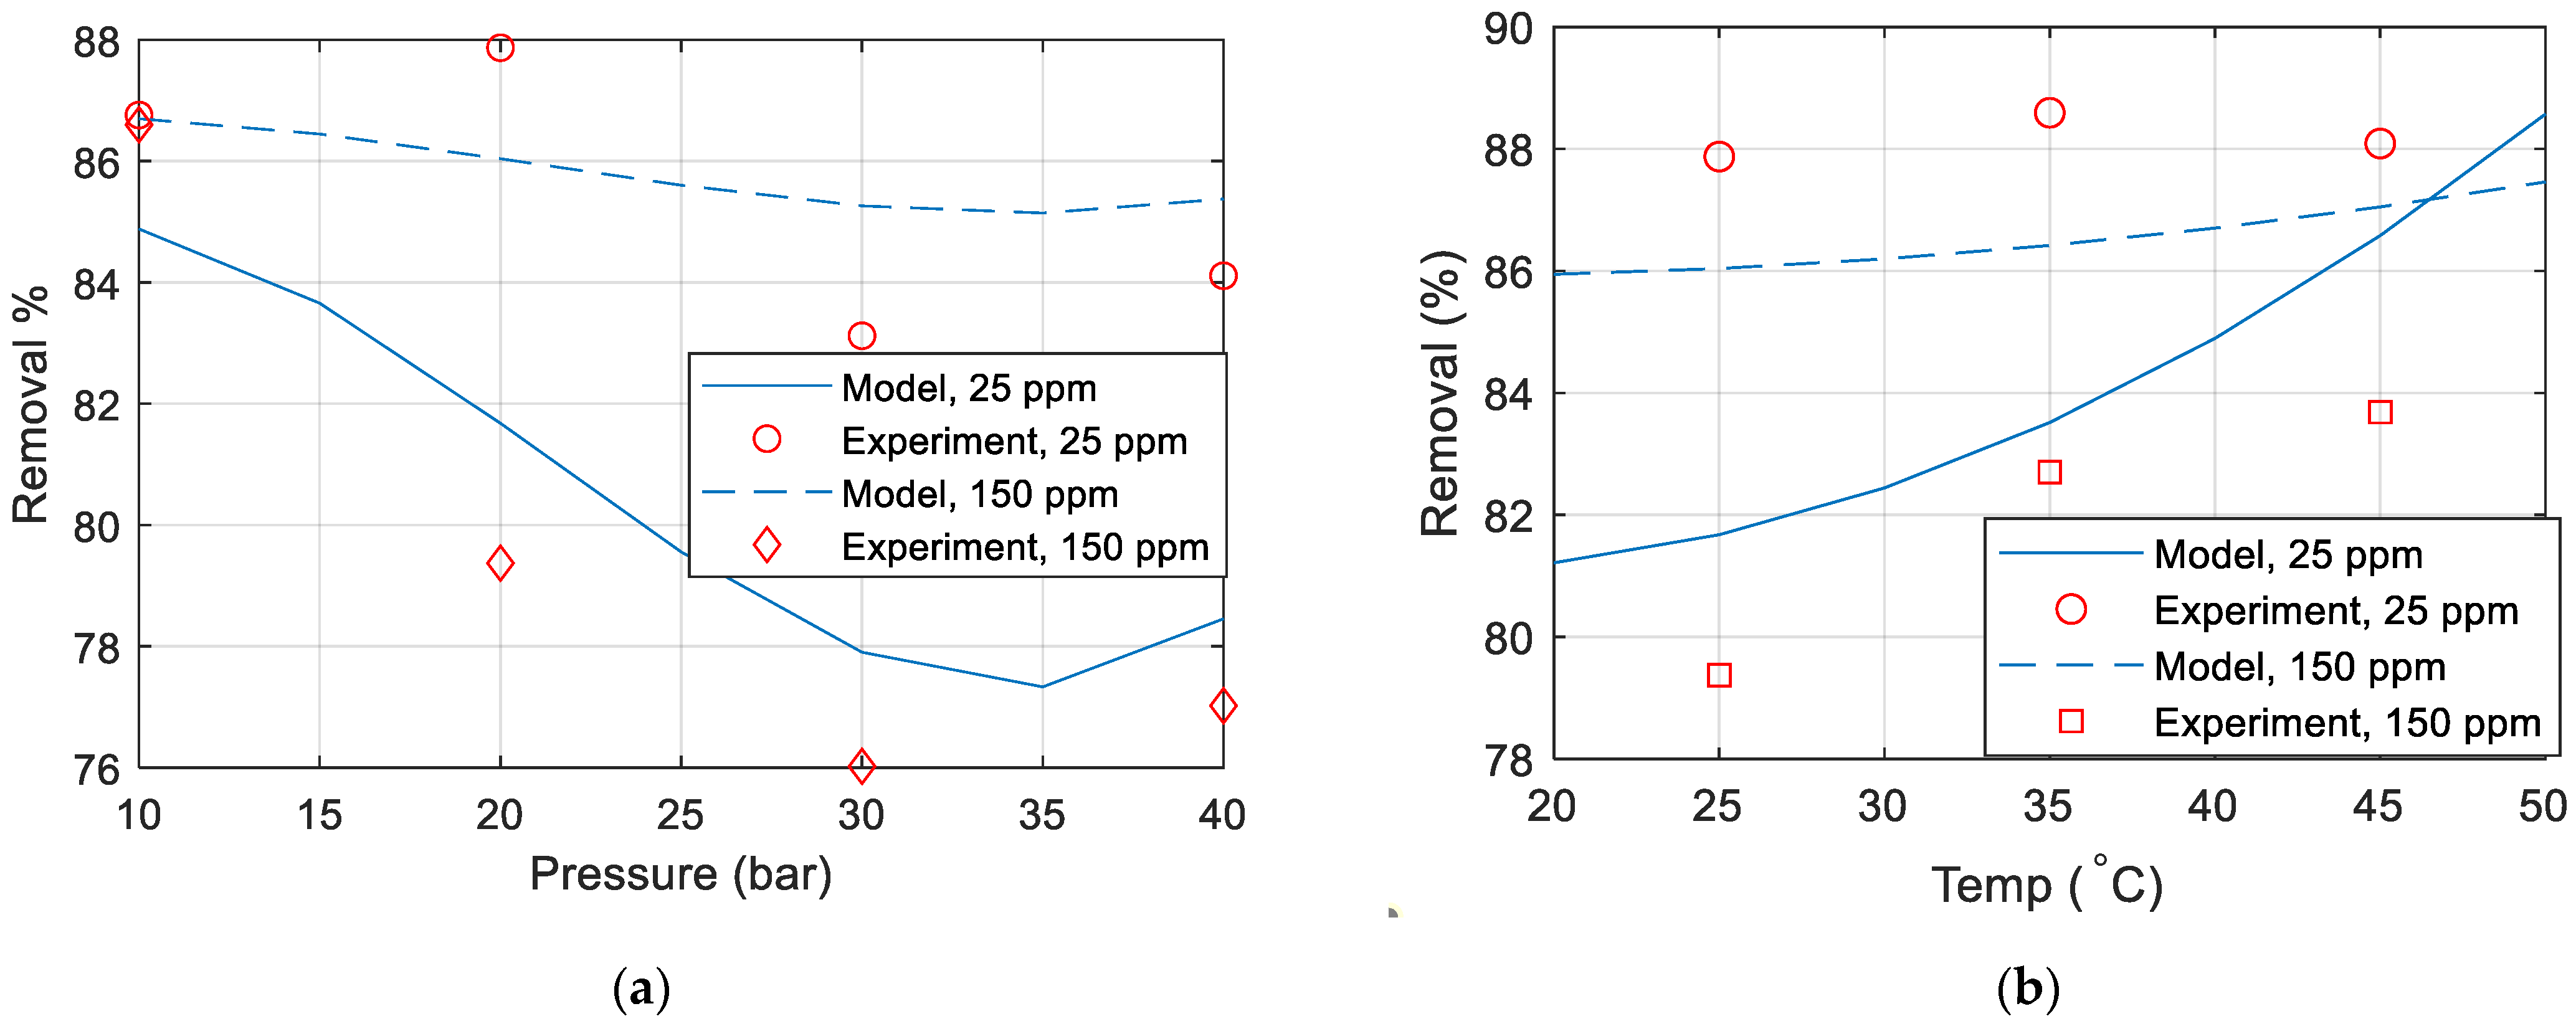
3.1. Effect of Operating Pressure

Figure 2a illustrates the influence of pressure on the permeate flux for different feed concentrations with a fixed feed flow rate and feed temperature. The results show that when the pressure increases from 10 to 40 (bar) while keeping the other parameters constant (T = 25 °C, QF = 2 L/min, CF = 50 ppm), the permeate flux increased 180% from 44.28 to 124.98 kg/m2·h. Permeate flux increased 88 % when the pressure increased from 10 to 20 (bar) and 37% when the pressure increased from 20 to 30 (bar) and 10% when the pressure increased from 30 to 40 (bar) for all tested concentrations. The justification for this is the increase in the amount of solute across the membrane, which acts as a driving force. These results are in close agreement with those presented in the literature [23,31,32,33], concluding that the permeate flux increases with pressure increases.
Figure 2b illustrates the influence of the operating pressure on the copper ions removal % on different feed concentrations at a fixed feed flow rate and temperature. The results show that when the pressure increases from 10 to 40 (bar) with other parameters constant (T = 25 °C, CF = 50 ppm, QF = 3.2 L/min), the (Cu2+) removal % increases from 89.98 to 94.21%; this is due to more polarization of metal ions on the membrane and a decrease in permeate concentration. These results are in close agreement with those presented in the literature [23,32,33], concluding that the removal % of metal ions increases as pressure increases.

3.2. Effect of Feed Temperature

Figure 3a illustrates the influence of temperature on permeate flux for various feed concentrations and a constant feed flow and pressure. The results show that when the temperature increased from 25 to 45 °C with other constant parameters (P = 10 bar, QF = 3.2 L/min, CF = 50 ppm), the permeate flux increased 45% from 46.12 to 67.0 (kg/m2·h) (permeate flux is increasing 2% every 1 °C); this is due to the reduction in the solution viscosity and changes in the physical properties of the polymeric membrane, such as pore size or diffusivity [34]. These results are consistent with those reported in the literature [23,31,35], concluding that the permeate flux increases with the increase in temperature.
Figure 3b illustrates the influence of temperature on the (Cu2+) removal % for various feed concentrations and a constant feed flow and pressure. The results show that when the temperature increases from 25 to 45 °C while keeping the other parameters constant (P = 10 bar, CF = 50 ppm, QF = 3.2 L/min), the (Cu2+) removal % slightly increased from 89.98 to 91.05%. These results are consistent with those reported in the literature [23,35], concluding that the removal % of metal ions increases with the increase in temperature.

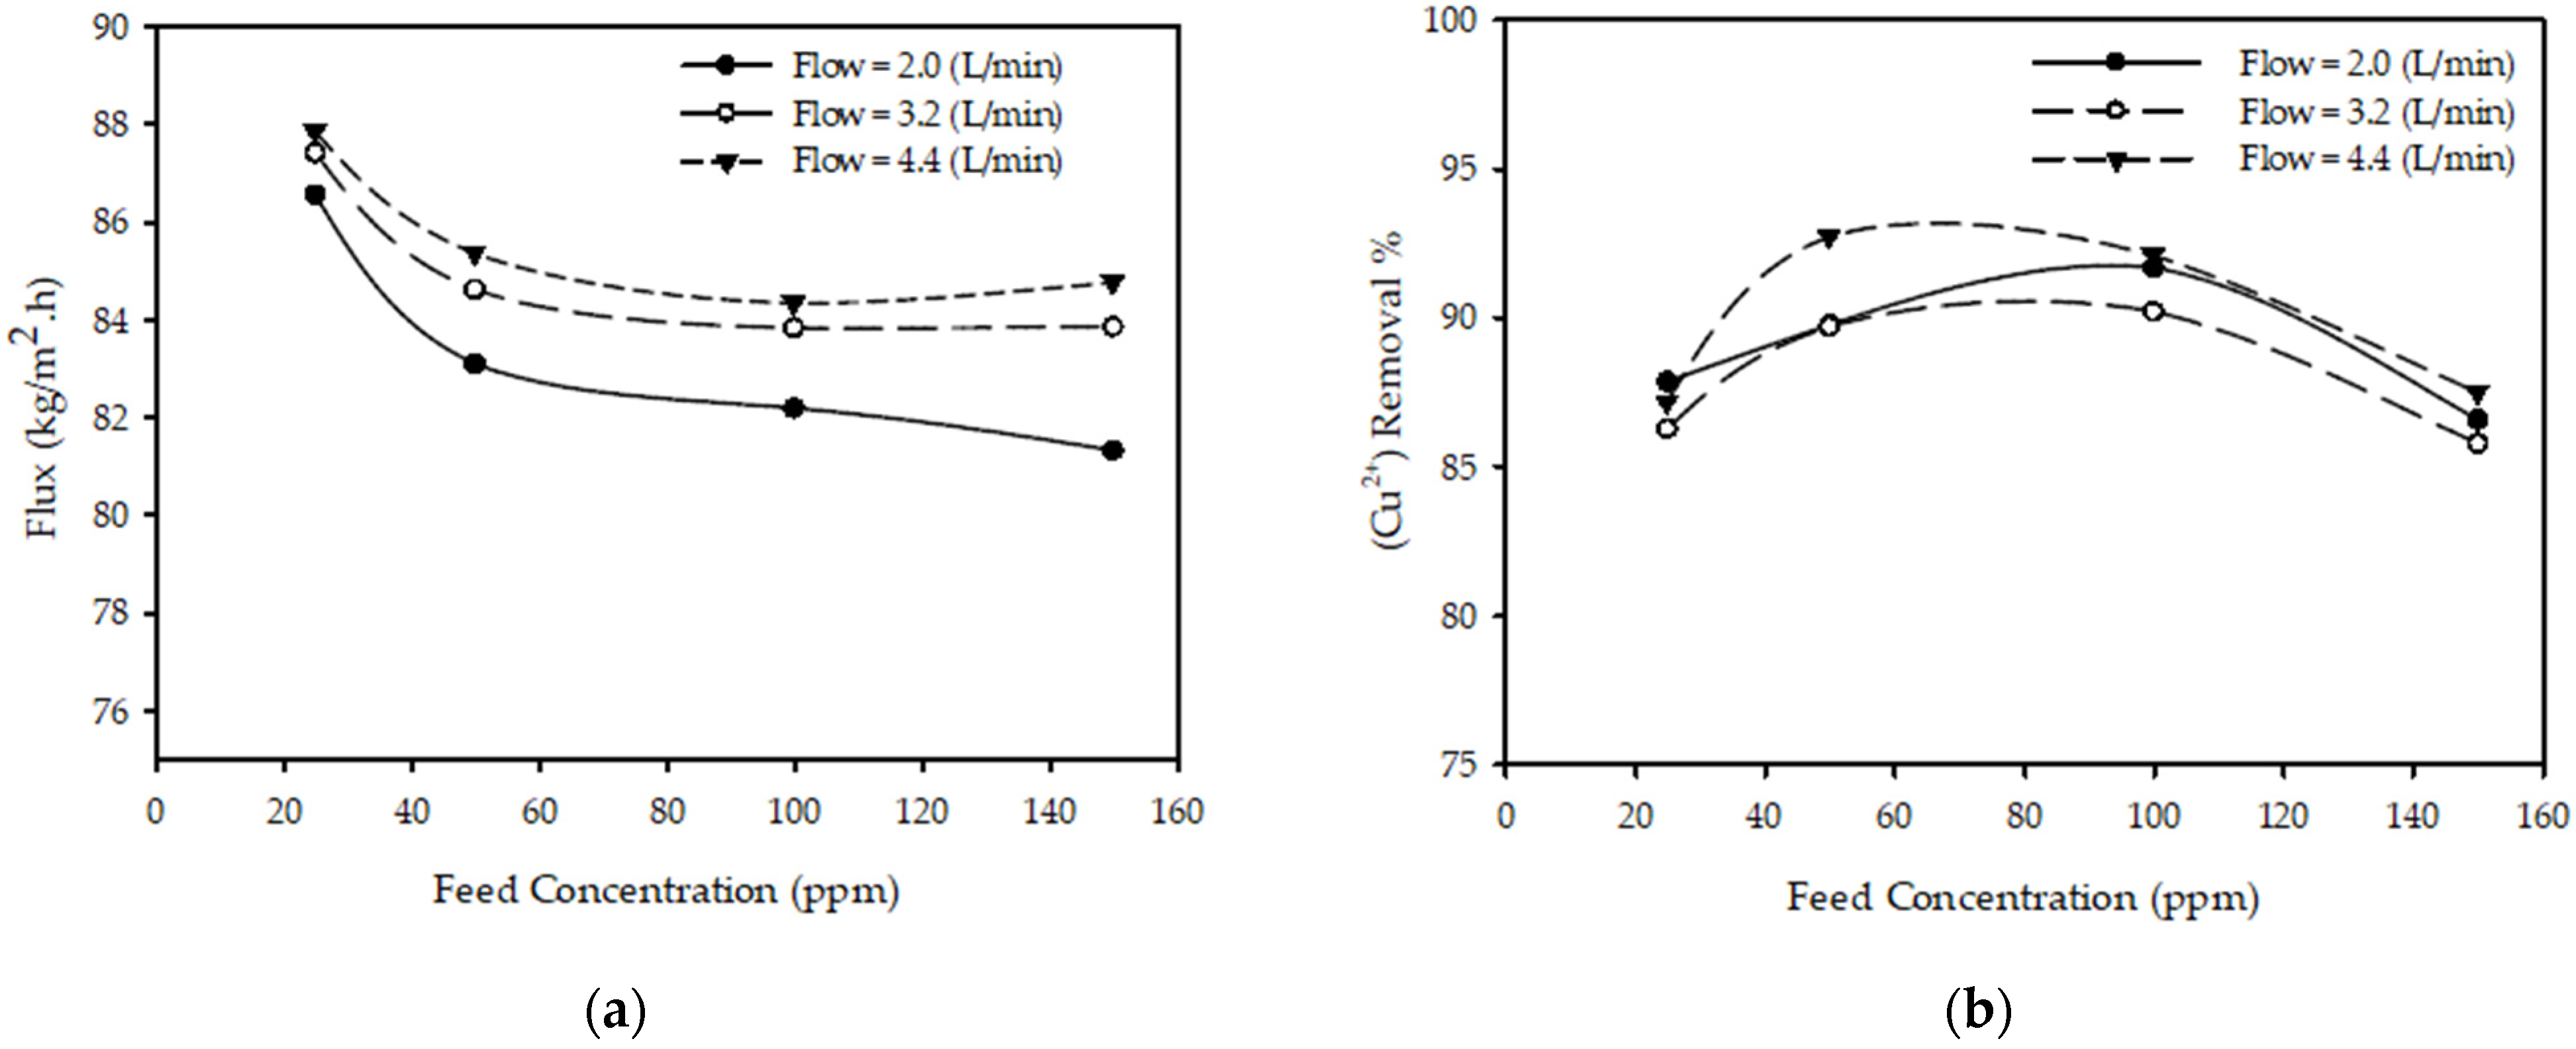
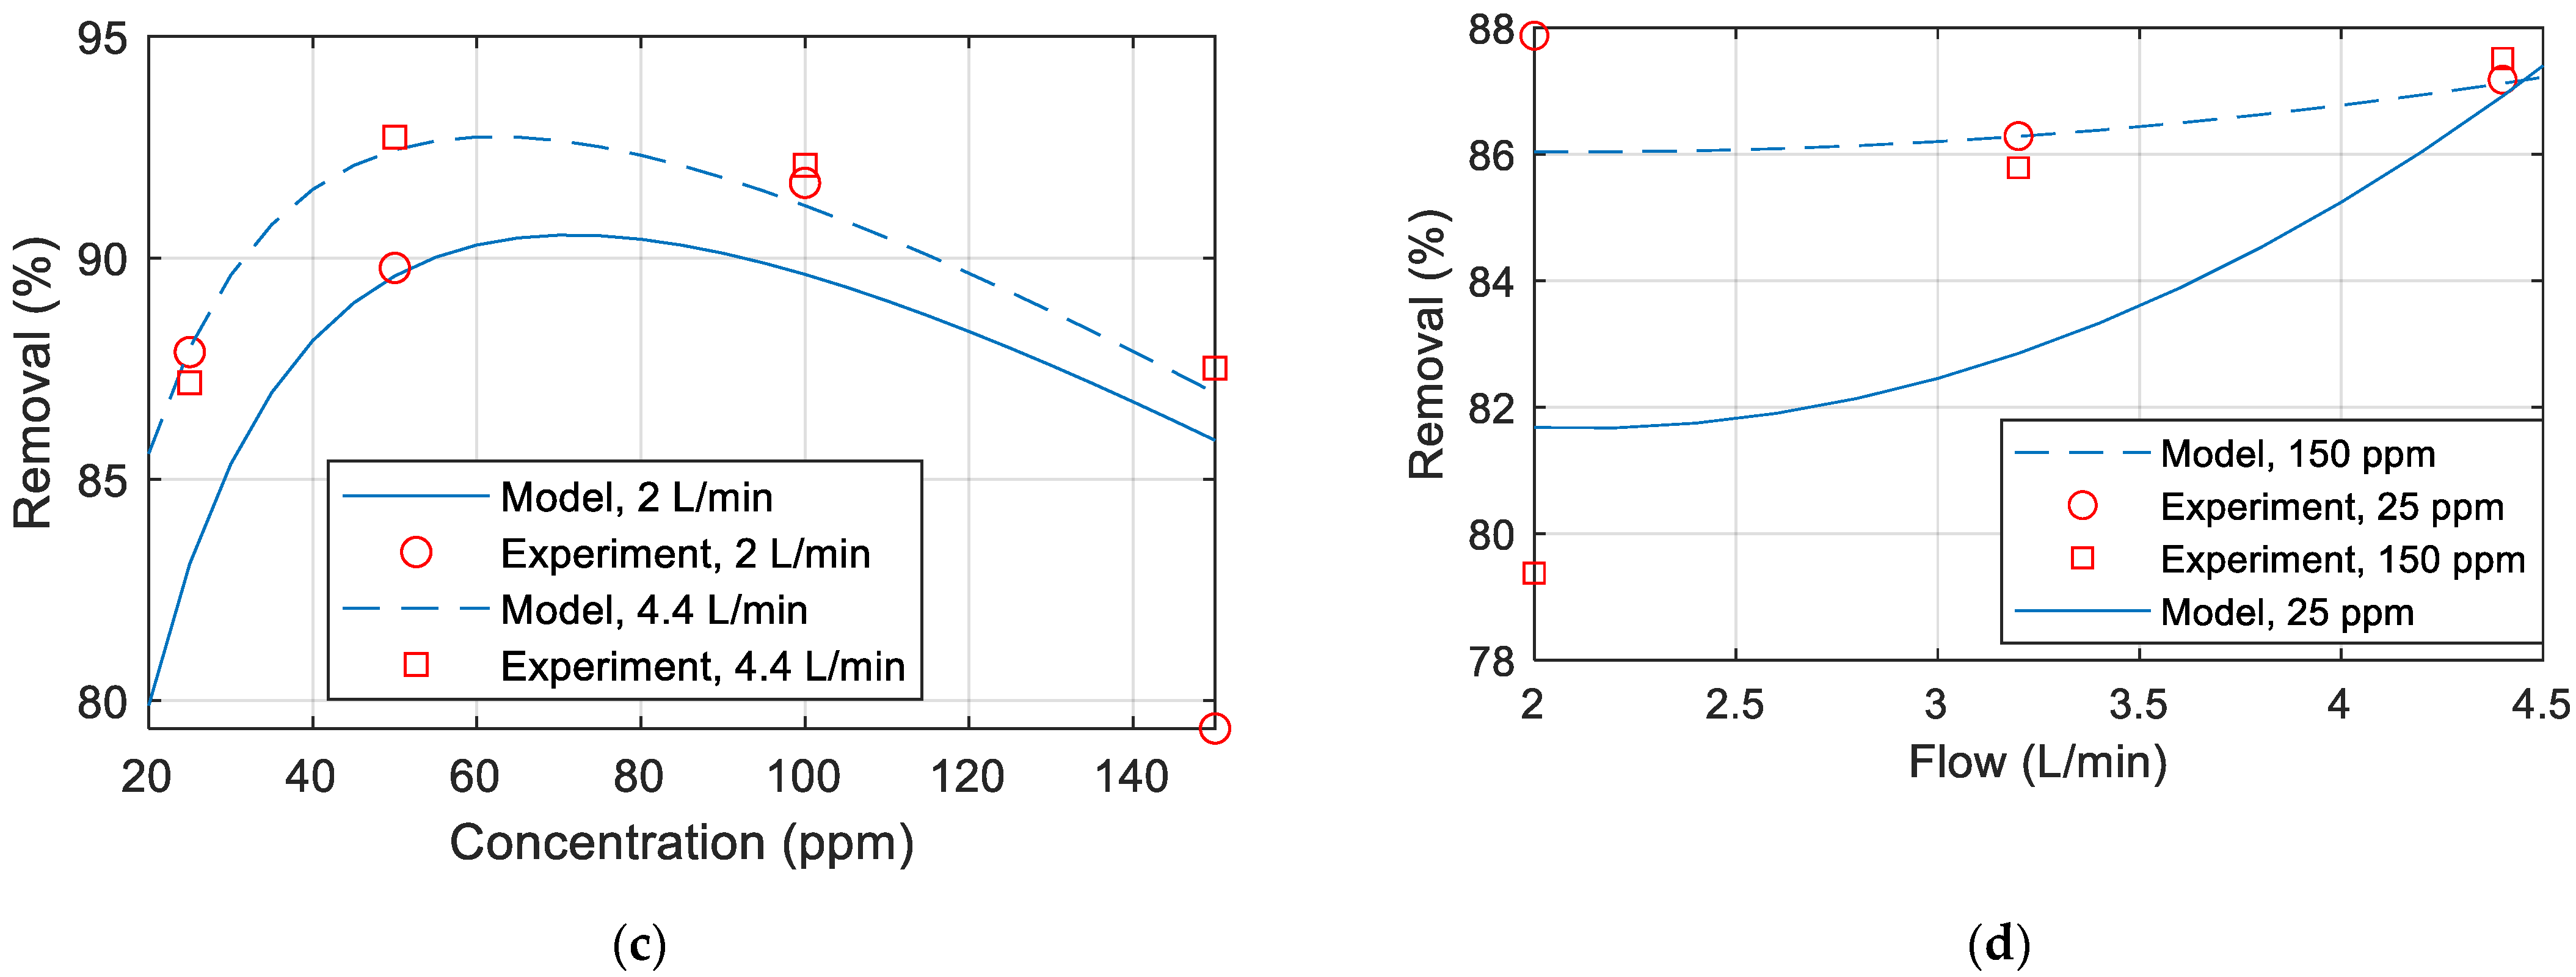
3.3. Effect of Feed Concentration

Figure 4a shows the effect of feed concentration on the permeate flux for different feed flow rates with fixed pressure and feed temperature. The results show that as the feed concentration increases from 25 to 150 (ppm) with other parameters constant (T = 25 °C, P = 20 bar, QF = 3.2 L/min), the permeate flux decreased 4.2% from 87.41 to 83.86 (kg/m2·h). This is due to the increasing resistance of solution across the membrane due to increased concentration polarization on the membrane surface. These findings are consistent with those reported in the literature [23,33], stating that the permeate flux decreases as the feed concentration increases.
Figure 4b shows the effect of feed concentration on the (Cu2+) removal % for different feed flow rates at a fixed pressure and feed temperature. The results show that when the feed concentration increases from 50 to 150 with other parameters constant (T = 25 °C, P = 20 bar, QF = 2 L/min), the (Cu2+) removal % decreased from 89.77 to 86.60%. This is due to increased concentration polarization on the membrane surface. These findings are consistent with those presented in the literature [23,31,33], concluding that the removal % of metal ions decreases as the feed concentration increases.

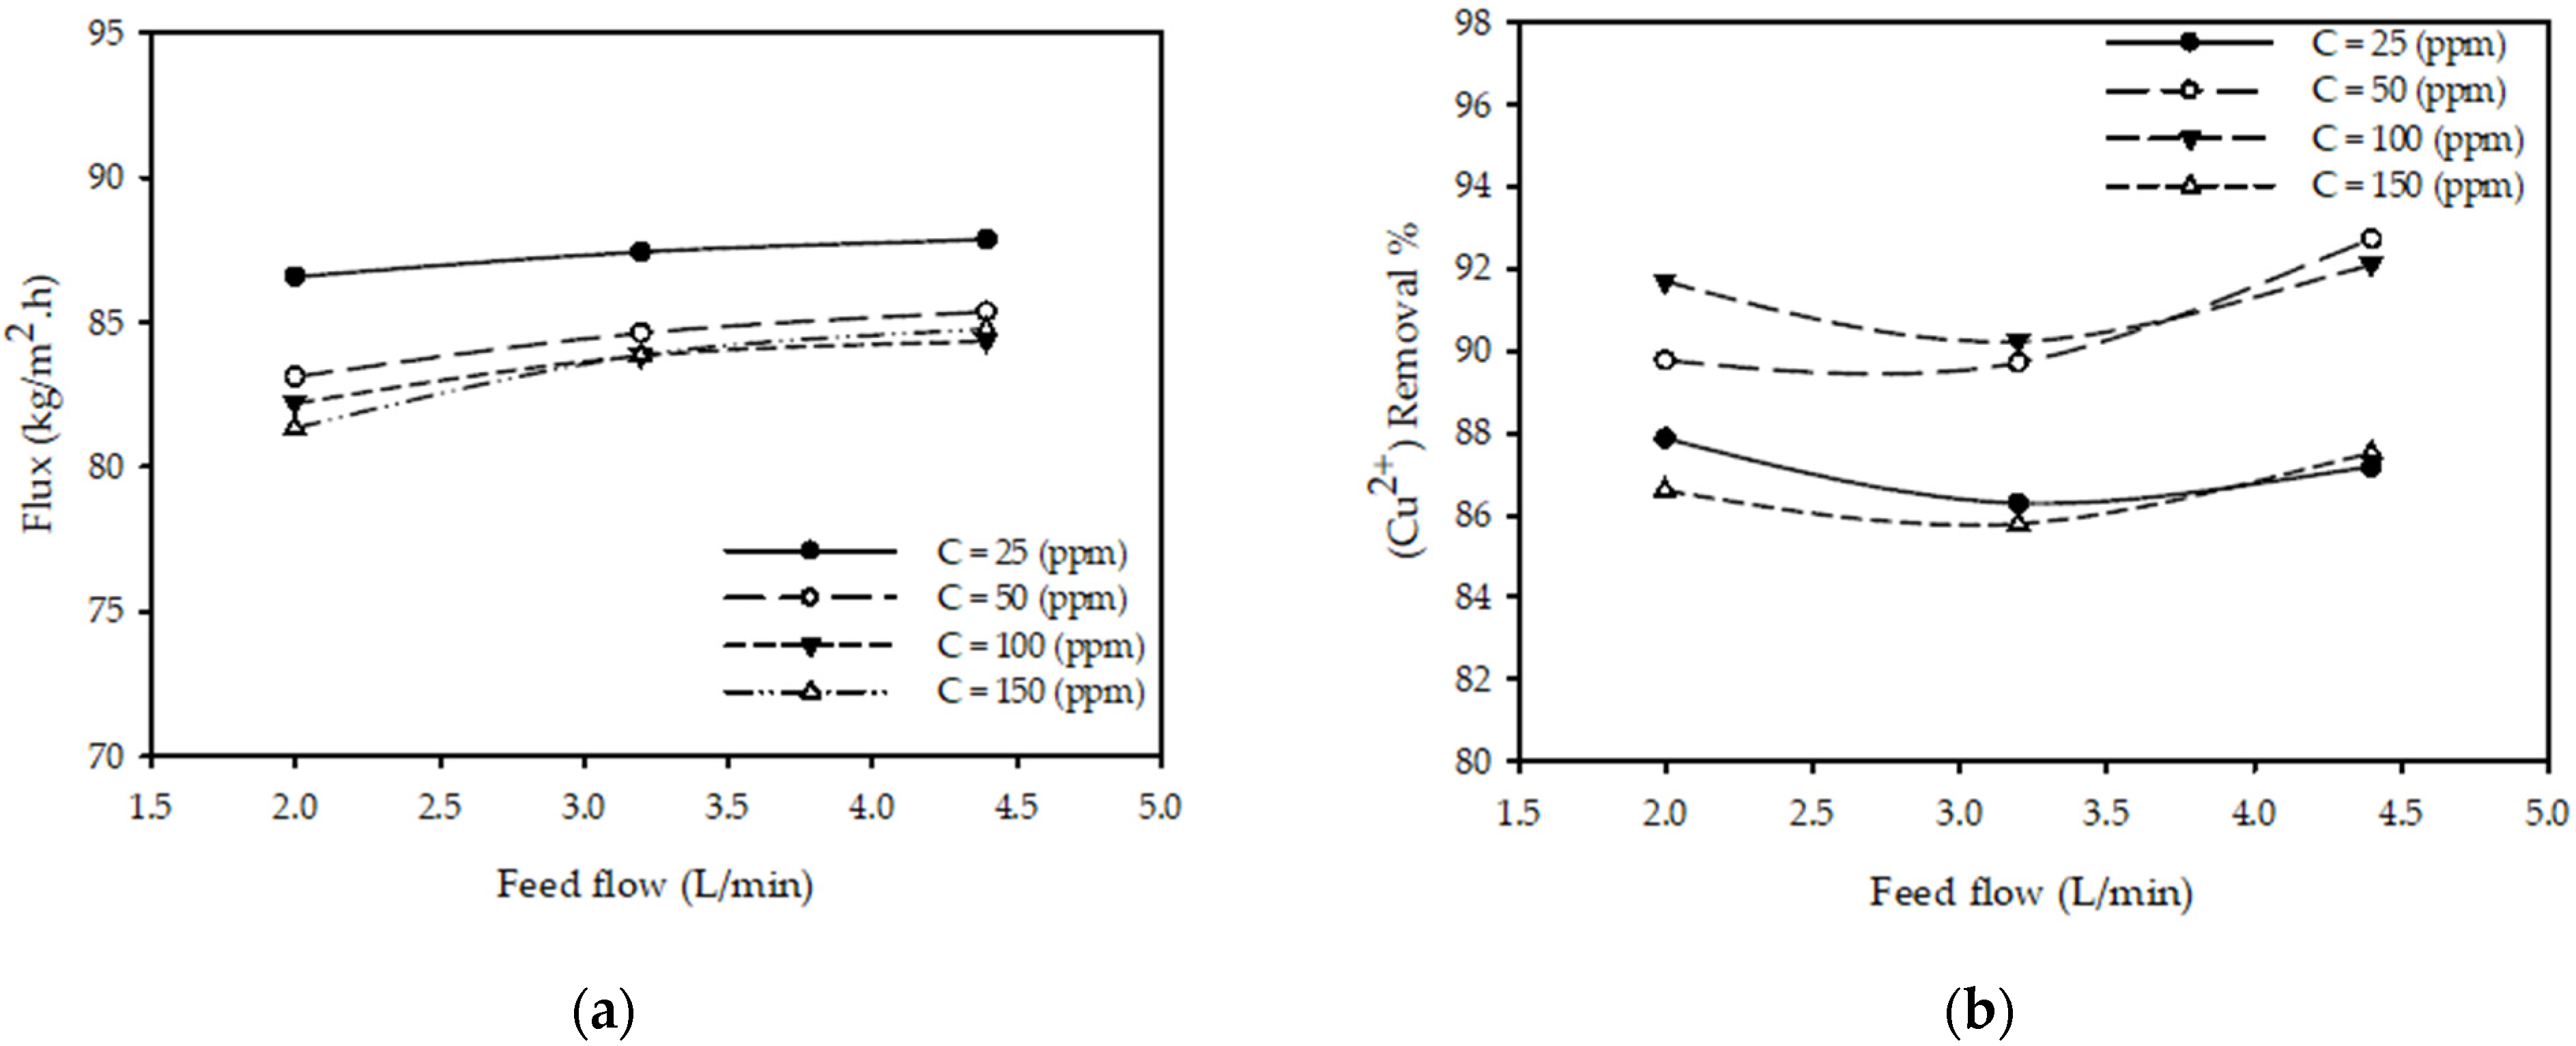
3.4. Effect of Feed Flow Rate

Figure 5a shows the impact of feed flow rate on permeate flux for various feed concentrations at constant pressure and temperature. The results show that as the feed flow rate increases from 2 to 4.4 (L/min), there is a slight increase in the permeate flux for all tested concentrations (25, 50, 100 and 150 ppm). The permeate flux increased 2.5% from 82.2 (kg/m2·h) for a flow of 2 (L/min) to 84.3 (kg/m2·h) when the flow changed to 4.4 (L/min) while keeping all other parameters constant (T = 25 °C, P = 20 bar, CF =100 ppm). These results are consistent with those reported in the literature [23], concluding that the permeate flux increases with the increases in the feed flow rate.
Figure 5b shows the impact of feed flow rate on the (Cu2+) removal % for various feed concentrations at constant pressure and temperature. The results show that when the feed flow rate increases from 2 to 4.4 (L/min), there is a negligible impact on (Cu2+) removal % for all tested concentrations. The (Cu2+) removal % increased by less than 0.5%, from 91.7 to 92.1%, when the flow was varied from 2 to 4.4 (L/min) with other parameters constant (T = 25 °C, P = 20 bar, CF =100 ppm).

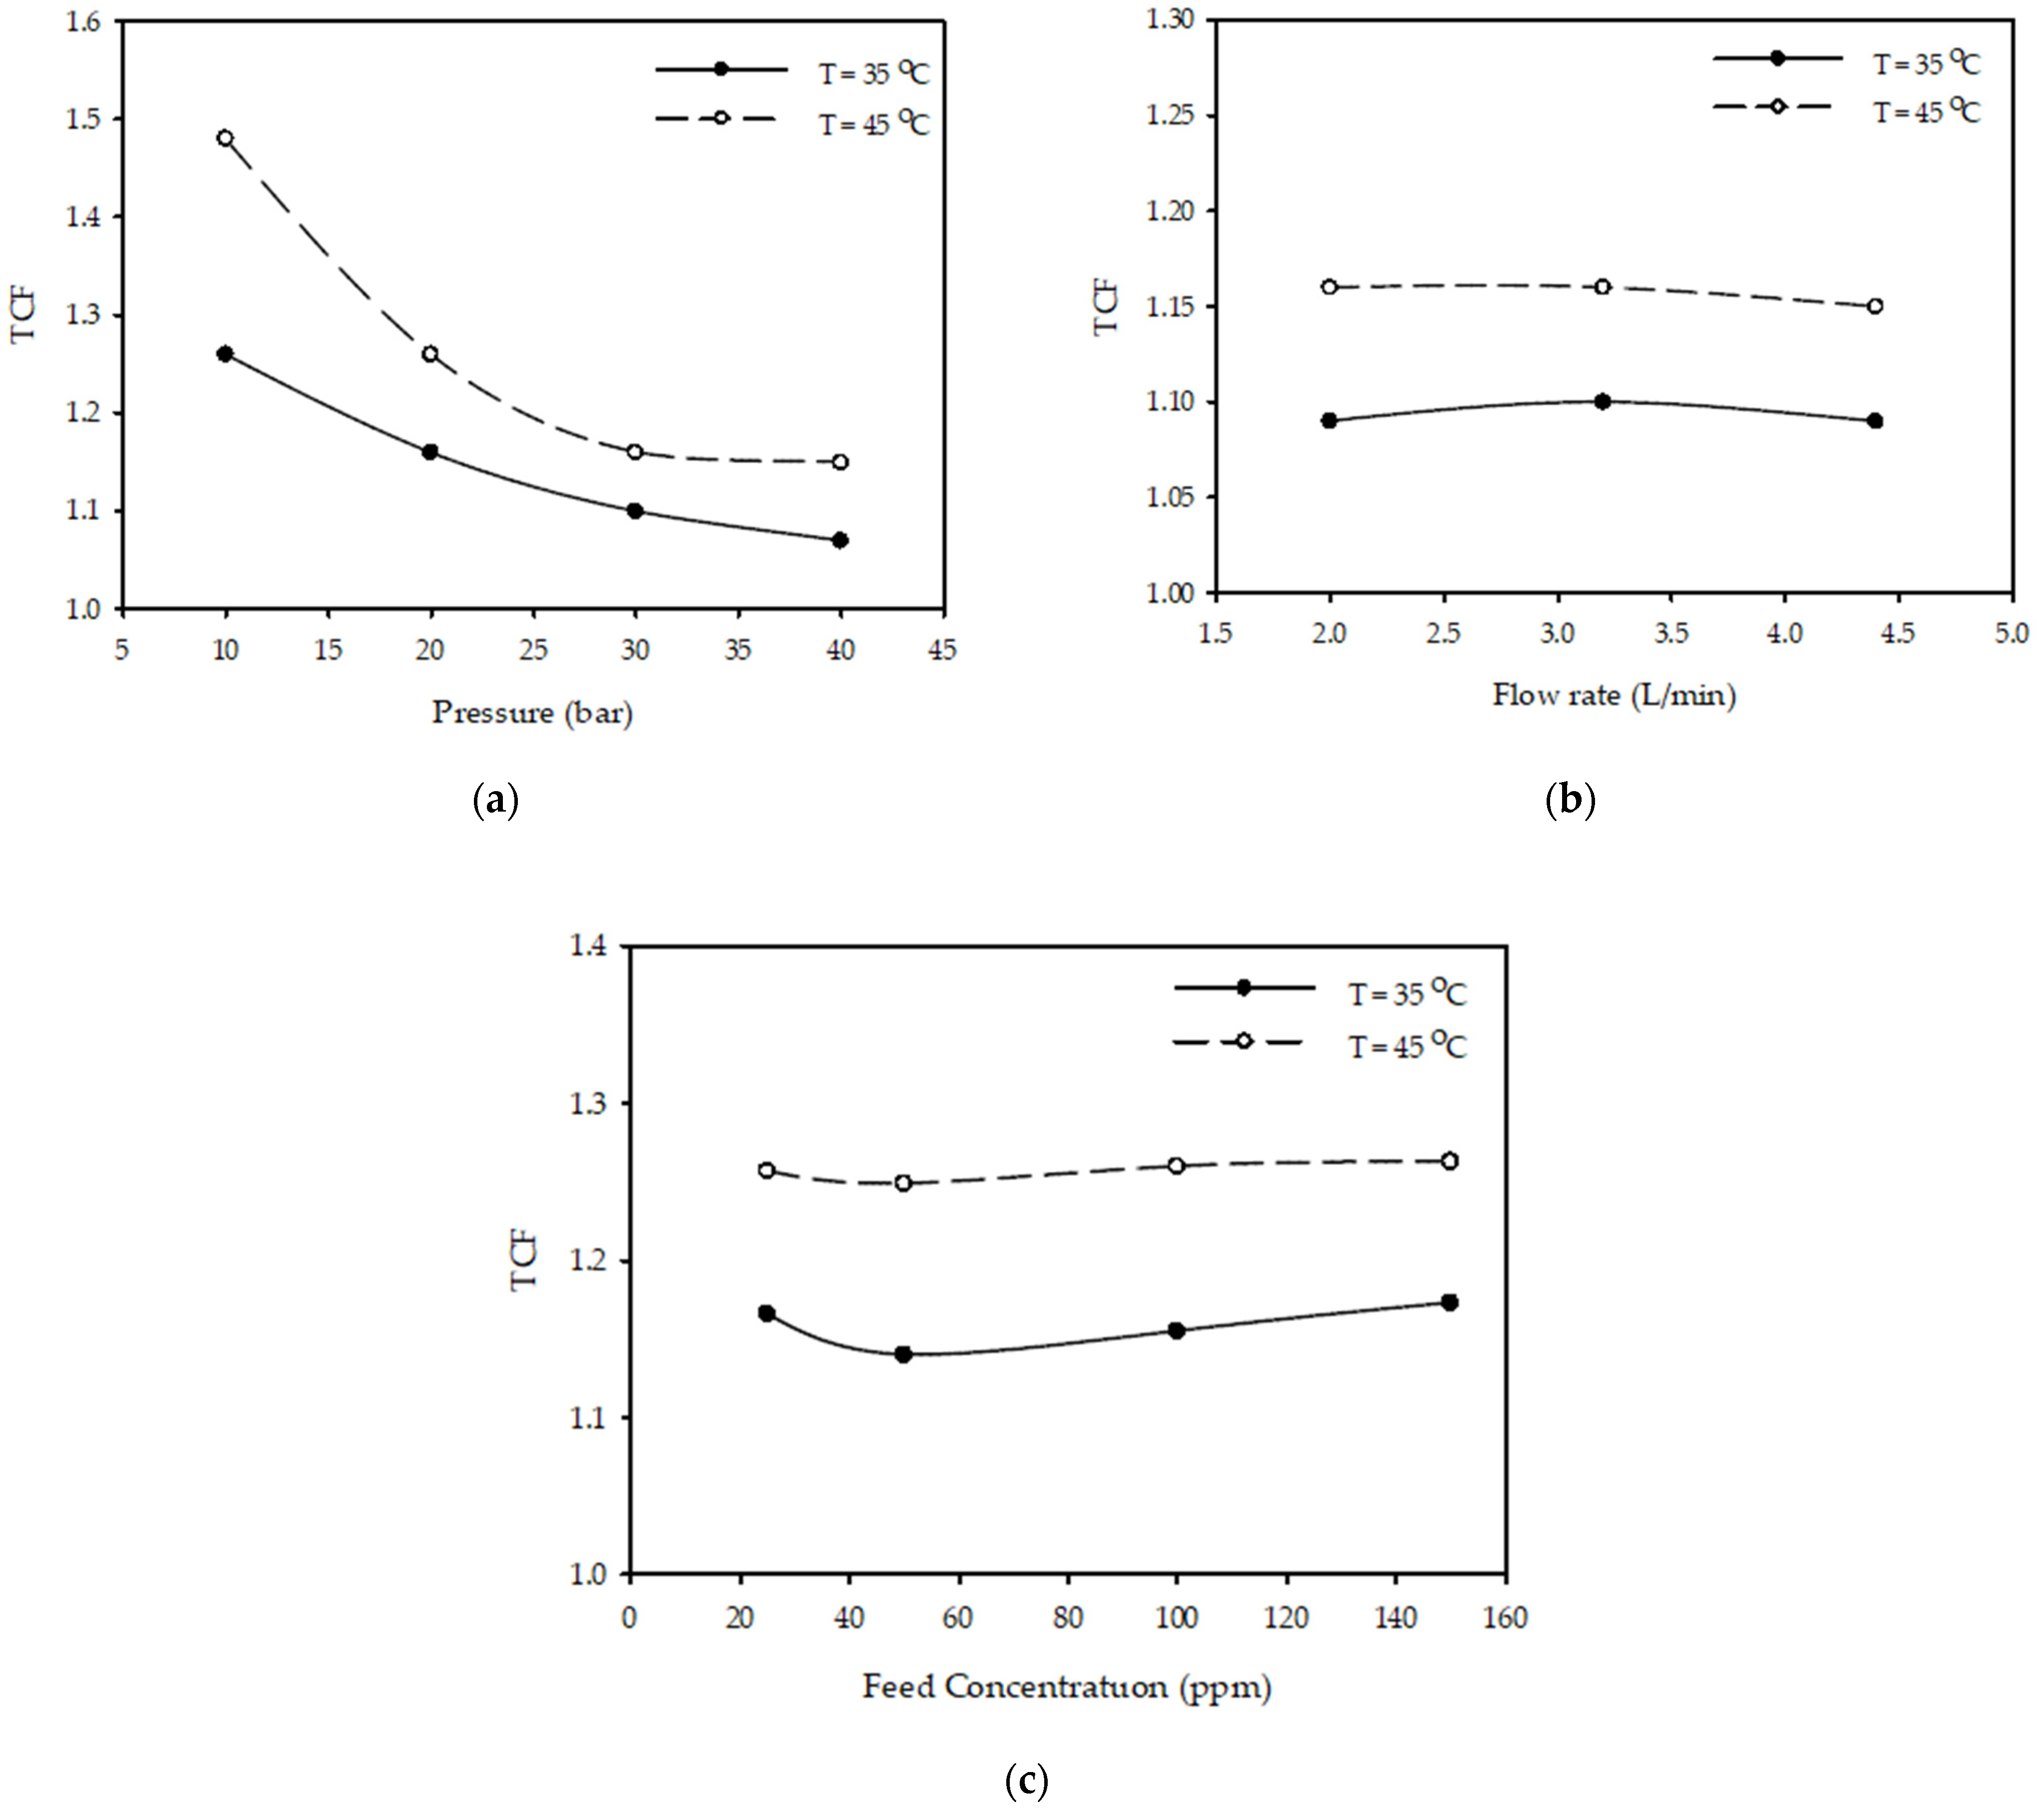
3.5. Temperature Correction Factor (TCF)

The temperature correction factor (TCF) governs the change in permeate flux with temperature according to Equation (3):
TCF = Permeate   flux   at   t   ( ° C ) Permeate   flux   at   25   ( ° C )
Table 2 shows the effect of temperature on the calculated TCF for 100 ppm feed concentration at different operating pressure and flow rates. The results show that there is a significant increase in the TCF as the temperature increases, which can thus lead to the conclusion of having a higher permeate flux. These results are in close agreement with those reported in the literature [30,31].
Figure 6a shows the effect of pressure on TCF at different temperatures for a constant flow rate of 3.2 (L/min) and feed concentration of 100 (ppm). The results show that as pressure increases from 10 to 40 (bar), TCF decreased 18% from 1.26 to 1.07 when the temperature was 35 °C and decreased 29% from 1.48 to 1.15 when the temperature was 45 °C.
Figure 6b illustrates the influence of flow rate on TCF at various temperatures with a constant pressure of 30 bar and a feed concentration of 100 (ppm). The results demonstrate that increasing the feed flow rate from 2 to 4.4 (L/min) does not influence the temperature correction factor when the temperature is constant.
Figure 6c shows the effect of feed concentration on TCF at different temperatures for constant pressure (10 bar) and flow rate (3.2 L/min). The results show that as feed concentration increases from 25 to 150 (ppm), there is no effect on the temperature correction factor for different temperatures of 35–45 °C.

3.6. Mathematical Model

Mathematical models were thus developed based on the data collected from the experiments. Two mathematical models will be developed, one for the permeate flux and another for the copper removal percentage. The four parameters, concentration, temperature, pressure and flow, will be included in the mathematical model.

3.6.1. Permeate Flux Model

In this model, an assumption that the parameters independently affect the permeate flux and thus superposition holds, i.e.,
f l u x = f ( T ) + g ( P ) + h ( C ) + m ( F )
where f(T), g(P), h(C), and m(F) are functions of temperature, pressure, concentration, and flow, respectively. With this model, changing one parameter while keeping all the others fixed will result in a similar response as observed in Figure 2a, Figure 3a, Figure 4a and Figure 5a. In these figures, changing one parameter (concentration or flow) results in similar but shifted curves. The relation between the permeate flux to each parameter can thus be derived independently from the other parameters. By consulting Figure 2a, Figure 3a, Figure 4a and Figure 5a, the relations in Table 3 were derived.
The model for permeate flux can be expressed as:
f l u x = a 0 + a 1 T + a 2 P + a 3 P 2 + a 4 C + a 5 C 2 + a 6 F
where a0 to a6 are constants chosen to minimize the square error between the model and the measured data ( f l u x e x p e r i m e n t f l u x m o d e l ) 2 . The optimal constants were optimized using Matlab® (R2019b, MathWorks, Portola Valley, CA, USA) and are given in Table 4. The mathematical model obtained is shown in Equation (6).
f l u x = 33.6615 + 1.0250 T + 6.1397 P 0.0697 P 2 0.0759 C + 0.0003 C 2 + 0.7670 F
Figure 7a–d are comparisons between the model and the experiment data. Unless otherwise specified in the figure, the temperature is 25 °C, the pressure is 20 (bar), the flow is 2 L/min, and the concentration is 25 ppm. It has been noted that the model matches the data obtained from the experiments.

3.6.2. Copper Removal Model

The removal percentage is calculated using Equation (2). It has been noted that Cp is the only parameter to be modeled in Equation (2) since CF is pre-known. By following the same approach used for the permeate flux model, a model for copper removal % was developed. The relationship functions are given in Table 5.
Hence, the model for the copper removal (R) is given by:
R = ( 1 b 0 + b 1 T + b 2 T 2 + b 3 P + b 4 P 2 + b 5 P 3 + b 6 C + b 7 C 2 + b 8 F + b 9 F 2 C F ) × 100 %
where b0 to b9 are optimization constants to minimize the square error ( R d a t a R m o d e l ) 2 . The optimum constants (b0 to b9) were also found using Matlab® and are given in Table 6.
Figure 8a–d compare the copper removal percentage obtained experimentally with the removal percentage calculated from the developed model. Unless otherwise specified in the figure, the temperature is 25 °C, the pressure is 20 (bar), the flow is 2 L/min, and the concentration is 25 ppm. It can thus be concluded that the model does not match well with the experimental data. This mismatch could be due to the membrane polarization and fouling over time, membrane drop and replacing a new membrane in the middle of experiments, inaccuracies in the measurements of the TDS meter or maybe due to some other parameters that were not included in the experiments.

4. Conclusions

The effects of operating pressure, feed temperature, feed concentration and feed flow rate on the permeate flux and removal of copper ions using reverse osmosis were experimentally and numerically investigated. It is concluded that the permeate flux and the copper ion removal % are directly proportional to operating pressure. For different feed concentrations, when the pressure increased from 10 to 40 (bar), the permeate flux increased by 180%, and the (Cu2+) removal % increased from 89.98 to 94.21%. Similarly, the permeate flux and Cu (II) removal % were found to be directly proportional to the feed temperature: when the temperature increased from 25 to 45 °C, the permeate flux increased by 45% due to the reduction in the solution viscosity and changes in the physical properties of the membrane. The permeate flux and copper ions removal % were found to be inversely proportional to the feed concentration. The feed flow rate, on other hand, showed negligible impact on the permeate flux and Cu (II) removal % for different feed concentrations. Moreover, the results showed that the temperature correction factor (TCF) is directly proportional to the temperature but inversely proportional to the operating pressure; however, the feed flow rate showed no effect on the TCF. Mathematical models were developed for the permeate flux and copper removal. The model of permeate flux showed a perfect match when compared with the experimental data; however, the copper removal model did not match well the experimental data.

Author Contributions

Conceptualization, I.S. and R.H.H.; methodology, R.H.H. and A.E.; modeling, G.M.T.A.; writing—original draft preparation, R.H.H.; review and editing, I.S. and G.M.T.A.; supervision, I.S., H.N.H. and A.E. All authors have read and agreed to the published version of the manuscript.

Funding

This research was funded by the Deanship of Scientific Research at King Khalid University under the grant number RGP.1/25/43.

Institutional Review Board Statement

Not applicable.

Informed Consent Statement

Not applicable.

Data Availability Statement

Not applicable.

Acknowledgments

The authors extend their appreciation to the Deanship of Scientific Research at King Khalid University for funding this work through group project under grant number RGP.1/25/43.

Conflicts of Interest

The authors declare no conflict of interest.

References

  1. Gautam, P.K.; Gautam, R.K.; Banerjee, S.; Chattopadhyaya, M.C.; Pandey, J.D. Heavy metals in the environment: Fate, transport, toxicity and remediation technologies. Heavy Met. Sources Toxic. Remediat. Tech. 2016, 60, 101–130. [Google Scholar]
  2. Xu, Z. Removal of Heavy Metal Ions from Aqueous Solution by Alkaline Filtration; University of Ottawa: Ottawa, ON, Canada, 2020. [Google Scholar]
  3. Vidu, R.; Matei, E.; Predescu, A.M.; Alhalaili, B.; Pantilimon, C.; Tarcea, C.; Predescu, C. Removal of heavy metals from wastewaters: A challenge from current treatment methods to nanotechnology applications. Toxics 2020, 8, 101. [Google Scholar] [CrossRef] [PubMed]
  4. Fu, F.; Xie, L.; Tang, B.; Wang, Q.; Jiang, S. Application of a novel strategy—Advanced Fenton-chemical precipitation to the treatment of strong stability chelated heavy metal containing wastewater. Chem. Eng. J. 2012, 189–190, 283–287. [Google Scholar] [CrossRef]
  5. Polat, H.; Erdogan, D. Heavy metal removal from waste waters by ion flotation. J. Hazard. Mater. 2007, 148, 267–273. [Google Scholar] [CrossRef] [PubMed] [Green Version]
  6. Yuan, X.Z.; Meng, Y.T.; Zeng, G.M.; Fang, Y.Y.; Shi, J.G. Evaluation of tea-derived biosurfactant on removing heavy metal ions from dilute wastewater by ion flotation. Colloids Surf. A Physicochem. Eng. Asp. 2008, 317, 256–261. [Google Scholar] [CrossRef]
  7. Thakare, Y.N.; Jana, A.K. Performance of high density ion exchange resin (INDION225H) for removal of Cu(II) from waste water. J. Environ. Chem. Eng. 2015, 2, 1393–1398. Available online: https://www.infona.pl//resource/bwmeta1.element.elsevier-30052313-c7a7-35c1-a784-6e6a3cfc4070 (accessed on 1 May 2022). [CrossRef]
  8. Shaidan, N.H.; Eldemerdash, U.; Awad, S. Removal of Ni(II) ions from aqueous solutions using fixed-bed ion exchange column technique. J. Taiwan Inst. Chem. Eng. 2012, 1, 40–45. Available online: https://www.infona.pl//resource/bwmeta1.element.elsevier-4cae4d9c-909f-3b39-a0e9-c4185990983f (accessed on 15 May 2022). [CrossRef]
  9. Oussedik, S.M.; Khelifa, A. Reduction of copper ions concentration in wastewaters of galvanoplastic industry by electroflotation. Desalination 2001, 139, 383. [Google Scholar] [CrossRef]
  10. Konstantinos, D.; Christoforidis, A.; Valsamidou, E. Removal of Nickel, Copper, Zinc and Chromium from Synthetic and Industrial Wastewater by Electrocoagulation. Available online: https://www.researchgate.net/publication/284650056_Removal_of_nickel_copper_zinc_and_chromium_from_synthetic_and_industrial_wastewater_by_electrocoagulation (accessed on 20 January 2022).
  11. Zhu, S.; Chen, Y.; Khan, M.A.; Xu, H.; Wang, F.; Xia, M. In-Depth Study of Heavy Metal Removal by an Etidronic Acid-Functionalized Layered Double Hydroxide. ACS Appl. Mater. Interfaces 2022, 14, 7450–7463. [Google Scholar] [CrossRef]
  12. Zhu, S.; Khan, M.A.; Kameda, T.; Xu, H.; Wang, F.; Xia, M.; Yoshioka, T. New insights into the capture performance and mechanism of hazardous metals Cr3+ and Cd2+ onto an effective layered double hydroxide-based material. J. Hazard. Mater. 2022, 426, 128062. [Google Scholar] [CrossRef]
  13. Kosa, S.A.; Al-Zhrani, G.; Abdel Salam, M. Removal of heavy metals from aqueous solutions by multi-walled carbon nanotubes modified with 8-hydroxyquinoline. Chem. Eng. J. 2012, 181–182, 159–168. [Google Scholar] [CrossRef]
  14. Lo, S.F.; Wang, S.Y.; Tsai, M.J.; Lin, L.D. Adsorption capacity and removal efficiency of heavy metal ions by Moso and Ma bamboo activated carbons. Chem. Eng. Res. Des. 2012, 90, 1397–1406. [Google Scholar] [CrossRef]
  15. Zhu, S.; Xia, M.; Chu, Y.; Khan, M.A.; Lei, W.; Wang, F.; Muhmood, T.; Wang, A. Adsorption and Desorption of Pb(II) on l-Lysine Modified Montmorillonite and the simulation of Interlayer Structure. Appl. Clay Sci. 2019, 169, 40–47. [Google Scholar] [CrossRef]
  16. Barakat, M.A.; Schmidt, E. Polymer-enhanced ultrafiltration process for heavy metals removal from industrial wastewater. Desalination 2010, 256, 90–93. [Google Scholar] [CrossRef]
  17. Uzal, N.; Jaworska, A.; Miśkiewicz, A.; Zakrzewska-Trznadel, G.; Cojocaru, C. Optimization of Co2+ ions removal from water solutions via polymer enhanced ultrafiltration with application of PVA and sulfonated PVA as complexing agents. J. Colloid Interface Sci. 2011, 362, 615–624. [Google Scholar] [CrossRef]
  18. Gunatilake, S.K. Methods of Removing Heavy Metals from Industrial Wastewater. Methods 2015, 1, 12–18. [Google Scholar]
  19. Qdais, H.A.; Moussa, H. Removal of heavy metals from wastewater by membrane processes: A comparative study. Desalination 2004, 164, 105–110. [Google Scholar] [CrossRef]
  20. Mehdipour, S.; Vatanpour, V.; Kariminia, H.R. Influence of ion interaction on lead removal by a polyamide nanofiltration membrane. Desalination 2015, 362, 84–92. [Google Scholar] [CrossRef]
  21. Aljendeel, H.A. Removal of Heavy Metals Using Reverse Osmosis. J. Eng. 2011, 17, 647–658. [Google Scholar]
  22. Al-Saydeh, S.A.; El-Naas, M.H.; Zaidi, S.J. Copper removal from industrial wastewater: A comprehensive review. J. Ind. Eng. Chem. 2017, 56, 35–44. [Google Scholar] [CrossRef]
  23. Algureiri, A.H.; Abdulmajeed, Y.R. Removal of Heavy Metals from Industrial Wastewater by Using RO Membrane. Iraqi J. Chem. Pet. Eng. 2016, 17, 125–136. Available online: www.iasj.net (accessed on 5 January 2022).
  24. Myzairah, B. Hamdzah Low Pressure Reverse Osmosis Membrane for Rejection of Heavy Metals; Universiti Teknologi Malaysia: Johor Bahru, Malaysia, 2007. [Google Scholar]
  25. Applied Membranes Comparison of Membrane Processes. 2003. Available online: http://www.appliedmembranes.com/pdf/membrane_specs_ami/Comparison (accessed on 7 April 2022).
  26. Dimitriou, E.; Boutikos, P.; Mohamed, E.S.; Koziel, S.; Papadakis, G. Theoretical performance prediction of a reverse osmosis desalination membrane element under variable operating conditions. Desalination 2017, 419, 70–78. [Google Scholar] [CrossRef]
  27. Ruiz-García, A.; Nuez, I.; Carrascosa-Chisvert, M.D.; Santana, J.J. Simulations of BWRO systems under different feedwater characteristics. Analysis of operation windows and optimal operating points. Desalination 2020, 491, 114582. [Google Scholar] [CrossRef]
  28. Ansari, M.; Al-Obaidi, M.A.; Hadadian, Z.; Moradi, M.; Haghighi, A.; Mujtaba, I.M. Performance evaluation of a brackish water reverse osmosis pilot-plant desalination process under different operating conditions: Experimental study. Clean. Eng. Technol. 2021, 4, 100134. [Google Scholar] [CrossRef]
  29. Arvind Patil; Gary Hatch Factors that Influence the Performance of RO Systems. Available online: https://www.lenntech.com/performance-influence-factors.htm (accessed on 10 March 2022).
  30. Al-Mutaz, I.S.; Al-Ghunaimi, M.A. Performance of Reverse Osmosis Units at High Temperatures. The Ida World Congress on Desalination and Water Reuse. Available online: https://www.researchgate.net/publication/264420571 (accessed on 23 January 2022).
  31. Shigidi, I.; Anqi, A.E.; Elkhaleefa, A.; Mohamed, A.; Ali, I.H.; Brima, E.I. Temperature impact on reverse osmosis permeate flux in the remediation of hexavalent chromium. Water 2022, 14, 44. [Google Scholar] [CrossRef]
  32. Çimen, A.; Kılıçel, F.; Arslan, G. Removal of chromium ions from waste waters using reverse osmosis AG and SWHR membranes. Russ. J. Phys. Chem. A 2014, 88, 845–850. [Google Scholar] [CrossRef]
  33. Mousavi Rad, S.A.; Mirbagheri, S.A.; Mohammadi, T. Using reverse osmosis membrane for chromium removal from aqueous solution. World Acad. Sci. Eng. Technol. 2009, 57, 348–352. [Google Scholar] [CrossRef]
  34. Goosen, M.F.A.; Sablani, S.S.; Al-Maskari, S.S.; Al-Belushi, R.H.; Wilf, M. Effect of feed temperature on permeate flux and mass transfer coefficient in spiral-wound reverse osmosis systems. Desalination 2002, 144, 367–372. [Google Scholar] [CrossRef]
  35. Kocurek, P.; Kolomazník, K.; Bařinová, M. Chromium removal from wastewater by reverse osmosis. WSEAS Trans. Environ. Dev. 2014, 10, 358–365. [Google Scholar]
Figure 1. SEPA CF Cell Membrane Test Skid.
Separations 09 00155 g001
Figure 2. Effect of pressure on (a) permeate flux (b) (Cu2+) removal % at different feed concentrations for constant feed flow rate 2 (L/min) and feed temperature 25 (°C).
Separations 09 00155 g002
Figure 3. Effect of feed temperature on (a) permeate flux (b) (Cu2+) removal % at different feed concentrations for constant feed flow rate 3.2 (L/min) and pressure 10 (bar).
Separations 09 00155 g003
Figure 4. Effect of feed concentration on (a) permeate flux (b) (Cu2+) removal % at feed flow rates for constant pressure 20 (bar) and temperature 25 °C.
Separations 09 00155 g004
Figure 5. Effect of flow rate on (a) permeate flux (b) (Cu2+) removal % at different feed concentrations for constant pressure 20 (bar) and feed temperature 25 °C.
Separations 09 00155 g005
Figure 6. Effect of (a) pressure at (3.2 L/min, 100 ppm) (b) flow rate at (30 bar, 100 ppm) (c) feed concentration at (20 bar, 3.2 L/min) on TCF at different temperatures.
Separations 09 00155 g006
Figure 7. Permeate flux comparison between model and experimental data for various (a) pressure (b) temperature (c) concentration (d) flow rate.
Separations 09 00155 g007
Figure 8. Copper removal percentage comparison between model and experimental data for various (a) pressure (b) temperature (c) concentration (d) flow rate.
Separations 09 00155 g008aSeparations 09 00155 g008b
Table 1. Summary of studies on copper (II) ions removal using membrane technique.
Membrane TypeInitial Cocn. (ppm)Operating PressurepHRemovalReferences
Efficiency %
UF10001797.6[16]
PEUF5–10-6.599.98[17]
UF10–1602–55.5–690[18]
NF25–2007–134–1190[19]
NF20–40010–405.697.5[20]
RO25–2007–134–1198[19]
RO50–1504–10-96.6[21]
RO50–2001–42–5.596[23]
RO100–5003–54–1199.5[22]
Table 2. Calculated TCF for permeate flux under different operating pressure and flow rates (CF = 100 ppm).
Flow Rate (L/min)Pressure (Bar)TCF
35 °C45 °C
2.0101.261.48
201.151.24
301.091.16
401.071.16
3.2101.261.48
201.161.26
301.091.15
401.071.15
4.4101.261.48
201.161.26
301.091.15
401.071.16
Table 3. Relationship function between permeate flux and the parameters.
Permeate Flux vs.Relationship FunctionJustification
Temperaturef(T) = aT + bLinear curves observed in Figure 3a.
Pressureg(P) = aP2 + bP + cCurves obtained in Figure 2a are linear, but nonlinear behavior is observed at high pressure. The term aP2 will compensate for this nonlinearity.
Concentrationh(C) = aC2 + bC + cCurves in Figure 4a are nonlinear, especially at low concentrations. A parabolic fitting can be used to match the permeate flux vs. concentration curve.
Flowm(F) = aF + bSmall variation in the permeate flux can be observed in Figure 5a, hence a linear model should be sufficient to model these variations.
Table 4. Optimum fitting constants for the permeate flux.
ConstantOptimum Value
a0−33.6615
a11.0250
a26.1397
a3−0.0697
a4−0.0759
a50.0003
a60.7670
Table 5. Relationship function between concentration in permeate (Cp) and the parameters.
Permeate Flux vs.Relationship FunctionJustification
Temperaturef(T) = aT2 + bT + cNonlinear curves observed in Figure 3b are similar to parabolic curves.
Pressureg(P) = aP3 + bP2 + cP + dCurves in Figure 2b have maxima and minima. A quadratic equation will be insufficient to model this curve because it has only one minima/ maxima; hence, a higher-order (cubic) function is required.
Concentrationh(C) = aC2 + bC + cCurves in Figure 4b are nonlinear, especially with only one maximum; hence, a parabolic fitting can be used to match the data.
Flowm(F) = aF2 + bF + cNonlinear variation with the flow is observed in Figure 5b, with one maximum value; hence, a quadradic model is used.
Table 6. Optimum fitting constants copper removal.
ConstantOptimum Value
b08.9944
b10.0899
b2−0.0030
b3−0.3250
b40.0254
b5−0.0004
b6−0.1013
b70.0008
b82.0821
b9−0.4925
Publisher’s Note: MDPI stays neutral with regard to jurisdictional claims in published maps and institutional affiliations.

