Abstract
High potential toxic element (PTE) concentrations in soils that exceed local regulatory threshold values have been reported in non-polluted mountainous areas worldwide. However, there have been few studies that have comprehensively investigated the contribution of natural factors including the parental material, pedogenesis processes and physiochemical properties of soils on the distribution of PTEs in these soils. Therefore, in this study, we studied the distribution of 13 PTEs in sloping farmland soils collected from a mountainous watershed in Guizhou Province, Southwest China. The contributions of natural influencing factors were analyzed using a geostatistical analysis and a geographic detector method. All of the PTEs were unevenly distributed, especially Sb, and the average contents of V, Cr, Co, Ni, Cu, Zn, As, Mo, Cd, Sb, Tl, Pb and Hg were 57.15, 36.20, 4.61, 12.61, 13.36, 63.50, 11.94, 0.78, 0.37, 6.44, 0.48, 27.42 and 0.36mg/kg, respectively. The proportion of samples with Cd, Hg and As exceeding the screening value of the soil pollution risk of agricultural land in China was 46.7%, 5.9% and 4.4%, respectively. Except for Cd and Pb, the q values of the PTEs calculated from the geographical detector were above 0.05, indicating that altitude changes, which affect the pedogenesis process, have a great impact on the spatial distribution. Stratigraphic factors contributed greatly to the distribution of Co, Ni and Cu, which indicates their similarity in parental material. The combined effect of clay content, topographic factors and agricultural land types had the strongest explanatory power for V, Cr, Mo and Pb. The distributions of As, Sb, Tl and Hg are strongly associated with a potential source of mercury ore, and their accumulation is also enhanced by the adsorption on soil clay. Agricultural As also contributes to its distribution.
1. Introduction
The sources of potential toxic elements (PTEs) in soil are mainly divided into anthropogenic sources and natural sources [1,2]. Intense anthropogenic activities can usually lead to extremely high PTE contents in soils, including industrial and mining activities, transportation emissions and agricultural activities [3,4,5,6]. Natural sources include parental material weathered from bedrock and the atmospheric deposition of volcano eruptions [7,8,9,10]. The former may result in a high geochemical background in soils [11,12] which exceeds the regulatory threshold values of crop production, and this has been reported in many parts of the world. For example, Agrüello et al. found 45% of young and non-polluted soil samples exceeded the Cd threshold in Ecuador cacao lands [13]. Extremely high Ni, Cu, Co, Fe and Cr contents were reported in soils derived from mafic and ultramafic rock in Greece [14]; California, USA [15]; central Italy [16]; etc. According to the data of the China Geological Survey, more than 80% of PTEs in southwest China exceeding the standards are caused by a high regional geological background [17]. This situation is more often found in mountainous and hilly areas, which are often rich in mineral resources. Yang et al. [18] found that various rock layers widely embedded in mountain basins often release a variety of PTEs in the process of weathering and soil formation and become the potential “natural source” of the soil pollution of PTEs through secondary enrichment. A clear understanding of the formation and sources of PTE pollution in the soil within a given watershed is a necessary condition for the risk prevention and control of PTE pollution [19,20].
Sloping farmland is widely distributed in mountainous small watersheds in southwest China and is the main agricultural land resource. Due to the complex geological structure and abundant mineral resources, the distribution of PTEs is strongly influenced by the regional geochemistry and soil formation process. It has the characteristics of a high loss risk, a wide range, a difficult governance and a high potential ecological risk, and it easily poses a threat to both the soil of sloping farmland and to human health [21]. Some studies on large-scale regions and watersheds (such as urban areas and counties) have gradually revealed the accumulation, anthropogenic sources and ecological risks of PTEs from agricultural sources [22]. However, the previous emphasis was on soil and water conservation and the risk of the loss of nitrogen, phosphorus and other nutrients in sloping farmland at the small watershed scale [23,24], and there are relatively few studies on the effects of natural factors on the distribution of PTEs in the watershed.
Traditional multivariate statistical analysis methods, such as correlation analysis, cluster analysis and principal component analysis, etc. can determine the natural or anthropogenic sources of PTEs in a watershed qualitatively or quantitatively by identifying PTEs with similar distribution characteristics [25,26,27]. Geostatistical analysis includes spatial autocorrelation analysis, spatial interpolation analysis, etc., which can further identify the sources of PTEs by studying the spatial distribution and variation characteristics of PTEs [28]. Jamil et al. [29] used diverse statistical tools such as cluster analysis and principal component analysis, along with geo-statistical approaches, to highlight the geogenic and anthropogenic sources of pollution in agriculture soil irrigated with industrial effluents. Dragovic et al. [30] found that geostatistical analysis could reveal the spatial distribution of PTEs in soil and their correlation with prevailing winds in Smederevo (Serbia). Although the methods have been widely used, these statistical methods are not sufficient to reveal how these factors affect the formation/distribution of PTEs. Geographical detectors, based on spatial differentiation theory and the spatial statistics method, are used to detect and quantitatively analyze the interaction between the influencing factors. These have been used in the analysis of PTEs in soil and sediment [20,31,32,33]. Huang et al. [33] identified the key factors of PTE pollution in the soils of Zhangzhou City, China and found that the landscape pattern and slope aspect explained 31% of the overall soil contamination geodetector analysis. Dong et al. [20] compared the results of geographical detectors with those of principal component analysis (PCA) and correlation analysis (CA) and concluded that geographical detectors can identify many more of the influencing factors of PTEs. Therefore, the combined application of the two analysis methods can provide important support for revealing the driving forces behind the formation of PTE pollution caused by natural factors in the basin.
Based on the above geostatistical analysis and geographic detector method, this study took a typical small watershed in Guizhou Province, Southwest China and analyzed various factors affecting the distribution of PTEs in the soil of sloping farmland. Meanwhile, this study focused on exploring the natural factors and sources of the spatial distribution of PTEs with the aim of providing a scientific basis for the prevention and control of PTE pollution and the delineation of key prevention and control areas at the small watershed scale.
2. Materials and Methods
2.1. Study Area and Sampling
The study area was the Caidi River Watershed, located in Duyun City, Guizhou Province, China. The terrain is higher in the northwest and lower in the southeast. The landform of the watershed is dominated by low-medium mountains, with mountainous areas accounting for more than 80% of the area and the hilly area accounting for about 10% of the area. The late Paleozoic Devonian and Carboniferous carbonates are widely distributed in the watershed. The soil in the basin is mainly distributed in the zonal yellow soil developed from sand shale. Influenced by the parent rock, lime soil developed from limestone is embedded between the zonal yellow soil.
In view of the fact that the study watershed is mostly mountainous, with large altitude differences, a complex terrain and sloping farmland mainly distributed along the roads and both sides of the river, the sampling sites were reasonably arranged on different types of farmland. A total of 134 soil samples at a 0–20 cm tillage layer were collected in July and August of 2020, including 47 samples of rice soil, 55 samples of corn soil, 13 samples of tea garden soil and 19 samples of the other dry land soil. The distribution of the sampling sites is shown in Figure 1. Mixed samples were collected at each sampling site according to the quincunx dot method, and 1 kg samples were taken by the quarto method and then put into numbered polyethylene sealed bags for storage until further processing.
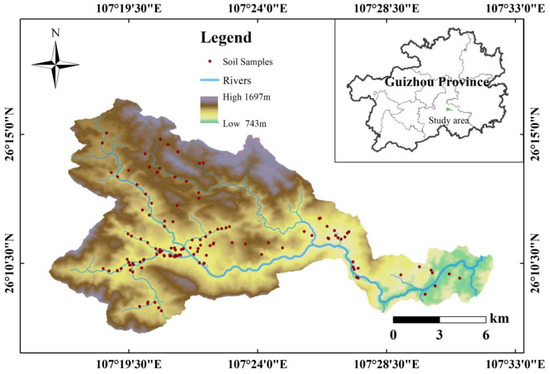
Figure 1.
Distribution of watershed locations and sampling sites.
2.2. Laboratory Analysis
The collected samples were placed in the laboratory, and removed debris such as stones, leaves and animal and plant residues were air dried for 2 weeks. The particle size was measured by a laser particle size analyzer (BT-9300Z, Bettersize, Dandong, China) after grinding with agate mortar through a 10-mesh (2 mm) nylon sieve. The pH value was determined with a pH meter (FE-20, METTLER TOLEDO, Columbus, OH, USA) by referring to the potentiometric method (HJ962-2018). The remaining air-dried samples were then sampled by the quartering method, grinded and passed through a 200 mesh (0.075 mm) nylon sieve for potential toxic element analysis and organic matter determination. The soil digestion and determination of Cd, Co, Cu, Cr, Ni, Pb, Zn, V, As, Mo, Sb, Tl in the soil samples were carried with a microwave digester (Multiwave PRO, Shanghai, China) and coupled plasma-mass spectrometry (ICP-MS, PE, NexIon 300X, Waltham, MA, USA), respectively. The Hg content in the samples was determined by a mercury analyzer (Mile Stone, DMA80, Bergamo, Italy). The TOC contents of the soil were tested by a total organic carbon tester (XperT-TOC /TNb, Shanghai, China), referring to HJ 695-2014.
2.3. Quality Control
Blank samples were set for the determination of the properties and PTE contents of the soil samples. Parallel samples were set with the relative errors within 13%. In the process of PTEs digestion, the standard materials of GBW07455 (GSS-26) and GBW07453 (GSS-24) were used as references for quality control, and the recoveries ranged from 77.9% to 108.2%. Ge (10 μg/L), In (5 μg/L) and Bi (5 μg/L) were used as internal standard materials for signal correction to eliminate instrument signal drift and matrix interference.
2.4. Statistical Methods
The influence factors of the spatial distribution of 13 PTEs in the study area were quantitatively analyzed using the factor detector and interaction detector within the geographic detector model. The factor detector is used to explore the explanatory power of each variable’s influence on the dependent variable, which is quantified by the q value. The calculation formulas are as follows [34]:
where: h = 1, 2 ..., L represents a stratum; Nh and N are the number of units in the h stratum and the whole region, respectively; and represent the variance of the h stratum and the whole region, respectively; SSW represents the sum of variance within the strata; SST represents the total variance of the whole region. The q value indicates that the factor X explains 100 × q% of the variable Y, with a range of [0, 1]. The q value indicates the degree of spatial heterogeneity of Y: the larger the q value, the stronger the explanatory power of the factor X to the variable Y, and vice versa.
The interaction detector is used to detect whether there is an interaction between various influencing factors and is based on the detector of the individual factors and their combination. By comparing the combinative explanatory power of two factors and the individual influencing powers (q values), it can be judged whether the two factors will increase or decrease their effect on the dependent variable when they act at the same time. Furthermore, according to the relationships, the interactive collusion can be organized into five categories: the nonlinear-enhance, independent, bi-enhance, uni-weaken and nonlinear-weaken [35,36].
Excel 2019 and SPSS22.0 were used for the descriptive statistics, correlation analysis, principal component analysis and cluster analysis. RStudio and Origin2019 were used to draw correlation analysis graphs and other graphs, respectively. The geostatistical analysis module within ArcGIS 10.6 was utilized to draw the spatial distribution map of the sampling sites of PTEs.
The altitude information was accessed by the Geospatial Data Cloud (http://www.gscloud.cn/sources, accessed on 30 May 2021), with DEM data of 30 m resolution. The slope and aspect data were extracted from the DEM data by the surface analysis module of the spatial analyst tool within ArcGIS. The soil type data were from the national earth system science data sharing platform (http://nnu.geodata.cn:8008, accessed on 20 June 2021). The geological data was acquired from the National Geological Archive (http://www.ngac.org.cn/DataSpecial/geomap.html, accessed on 26 November 2021).
3. Results and Discussion
3.1. Physicochemical Properties of Soil Samples
The pH values in the soil ranged from 3.96 to 8.04, with an average value of 6.23, showing slight acidity (Table 1). The soil pH value of the tea garden was lower than that of the other agricultural land, which may be related to the cultivation method of tea planting and the natural properties of tea trees, which are more suitable for growing under acidic conditions [37,38]. Among the four geological types, the samples of Silurian had the lowest pH value, with an average of only 5.14. In the collected soil samples, clay particles accounted for 0.03–29.34%, with an average ratio of 6.88%, silt particles accounted for 2.60–73.0%, with an average ratio of 40.84%, and sand particles accounted for 12.14–97.37%, with an average ratio of 52.81%. On the whole, the soil samples are dominated by the silt particles.

Table 1.
pH values of different agricultural land types, soil types and geological types.
The soil organic matter content ranged from 2.11% to 18.99%, with an average of 6.88% and a small variation coefficient of 38%. The organic matter contents of the soil samples in different agricultural land types are shown in Table 2.
Table 2.
Statistics of organic matter content in soils of different agricultural lands.
3.2. Content of PTEs in Soil
The statistical results of the contents of 13 PTEs in the soil are shown in Table 3. The average content of each PTE was higher than the corresponding median value, and the average value of Sb was nearly four times higher than the median value. The contents of different PTEs varied greatly. According to the Soil Environmental Quality—Risk Control Standard for Soil Contamination of Agricultural Land (GB-36600-2018, Table 3), the proportions of samples with Zn, As, Cd, Pb and Hg exceeding the screening values were 2.2%, 4.4%, 46.7%, 0.7% and 5.9%, respectively.
Table 3.
PTE contents in the topsoil of the study area and the values from other studies (mg/kg, n = 134).
As shown in Table 3, the coefficient of variation (CV) of each PTE varied greatly. The CV values of V, Cr and Cu were between 0.25 and 0.5, showing moderate variation, and the coefficient of the variations of Co, Ni, Zn, Mo, Cd and Tl ranged from 0.50 to 1.00, showing strong variation. The values of As, Sb, Pb and Hg all exceeded 1.00, and Sb in particular was as high as 3.22, showing abnormally strong variation, which implied the heterogenous sources of these PTEs.
The PTE concentrations in the samples from the study area were generally lower than the background values of the soil in Guizhou Province, while the Sb and Hg concentrations were nearly three times those of the background. The contents of V, Cr, Co, Ni, Cu, Zn, Mo and Tl in this study were relatively low compared with the average values of soils in China reported in 1990 [41], which may be due to the low contents of the aforementioned elements in the parent materials of the soil in the study watershed. The contents of As and Pb were similar, while the contents of Cd, Sb and Hg were obviously higher. When compared with other regions, the contents of Cr, Ni, Cu, Zn and Pb in this study area were relatively low, while the content of Hg was much higher than that in other regions. Therefore, Cd, Sb and Hg should be the key elements for the risk control of PTEs in the study areas.
3.3. Influencing Factors of PTE Distribution in the Soil
3.3.1. Selection and Stratification of Impact Factors
Referring to the factor selection methods of Liang et al. [44] and Huang et al. [33] combined with the actual situation of the Caidi River watershed, 10 potential influencing factors were selected for the subsequent detection from three levels (topographic and geomorphological factors, soil characteristic factors and socioeconomic factors). The 10 factors were altitude, slope aspect, slope gradient, strata, soil type, pH, organic matter, clay content, agricultural land type and distance to settlements. In order to meet the operational requirements of the geographic detector, the continuous data in the influencing factors were converted into stratified data. In this study, according to the hierarchical method of Cao et al. [45], the altitude, organic matter, clay content and distance to settlements were divided into six strata by using the natural discontinuous classification method in ArcGIS. The pH data were divided according to the pH classification standard of the Specification of Land Quality Geochemical Assessment (DZT0295-2016), and the slope gradients were classified according to the International Geographic Society Geomorphology Survey and Field Mapping Committee. The slope aspects were divided into four strata—sunny slope, semi-sunny slope, semi-shady slope and shady slope—according to the orientation. The stratification of the 10 influencing factors used in the geographic detector are listed in Table 4, and the distribution of the influencing factors is mapped in Figure 2.
Table 4.
The stratification of the influencing factors used in the geographic detector.
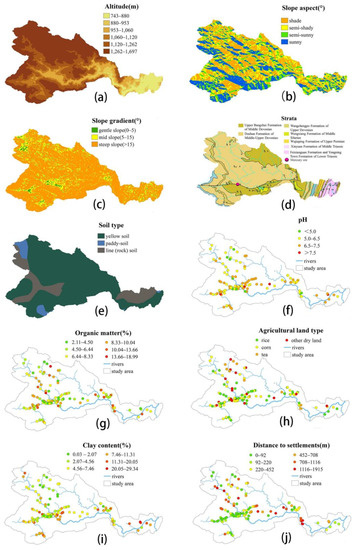
Figure 2.
The maps of the impact factors in the soils of the Caidi River watershed, Guizhou Province, including altitude (a), slope aspect (b), slope gradient (c), strata (d), soil type (e), pH (f), organic matter (g), clay content (h), agricultural land type (i) and distance to settlements (j).
3.3.2. Factor Detector
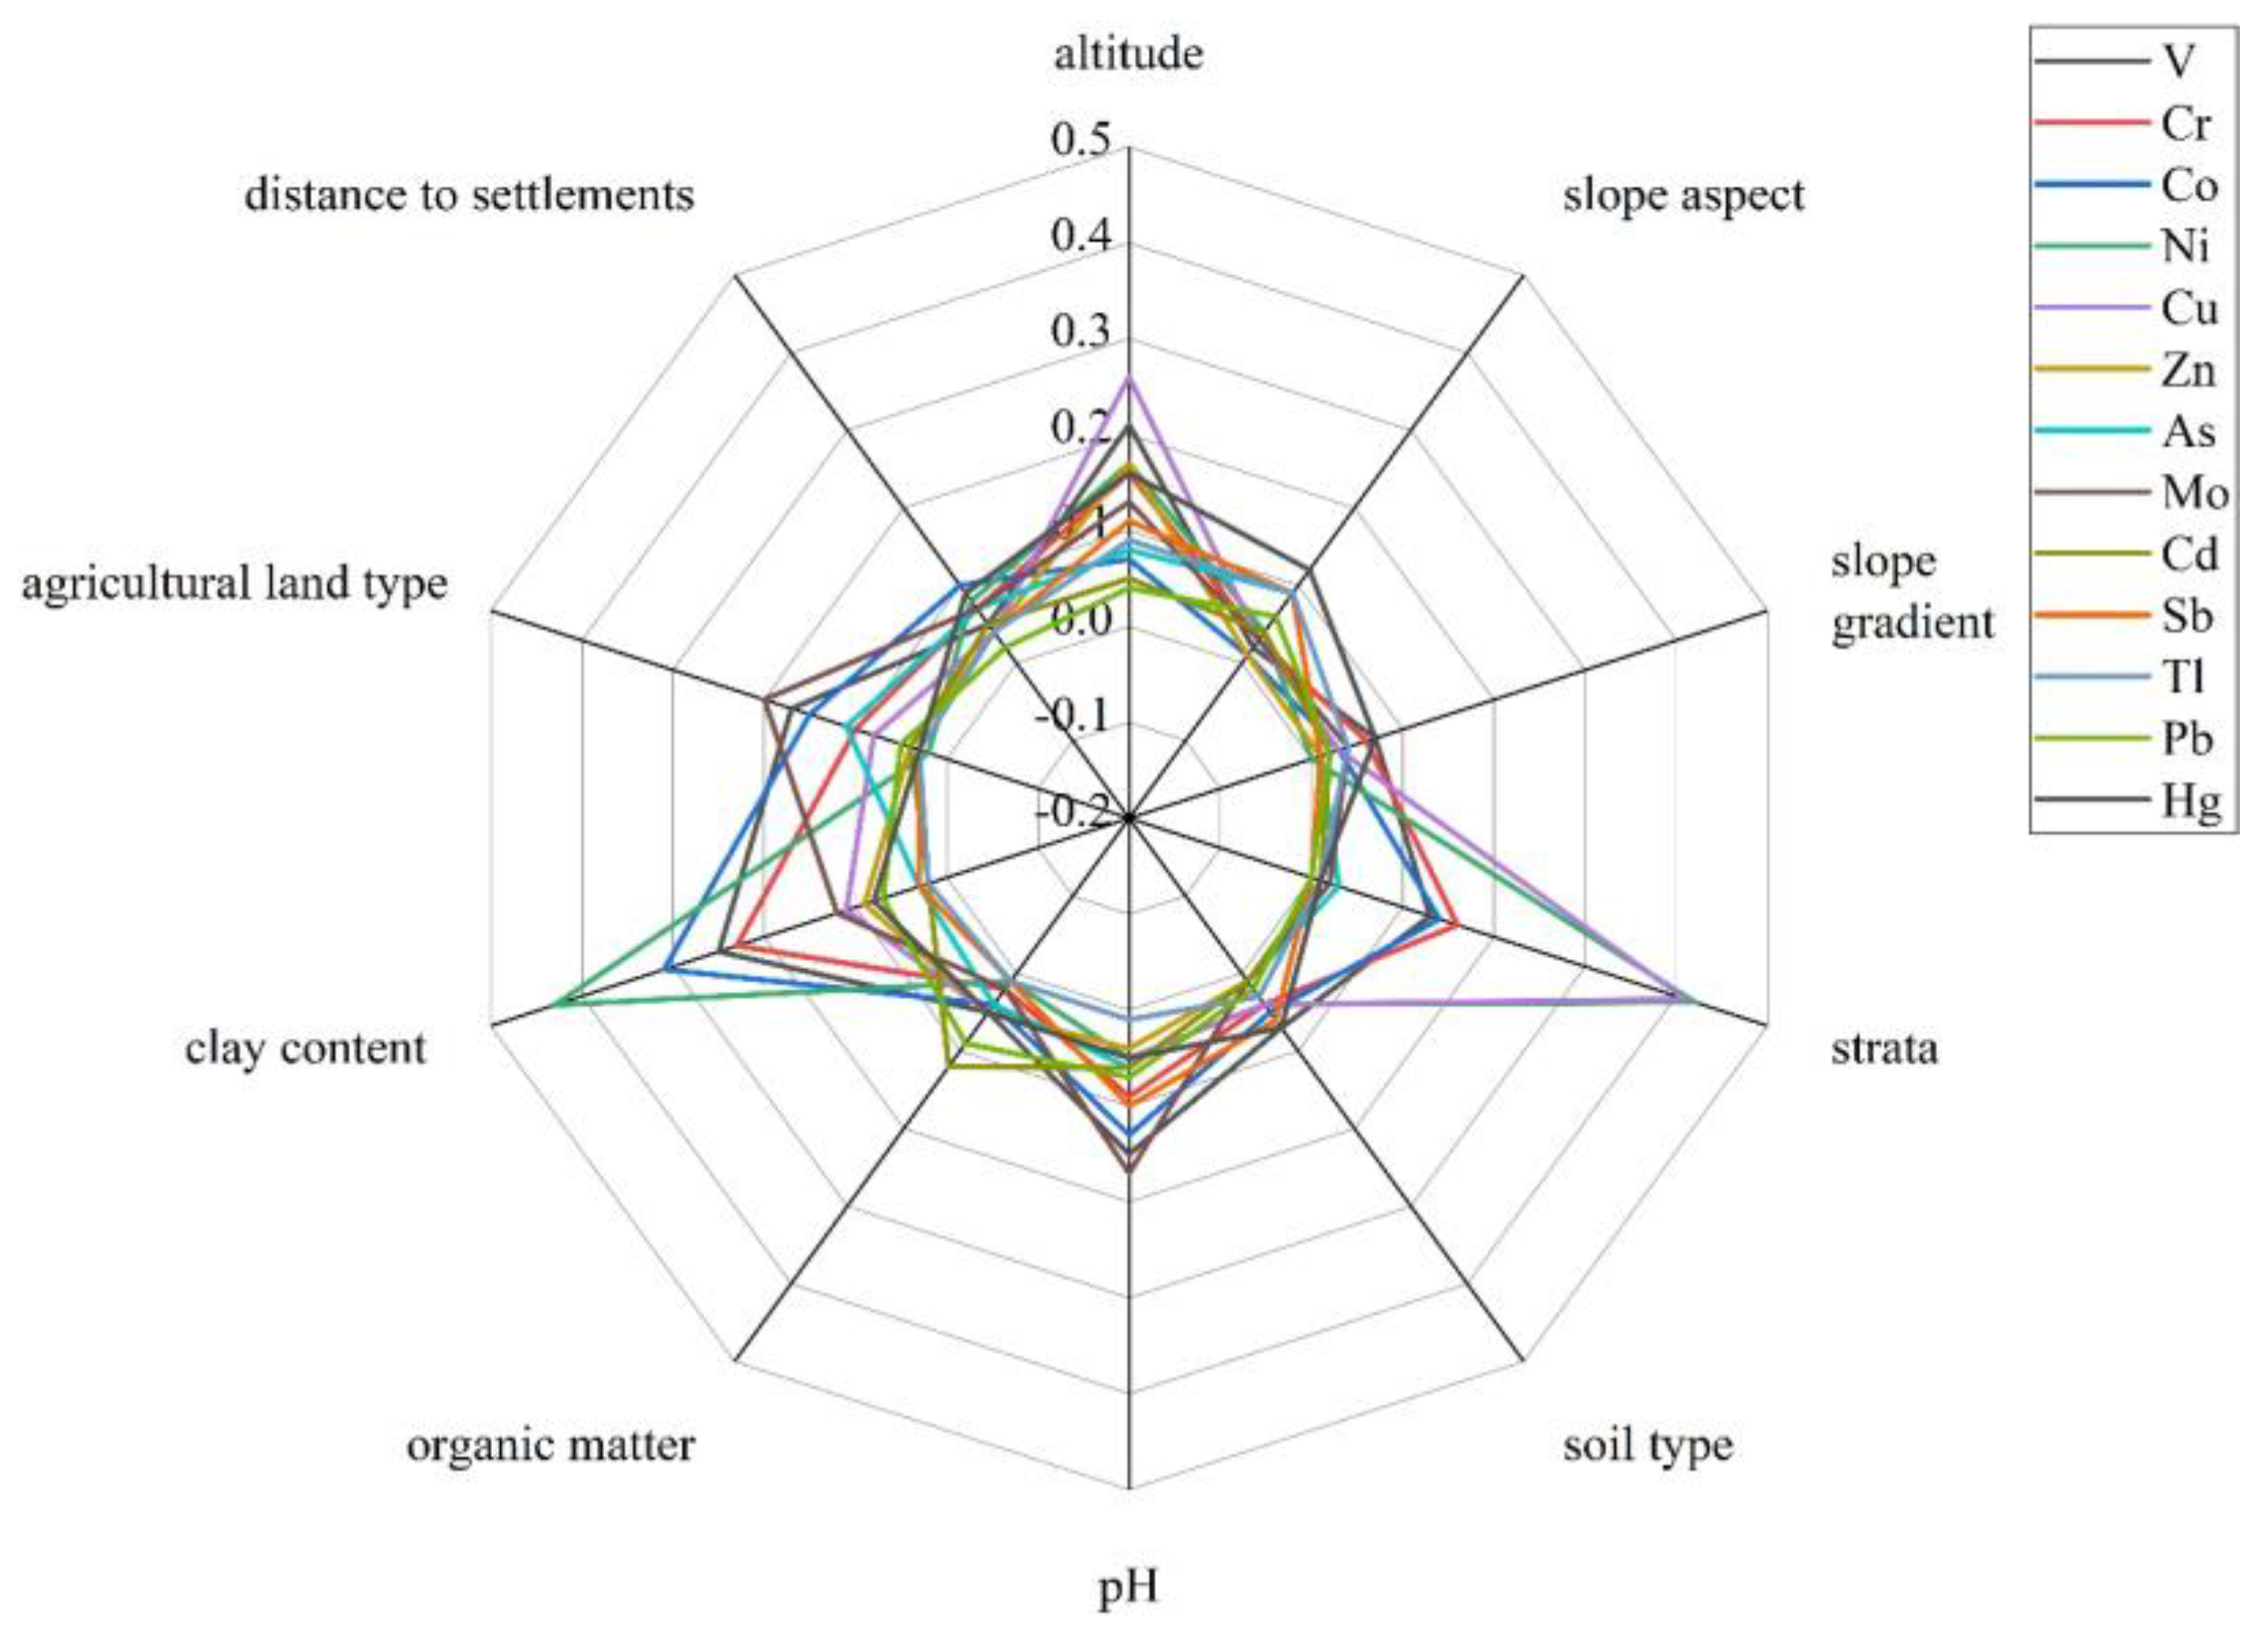
In this study, the factor detectors in the geographic detector were used to evaluate the relative contributions of environmental factors to the spatial distribution of PTEs. The explanatory powers (q values) of each factor on different PTEs are shown in Figure 3. Different factors have greatly varied associations with different PTEs. The contribution of clay content was great, with the contributions of V, Cr, Co and Ni above 0.23. This indicated that these elements were strongly associated with clay minerals [46,47]. The altitude factor had a homogenous effect on all 13 PTEs, with a relatively strong explanatory power, except for Cd and Pb. This indicated that the altitude changes in the Caidi River watershed have a great impact on the spatial distribution of these PTEs. There was a similar contribution trend between the altitude and clay content, indicating that the contribution of PTEs may be affected by both altitude and viscosity.
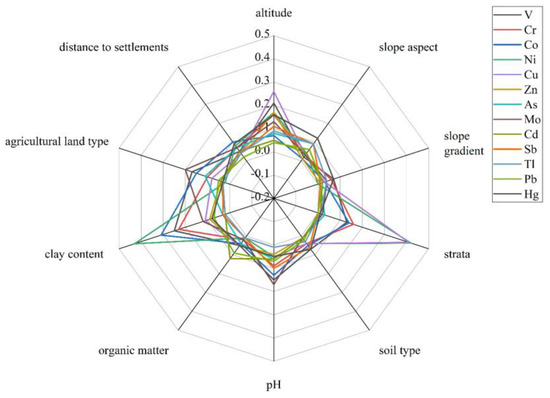
Figure 3.
Polar graph of the q value of a single influencing factor on the contents of 13 PTEs.
In addition, the stratigraphic factors had a great contribution to the contents of Co, Ni and Cu; the explanatory powers of Ni and Cu were 0.42 and 0.41, respectively, indicating that the distribution of the three elements is greatly affected by stratigraphic factors. The contribution of organic matter content to Cd was larger (0.12) than that of other factors, indicating that the distribution of Cd may be more affected by organic matter. For Sb, Tl and Hg, the q values of the other factors were not strong, except for the altitude and the slope aspect. Therefore, it was speculated that these three elements are not only affected by topographic factors, but they also may be affected by factors other than the above 10 factors. In addition, the factor of land type had a strong explanatory power on V, Cr, As and Mo. The altitude and slope aspect also contributed a lot, indicating that topographic factors are also one of the factors affecting the distribution of As content.
3.3.3. The Interaction of the Detector Results
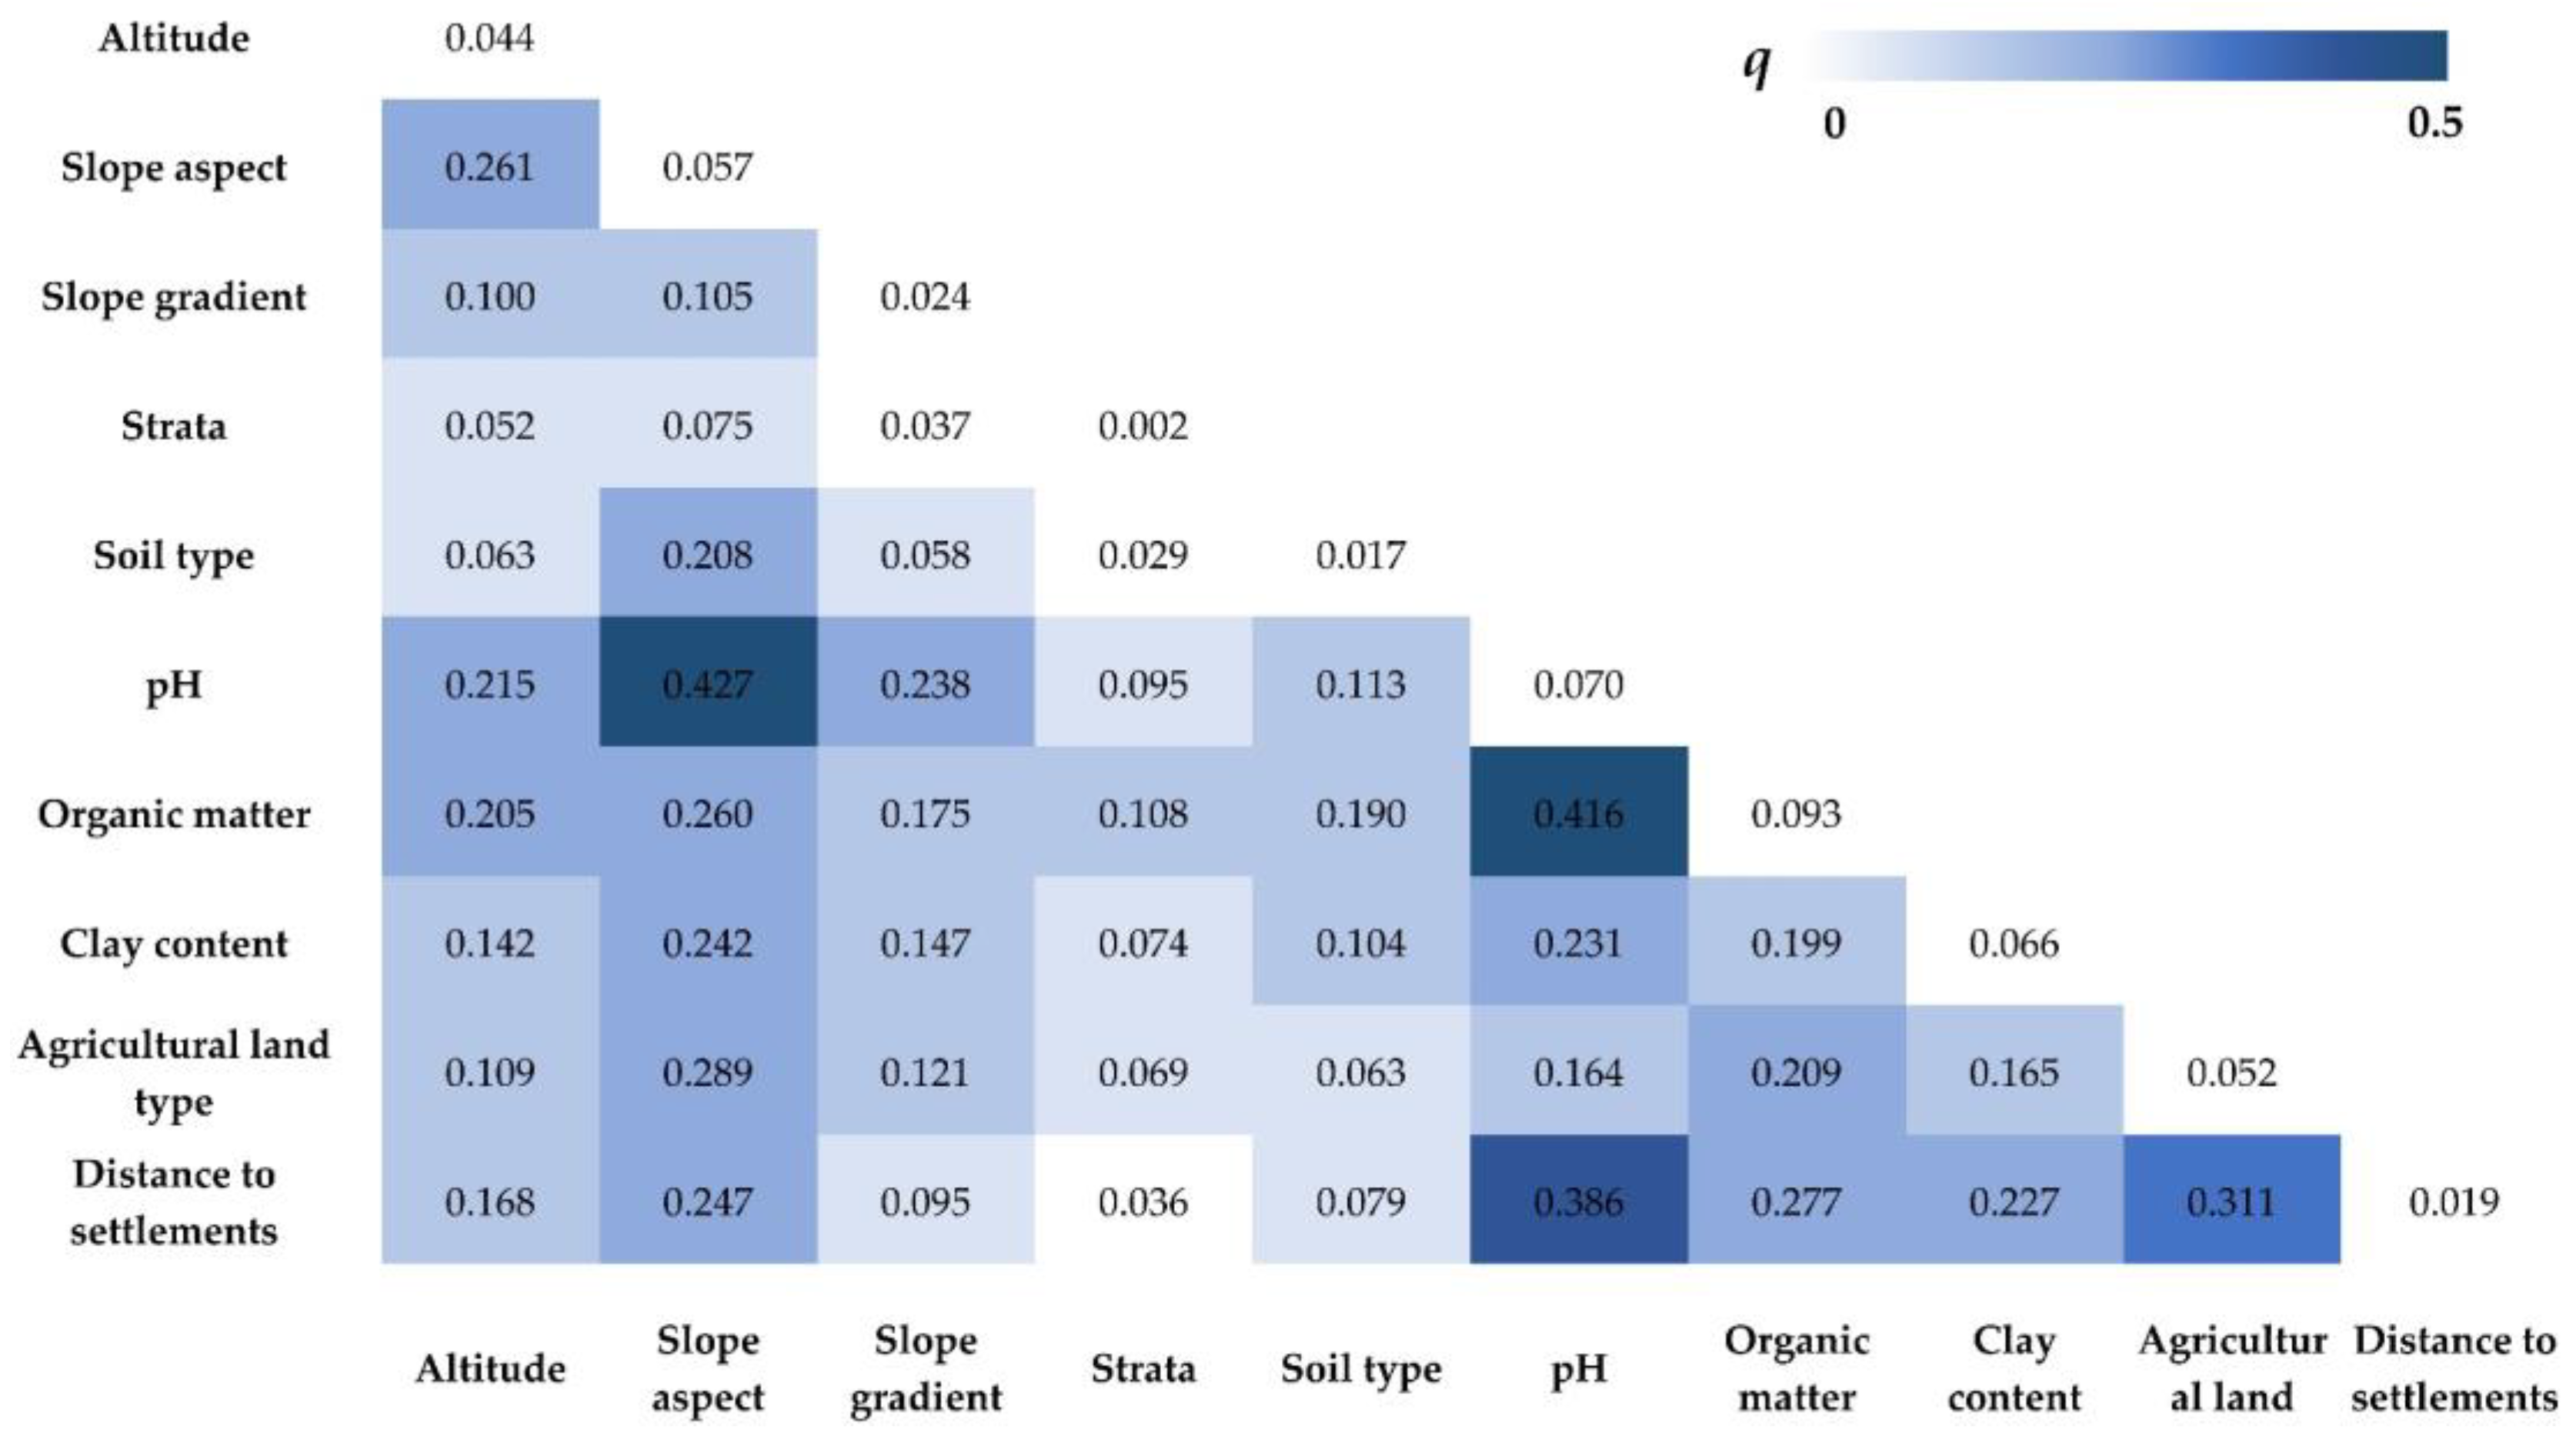
The interactive analysis of the 10 factors was carried out by the interaction detector of the geographic detector. The interactive results (Table S1) showed that the interaction types were nonlinear enhance or bi-enhance, indicating that the contribution of two factors to soil PTEs after interaction increased compared with that of a single influencing factor. Taking Pb as an example (Figure 4), the contribution of the single factor was not obvious, while the q value can be as high as 0.416 after the interaction of both organic matter and pH. This can be explained by the fact that a high organic matter content and high pH can favor Pb accumulation [48]. However, there was a negative correlation between these two factors, i.e., high organic matter leads to low pH, which makes the effect unable to be detected by the single factor analysis rather than the interactive analysis. Moreover, the effect of the slope aspect on the soil pH [49] resulted in a high q value (0.427), indicating that the distribution of Pb content may be mainly influenced by both of them.

Figure 4.
The interaction results of Pb by the interaction detector of the geographic detector.
The interaction results of V, Cr and Mo were similar, in which the interaction between clay and farmland type, organic matter and pH also had a strong explanatory power, whose q value can reach above 0.4. Cultivation can strongly affect the texture and chemistry of soils, which can further alter the accumulation of these elements [50]. Moreover, the explanatory power of the interaction between the land type and the distance to the settlement reached 0.51 for V, and the explanatory power for Mo also exceeded 0.4, indicating that the two elements may be affected by the combined effect of topographic factors and agricultural activities.
For Co, Ni and Cu, the interactions between the stratum, altitude and clay content had high q values, and the interactions between the clay content and other factors also showed high q values. For Zn, the interaction impacts between the altitude and other factors had high q values. Hence, it was speculated that the distribution of the four PTEs (Co, Ni, Cu and Zn) is mainly dominated by natural factors including parental material and pedogenesis.
The q values of the organic matter interactions with the altitude, pH and clay particles on Cd were relatively high; the value of the organic matter interaction with clay was as high as 0.439, indicating that Cd may be affected by the combined effect of topographic factors and physicochemical properties [51]. In addition to the interaction of natural factors such as altitude, the interaction between the organic matter and agricultural land type had a significant impact on the distribution of As. Thus, it was conjected that agricultural activities also have a certain impact on the distribution of As.
3.4. Source Analysis of PTEs
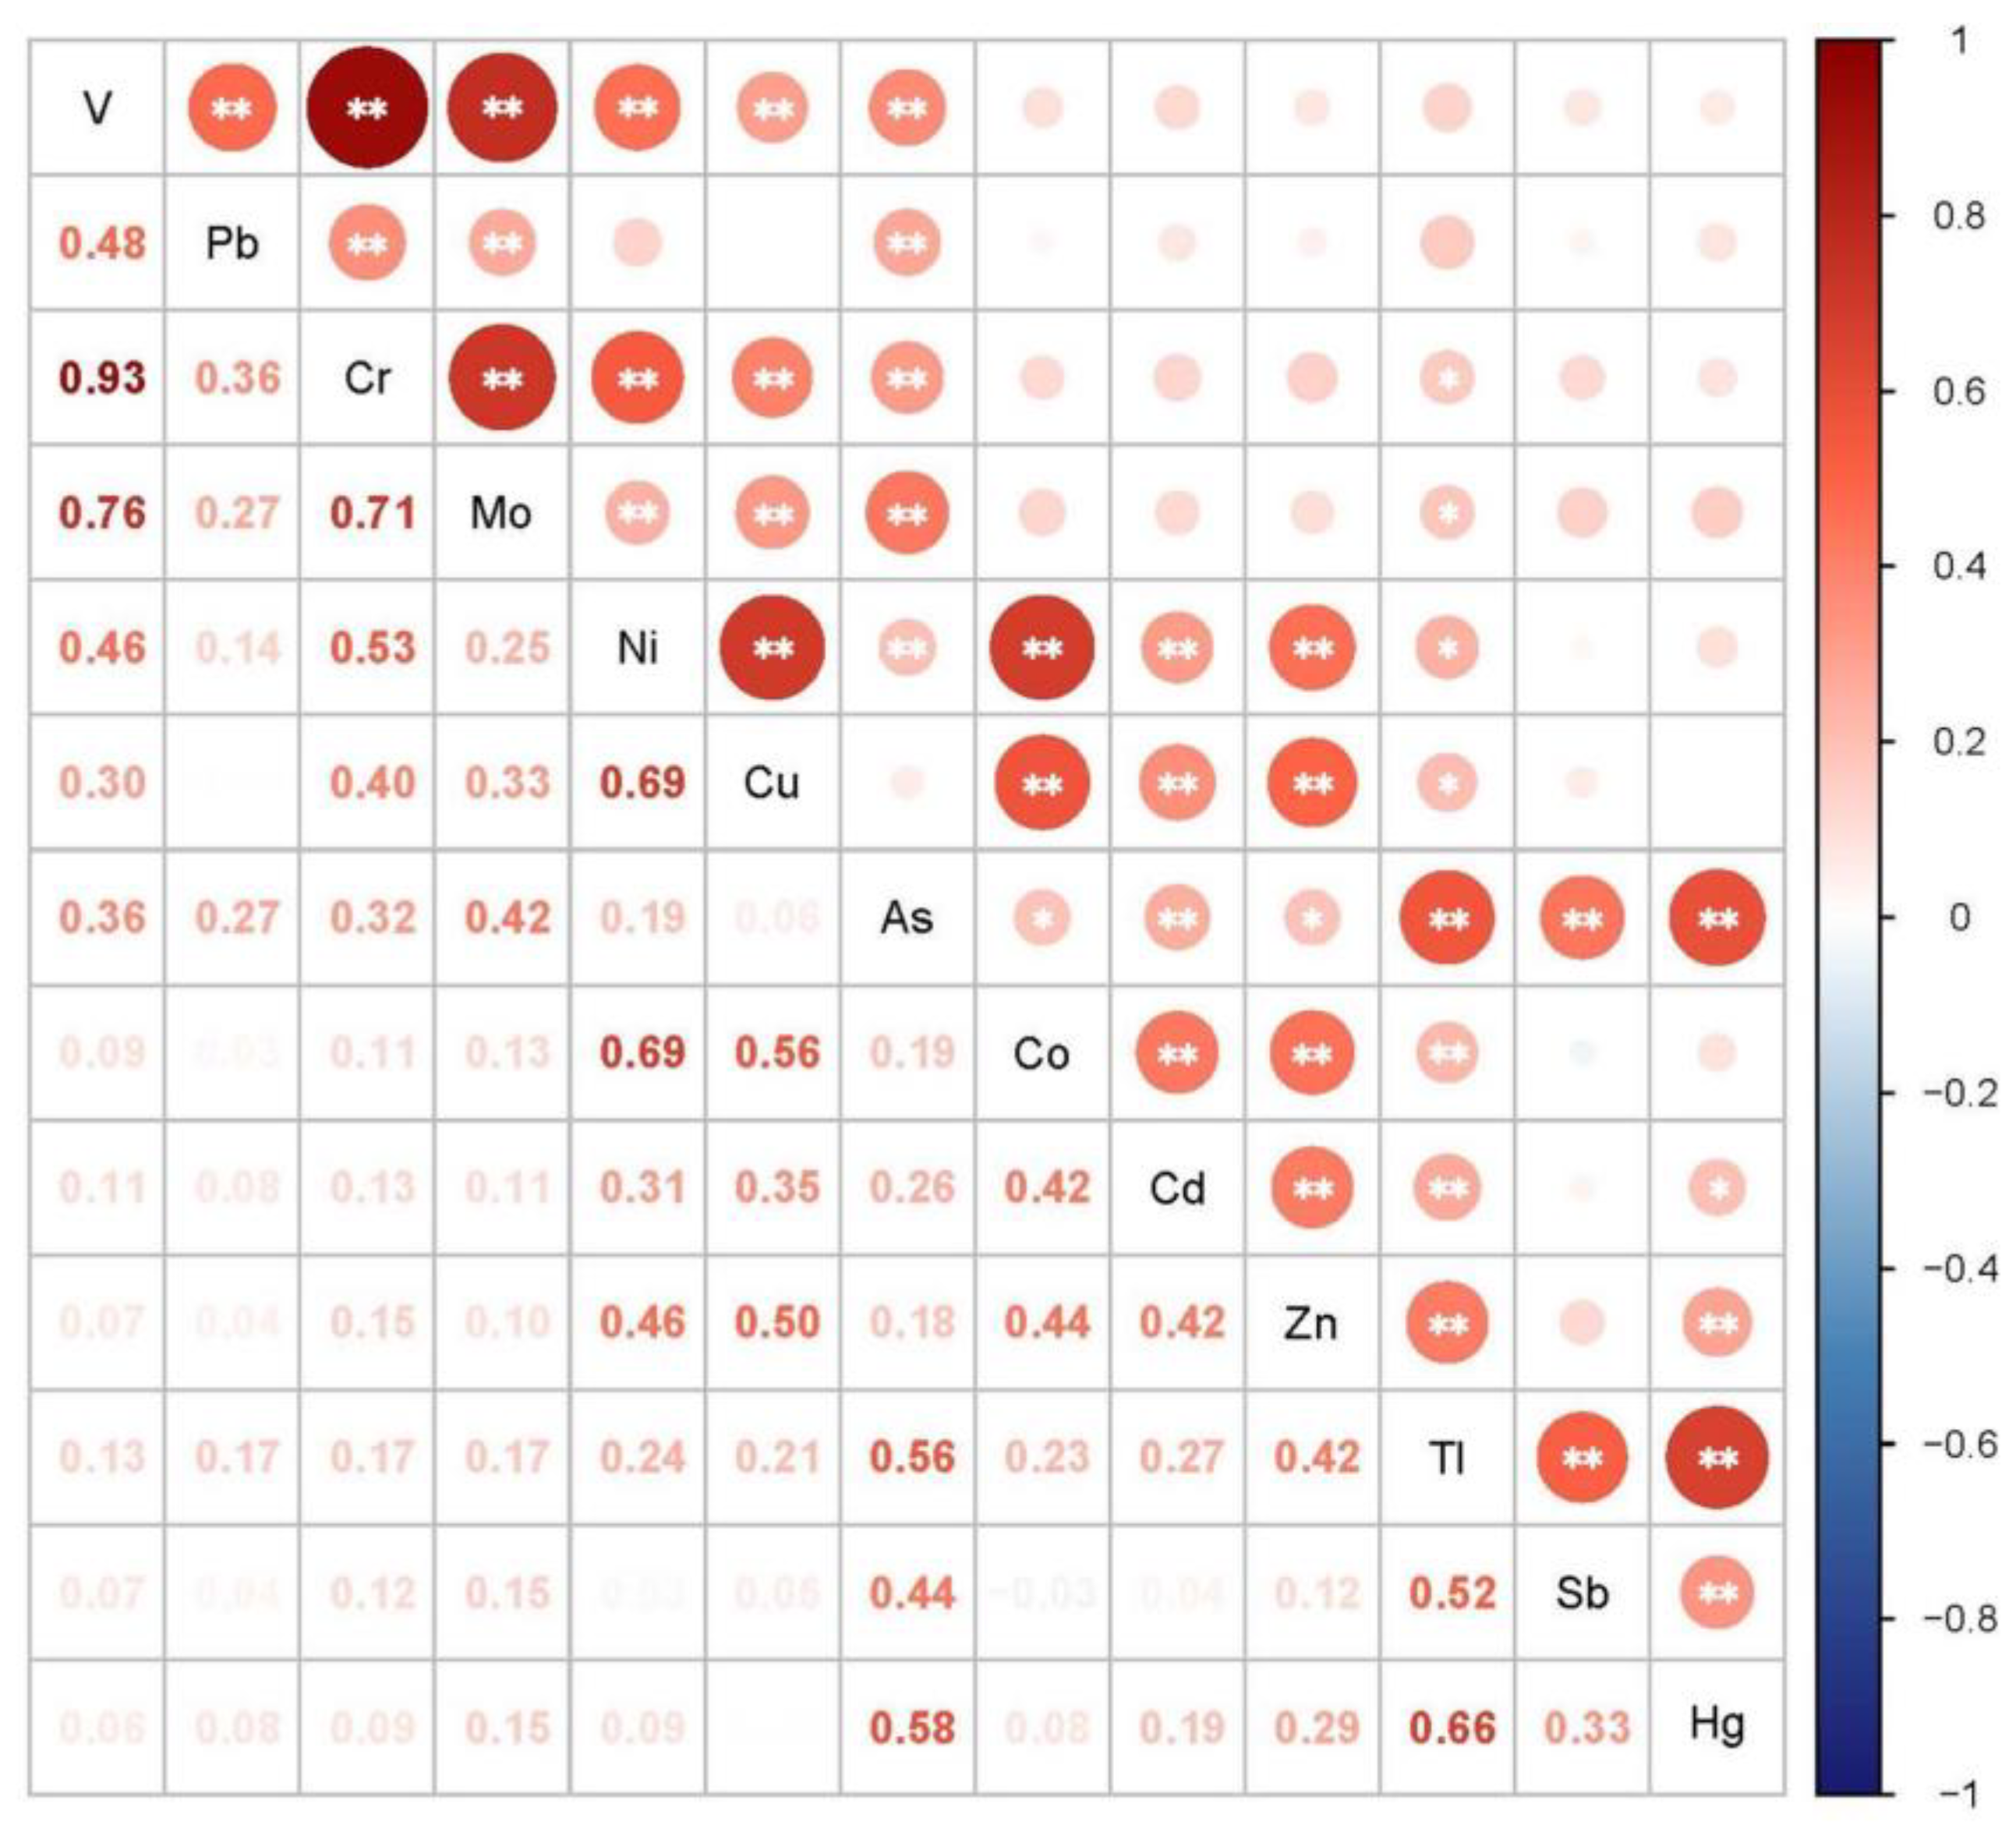
Generally, the greater the correlation between PTEs in the soil, the more likely it is that the two PTEs have similar sources. The correlation analysis results between 13 PTEs are shown in Figure 5. V, Cr, Co and Pb showed significant correlations at the level of p < 0.01. There were significant correlations between Co, Ni, Cu, Zn and Cd. Meanwhile, As, Sb, Tl and Hg also showed positive correlations.
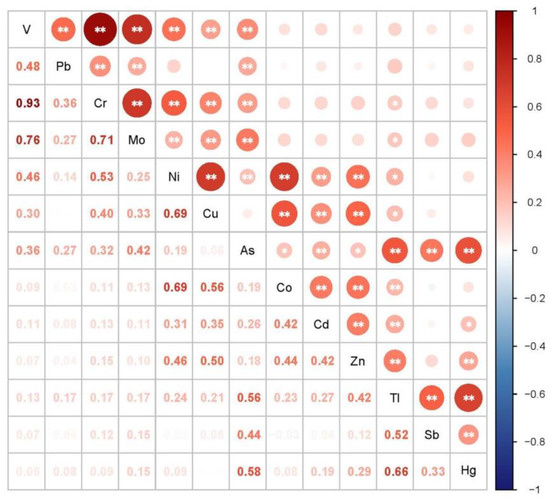
Figure 5.
Correlation analysis of the contents of 13 PTEs in the soil samples (n = 134). Note: ** represents a significant correlation at the 0.01 level (bilateral), * represents a significant correlation at the 0.05 level (bilateral).
The principal components of 13 PTEs in the soil samples were analyzed, and the factor analysis matrix of the PTE contents in the soil was obtained. The coefficient of Kaiser–Meyer–Olkin (KMO) and Bartlett’s test of sphericity satisfied the suitability analysis (KMO > 0.6, sig. < 0.05); thus the principal component analysis could be performed. The orthogonal rotation of the Kaiser normalized factors was carried out by the maximum variance method, which makes factor analysis more accurate. In this study, the eigenvalue greater than 1 was selected as the extraction standard of the principal components, and a total of three principal components were extracted, which could explain 66.803% of the total variance of the 13 PTEs. The above PCA analysis results are shown in Table 5.
Table 5.
Varimax rotated matrix of the principal component factors on the PTE contents in the soil.
The variance contribution rate of principal component 1 (PC1) was 23.499%. The PTEs with heavy loads on PC1 were V, Cr, Mo and Pb, whose loads were 0.962, 0.911, 0.815 and 0.549, respectively. In view of the correlation analysis result showing that V, Cr, Mo and Pb were significantly correlated in pairs, it was indicated that the sources of the four elements might be similar. Combined with the results of the geographical detector analysis, the altitude, clay and agricultural land type all had a great influence on the four elements, and it was speculated that the sources of the four elements could be influenced by natural factors and agricultural activities. Among them, the contents of V, Cr and Mo in the soil collected in the tea gardens were significantly higher than those in the other agricultural lands, and the pH values of the tea garden soil were significantly lower than the others. Studies have proposed that the accumulation of Mo in soil is often attributed to the combination of Fe and Mn oxides [52]. Gustafsson et al. [53] showed that the adsorption of molybdate on ferromanganese oxides increased with the decrease in pH and reached a maximum value at 4–5. Therefore, it may be related to the decrease in the pH value in the soil caused by nitrogen fertilizer such as ammonium sulfate applied in the process of tea planting. In addition, PTEs such as Cr and Pb can be associated with chemical fertilizer production [54,55], and the excessive input of chemical fertilizers in agricultural activities may lead to the enrichment of Cr, Pb and other PTEs in the soil. Further, As presented a loading of 0.3 on principal component 1, suggesting that As may also be affected by agricultural activities such as fertilizer and pesticide application.
The variance contribution of principal component 2 (PC2) was 23.407%, and the loads of Co, Ni, Cu, Zn and Cd were 0.835, 0.804, 0.809, 0.713 and 0.593, respectively. Meanwhile the correlation analysis showed that Co, Ni, Cu, Zn and Cd were significantly correlated. Based on the analysis results of the geographic detector, the five PTEs were all greatly affected by the altitude and clay content, and the stratigraphic factors also contributed greatly to Co, Ni and Cu. Studies have shown that, Ni, Cu, Zn and other PTEs are mainly controlled by the geological backgrounds such as the parent material and soil formation process [56]. Guizhou Province, where this study was conducted, has widely distributed karst landforms, and it has generally been believed that the weathering of carbonate rocks leads to the enrichment of Cd [57]. Therefore, it could be inferred that the main sources of the above five PTEs are natural sources.
The variance contribution rate of principal component 3 (PC3) was 19.897%. The PTEs with larger loads on PC3 were As, Sb, Tl and Hg, with contributions of 0.751, 0.681, 0.831 and 0.824, respectively. The correlation analysis also showed that there are significant correlations between the four PTEs. Moreover, according to the spatial distributions of As, Sb, Tl and Hg, similar distribution features were observed—that is, the high contents of As, Sb, Tl and Hg were almost only concentrated in the south of Maojian Town. Viewed from the geological map, it has been ascertained that this region is a potential source of mercury ore. Studies have shown that, in the process of soil formation, the enrichment of ore-forming elements in ore-bearing rock would be enriched in the soil, and mercury mines are often associated with PTEs such As, Sb and Tl [58]. Therefore, it can be inferred that principal component 3 might be dominated by potential mercury sources and may also be attributed to natural sources.
4. Conclusions
- (1)
- In this study, we studied the distribution of 13 PTEs in sloping farmland soils collected from a mountainous watershed in Guizhou Province, Southwest China. All of the PTEs were unevenly distributed, especially Sb. The proportion of samples with Cd, Hg and As exceeding the screening value of the soil pollution risk of agricultural land in China was 46.7%, 5.9% and 4.4%, respectively.
- (2)
- The results of the factor detector showed that the factor of altitude contributed a lot to the 13 PTEs, indicating that the spatial distribution may be impacted by the local pedogenesis process. In addition, the stratigraphic factors contributed greatly to the distribution of Co, Ni and Cu, which implied their similarity in the parental material.
- (3)
- The interaction of the detector results showed that V, Cr, Mo and Pb are affected by the nonlinear interaction result from the combined effect of clay content, altitude and agricultural land type.
- (4)
- Based on the results of the geographic detectors and multivariate statistical analysis, V, Cr, Mo and Pb were significantly correlated in pairs, indicating that the sources of the four PTEs were similar and might be affected by natural factors and agricultural activities. Co, Ni, Cu, Zn and Cd were mainly affected by natural sources, and their migration and enrichment may be influenced by the combined action of both regional geology and altitude factors. Furthermore, the distribution of As, Sb, Tl and Hg was associated with potential sources of mercury ore, and As may also be affected by local agricultural activities.
Supplementary Materials
The following are available online at https://www.mdpi.com/article/10.3390/separations9060149/s1. Table S1: The interaction results of V, Cr, Co, Ni, Cu, Zn, As, Mo, Cd, Sb, Tl and Hg by the interaction detector of the geographic detector.
Author Contributions
Conceptualization, Y.G., H.T. and D.Z.; methodology, B.G. and Y.G.; formal analysis, Y.G.; investigation, B.G.; writing—original draft preparation, Y.G. and B.G.; writing—review and editing, L.M.; visualization, B.G. and Y.G. All authors have read and agreed to the published version of the manuscript.
Funding
This work was funded by the Water Affairs Bureau of Qiannan, Guizhou Province, China (No. JCZB2019042FW).
Acknowledgments
We thank the Water Affairs Bureau of Qiannan and Guizhou Survey and the Design Research Institute for Water Resources and Hydropower for their help with the soil sampling and data collection.
Conflicts of Interest
The authors declare no conflict of interest. The authors declare that they have no known competing financial interests or personal relationships that could appear to have influenced the work reported in this paper.
References
- Zhang, Q.; Wang, C. Natural and human factors affect the distribution of soil heavy metal pollution: A review. Water Air Soil Pollut. 2020, 231, 350. [Google Scholar] [CrossRef]
- Mamat, Z.; Yimit, H.; Ji, R.Z.A.; Eziz, M. Source identification and hazardous risk delineation of heavy metal contamination in Yanqi basin, northwest China. Sci. Total Environ. 2014, 493, 1098–1111. [Google Scholar] [CrossRef] [PubMed]
- Wang, Q.; Xie, Z.; Li, F. Using ensemble models to identify and apportion heavy metal pollution sources in agricultural soils on a local scale. Environ. Pollut. 2015, 206, 227–235. [Google Scholar] [CrossRef] [PubMed]
- Wu, Q.; Hu, W.; Wang, H.; Liu, P.; Wang, X.; Huang, B. Spatial distribution, ecological risk and sources of heavy metals in soils from a typical economic development area, Southeastern China. Sci. Total Environ. 2021, 780, 146557. [Google Scholar] [CrossRef] [PubMed]
- Karim, Z.; Qureshi, B.A.; Mumtaz, M. Geochemical baseline determination and pollution assessment of heavy metals in urban soils of Karachi, Pakistan. Ecol. Indic. 2015, 48, 358–364. [Google Scholar] [CrossRef]
- Fazekašová, D.; Petrovič, F.; Fazekaš, J.; Štofejová, L.; Baláž, I.; Tulis, F.; Tóth, T. Soil Contamination in the Problem Areas of Agrarian Slovakia. Land 2021, 10, 1248. [Google Scholar] [CrossRef]
- Ding, Q.; Cheng, G.; Wang, Y.; Zhuang, D. Effects of natural factors on the spatial distribution of heavy metals in soils surrounding mining regions. Sci. Total Environ. 2017, 578, 577–585. [Google Scholar] [CrossRef]
- Xu, L.; Wang, T.; Luo, W.; Ni, K.; Liu, S.; Wang, L.; Li, Q.; Lu, Y. Factors influencing the contents of metals and As in soils around the watershed of Guanting Reservoir, China. J. Environ. Sci. 2013, 25, 561–568. [Google Scholar] [CrossRef]
- Qiu, S.; Zhu, Z.; Yang, T.; Wu, Y.; Bai, Y.; Ouyang, T. Chemical weathering of monsoonal eastern China: Implications from major elements of topsoil. J. Asian Earth Sci. 2014, 81, 77–90. [Google Scholar] [CrossRef]
- Lv, J. Multivariate receptor models and robust geostatistics to estimate source apportionment of heavy metals in soils. Environ. Pollut. 2019, 244, 72–83. [Google Scholar] [CrossRef]
- Kong, X.; Liu, T.; Yu, Z.; Chen, Z.; Lei, D.; Wang, Z.; Zhang, H.; Li, Q.H.; Zhang, S.S. Heavy metal bioaccumulation in rice from a high geological background area in Guizhou Province, China. Int. J. Environ. Res. Public Health 2018, 15, 2281. [Google Scholar] [CrossRef] [PubMed] [Green Version]
- Li, B.; Zhuang, X.; Li, J.; Querol, X.; Font, O.; Moreno, N. Geological controls on mineralogy and geochemistry of the Late Permian coals in the Liulong Mine of the Liuzhi Coalfield, Guizhou Province, Southwest China. Int. J. Coal Geol. 2016, 154, 1–15. [Google Scholar] [CrossRef]
- Argüello, D.; Chavez, E.; Lauryssen, F.; Vanderschueren, R.; Smolders, E.; Montalvo, D. Soil properties and agronomic factors affecting cadmium concentrations in cacao beans: A nationwide survey in Ecuador. Sci. Total Environ. 2019, 649, 120–127. [Google Scholar] [CrossRef] [PubMed]
- Kanellopoulos, C.; Argyraki, A.; Mitropoulos, P. Geochemistry of serpentine agricultural soil and associated groundwater chemistry and vegetation in the area of Atalanti, Greece. J. Geochem. Explor. 2015, 158, 22–33. [Google Scholar] [CrossRef]
- Oze, C.; Fendorf, S.; Bird, D.K.; Coleman, R.G. Chromium geochemistry in serpentinized ultramafic rocks and serpentine soils from the Franciscan complex of California. Am. J. Sci. 2004, 304, 67–101. [Google Scholar] [CrossRef]
- Bini, C.; Maleci, L.; Wahsha, M. Potentially toxic elements in serpentine soils and plants from Tuscany (Central Italy). A proxy for soil remediation. Catena 2017, 148, 60–66. [Google Scholar] [CrossRef]
- China Geological Survey. Geochemical Survey of Cultivated Land in China; CGS: Beijing, China, 2015. [Google Scholar]
- Yang, Q.; Yang, Z.; Zhang, Q.; Ji, W.; Guan, D.X.; Liu, X.; Yu, T.; Wang, L.; Zhuo, X.; Ji, J. Transferability of heavy metal(loid)s from karstic soils with high geochemical background to peanut seeds. Environ. Pollut. 2022, 299, 118819. [Google Scholar] [CrossRef]
- Shetaya, W.H.; Marzouk, E.R.; Mohamed, E.F.; Elkassas, M.; Bailey, E.H.; Young, S.D. Lead in Egyptian soils: Origin, reactivity and bioavailability measured by stable isotope dilution. Sci. Total Environ. 2018, 618, 460–468. [Google Scholar] [CrossRef]
- Dong, S.; Pan, Y.; Guo, H.; Gao, B.; Li, M. Identifying Influencing Factors of Agricultural Soil Heavy Metals Using a Geographical Detector: A Case Study in Shunyi District, China. Land 2021, 10, 1010. [Google Scholar] [CrossRef]
- Gao, Y.; Li, F.; Mao, L.; Gu, B.; Peng, C.; Yang, Q.; Lu, L.; Chen, X.; Zhang, D.; Tao, H. Potential Loss of Toxic Elements from Slope Arable Soil Erosion into Watershed in Southwest China: Effect of Spatial Distribution and Land-Uses. Minerals 2021, 11, 1422. [Google Scholar] [CrossRef]
- Li, Y.; Wang, S.; Nan, Z.; Zang, F.; Sun, H.; Zhang, Q.; Huang, W.; Bao, L. Accumulation, fractionation and health risk assessment of fluoride and heavy metals in soil-crop systems in northwest China. Sci. Total Environ. 2019, 663, 307–314. [Google Scholar] [CrossRef] [PubMed]
- Le Dinh, H.; Shibata, M.; Kohmoto, Y.; Ho, L.N.; Funakawa, S. Analysis of the processes that generate surface runoff and soil erosion using a short-term water budget on a mountainous sloping cropland in central Vietnam. Catena 2022, 211, 106032. [Google Scholar] [CrossRef]
- Cheng, Y.; Li, P.; Xu, G.; Li, Z.; Gao, H.; Zhao, B.; Wang, T.; Wang, F.; Cheng, S. Effects of soil erosion and land use on spatial distribution of soil total phosphorus in a small watershed on the Loess Plateau, China. Soil Tillage Res. 2018, 184, 142–152. [Google Scholar] [CrossRef]
- Martín, J.A.R.; Arias, M.L.; Corbí, J.M.G. Heavy metals contents in agricultural topsoils in the Ebro basin (Spain). Application of the multivariate geoestatistical methods to study spatial variations. Environ. Pollut. 2007, 144, 1001–1012. [Google Scholar] [CrossRef]
- Guo, X.; Zhao, Y.; He, H.; Wang, X. Potential ecological risk assessment of soil heavy metals in Hunchun basin, Northeast China. Arab. J. Geosci. 2020, 13, 56. [Google Scholar] [CrossRef]
- Yang, J.; Wang, J.; Qiao, P.; Zheng, Y.; Yang, J.; Chen, T.; Lei, M.; Wan, X.; Zhou, X. Identifying factors that influence soil heavy metals by using categorical regression analysis: A case study in Beijing, China. Front. Environ. Sci. Eng. 2020, 14, 37. [Google Scholar] [CrossRef]
- Hou, D.; O’Connor, D.; Nathanail, P.; Tian, L.; Ma, Y. Integrated GIS and multivariate statistical analysis for regional scale assessment of heavy metal soil contamination: A critical review. Environ. Pollut. 2017, 231, 1188–1200. [Google Scholar] [CrossRef]
- Jamil, M.; Malook, I.; Rehman, S.U.; Khan, M.D.; Fayyaz, M.; Aslam, M.M.; Rha, E.S. Multivariate geo-statistical perspective: Evaluation of agricultural soil contaminated by industrial estate’s effluents. Environ. Geochem. Health 2022, 44, 57–68. [Google Scholar] [CrossRef]
- Dragović, R.; Gajić, B.; Dragović, S.; Đorđević, M.; Đorđević, M.; Mihailović, N.; Onjia, A. Assessment of the impact of geographical factors on the spatial distribution of heavy metals in soils around the steel production facility in Smederevo (Serbia). J. Clean. Prod. 2014, 84, 550–562. [Google Scholar] [CrossRef]
- Qiao, P.; Yang, S.; Lei, M.; Chen, T.; Dong, N. Quantitative analysis of the factors influencing spatial distribution of soil heavy metals based on geographical detector. Sci. Total Environ. 2019, 664, 392–413. [Google Scholar] [CrossRef]
- Fan, H.; Chen, S.; Li, Z.; Liu, P.; Xu, C.; Yang, X. Assessment of heavy metals in water, sediment and shellfish organisms in typical areas of the Yangtze River Estuary, China. Mar. Pollut. Bull. 2020, 151, 110864. [Google Scholar] [CrossRef] [PubMed]
- Huang, S.; Xiao, L.; Zhang, Y.; Wang, L.; Tang, L. Interactive effects of natural and anthropogenic factors on heterogenetic accumulations of heavy metals in surface soils through geodetector analysis. Sci. Total Environ. 2021, 789, 147937. [Google Scholar] [CrossRef] [PubMed]
- Wang, J.; Li, X.; Christakos, G.; Liao, Y.; Zhang, T.; Gu, X.; Zheng, X. Geographical Detectors-Based Health Risk Assessment and its Application in the Neural Tube Defects Study of the Heshun Region, China. Int. J. Geogr. Inf. Sci. 2010, 24, 107–127. [Google Scholar] [CrossRef]
- Su, Y.; Li, T.; Cheng, S.; Wang, X. Spatial distribution exploration and driving factor identification for soil salinisation based on geodetector models in coastal area. Ecol. Eng. 2020, 156, 105961. [Google Scholar] [CrossRef]
- Du, Z.; Gao, B.; Ou, C.; Du, Z.; Yang, J.; Batsaikhan, B.; Dorjgotov, B.; Yun, W.; Zhu, D. A quantitative analysis of factors influencing organic matter concentration in the topsoil of black soil in northeast China based on spatial heterogeneous patterns. ISPRS Int. J. Geo-Inf. 2021, 10, 348. [Google Scholar] [CrossRef]
- Yan, P.; Shen, C.; Fan, L.; Li, X.; Zhang, L.; Zhang, L.; Han, W. Tea planting affects soil acidification and nitrogen and phosphorus distribution in soil. Agr. Ecosyst. Environ. 2018, 254, 20–25. [Google Scholar] [CrossRef]
- Hui, W.; Ren-Kou, X.; Ning, W.; Xing-Hui, L. Soil acidification of Alfisols as influenced by tea cultivation in eastern China. Pedosphere 2010, 20, 799–806. [Google Scholar]
- Reimann, C.; Fabian, K.; Birke, M.; Filzmoser, P.; Demetriades, A.; Négrel, P.; Sadeghi, M. GEMAS: Establishing geochemical background and threshold for 53 chemical elements in European agricultural soil. Appl. Geochem. 2018, 88, 302–318. [Google Scholar] [CrossRef] [Green Version]
- Burt, R.; Wilson, M.A.; Mays, M.D.; Lee, C.W. Major and trace elements of selected pedons in the USA. J. Environ. Qual. 2003, 32, 2109–2121. [Google Scholar] [CrossRef] [PubMed]
- CNEMC (China National Environmental Monitoring Center). The Soil Background Value in China; China Environmental Science Press: Beijing, China, 1990. [Google Scholar]
- Yang, S.H.; Qu, Y.J.; Ma, J.; Liu, L.L.; Wu, H.W.; Liu, Q.Y.; Gong, Y.W.; Chen, Y.X.; Wu, Y.H. Comparison of the concentrations, sources, and distributions of heavy metal(loid)s in agricultural soils of two provinces in the Yangtze River Delta, China. Environ. Pollut. 2020, 264, 114688. [Google Scholar] [CrossRef]
- Li, P.; Wu, T.; Jiang, G.; Pu, L.; Li, Y.; Zhang, J.; Xu, F.; Xie, X. An Integrated Approach for Source Apportionment and Health Risk Assessment of Heavy Metals in Subtropical Agricultural Soils, Eastern China. Land 2021, 10, 1016. [Google Scholar] [CrossRef]
- Liang, P.; Yang, X. Landscape spatial patterns in the Maowusu (Mu Us) Sandy Land, northern China and their impact factors. Catena 2016, 145, 321–333. [Google Scholar] [CrossRef]
- Cao, F.; Ge, Y.; Wang, J. Optimal discretization for geographical detectors-based risk assessment. Gisci. Remote Sens. 2013, 50, 78–92. [Google Scholar] [CrossRef]
- Ma, Y.; Hooda, P.S. Chromium, Nickel and Cobalt. Trace Elements in Soils; John Wiley & Sons Ltd.: Chippenham, UK, 2010; pp. 461–479. [Google Scholar]
- Wisawapipat, W.; Kretzschmar, R. Solid phase speciation and solubility of vanadium in highly weathered soils. Environ. Sci. Technol. 2017, 51, 8254–8262. [Google Scholar] [CrossRef] [PubMed]
- Rupert, L.H. Copper and Lead, Trace Elements in Soils; John Wiley & Sons Ltd.: Chippenham, UK, 2010; pp. 441–460. [Google Scholar]
- Jolokhava, T.; Abdaladze, O.; Gadilia, S.; Kikvidze, Z. Variable soil pH can drive changes in slope aspect preference of plants in alpine desert of the Central Great Caucasus (Kazbegi district, Georgia). Acta Oecol. 2020, 105, 103582. [Google Scholar] [CrossRef]
- Dorota, L.P.; Diana, H.W. Soil Conservation, Encyclopedia of Biodiversity, 2nd ed.; Elsevier Inc.: Amsterdam, The Netherlands, 2013; pp. 590–598. [Google Scholar]
- Scaccabarozzi, D.; Castillo, L.; Aromatisi, A.; Milne, L.; Búllon Castillo, A.; Muñoz-Rojas, M. Soil, site, and management factors affecting cadmium concentrations in cacao-growing soils. Agronomy 2020, 10, 806. [Google Scholar] [CrossRef]
- Goldberg, S.; Suarez, D.L. Influence of soil solution cation composition on boron adsorption by soils. Soil Sci. 2011, 176, 80–83. [Google Scholar] [CrossRef] [Green Version]
- Gustafsson, J.P. Modelling molybdate and tungstate adsorption to ferrihydrite. Chem. Geol. 2003, 200, 105–115. [Google Scholar] [CrossRef] [Green Version]
- Atafar, Z.; Mesdaghinia, A.; Nouri, J.; Homaee, M.; Yunesian, M.; Ahmadimoghaddam, M.; Mahvi, A.H. Effect of fertilizer application on soil heavy metal concentration. Environ. Monit. Assess. 2010, 160, 83–89. [Google Scholar] [CrossRef]
- Nicholson, F.A.; Smith, S.R.; Alloway, B.J.; Carlton-Smith, C.; Chambers, B.J. An inventory of heavy metals inputs to agricultural soils in England and Wales. Sci. Total Environ. 2003, 311, 205–219. [Google Scholar] [CrossRef]
- Li, S.; Jia, Z. Heavy metals in soils from a representative rapidly developing megacity (SW China): Levels, source identification and apportionment. Catena 2018, 163, 414–423. [Google Scholar] [CrossRef]
- Luo, H.; Liu, X.; Wang, S.; Liu, F.; Li, Y. Pollution characteristics and sources of cadmium in soils of the karst area in South China. Chin. J. Ecol. 2018, 37, 1538–1544. [Google Scholar]
- Liu, W. Analysis on metallogenic Conditions of San-Dan Gold-antimony mercury mineralization belt in Guizhou Province. Henan Sci. Technol. 2014, 4, 172–173. [Google Scholar]


Publisher’s Note: MDPI stays neutral with regard to jurisdictional claims in published maps and institutional affiliations. |
© 2022 by the authors. Licensee MDPI, Basel, Switzerland. This article is an open access article distributed under the terms and conditions of the Creative Commons Attribution (CC BY) license (https://creativecommons.org/licenses/by/4.0/).