Abstract
In this work, the stability of antioxidant compounds in malting barley seeds before and after the production of the final products is reported. In this reflection, the findings revealed that the process of fermentation had a significant impact on antioxidant activity. In vitro, antioxidant capacities were evaluated using DPPH free radical scavenging assay. The results obtained from the spectrophotometric analysis showed that the lowest inhibition value was observed in the samples that were obtained by the classical fermentation process (ABC) and the samples of non-alcoholic beer obtained by the thermal process (NABT), with free radical inhibition capacity values of 8.50% and 5.50%, respectively. The samples of hopped wort (HW) and malted barley seeds extract (BSE) showed very high antioxidant activity with free radical inhibition capacity of 14% and 12.60%, respectively. The obtained extracts were analyzed by gas chromatography and high-performance liquid chromatography, both combined with mass spectrometry detection (GC–MS, HPLC–MS). GC–MS analysis of the SPME extraction showed the presence of 29 compounds with isopentyl alcohol in major concentration (18.19%) in the alcoholic beer; on the other hand, the HPLC–DAD–ESI/MS analysis of the ethyl acetate extract showed the presence of 13 phenolic compounds. Interestingly, the degradation of 3-Hydroxyphloretin 2′-O-glucoside in the final products of the non-alcoholic beers was found. Finally, the FTIR analysis was also employed in order to detect the type of efficient groups present in the extracts.
1. Introduction
The food and drink processing sectors are undergoing an intense change in production conditions and systems. These changes are due, on the one hand, to modifications in the habits of our modern societies and, on the other hand, to the health requirements of each individual. Currently, one of the main trends in nutrition is the objective of physical health. This wellbeing is achieved by choosing foods that have a positive impact on health.
Barley is a herbaceous plant that is among the oldest cultivated cereals [1]. It is eaten raw or roasted and, in ancient times, was also used to make nutritious but very heavy bread. Today, only 33% of barley production in the world is intended for human consumption [2]. It is mainly germinated to make malt for beer and whisky. However, in the last few years, barley grass or grass juice made from young barley shoots has appeared for detox or nutritional purposes. The barley grain is rich in carbohydrates, which is a source of energy. Barley also contains fibers (especially hulled barley) that are good for digestion and bring satiety. Among these fibers, we find beta-glucans (soluble fibers), which play a crucial role in lowering blood cholesterol and bad cholesterol [3,4].
Several investigations have been focused on the study of the phenolic compounds because of their use in medication for a variety of diseases and their application in the conservation of comestible foodstuffs in the food industry [5]. Hence, their biological activities and health benefits also differ e.g., anti-inflammatory [6,7,8], anti-allergic [9], as well anti-carcinogenic properties [10,11]. Additionally, the phenolic compounds have gained the attention of nutritional and therapeutic scientists for their effective exercises and their aptitude to scavenge free radicals and break radical chain reactions. Likewise, the use of high phenols has been correlated with a plethora of various pharmacological activities [12,13,14,15].
Barley has been used as a source of extraction of beer, one of the first popular fermented beverages in the history of mankind; the brewing process of beer has not changed much since its discovery. Generally, the process is based on the natural enzymatic activity that occurs throughout the malting of the seeds, the brewing of the seeds, and the fermentation of the wort [16]. Beer is a complicated combination of ingredients that are fermented from raw material, yeast, malt, and hops, and includes a wide variety of several chemical elements that can act together at all phases of the brewing process [17]. Different groups of composites have been indicated to play a significant role in the flavor properties [18], for example, ketones, higher alcohols, aldehydes, esters, and organic acids, which contribute to the final sensory nature of beer, [19,20,21,22,23,24]. The production of non-alcoholic beer using the thermal process is mostly applied in industry; in this case the beer is degassed and subsequently preheated in a plate heat exchanger. Afterwards, the beer is fed into the stripping section of a rectification column and the product flows through the column at a temperature between 43 °C and 48 °C. In the countercurrent, the product meets rising vapors that cause the selective separation of the alcohol from the product. Afterwards, the alcohol-free beer is introduced into an evaporator where the rectification process takes place [25].
In this study, the stability of antioxidant compounds in malting barley seeds before and after the production of the final products was studied. These stability investigations were carried out in order to determine the most adequate control conditions while avoiding their degradation; also, the study aims to provide information on the impact of the fermentation processes on the products that are metabolized during this stage, which requires a strict control.
2. Materials and Methods
2.1. Samples
In the present work, barley seeds were ground and then degreased for 24 h with n-hexane with successive agitation at ambient temperature and were kept at 4 °C until use. Subsequently, the malted barley seeds were subjected to two fermentation methods, namely classical fermentation, and fermentation with a thermal process. The extracts obtained were analyzed by different techniques (Figure 1).
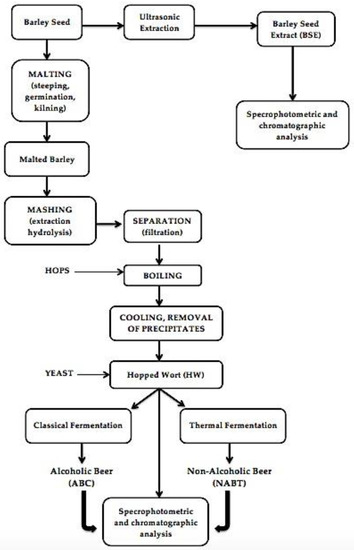
Figure 1.
Simplified flowchart of the procedure for the preparation of samples for analysis, during different production processes.
2.2. Extraction Method
An ultrasound-assisted extraction (EAU) process was used in order to extract the phenolic compounds (Ultrasonic homogenizer, UIP 1000 hdT, Hielscher Ultrasonics GmbH, Germany). For this aim, 15 g of defatted barley seeds were placed into the sonicator, adding 200 mL of acetone, ethanol, and methanol into each container. The temperature of the ultrasonic water bath was set at 50 °C. The process of extraction took 30 min and was repeated 3 times. The power of the sonicator used was 400 W [26]. Finally, the beer samples from the different fermentation methods were analyzed during the production of alcoholic and dealcoholized beer. The yeast was propagated from a freezing broth maintained at 150 °C [27].
2.3. Analysis by GC–MS and HPLC–PDA/ESI–MS
2.3.1. Standard Compounds (Reagents)
A C7–C40 saturated alkanes (1000 μg/mL) standard mixture in hexane (49452-U) supplied by Merck Life Science (Merck KGaA, Darmstadt, Germany) was utilized for the ALKANEs linear retention indices (LRIs) calculation.
2.3.2. SPME Extraction Conditions
For the solid-phase microextraction (SPME), a triphasic SPME fiber divinylbenzene/carboxen/polydimethylsiloxane (DVB/CAR/PDMS) 50/30 μm 1 cm long, provided by Merck Life Science (Merck KGaA, Darmstadt, Germany) was used, following a method previously optimized for the analysis of citrus flavored beer [28].
2.3.3. GC–MS Analyses
GC–MS analyses were conducted on a GC-QP2020 system (Shimadzu, Kyoto, Japan). For the separation an SLB-5ms fused-silica capillary column (30 m × 0.25 mm i.d. × 0.25 μm df) (Merck Life Science, Merck KGaA, Darmstadt, Germany) was applied. Experimental conditions were the same as reported in ref. [28].
2.3.4. HPLC–PDA/ESI–MS Analysis
HPLC–PDA/ESI–MS analyses were conducted on a Shimadzu liquid chromatography system comprising a CBM-20A controller, two LC-20AD dual-plunger parallel-flow pumps, a DGU-20A5R degasser, a SIL-20AC autosampler, and an LCMS-2020 MS system, through an ESI source (Shimadzu, Kyoto, Japan). Chromatographic separations were performed on 150 × 4.6 mm; 2.7 µm Ascentis Express C18 column (Merck Life Science, Merck KGaA, Darmstadt, Germany). The mobile phase was composed of the following two solvents: water (solvent A) and acetonitrile (solvent B), both acidified with 0.1 v/v of formic acid. Flow rate was fixed at 1 mL min−1 under the following gradient elution: 0–5 min, 0–2% B, 5–10 min, 2% B, 10–25 min, 2–12% B, 25–40 min, 12–60% B, 40–50 min, 60–70% B. MS analyses were carried out in negative and positive modes, and the conditions were as follows: scan range and scan speed were set at m/z 100–1200 and 5000 u/s, respectively, event time was 0.3 s, nebulizing gas (N2) flow rate was 1.5 L min−1, drying gas (N2) flow rate was 15 L/min, interface temperature was 350 °C, heat block temperature was 300 °C, DL (desolvation line) temperature was 250 °C, DL voltage was 1 V, and the interface voltage was 4.5 kV. The volume of injection was 10 µL.
2.4. Spectroscopic Analysis
FTIR–ATR analysis was carried out as follows: the liquid samples were analyzed by a Fourier transform infrared (FTIR) spectrometer with attenuated total reflectance (ATR), transmission, specular and diffuse reflectance, and Universal ATR, which enables fast analysis of liquids from 450 to 4000 cm−1 (PerkinElmer, Ground Floor, Room G31 Chemical Sciences Building (F10), UNSW Sydney Kensington, NSW 2052, Australia).
2.4.1. Spectroscopic Analysis of Polyphenols
The spectrophotometric analysis of polyphenols was achieved using a UV-1601 spectrophotometer from Shimadzu (Duisburg, Germany) and was replicated three times for each extract or calibration point (n = 3).
2.4.2. Determination of Total Phenolic Content (TPC)
The total phenolic content was determined based on a spectrophotometric method using the Folin–Ciocalteu reagent according to the method of Signleton et al. (1999) [29]. This reagent oxidizes the phenolic compounds, which turns the solution blue. The TPC was quantified from a calibration curve prepared with gallic acid standard (y = 1.552x + 0.208, R2 = 0.962) and expressed as mg of gallic acid equivalents (GAE) per 100 mL of sample (mg GAE 100 mL−1).
2.4.3. Determination of Flavonoid Content (TFC)
Total flavonoid content was performed using the aluminum chloride method (AlCl3) based on the protocol described by Kim et al. (2003) [30]. The TFC in samples was quantified from a calibration curve prepared with catechin standard (y = 2.857x + 0.080, R2 = 0.999) and expressed as mg of catechin equivalents (CE) per 100 mL of sample (mg CE 100 mL−1).
2.4.4. Determination of Free Radical Scavenging Potential by DPPH (2,2-Diphenyl-1-Picrylhydrazyl)
For the evaluation of free radical inhibition potential in beer samples by DPPH, a method reported in ref. [31] was employed, after minor modifications.
Preparation of the diluted sample was carried out as follows: 13.3 mL of degassed beer was diluted with water to 100 mL at a temperature of 20 °C in a volumetric flask and the solution was vortexed thoroughly; then 2.5 mL of diluted beer was added to 20 mL of ethanol and the combination was left to stand for 20 min at 20 °C; afterwards, it was filled up to a volume of 25 mL with attemperated ethanol, the solution was homogenized rigorously, finally the mixture was transferred to a fluted filter, to be filtered, and was retained at 20 °C until use.
Preparation of the diluted blank was carried out as follows: 2.5 mL of water was diluted with ethanol in a 25 mL volumetric flask and attemperated for 20 min at 20 °C. The mixture was further filtered through a fluted filter.
Preparation of the DPPH stock solution was carried out as follows: 0.06 mM of DPPH methanolic solution (0.0024 g DPPH/100 mL methanol) was attemperated for 20 min at 20 °C. The stock solution should be freshly used. Then, 1.5 mL of diluted sample was added to 1.5 mL of DPPH solution, the mixture was homogenized and kept for 30 min in the dark at room temperature and the absorbance was assessed at 517 nm against diluted blank. A total of 1.5 mL of diluted blank was added to 1.5 mL of DPPH solution and vortexed thoroughly. In addition, it was incubated in the dark for 30 min and the absorbance was measured at 517 nm versus diluted blank.
DPPH scavenging potential was expressed as a percentage of free radical scavenging activity (FRSA) with DPPH or as percentage inhibition of the free radical with DPPH, according to the following formula:
%I: Percentage of inhibition of free radical DPPH
A control: Absorbance of control
A sample: Absorbance of sample
3. Results and Discussion
3.1. GC–MS Analyses
The achieved findings of the GC–MS study of the SPME extraction revealed the existence of esters, alcohols, etc., (Table 1, Figure 2). A total of 29 compounds were identified. Isopentyl alcohol was the compound that was detected in major concentration (18.19%) in the alcoholic beer and such a compound is the one that mostly affects the aroma in alcohol. It influences the drinkability because the aroma of the beer becomes more pronounced if the concentration of isoamyl alcohol increases. Notably, isobutyl alcohol (0.95%) in the alcoholic beer has an adverse impact on the quality of beer if its concentration exceeds 20% of the total amount of n-propanol, isobutyl alcohol, and isoamyl alcohol. In humans, isoamyl alcohol causes sedative, hypnotic, and anticonvulsant effects similar to the effects of ethanol by ingestion or inhalation and was earlier utilized in medicine for these reasons [32].

Table 1.
List of compounds identified in alcoholic and non-alcoholic beer samples achieved by GC–MS.

Figure 2.
GC–MS chromatograms of alcoholic and non-alcoholic beer samples.
3.2. Phenolic Profile by HPLC–DAD–ESI/MS
In the interest to provide a phenolic characterization of alcoholic and non-alcoholic beer, an HPLC–DAD–ESI/MS method was used. Figure 3 and Table 2 describe the phenolic content of the ethyl acetate extract, which turned out to be the most complex one. A total of 13 compounds were identified and tentatively known based on their retention times, MS data, and comparison together with the information that was earlier described in the literature [33,34,35]. HPLC–MS analysis shows the degradation of antioxidants, such as 3-Hydroxyphloretin 2′-O-glucoside, in the finished product of non-alcoholic beers, depending on the fermentation process on which they are produced.

Figure 3.
Chromatogram of mass spectrometry in positive and negative modes of bioactive compounds in non-alcoholic (A) and alcoholic beers (B).
Table 2.
Characterization of phenolic compounds in alcoholic and non-alcoholic beer samples by HPLC–MS.
The final beer product under different conditions was analyzed by GC in order to identify its aromatic compounds (Table 3).
Table 3.
Aromatic compounds and turbidity of the final product of alcoholic and dealcoholized beer in various fermentation conditions, determined by GC.
Fermentation, coupled with the thermal process, represents the easiest method to create alcohol-free beer, the application of heat between 35 °C and 60 °C, until boiling, results in the elimination of alcohol and other volatile substances, such as esters and higher alcohols, consequently increasing the turbidity from 0.35 to 2.5 IBC (Table 3) [36]. The degradation and diminution of the solid content of the wort from 11.60 to 3.16 (wt%) shows that the quality of the non-alcoholic product is impacted by the production process.
3.3. Interpretation of Spectroscopic Analysis
The results are reported as the means of triplicates analysis. The data obtained were subjected to one-way analysis of variance (ANOVA) used to compare the difference between the means obtained by each type of sample (Table 4). This analysis showed that there was a significant difference between the means of all of the assays studied (p < 0.05).
Table 4.
Statistical analysis of the means performed by one-way analysis of variance (ANOVA).
The statistical analysis was performed by the statistical analysis software package, which stands for Statistical Package for Social Sciences (IBM SPSS Statistics 23.0, Chicago, IL, USA).
The results of the analyzed samples shown in Figure 4 show that the hopped wort (HW) sample contained flavonoids and total phenolics in higher concentrations (28.65 mg CE 100 mL−1, 65.12 mg GAE 100 mL−1, respectively) than the barley seed extract (BSE), which is reflected in their very high antioxidant activity with a free radical inhibition capacity of 14%, Figure 4a.

Figure 4.
Total flavonoid, phenolic contents (a), and percentage inhibition of free radical scavenging activity (b) of the analyzed samples. HW: Hopped Wort; BSE: Barley Seed Extract; ABC: Alcoholic Beer using Classical fermentation; BHT: Butylated hydroxytoluene; NABT: Non-Alcoholic Beer using Thermal process.
After the different fermentation processes, the highest concentration of flavonoids and total phenolic contents (18.05 mg CE 100 mL−1, 40.15 mg GAE 100 mL−1, respectively) was observed in the alcoholic beer by using classical fermentation (ABC), with a higher free radical scavenging capacity than the non-alcoholic beer by using the thermal process (NABT). The lowest concentration of flavonoids and total phenolic contents (10.01 mg CE 100 mL−1, 35.1 mg GAE 100 mL−1, respectively) was detected in the non-alcoholic beer by using thermal process (NABT) Figure 4b.
The FTIR spectra analysis of the barley seeds and beer are demonstrated in Figure 5, which displays the –OH functions associating phenol and alcohol from 3200 to 3400 cm−1, C-H cycloalkane bonds from 2850 to 2925 cm−1, C=O bonds of amides and aromatic ketones, N-H bonds of primary amines from 1550 to 1650 cm−1, C=O carboxylic acid from 1400 to 1450 cm−1, C-O bonds of esters between 1300 and 1450 cm−1, C-O bonds of primary and secondary alcohols between 1040 and 1090 cm−1, C-O ethers from 1000 to 1090 cm−1, Ar–C bonds of aromatics between 850 and 890 cm−1, and finally, monosubstituted aromatics from 700 to 800 cm−1.
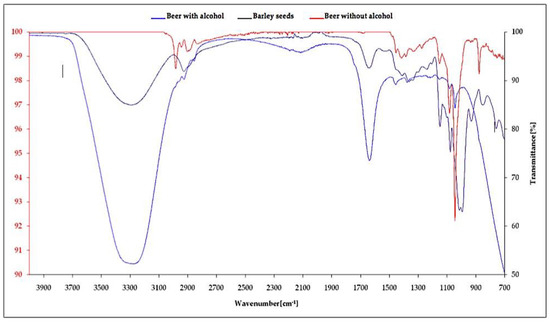
Figure 5.
FTIR (Fourier transform infrared spectroscopy) spectra of alcoholic, non-alcoholic beer, and barley seeds.
4. Conclusions
Spectrophotometric and chromatographic analysis at different stages of the production of alcoholic and non-alcoholic beer is essential in order to understand how to preserve the equilibrium between the different types of flavors, as well as the stability and evaluation of the antioxidant quality of the obtained product, which is related not only to the nature of the raw materials but also to the technological process, which has a direct impact on the antioxidant potential of the final products. In view of the increasing consumer interest in health issues and the problems associated with excessive alcohol consumption, breweries are being encouraged to expand their range of low-alcohol products. The objective of producing low-alcohol beers can be achieved through the thermal process, the gentle removal of alcohol from ordinary beer, and the limitation of ethanol formation during beer fermentation. Within this basic strategy, there are several methods that change in performance, efficiency, and ease of use. This study provides a comparison of these techniques and provides an evaluation of the sensory properties of the low alcohol and alcohol-free beers that are produced.
Author Contributions
Conceptualization, F.E.M. and J.B.; methodology, F.E.M. and H.E.F.; validation, F.E.M., H.E.F. and M.K.; investigation, F.E.M., E.T., H.E.F., Y.O.E.M. and M.K.; resources, J.B.; writing—original draft preparation, F.E.M.; writing—review and editing, F.C., M.P.L., L.M. and J.C.G.E.d.S.; supervision, F.C. and J.B.; project administration, J.B. and J.C.G.E.d.S. All authors have read and agreed to the published version of the manuscript.
Funding
This research received no external funding.
Institutional Review Board Statement
Not applicable.
Informed Consent Statement
Not applicable.
Data Availability Statement
Not applicable.
Acknowledgments
The authors are thankful to Shimadzu and Merck Life Science Corporations for the continuous support.
Conflicts of Interest
The authors declare no conflict of interest.
References
- Chen, X.; Shao, S.; Chen, M.; Hou, M.; Yu, X.; Xiong, F. Morphology and physicochemical properties of starch from waxy and non-waxy barley. Starch-Stearke 2020, 72, 5–6. [Google Scholar] [CrossRef]
- Wang, J.; Sun, B.; Cao, R. Bioactive Factors and Processing Technology for Cereal Foods; Springer: Singapore, 2019. [Google Scholar]
- Suriano, S.; Iannucci, A.; Codianni, P.; Fares, C.; Russo, M.; Pecchion, N.; Savino, M. Phenolic acids profile, nutritional and phytochemical compounds, antioxidant properties incolored barley grown in southern Italy. Food Res. Int. 2018, 113, 221–233. [Google Scholar] [CrossRef] [PubMed]
- Zhao, L.; Zhang, F.; Ding, X.; Wu, G.; Lam, Y.; Wang, X.; Zhang, C. Gut bacteria selectively promoted by dietary fibers alleviate type 2 diabetes. Science 2018, 359, 1151–1156. [Google Scholar] [CrossRef] [PubMed]
- Pan, Y.; Wang, K.; Huang, S.; Wang, H.; Mu, X.; He, C.; Ji, X.; Zhang, J.; Huang, F. Antioxydant activity of microwave-assisted extract of longan (Dimocarpus Longan Lour.) peel. Food Chem. 2008, 106, 1264–1270. [Google Scholar] [CrossRef]
- Castilla, P.; Echarri, R.; Dávalos, A.; Cerrato, F.; Ortega, H.; Luis Teruel, J.; Fernández Lucas, M.; Gómez-Coronado, D.; Ortuño, J.; Lasunción, M.A. Concentrated red grape juice exerts antioxidant. hypolipidemic. and antiinflammatory effects in both hemodialysis patients and healthy subjects. Am. J. Clin. Nutrit. 2006, 84, 252. [Google Scholar] [CrossRef]
- Greenspan, P.; Bauer, J.D.; Pollock, S.H.; David Gangemi, J.; Mayer, E.P.; Ghaffar, A.; Hargrove, J.L.; Hartle, D.K. Antiinflammatory Properties of the Muscadine Grape (Vitis rotundifolia). J. Agric. Food Chem. 2005, 53, 8481. [Google Scholar] [CrossRef]
- Akiyama, H.; Sakushima, J.; Taniuchi, S.; Kanda, T.; Yanagida, A.; Kojima, T.; Teshima, R.; Kobayashi, Y.; Goda, Y.; Toyoda, M. Antiallergic effect of apple polyphenols on the allergic model mouse. Biol. Pharm. Bull. 2000, 23, 1370. [Google Scholar] [CrossRef]
- Ghedira, K. Les flavonoïdes: Structure. propriétés biologiques. rôle prophylactique et emplois en thérapeutique. Phytothérapie 2005, 3, 162–169. [Google Scholar] [CrossRef]
- Morré, D.M.; James Morre, D. Anticancer activity of grape and grape skin extracts alone and combined with green tea infusions. Cancer Lett. 2006, 238, 202. [Google Scholar] [CrossRef]
- Bradamante, S.; Barenghi, L.; Villa, A. Cardiovascular protective effects of resveratrol. Cardiovasc. Drug Rev. 2004, 22, 169. [Google Scholar] [CrossRef]
- Kahkonen, M.P.; Hopia, A.I.; Vuorela, H.J.; Rauha, J.P.; Pihlaja, K.; Kujala, T.S.; Heinonen, M. Antioxidant activity of plant extracts containing phenolic compounds. J. Agric. Food. Chem. 1999, 47, 3954–3962. [Google Scholar] [CrossRef] [PubMed]
- Tapiero, H.; Tew, K.D.; Ba, G.N.; Mathe, G. Polyphenols: Do they play a role in the prevention of human pathologies. Biomed. Pharmacother. 2002, 56, 200–207. [Google Scholar] [CrossRef]
- Svobodová, A.; Psotová, J.; Walterová, D. Natural phenolics in the prevention of UV-induced skin damage. Biomed Pap. 2003, 147, 137–145. [Google Scholar] [CrossRef]
- King, P.J.; Robinson, W.E., Jr. Resistance to the anti-human immunodeficiency virus type 1 compound L-chicoric acid results from a single mutation at amino acid 140 of integrase. Virol. J. 1998, 72, 8420–8424. [Google Scholar] [CrossRef] [PubMed]
- Bamforth, C.W. Current perspectives on the role of enzymes in brewing. J. Cereal Sci. 2009, 50, 353–357. [Google Scholar] [CrossRef]
- Olaniran, A.O.; Hiralal., L.; Mokoena., M.P.; Pillay., B. Flavour-active volatile compounds in beer: Production, regulation and control. J. Inst. Brew. 2017, 123, 13–23. [Google Scholar] [CrossRef]
- Guido, L.F.; Rodrigues., P.G.; Rodrigues., J.A.; Gonçalves., C.R.; Barros., A.A. The impact of the physiological condition of the pitching yeast on beer flavor stability: An industrial approach. Food Chem. 2004, 87, 187–193. [Google Scholar] [CrossRef]
- Pires, E.J.; Teixeira., J.A.; Branyik., T.; Vicente., A.A. Yeast: The soul of beer’s aroma a review of flavor Active esters and higher alcohols produced by the brewing yeast. Appl. Microbiol. Biotechnol. 2014, 98, 1937–1949. [Google Scholar] [CrossRef]
- Kunze, W. Technology Brewing and Malting; VLB Berlin: Berlin, Germany, 1996. [Google Scholar]
- Piddocke, M.; Olsson., L. Beer Brewing. In Applications of Metabolic Engineering; John Wiley & Sons Inc.: Hoboken, NJ, USA, 2010. [Google Scholar]
- Saerens, S.M.G.; Duong., C.T.; Nevoigt., E. Genetic improvement of brewer’s yeast: Current state. perspectives. and limits. Appl. Microbiol. Biotechnol. 2010, 86, 1195–1212. [Google Scholar] [CrossRef]
- Kopsahelis, N.; Kanellaki., M.; Bekatorou., A. Low temperature brewing using cells immobilized on brewer’s spent grains. Food Chem. 2007, 104, 480–488. [Google Scholar] [CrossRef]
- Witrick, K.; Pitts., E.R.; O’Keefe., S.F. Analysis of Lambic Beer Volatiles during Aging Using Gas Chromatography–Mass Spectrometry (GCMS) and Gas Chromatography–Olfactometry (GCO). Beverages 2020, 6, 31. [Google Scholar] [CrossRef]
- Montanari, L.; Marconi, O.; Mayer, H.; Fantozzi, P. Production of Alcohol-Free Beer. In Beer in Health and Disease Prevention; Academic Press: Cambridge, MA, USA, 2009; pp. 61–75. [Google Scholar]
- EL Mansouri, F.; Lovillo, M.P.; El Farissi, H.; Oufdou, H.; Brigui, J. Extraction analysis of polyphenols and antioxidant properties of morrocan barley seed extracts (Hordeum vulgare L.). Mater. Today Proc. 2021, 43, 1896–1902. [Google Scholar] [CrossRef]
- Mansouri, F.E.; Farissi., H.E.; Cacciola., F.; Bouhcain., B.; Silva., J.C.G.E.d.; Lovillo., M.P.; Brigui., J. Optimal Design Approach Applied to Headspace GC for the Monitoring of Diacetyl Concentration. Spectrophotometric Assessment of Phenolic Compounds and Antioxidant Potential in Different Fermentation Processes of Barley. Appl. Sci. 2022, 12, 37. [Google Scholar] [CrossRef]
- Trovato, E.; Arigò, A.; Vento, F.; Micalizzi, G.; Dugo, P.; Mondello, L. Influence of Citrus Flavor Addition in Brewing Process: Characterization of the Volatile and Non-Volatile Profile to Prevent Frauds and Adulterations. Separations 2021, 8, 18. [Google Scholar] [CrossRef]
- Singleton, V.L.; Orthofer, R.; Lamuela-Raventós, R.M. Analysis of Total Phenols and Other Oxidation Substrates and Antioxidants by Means of Folin-Ciocalteu Reagent. Methods Enzymol. 1999, 299, 152–178. [Google Scholar]
- Kim, D.O.; Jeong, S.W.; Lee, C.Y. Antioxidant Capacity of Phenolic Phytochemicals from Various Cultivars of Plums. Food Chem. 2003, 81, 321–326. [Google Scholar] [CrossRef]
- Benkeblia, N. Free radical scavenging capacity and antioxidant properties of some selected onions (Aliium cepa L.) and garlic (Aliium sativum L.) extracts. Braz. Arch. Biol. Technol. 2005, 48, 1–8. [Google Scholar] [CrossRef]
- Quifer-Rada, P.; Vallverdú-Queralt, A.; Martínez-Huélamo, M.; Chiva-Blanch, G.; Jáuregui, O.; Estruch, R.; Lamuela-Raventós, R. A Comprehensive Characterisation of Beer Polyphenols by High Resolution Mass Spectrometry (LC–ESI-LTQ-Orbitrap-MS). Food Chem. 2015, 169, 336–343. [Google Scholar] [CrossRef]
- Tang, J.; Dunshea, F.R.; Suleria, H.A. LC-ESI-QTOF/MS Characterization of Phenolic Compounds from Medicinal Plants (Hops and Juniper Berries) and Their Antioxidant Activity. Foods 2019, 9, 7. [Google Scholar] [CrossRef]
- Cortese, M.; Gigliobianco, M.R.; Peregrina, D.V.; Sagratini, G.; Censi, R.; Di Martino, P. Quantification of Phenolic Compounds in Different Types of Crafts Beers. Worts. Starting and Spent Ingredients by Liquid Chromatography-Tandem Mass Spectrometry. J. Chromatogr. A 2020, 1612, 460622. [Google Scholar] [CrossRef]
- Meilgaard, M. Stale flavor carbonyls in brewing. Brew. Dig. 1972, 47, 48–57. [Google Scholar]
- Zufall, C.; Wackerbauer, K. Verfahrenstechnische parameter bei der entalkoholisierung von bier mittels fallstromverdampfung und ihr einfluß auf die bierqualität. Mon. f. Brauwiss 2000, 53, 124–179. [Google Scholar]


Publisher’s Note: MDPI stays neutral with regard to jurisdictional claims in published maps and institutional affiliations. |
© 2022 by the authors. Licensee MDPI, Basel, Switzerland. This article is an open access article distributed under the terms and conditions of the Creative Commons Attribution (CC BY) license (https://creativecommons.org/licenses/by/4.0/).