Abstract
Flavanols are a class of polyphenols that have become the focus of much research because of their medicinal properties. For this paper, a new method to determine polyphenols in nutraceutical samples was developed, based on solid-liquid extraction and further analysis by liquid chromatography. Analytes were recovered by ultrasound-assisted extraction, using a mixture of methanol/water/hydrochloric acid (70:29:1, v:v:v) as the solvent. Reversed-phase high-performance liquid chromatography with ultraviolet/visible (HPLC-UV/Vis) and fluorescence detection (HPLC-FLD) were developed to determine the content of the principal flavanols. The HPLC-FLD method showed better selectivity and sensitivity, so it was selected for further studies. The analytical parameters established with FLD were satisfactory in terms of linearity (R2 ≥ 0.993), repeatability (RSD% ≥ 2.2), and limits of detection of 0.1 mg L−1 or below. The nutraceutical samples were analyzed by HPLC-FLD to determine the compositional profiles of flavanols, then they were subsequently treated using chemometric methods, such as principal component analysis (PCA). Results showed that the study of compositional profiles from the selected flavanols was sufficient for description and discrimination purposes. The cranberry samples were the richest in flavanols, procyanidin A2 being the principal flavanol, and artichoke samples the least rich.
1. Introduction
The pharmaceutical industry produces nutraceuticals made from different plant leaves and flowers (i.e., tea, grapevine, and artichoke) and fruits (i.e., cranberry, raspberry, grape) due to their medicinal properties, which are mainly associated with antioxidant features. These products are used as a source of flavonoids, representing 60% of nutraceutical polyphenolic compounds. Flavonoids consist of two phenyl rings linked by three carbon atoms that form an oxygen heterocycle ring [1,2].
Flavonoids are divided into six groups of molecules, differing in the degree of hydrogenation and hydroxylation of the three-ring system. Nowadays, there is high interest in the group belonging to flavanols, specifically regarding the polymeric structures known as proanthocyanins (PACs) or condensed tannins, which are useful in the prevention and treatment of urinary tract infections (UTIs) [3]. PACs are formed principally from the condensation of catechin and epicatechin through the interflavan linkages of the B-type and A-type [1,2,4]. The B-type link is the most common one and consists of a single bond between C4 of the upper monomer and C6 to C8 of the lower monomer. However, some PACs have an additional interflavan bond, the so-called A-type, which consists of an oxygen bridge between C2 of the upper monomer and C5 or C7 of the lower monomer, and it is less abundant [5]. Apart from the different chemical structures, the most important difference in bioactivity between these molecules is that only A-type PACs can inhibit Escherichia coli adhesion to bladder receptor cells [2].
There are different well-known methods for the quantification of flavanols. The spectrophotometric assay, based on 4-dimethylaminocinnamaldehyde (DMAC), is currently used in the pharmaceutical industry to determine the total flavanol content. This assay shows some advantages over other spectrophotometric methods (n-butanol hydrochloride and vanillin-acid), such as the reduction of reagent consumption, simplicity, shorter analysis time, and a better selectivity regarding other polyphenolic interferences [6,7,8,9]. The reaction mechanism relies on forming an electrophilic carbocation in acid media that reacts with C8 of the flavanol phenyl ring, involving derivatives detected at 640 nm [8]. Anyway, as commented above, the DMAC method provides a global index of flavanols without the possibility of either profiling or discerning the A-type versus other species, so alternative methods for solving these issues are welcome.
Another approach is based on the determination of flavanols by reversed-phase high-performance liquid chromatography (RP–HPLC) with UV/Vis and fluorescence detection (FLD) [10,11,12,13]. Nevertheless, the RP mode shows limitations regarding separate PAC oligomers; normal-phase (NP) chromatography is required instead. For instance, Hammerstone et al. separated oligomers up to a polymerization degree (DP) of 10 units [14]. Similarly, hydrophilic interaction liquid chromatography (HILIC) allows researchers to obtain a good separation of oligomers. The HILIC mode can be based on a silica column, using acidified acetonitrile and methanol in the mobile phase. Vidal-Casanella et al. separated oligomers up to a DP of 6 units. This method was used in profiling and fingerprinting strategies to characterize nutraceutical samples according to their flavanol composition by chemometric methods, such as principal component analysis (PCA) and partial least squares discriminant analysis (PLS-DA) [15]. Although the NP-HPLC and HILIC have a better capacity to separate oligomers than RP-HPLC, the lack of available commercial standards of these oligomers from a DP higher than three units hinders the identification and quantification of these compounds. Consequently, HPLC techniques using mass spectrometry (MS), such as HPLC-MS and HPLC-MS/MS, were applied to identify and characterize the oligomeric compounds [5,10,11,16,17,18,19]. As an alternative to the direct detection of flavanols, Vidal-Casanella et al. proposed a new method utilizing RP-HPLC-UV/Vis with pre-column derivatization using DMAC [9].
Studies reporting the optimization of the extraction of flavanols in food products pointed out the significance of certain experimental variables, such as solvent volume, solvent composition, temperature, and time [20,21,22,23]. For instance, the extraction of PACs from cranberries has been successfully carried out using aqueous acid mixtures of acetone, ethanol, and methanol [24,25,26,27].
This research aims at characterizing nutraceuticals made with berries and other plant ingredients. This exploratory study relies on flavanol profiles for the data. Flavanols have been recovered by ultrasound-assisted extraction (UAE) using mixtures of water, methanol, and a small percentage of hydrochloric acid. The UAE procedure has been optimized by an experimental design, the variables under study being the solvent composition, extraction time, and temperature. The total flavanol concentration of the extracts has been determined spectrophotometrically by the DMAC method, adapted from the work of Vidal-Casanella et al. [8]. Additionally, a new chromatographic method using HPLC has been developed for flavanol profiling. The optimal conditions require the separation of the maximum number of compounds in the analyzed samples. Subsequently, the samples were characterized chemometrically.
2. Materials and Methods
2.1. Reagents and Solutions
Procyanidin A2 (>99%) and procyanidin C1 (>99%) were purchased from Phytolab (Vestenbergsgreuth, Germany); procyanidin B2 (>98%) was purchased from Chengdu Biopurify Phytochemicals (Chengdu, China); catechin (>98%) and epicatechin (>98%) were purchased from Sigma-Aldrich (St Louis, MO, USA); and epigallocatechin (>98%) was purchased from Carbosynth (Berkshire, UK). The 4-dimethylaminocinnamaldehyde (>98%, DMAC) was purchased from Tokyo Chemical Industry (Tokyo, Japan).
Hydrochloric acid (37%, Panreac, Barcelona, Spain), formic acid (≥95%, Sigma-Aldrich), methanol and ethanol (99.9%, UHPLC Supergradient, Panreac), and acetone (Merck, Darmstadt, Germany) were also used. The purified water came from an Elix 3 coupled to a Mili-Q system (Bedford, MA, USA) and was filtered through a membrane with 0.22 μm of pore size. The purity of the water was monitored by conductivity (it should be lower than 0.056 µS cm−1).
The individual standard solutions at 1000 mg L−1 of each compound were prepared, using methanol as the solvent. These stock standards were further diluted with H2O/MeOH (75:25, v:v) to prepare the working solutions. The derivatization reagent was 0.16% (w:v) DMAC, with 0.2 M HCl. It was prepared daily and stored at 4 °C.
2.2. Instruments
An Agilent Series 1100 HPLC chromatograph (Agilent, Technologies, Palo Alto, CA, USA) was used, equipped with a binary pump (G1312A), an autosampler (G1379A), a degasser system (G1379A), a diode array (DAD, G1315B), and fluorescence (FLD, G1321A) detectors. The compounds were separated in a Kinetex C18 column (100 mm length × 4.6 mm I.D., 2.6 µm particle size) with a C18 pre-column (4.00 mm length × 3.00 mm I.D.) from Phenomenex (Torrance, CA, USA).
The total flavanol (TF) content was estimated with a Lambda19 double beam UV–Vis–NIR spectrophotometer (Perkin Elmer, Waltham, MA, USA) using the DMAC spectrophotometric method to identify the best extraction conditions. Measurements were performed with 10-millimeter path-length cells (QS quartz glass, Hellma, Müllheim, Germany). The absorbance was recorded at 640 nm.
2.3. Samples
24 nutraceutical samples were purchased from herbalist shops in Barcelona (Spain) and Gdansk (Poland). The principal characteristics are shown in Table 1.

Table 1.
List of samples under study, with some relevant features.
2.4. Sample Treatment
Nutraceutical products in the pharmaceutical forms of capsules or tablets were randomly collected (10 units), crushed, and homogenized to obtain a representative laboratory sample. Next, 0.1 g of each powdered sample, accurately weighed with a PB1502-L analytical balance (Mettler-Toledo, Columbus, OH, USA), was extracted with 5 mL of MeOH/H2O/HCl (70:29:1, v:v:v) in 15 mL polypropylene conical tubes with a Branson 5510 ultrasonic bath (Branson Ultrasonic Corporation, Danbury, CT, USA), working at a frequency of 40 kHz and a power of 130 W for 30 min. The water temperature was set at 55 °C using an immersion thermostat, IT-3 SBS (Instrumentación Científica Técnica, Lardero, Spain). The resulting extracts were centrifuged for 15 min at 3200× g, using a Rotanta 460 RS centrifuge (Hettich, Tuttlingen, Germany), and were filtered through nylon membranes of 0.45 µm pore size (20 mm diameter, Macherey-Nagel, Düren, Germany). Extractions were carried out in triplicate.
A quality control (QC) solution was prepared by mixing 100 µL of each sample extract. The QC solution was used to assess the quality of the PCA models.
2.5. Chromatographic Method for Flavanol Profiling
The chromatographic method was based on reversed-phase HPLC, with UV/Vis and FLD detection. The separation was carried out in a Kinetex C18 column (150 × 4.6 mm of 100 Å pore size and 2.6 μm particle size) from Phenomenex (Torrance, CA, USA), using 0.1% formic acid solution in water (solvent A) and methanol (solvent B) as the components of the mobile phase. The elution gradient was as follows: 5% to 95% MeOH, from 0 to 20 min (linear increase, separation step); 95% MeOH, from 20 to 22 min (cleaning step); 95% to 5% MeOH, from 22 to 22.1 min (linear decrease); from 22.1 to 25 min, 5% MeOH (column conditioning). The UV/Vis detection was at 280 nm, and FLD was λexcitation at 276 and λemission at 320 nm. Apart from the flavanols, phenolic acids were also detected by UV-Vis at 280 nm. In contrast, the FLD at the selected excitation and emission wavelengths was suitable for the more selective detection of flavanol components, while the fluorescence intensity associated with hydroxybenzoic acids, hydroxycinnamic acids, and other flavonoid families was negligible.
2.6. Spectrophotometric Method for Total Flavanol Content
The total flavanol content in the samples was determined spectrophotometrically by mixing 100 µL of DMAC solution with appropriate volumes of samples or standards and diluting up to 2.5 mL with H2O/MeOH (75:25, v:v). The solutions were mixed and maintained for 1 h in amber glass vials and were then transferred to standard quartz cuvettes to carry out the spectrophotometric measurements at 640 nm. Procyanidin A2 standards were prepared at concentrations of 0.625, 1.25, 2.5, 5.0, 10.0, 20.0, 40.0, and 80.0 μg mL−1. The total flavanol content was expressed in mg procyanidin A2 per gram dry weight (mg A2 g−1 dw).
2.7. Data Analysis
An analysis of variance (ANOVA) was applied to find out the relevant factors influencing the extraction conditions of the solvent. Calculations were performed using Excel software.
The PLS-Toolbox (Eigenvector Research, Manson, WA, USA) was used for principal component analysis (PCA), using both chromatographic fingerprints and flavanol concentrations. Data from HPLC-FLD was taken within the working range of 6.28 to 19.29 min. The plots of scores showing the distribution of the samples on the principal components (PCs) were used to differentiate the samples according to their fruit variety. The plots of loadings allowed the researchers to identify the most discriminant species.
3. Results and Discussion
3.1. Optimization of the Extraction Conditions
The extraction method was focused on the recovery of flavanols from the nutraceutical products to achieve the maximum overall amounts. A range of solvents, from less polar options (e.g., chloroform) to polar ones (water, dimethyl sulfoxide, and methanol) were preliminarily tested. These results showed that hydro-organic mixtures containing a high percentage of polar organic solvents provided better results. Hence, acetone and methanol were selected here for a more comprehensive study of the influence of the organic solvent percentage on flavanol extraction.
As indicated in the experimental section, the total flavanol content in the extracts was determined using the DMAC spectrophotometric assay, based on the formation of colored derivatives that were detected at 640 nm. The variables under study were solvent composition (including solvent type, solvent percentage, and HCl percentage), processing temperature, and time. Preliminary results suggested that chemical (solvent composition) and physical (temperature and time) variables did not interact, so their influence on the extraction yield could be studied independently. In this way, the extraction solvent composition was optimized by a factorial design (see Section 3.1.1). Once the optimal solvent conditions were chosen, they were used to investigate the effect of temperature and extraction time (see Section 3.1.2). A cranberry sample was used as a representative matrix as it contained a wide variety of polyphenolic compounds.
3.1.1. Solvent Composition
A preliminary study of three factors at two levels was designed, with the solvent type (methanol and acetone), solvent percentage (60 and 80%), and HCl percentage (0 and 1%) being the variables under study (the levels are in parentheses). Each condition was replicated 3 times using 0.1 g of the sample and 5 mL of each solvent composition. The resulting extracts were analyzed spectrophotometrically according to the DMAC spectrophotometric assay to determine the total flavanol content. The results showed that solvent type, HCl percentage, and the interactions among solvent type and HCl percentage, and among solvent percentage and HCl percentage, were statistically relevant (p < 0.01). These results endorsed two additional designs for the simultaneous exploration of (i) solvent type and HCl percentage and (ii) solvent percentage and HCl percentage. Conversely, the interaction between solvent type and solvent concentration was negligible, so the simultaneous influence of these variables was disregarded.
In terms of solvent type and HCl percentage, the optimization relied on factorial design at three levels, these being acetone, ethanol, and methanol, the three organic solvents studied, and 0, 0.5, and 1% (v/v) being the HCl percentages assayed. It should be noted that ethanol was included in the study as an intermediate solvent between the characteristics of acetone and methanol. Hence, 27 different extraction runs were carried out (9 conditions with 3 replicates each). The results in Figure 1a show the TF extraction as a function of the experimental conditions. The best recoveries corresponded to methanol as the solvent; the behavior of ethanol was similar, while acetone exhibited the poorest performance. Regarding HCl content, we found that, in general, TF content increased with increasing the acidity, except for the acetone system. A statistical analysis of the influence of the solvent type and the HCl percentage on the extraction yield, according to a 2-factor ANOVA with replicates (n = 3), revealed that both variables were statistically significant (HCl, p < 3.2 × 10⁻⁸ and solvent, p < 2.1 × 10⁻⁷). The interaction was also relevant (p < 9.7 × 10⁻⁶), meaning that the magnitude of the HCl effect depended on the solvent, and vice versa. For instance, this interaction can be visualized when comparing the behavior of acetone and methanol, in which the influence of the acid media can be negligible (acetone) or remarkable (methanol). From this study, we concluded that methanol was a suitable extraction solvent.
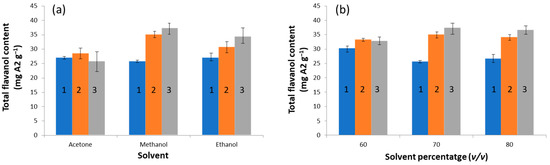
Figure 1.
Effect of solvent composition on the extraction. (a) The influence of solvent type and HCl percentage on the total flavanol content; conditions: 70% (v/v) organic solvent. (b) The influence of solvent percentage and HCl concentration on the total flavanol content, using methanol as the solvent. HCl concentration assignment: 1 = 0% HCl, 2 = 0.5% HCl, and 3 = 1% HCl.
As in the previous system, another study simultaneously assessed the influence of the methanol and HCl percentages on the extraction yield, based on a factorial design at three levels with 3 replicates for each condition, where the selected levels were 60, 70, and 80% (v/v) of organic solvent and 0, 0.5 and 1% (v/v) of HCl. The results (see Figure 1b) indicated that TF values increased with increasing the HCl percentage, while, within the experimental domain under study, the influence of the solvent percentage was less noticeable. These conclusions were statistically checked using a 2-factor ANOVA with replicates (n = 3), proving that the HCl percentage was significant (p < 0.034) and the methanol percentage was not (p > 0.96); the interaction was irrelevant as well. Surprisingly, even though the percentage of organic solvent was expected to be reasonably important to the extraction process, its influence on this experimental plan was less remarkable due to the narrow experimental range of the study, meaning that the working percentages were already in the optimum zone. Regarding the solvent’s acidity, 1% HCl was selected for further experiments.
The best flavanol recovery was then obtained with the mixture MeOH/H2O/HCl (70:29:1, v:v:v) with 37.4 mg A2 g−1 dw. Thus, this mixture was selected for the extraction of these compounds from the cranberry samples.
3.1.2. Extraction Time and Temperature
Once the solvent composition was selected, the influence of the physical variables such as temperature and time on the extraction was evaluated by a 2-factor at 3-level design using MeOH/H2O/HCl (70:29:1, v:v:v) as the extraction solvent. The working levels were 20, 40, and 55 °C in terms of temperature and 15, 30, and 45 min in terms of time; each condition was assayed in triplicate. Results from the 9-run experimental plan were fitted to a response surface to identify the optimal conditions (Figure 2). The results showed that the extraction of flavanols increased with temperature. Furthermore, a positive effect was also observed on the extraction time since longer processes caused the TF content to rise. Around 35 min and at a temperature greater than 25 °C, a slight decrease in response was observed. This finding was attributed to the effect of prolonged exposure at high temperatures, which might produce the degradation of these compounds. The statistical evaluation of TF data by a 2-factor ANOVA with replicates demonstrated that both temperature (p < 0.01) and time (p < 10−15) were statistically significant, while, using the current data, their interaction was found to now be negligible (p > 0.12), meaning that the behavior of one variable was independent of the other. As a result, the conditions finally selected for carrying out the extraction of flavanols from the samples were set at 55 °C and 30 min.
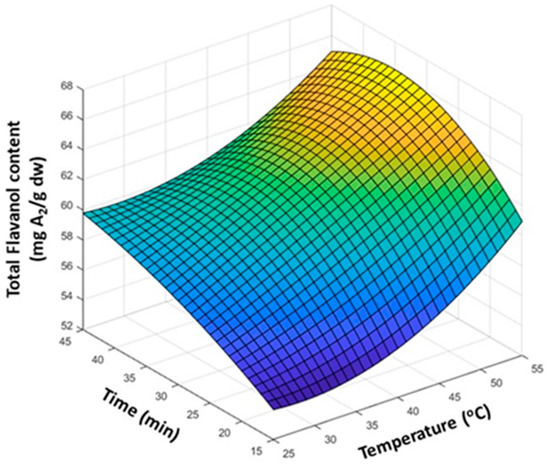
Figure 2.
Response surface plot, with the influence of the extraction time and temperature on the recovery of flavanols from cranberry extract. The total flavanol content was determined with a DMAC spectrophotometric assay.
3.2. Optimization of the HPLC Method
A mixture of standards comprising catechin, epicatechin, epigallocatechin, and procyanidins A2, B2, and C1, at a concentration of 20 mg L−1 each, was prepared in an amber vial. Then, a factorial design was defined to establish the optimal chromatographic separation conditions, with the initial methanol percentage in the mobile phase and gradient time being the assayed variables. The levels selected were 3, 5, and 15% (v/v) of initial methanol and 10, 20, and 30 min of gradient time. The optimal chromatographic conditions presented a suitable compromise regarding separation and analysis time. Hence, the separation performance was mathematically estimated from the chromatographic resolution of close eluting peaks (catechin/procyanidin B2 and procyanidin C1/epicatechin) and the retention time (tR) of the last analyte (procyanidin A2). The overall compromise among these three complementary criteria was expressed with a desirability function (D) as follows: D = (dRcat/B2 × dRC1/epi × dtR)1/3, with dRcat/B2, dRC1/epi and dtR being the contributions of catechin/procyanidin B2 resolution, procyanidin C1/epicatechin resolution and last analyte retention time, respectively. These individual contributions were normalized values (from 0 to 1) for resolution and analysis time. Figure 3a shows the effect of the initial percentage of methanol and gradient time on desirability. The best separation run corresponded to a 5% initial methanol and 20 min gradient time. Chromatograms of the mixture of standards and representative cranberry extract under selected conditions are shown in Figure 3b. As can be seen, the chromatographic resolutions between standards were better than 1.3. In the case of the cranberry extract, the chromatogram was rich in flavanols so this type of data could be suitable for the further characterization of nutraceutical samples based on fingerprinting approaches and assisted by chemometric data analysis.
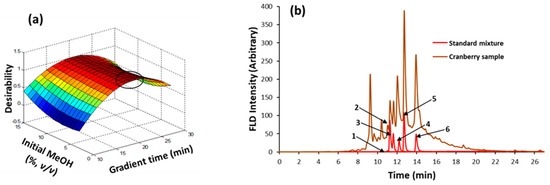
Figure 3.
Optimization of the separation of flavanols by reversed-phase HPLC: (a) response surface plot with the influence of the initial MeOH percentage and gradient time on the separation performance expressed as a desirability function. (b) Chromatograms of the standards mixture and a cranberry sample under selected conditions, as follows: 5% initial MeOH percentage; 20 min gradient time; FLD at 276 nm excitation and 320 nm emission wavelengths. Compound assignment: 1 = epigallocatechin; 2 = catechin; 3 = procyanidin B2; 4 = procyanidin C1; 5 = epicatechin; 6 = procyanidin A2.
Regarding the detection technique, FLD (λexc 276 nm and λem 320 nm) provided high selectivity compared to UV/Vis (λ 280 nm) because of the lower number of peaks of other phenolic components in the FLD chromatograms. The sensitivity of FLD was also better. Therefore, FLD was selected to establish the compositional profiles and fingerprints of the nutraceutical samples for the intended study.
3.3. Analytical Parameters of the HPLC-FLD Method
Figures of merit of the proposed method were established under optimal working conditions, using the corresponding standard solutions of catechin, epicatechin, and procyanidins A2, B1, and C1. The results of linearity, repeatability, detection limit, and quantification limit tests are summarized in Table 2. As can be seen, the linearity is excellent and the repeatability is below 0.6% and 2.5% for retention time and peak area, respectively. Limits of detection are in the order of magnitude of 0.1 mg L−1. The accuracy of quantitative determination was also evaluated by a spiking/recovery procedure, using a cranberry extract as a model matrix. Results obtained at the three spiking levels are shown in Table 3. In general, the recoveries ranged from 90 to 110%, thus indicating a suitable quantitative performance.
Table 2.
Analytical parameters of the proposed HPLC-FLD method.
Table 3.
Assessment of the accuracy of the proposed HPLC-FLD methods, based on spiking/recovery procedure at three spiking levels (20, 40, and 60 mg L−1). The results are expressed as the recovery in percentage ± the standard deviation (n = 3 independent replicates).
3.4. Determination of Flavanols in Nutraceutical Samples
Commercial nutraceutical samples that were selected for this study were composed of different plant extracts prepared from juices or solvent extracts, which were further dehydrated and crushed. These samples were analyzed according to the HPLC-FLD method to determine the flavanol composition. The peaks of the most abundant analytes were clearly resolved, and their concentrations were calculated using the corresponding standards. Flavanol profiling (see Table 4) was used for the statistical characterization of the samples.
Table 4.
Determination of flavanols in the nutraceutical samples using the HPLC-FLD method.
The composition of nutraceuticals differed in terms of concentration and the distribution of flavanols. In general, epicatechin was the most abundant compound in all the samples, while procyanidin A2 was highly specific to cranberry. Raspberry, grape, and mixtures of other antioxidant components were also rich in catechin and procyanidin B2. Finally, the artichoke samples displayed the lowest flavanol content. The information from this data set was difficult to interpret, so chemometric methods were used for a more comprehensive analysis of sample behavior (see Section 3.5).
3.5. Sample Characterization by PCA
PCA was applied to characterize and authenticate the nutraceutical samples according to their plant ingredients. Samples manufactured from berries, vegetables, and other medicinal plants, such as cranberry, artichoke, raspberry, or vine, were compared to identify their characteristic patterns depending on flavanol composition.
These samples were analyzed using the proposed HPLC-FLD method (see conditions in Section 2.5). The data pretreatment consisted of baseline correction and standardization by the sample mass, normalization, and autoscaling. In this way, chromatographic drifts and intensity variations were minimized so that the processed data displayed better descriptive ability for discrimination between the fruit varieties. For the chemometric treatment, both profiling (concentrations accounted for from the areas of studied flavanols) and fingerprinting (chromatograms from FLD within the selected working time windows) approaches could be considered for sample characterization.
This method is not specific to flavanols because other polyphenolic compounds can be detected under these conditions, including flavanones and phenolic acids (hydroxybenzoic and hydroxycinnamic acids). As a result, PCA models using flavanol concentrations showed better discrimination of fruit classes than those from FLD fingerprints. The latter included contributions corresponding to other phenolic species, which made discrimination more difficult. Therefore, despite the simplicity of the fingerprinting approach, in this case, the study of compositional profiles from selected flavanols was recommended for description and discrimination purposes.
Figure 4 depicts the PCA results using the flavanol data. The plot of scores (Figure 4a) showed three featured groups corresponding to cranberry, artichoke, and other samples (e.g., raspberry, grape, and vine). The plot of loadings (Figure 4b) revealed some potential markers of the different groups of samples. For instance, cranberry samples are richer in flavanols than the other fruit extracts, with epigallocatechin and procyanidins A2 and C1 being the main flavanols. The raspberry and grape samples had similar flavanol profiles, catechin and epicatechin being some of the main components. Finally, the artichoke samples were the poorest in terms of flavanol content.
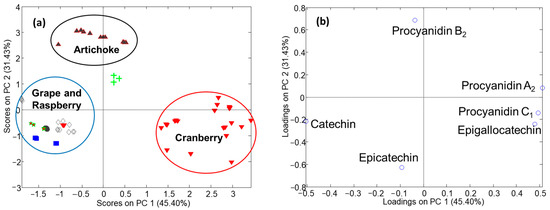
Figure 4.
PCA results using target flavanol data, determined by the HPLC-FLD method. (a) Plot of scores; (b) plot of loadings. Sample assignation: circle = QC; vertex-down triangle = cranberry; rhombus = grape and vine; vertex-up triangle = artichoke; square = raspberry; star and cross = antioxidant mixture.
Nowadays, it is known that grapevine and other red berries have sometimes been used to adulterate cranberry nutraceutical samples because of their high flavanol content. However, as can be seen in Figure 4a, PCA distinguishes between genuine products and other combinations prepared with vine and raspberry. In this regard, the scores plot shows a cranberry sample located far away from the others, in the area of grape and raspberry samples. Therefore, this could indicate an adulteration or the mislabeling of this cranberry sample.
4. Conclusions
The possibilities of flavanols as descriptors of plant-based extracts were herein demonstrated via a comparison of the behavior of nutraceuticals made with cranberry, artichoke, raspberry, grape, and other ingredients. This new approach relied on chemometrics for the characterization of these products, using flavanol profiling and fingerprinting data obtained by liquid chromatography as the source of information. The best extraction conditions, as deduced by experimental design, were obtained using methanol as the solvent. The increase in HCl percentage improved the overall flavanol extraction yields. Moreover, the extraction temperature and time also showed a positive effect, thus leading to better recoveries of the analytes when increasing these factors.
The HPLC-FLD method (with 276 and 320 nm as the excitation and emission wavelengths) was developed to try to generate data that were as rich as possible to tackle the further characterization of nutraceutical samples. This method was suitable for quantitative purposes, so it was an excellent choice for the routine analysis of large sets of samples, to deal with characterization and authentication issues. In this context, the proposed method is a simpler, cheaper, and more robust alternative to more sophisticated methods, such as those based on HPLC-MS.
Regarding the descriptive performance, in terms of the discrimination of nutraceuticals products from different plant origins, as a targeted approach, only data from the selected analytes were considered as the source of information. In any case, the sample exploration by PCA provided a differentiation among the raw material sources of the bioactive products. The flavanol profile of each fruit was the basis of this discrimination, the cranberry samples being the richest and the artichoke samples the poorest. Although the method was applied herein to selected nutraceuticals, it can be extended to a broader range of food supplements and functional foods.
Author Contributions
Conceptualization, O.N. and J.S.; methodology, O.V.-C. and K.A.-A.; investigation, O.V.-C. and K.A.-A.; writing—original draft preparation, O.V.-C. and J.S.; writing—review and editing, O.N. and J.S. All authors have read and agreed to the published version of the manuscript.
Funding
This research was funded by the “Agencia Estatal de Investigación” of the Science and Innovation Ministry of Spain, grant number PID2020-114401RB-C22.
Institutional Review Board Statement
Not applicable.
Informed Consent Statement
Not applicable.
Data Availability Statement
Not applicable.
Conflicts of Interest
The authors declare no conflict of interest.
References
- Côté, J.; Caillet, S.; Doyon, G.; Sylvain, J.F.; Lacroix, M. Bioactive Compounds in Cranberries and Their Biological Properties. Crit. Rev. Food Sci. Nutr. 2010, 50, 666–679. [Google Scholar] [CrossRef] [PubMed]
- Lucci, P.; Saurina, J.; Núñez, O. Trends in LC-MS and LC-HRMS Analysis and Characterization of Polyphenols in Food. TrAC Trends Anal. Chem. 2017, 88, 1–24. [Google Scholar] [CrossRef]
- Howell, A.B.; Reed, J.D.; Krueger, C.G.; Winterbottom, R.; Cunningham, D.G.; Leahy, M. A-Type Cranberry Proanthocyanidins and Uropathogenic Bacterial Anti-Adhesion Activity. Phytochemistry 2005, 66, 2281–2291. [Google Scholar] [CrossRef]
- Gu, L.; Kelm, M.A.; Hammerstone, J.F.; Beecher, G.; Holden, J.; Haytowitz, D.; Gebhardt, S.; Prior, R.L. Concentrations of Proanthocyanidins in Common Foods and Estimations of Normal Consumption. J. Nutr. 2004, 134, 613–617. [Google Scholar] [CrossRef]
- Vidal-Casanella, O.; Núñez, O.; Granados, M.; Saurina, J.; Sentellas, S. Analytical Methods for Exploring Nutraceuticals Based on Phenolic Acids and Polyphenols. Appl. Sci. 2021, 11, 8276. [Google Scholar] [CrossRef]
- Wallace, T.C.; Giusti, M.M. Evaluation of Parameters That Affect the 4-Dimethylaminocinnamaldehyde Assay for Flavanols and Proanthocyanidins. J. Food Sci. 2010, 75, C619–C625. [Google Scholar] [CrossRef]
- Granato, D.; Santos, J.S.; Maciel, L.G.; Nunes, D.S. Chemical Perspective and Criticism on Selected Analytical Methods Used to Estimate the Total Content of Phenolic Compounds in Food Matrices. TrAC Trends Anal. Chem. 2016, 80, 266–279. [Google Scholar] [CrossRef]
- Vidal-Casanella, O.; Nuñez, O.; Hernández-Cassou, S.; Saurina, J. Assessment of Experimental Factors Affecting the Sensitivity and Selectivity of the Spectrophotometric Estimation of Proanthocyanidins in Foods and Nutraceuticals. Food Anal. Methods 2021, 14, 485–495. [Google Scholar] [CrossRef]
- Vidal-Casanella, O.; Nuñez, O.; Saurina, J. Liquid Chromatographic Fingerprints for the Characterization of Flavanol-Rich Nutraceuticals Based on 4-Dimethylaminocinnamaldehyde Precolumn Derivatization. Sci. Pharm. 2021, 89, 18. [Google Scholar] [CrossRef]
- Puigventos, L.; Nunez, O.; Saurina, J. HPLC Fingerprints for the Authentication of Cranberry-Based Products Based on Multivariate Calibration Approaches. Curr. Anal. Chem. 2016, 13, 256–261. [Google Scholar] [CrossRef][Green Version]
- Pardo-Mates, N.; Vera, A.; Barbosa, S.; Hidalgo-Serrano, M.; Núñez, O.; Saurina, J.; Hernández-Cassou, S.; Puignou, L. Characterization, Classification and Authentication of Fruit-Based Extracts by Means of HPLC-UV Chromatographic Fingerprints, Polyphenolic Profiles and Chemometric Methods. Food Chem. 2017, 221, 29–38. [Google Scholar] [CrossRef] [PubMed]
- Bakhytkyzy, I.; Nuñez, O.; Saurina, J. Size Exclusion Coupled to Reversed Phase Liquid Chromatography for the Characterization of Cranberry Products. Food Anal. Methods 2019, 12, 604–611. [Google Scholar] [CrossRef]
- Bakhytkyzy, I.; Nuñez, O.; Saurina, J. Determination of Flavanols by Liquid Chromatography with Fluorescence Detection. Application to the Characterization of Cranberry-Based Pharmaceuticals through Profiling and Fingerprinting Approaches. J. Pharm. Biomed. Anal. 2018, 156, 206–213. [Google Scholar] [CrossRef] [PubMed]
- Hammerstone, J.F.; Lazarus, S.A.; Mitchell, A.E.; Rucker, R.; Schmitz, H.H. Identification of Procyanidins in Cocoa (Theobroma Cacao) and Chocolate Using High-Performance Liquid Chromatography/Mass Spectrometry. J. Agric. Food Chem. 1999, 47, 490–496. [Google Scholar] [CrossRef] [PubMed]
- Vidal-Casanella, O.; Arias-Alpizar, K.; Nuñez, O.; Saurina, J. Hydrophilic Interaction Liquid Chromatography to Characterize Nutraceuticals and Food Supplements Based on Flavanols and Related Compounds. Separations 2021, 8, 17. [Google Scholar] [CrossRef]
- Liu, H.; Zou, T.; Gao, J.M.; Gu, L. Depolymerization of Cranberry Procyanidins Using (+)-Catechin, (-)-Epicatechin, and (-)-Epigallocatechin Gallate as Chain Breakers. Food Chem. 2013, 141, 488–494. [Google Scholar] [CrossRef]
- Neto, C.C.; Krueger, C.G.; Lamoureaux, T.L.; Kondo, M.; Vaisberg, A.J.; Hurta, R.A.R.; Curtis, S.; Matchett, M.D.; Yeung, H.; Sweeney, M.I.; et al. MALDI-TOF MS Characterization of Proanthocyanidins from Cranberry Fruit (Vaccinium Macrocarpon) That Inhibit Tumor Cell Growth and Matrix Metalloproteinase Expression in Vitro. J. Sci. Food Agric. 2006, 86, 18–25. [Google Scholar] [CrossRef]
- Brown, P.N.; Turi, C.E.; Shipley, P.R.; Murch, S.J. Comparisons of Large (Vaccinium Macrocarpon Ait) and Small (Vaccinium oxycoccos L., Vaccinium vitis-idaea L.) Cranberry in British Columbia by Phytochemical Determination, Antioxidant Potential, and Metabolomic Profiling with Chemometric Analysis. Planta Med. 2012, 78, 630–640. [Google Scholar] [CrossRef]
- Iswaldi, I.; Gómez-Caravaca, A.M.; Arráez-Román, D.; Uberos, J.; Lardón, M.; Segura-Carretero, A.; Fernández-Gutiérrez, A. Characterization by High-Performance Liquid Chromatography with Diode-Array Detection Coupled to Time-of-Flight Mass Spectrometry of the Phenolic Fraction in a Cranberry Syrup Used to Prevent Urinary Tract Diseases, Together with a Study of Its Antibacter. J. Pharm. Biomed. Anal. 2012, 58, 34–41. [Google Scholar] [CrossRef]
- Yang, Z.; Zhai, W. Optimization of Microwave-Assisted Extraction of Anthocyanins from Purple Corn (Zea mays L.) Cob and Identification with HPLC-MS. Innov. Food Sci. Emerg. Technol. 2010, 11, 470–476. [Google Scholar] [CrossRef]
- Borges, G.D.S.C.; Vieira, F.G.K.; Copetti, C.; Gonzaga, L.V.; Fett, R. Optimization of the Extraction of Flavanols and Anthocyanins from the Fruit Pulp of Euterpe Edulis Using the Response Surface Methodology. Food Res. Int. 2011, 44, 708–715. [Google Scholar] [CrossRef]
- Alberti, A.; Zielinski, A.A.F.; Zardo, D.M.; Demiate, I.M.; Nogueira, A.; Mafra, L.I. Optimisation of the Extraction of Phenolic Compounds from Apples Using Response Surface Methodology. Food Chem. 2014, 149, 151–158. [Google Scholar] [CrossRef] [PubMed]
- He, B.; Zhang, L.L.; Yue, X.Y.; Liang, J.; Jiang, J.; Gao, X.L.; Yue, P.X. Optimization of Ultrasound-Assisted Extraction of Phenolic Compounds and Anthocyanins from Blueberry (Vaccinium Ashei) Wine Pomace. Food Chem. 2016, 204, 70–76. [Google Scholar] [CrossRef] [PubMed]
- Vvedenskaya, I.O.; Rosen, R.T.; Guido, J.E.; Russell, D.J.; Mills, K.A.; Vorsa, N. Characterization of Flavonols in Cranberry (Vaccinium Macrocarpon) Powder. J. Agric. Food Chem. 2004, 52, 188–195. [Google Scholar] [CrossRef]
- Hellström, J.K.; Mattila, P.H. HPLC Determination of Extractable and Unextractable Proanthocyanidins in Plant Materials. J. Agric. Food Chem. 2008, 56, 7617–7624. [Google Scholar] [CrossRef]
- White, B.L.; Howard, L.R.; Prior, R.L. Proximate and Polyphenolic Characterization of Cranberry Pomace. J. Agric. Food Chem. 2010, 58, 4030–4036. [Google Scholar] [CrossRef]
- Feliciano, R.P.; Shea, M.P.; Shanmuganayagam, D.; Krueger, C.G.; Howell, A.B.; Reed, J.D. Comparison of Isolated Cranberry (Vaccinium Macrocarpon Ait.) Proanthocyanidins to Catechin and Procyanidins A2 and B2 for Use as Standards in the 4-(Dimethylamino)Cinnamaldehyde Assay. J. Agric. Food Chem. 2012, 60, 4578–4585. [Google Scholar] [CrossRef]
Publisher’s Note: MDPI stays neutral with regard to jurisdictional claims in published maps and institutional affiliations. |
© 2022 by the authors. Licensee MDPI, Basel, Switzerland. This article is an open access article distributed under the terms and conditions of the Creative Commons Attribution (CC BY) license (https://creativecommons.org/licenses/by/4.0/).