1. Introduction
Hydrocyclone is a piece of simple-structure and efficient solid–liquid classification equipment with a history of more than 100 years [
1]. With its excellent classification performance, hydrocyclone is widely used in mineral processing, the chemical industry, petroleum, etc. [
2,
3,
4,
5]. However, the mismatch phenomenon of coarse particles entrained in the overflow product and fine particles entrained in the bottom flow product has always existed in the hydrocyclone classification process [
6,
7].
To effectively improve the classification performance of hydrocyclone, researchers have conducted in-depth research on the structure of the vortex-finder to improve the classification efficiency of the hydrocyclone by changing the structure of the vortex-finder. Qiang et al. [
8] considered that the diameter of the vortex-finder could significantly affect hydrocyclone classification performance, and the appropriate reduction of the vortex-finder diameter could reduce the cut size. Ghodrat et al. [
9,
10] considered that the diameter was the most influential element for classification efficiency among the vortex-finder parameters, and a too large or too small vortex-finder diameter could lead to the loss of hydrocyclone classification capacity. Cui et al. [
11] consider that an extension of the diameter of the vortex-finder may lead to an outward shift of the zero-axis velocity envelope, resulting in a coarse overflow. Therefore, the vortex-finder diameter is an extremely valuable indicator affecting the hydrocyclone classification behavior.
The insertion depth of the vortex-finder is an important factor affecting the hydrocyclone classification efficiency and classification accuracy [
12,
13,
14]. Liu et al. [
15] concluded that the most efficient classification was achieved when the insertion depth of the vortex-finder was at the column–cone junction of the hydrocyclone. Hwang et al. [
10,
16] believed that with the increase in the insertion depth of the overflow pipe, the separation efficiency showed a trend of increasing first and then decreasing. Tian et al. [
17] found through numerical simulation that the optimal length of overflow pipe should be 1.682.02 times of column length. Therefore, the vortex-finder length is crucial to the hydrocyclone classification efficiency. However, no unified qualitative conclusion has been obtained from many in-depth studies on the vortex-finder length.
In addition to numerical simulation methods, multi-factor experimental design has become an important means to study the influence of structural parameters on the hydrocyclone separation effect. The comprehensive influence of multiple structural factors on hydrocyclone classification efficiency was investigated using the response surface method and orthogonal experiments to seek the optimal structural size of hydrocyclone [
18,
19,
20]. Tang et al. [
10] studied the influence rules of the overflow tube diameter, insertion depth, and wall thickness on the classification efficiency of the cyclone by response surface method, and found that the overflow tube diameter was the most important factor affecting the classification efficiency. Liu et al. [
15] found the comprehensive influence relationship of inlet flow rate, vortex-finder insertion depth, and vortex-finder wall thickness on hydrocyclone classification efficiency using orthogonal experiments.
To obtain two kinds of products from the internal and external overflows in one classification, Obeng et al. [
21,
22] designed a double vortex-finder hydrocyclone, a coaxial insertion of a smaller internal vortex-finder inside the conventional single vortex-finder, which received wide attention. However, the influence of structural parameters of dual overflow pipe on flow field and separation efficiency is not clear. The influence of the internal vortex-finder diameter and length on the hydrocyclone flow field was analyzed by numerical simulation to explore the influence of the structural parameters of the double vortex-finder hydrocyclone on the classification. The response surface model of the internal vortex-finder diameter, length, and classification accuracy was established by the central composite response surface method to improve the classification performance of the double vortex-finder hydrocyclone. This paper can advance the development of the classification industry.
2. Model and Validation
2.1. Hydrocyclone Structure and Grid Division
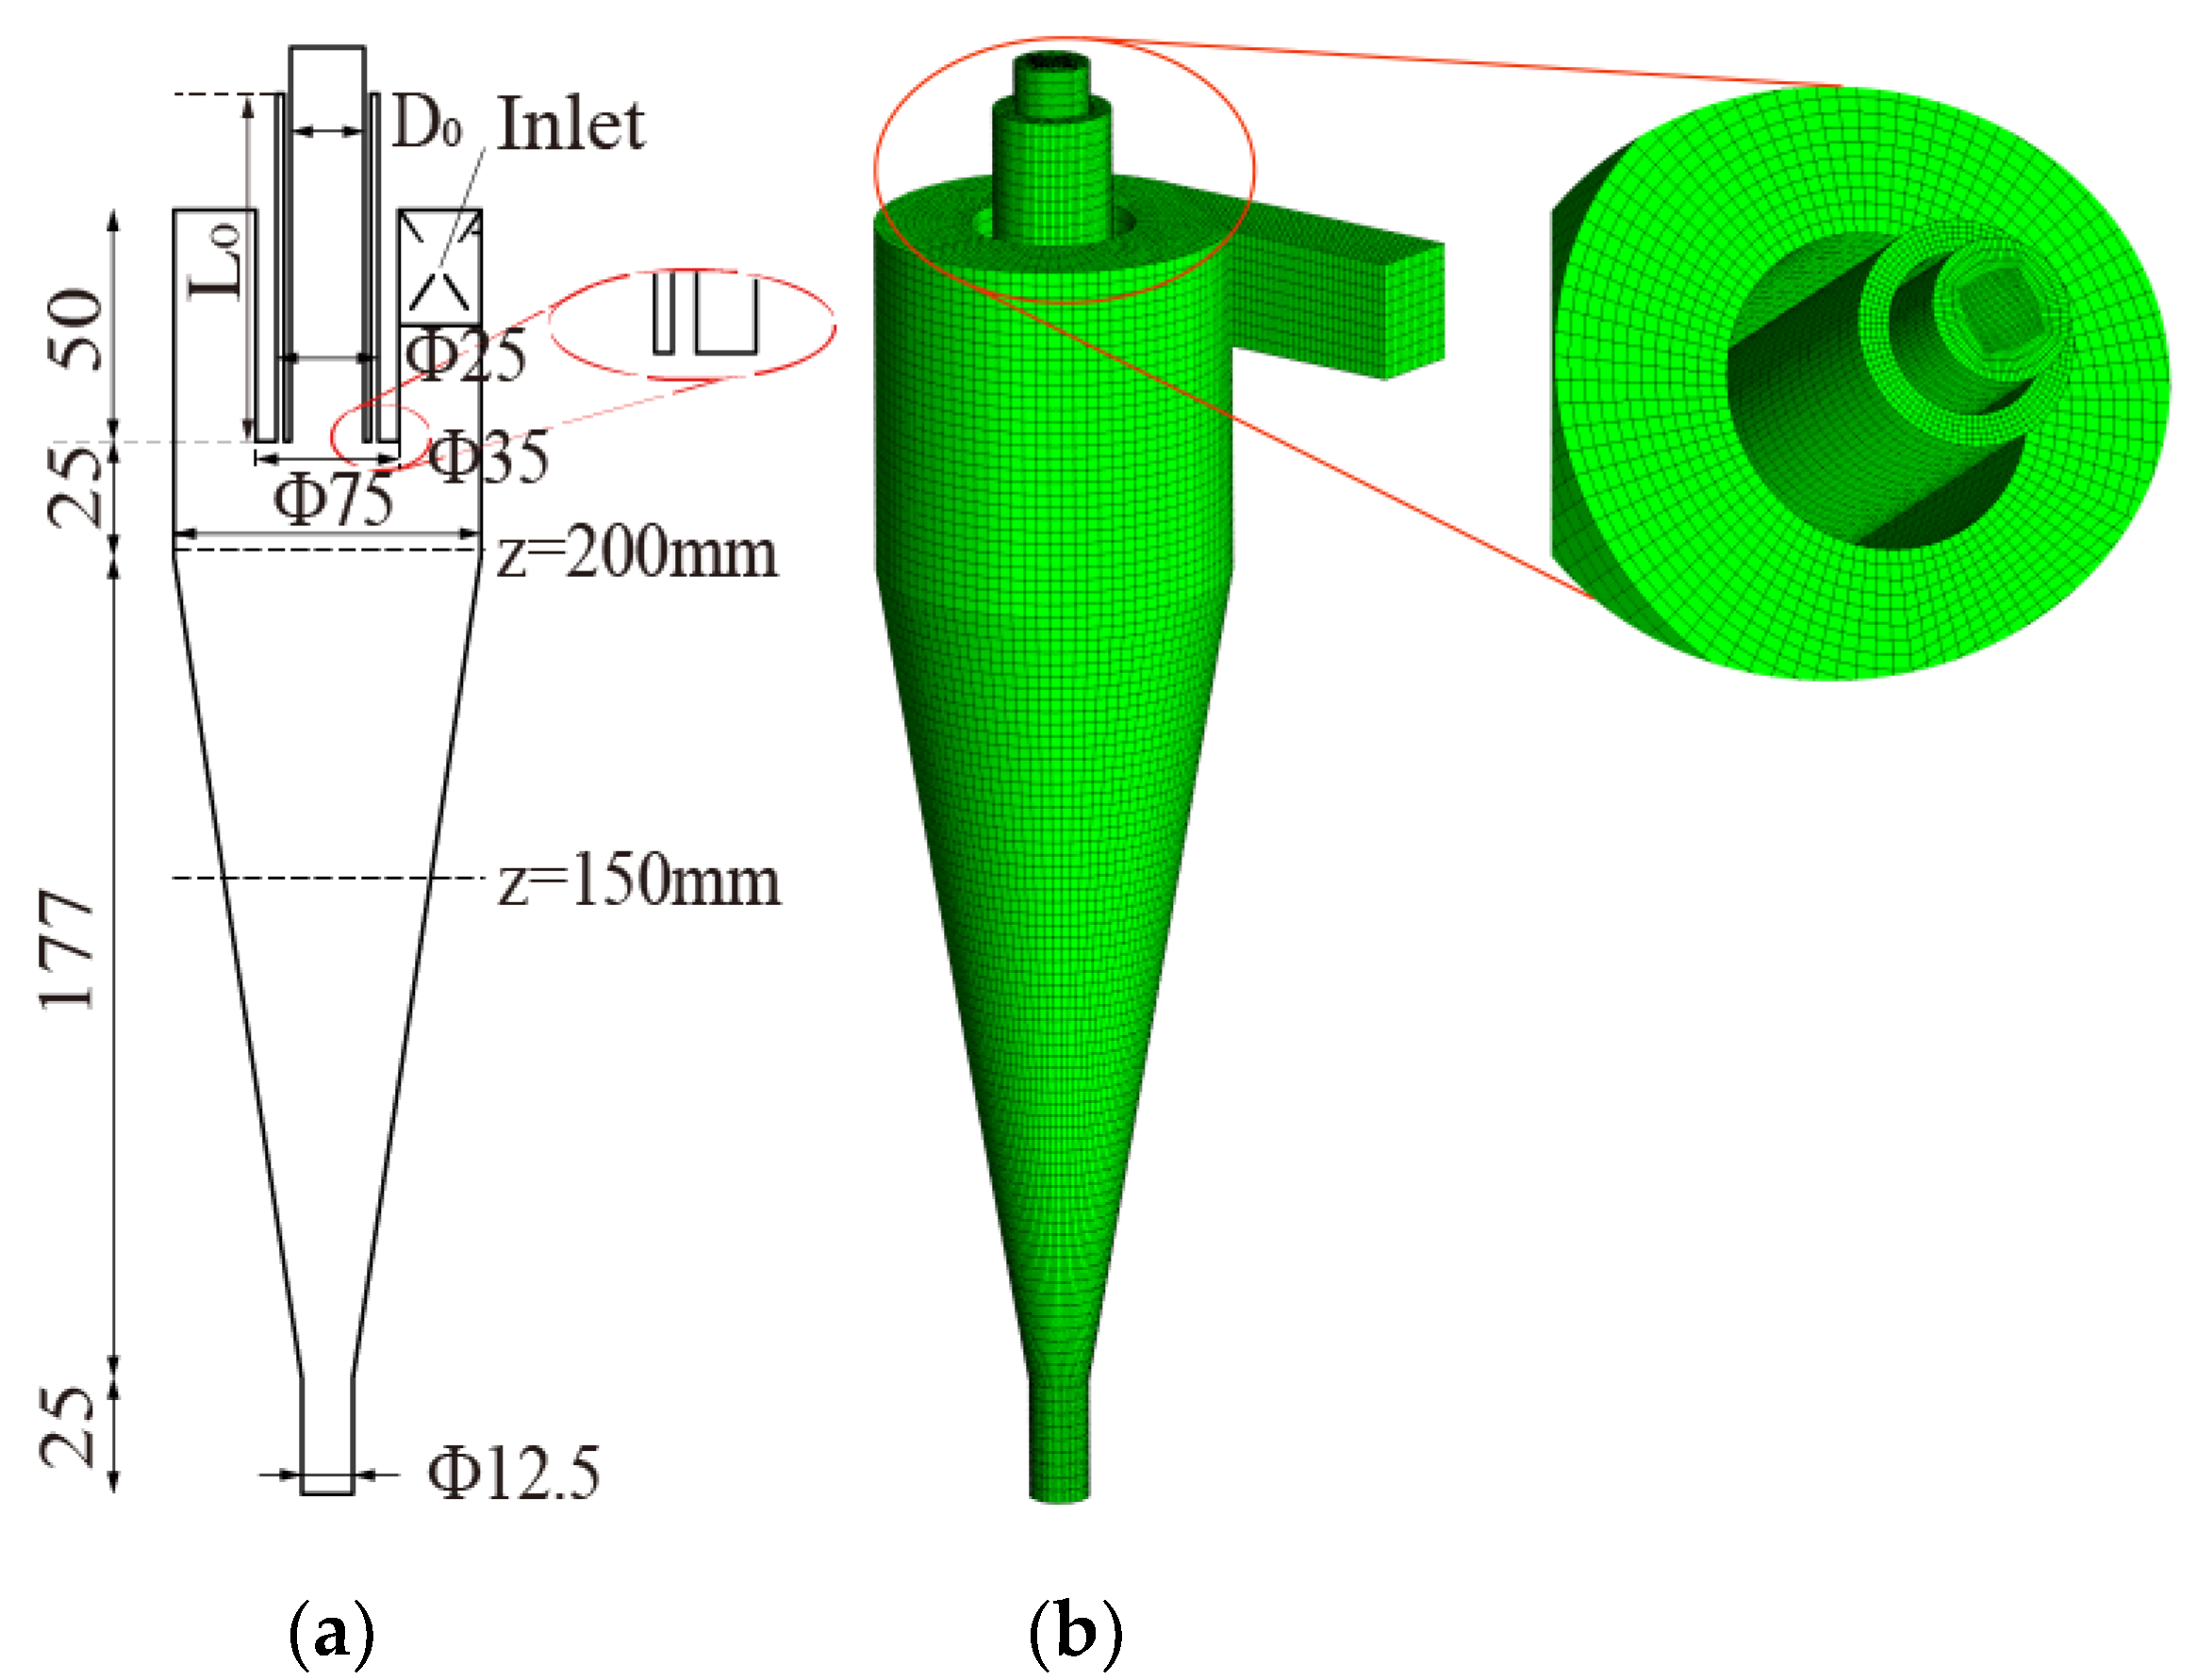
The double vortex-finder hydrocyclone in this paper is evolved from the Φ75 conventional hydrocyclone by adding an internal overflow pipe. The structure diagram is shown in
Figure 1a. D
0 is the internal overflow pipe diameter, and L
0 is the insertion depth of the internal overflow pipe. To facilitate the study of the influence law of overflow, the overflow pipe structure parameters on the hydrocyclone flow field, and classification efficiency, the ratio of vortex-finder diameter, insertion depth, and the corresponding parameters of cone section in the hydrocyclone are often studied as dimensionless factors [
23,
24,
25]. Therefore, the ratio of the internal overflow pipe diameter D
0 to the external D and the ratio of the internal overflow pipe insertion depth L
0 to the external L were regarded as the influencing factors on flow distribution and investigated in study. When D
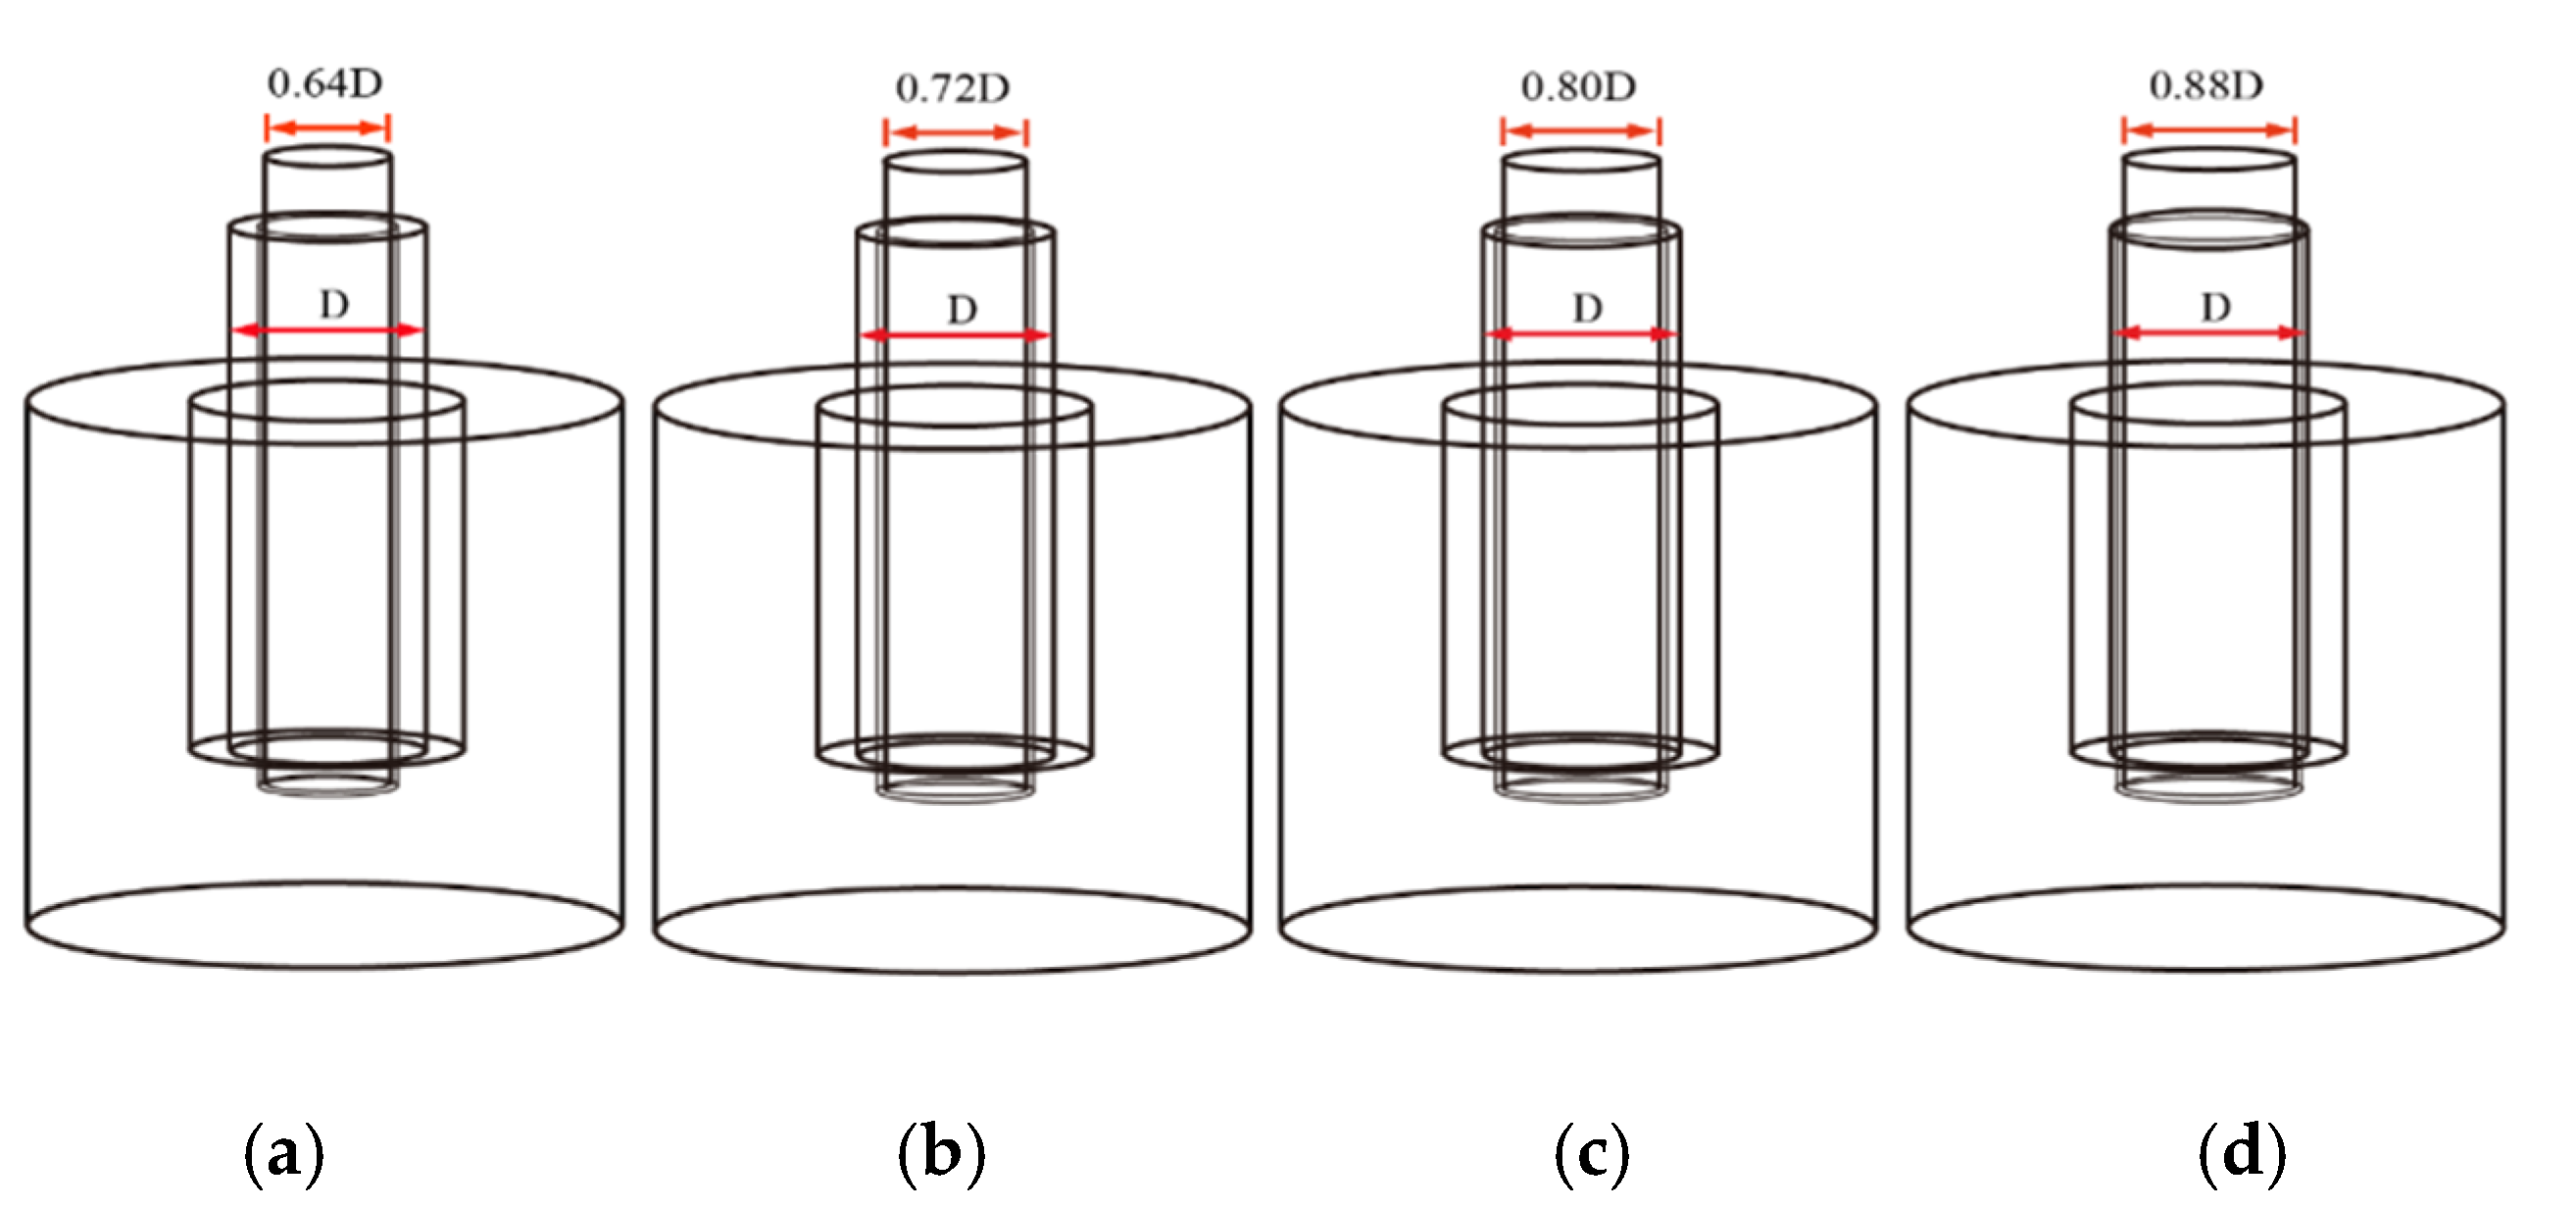
0 = (0.64–0.88)D, the internal vortex-finder is 80 mm, as shown in
Figure 2. When L
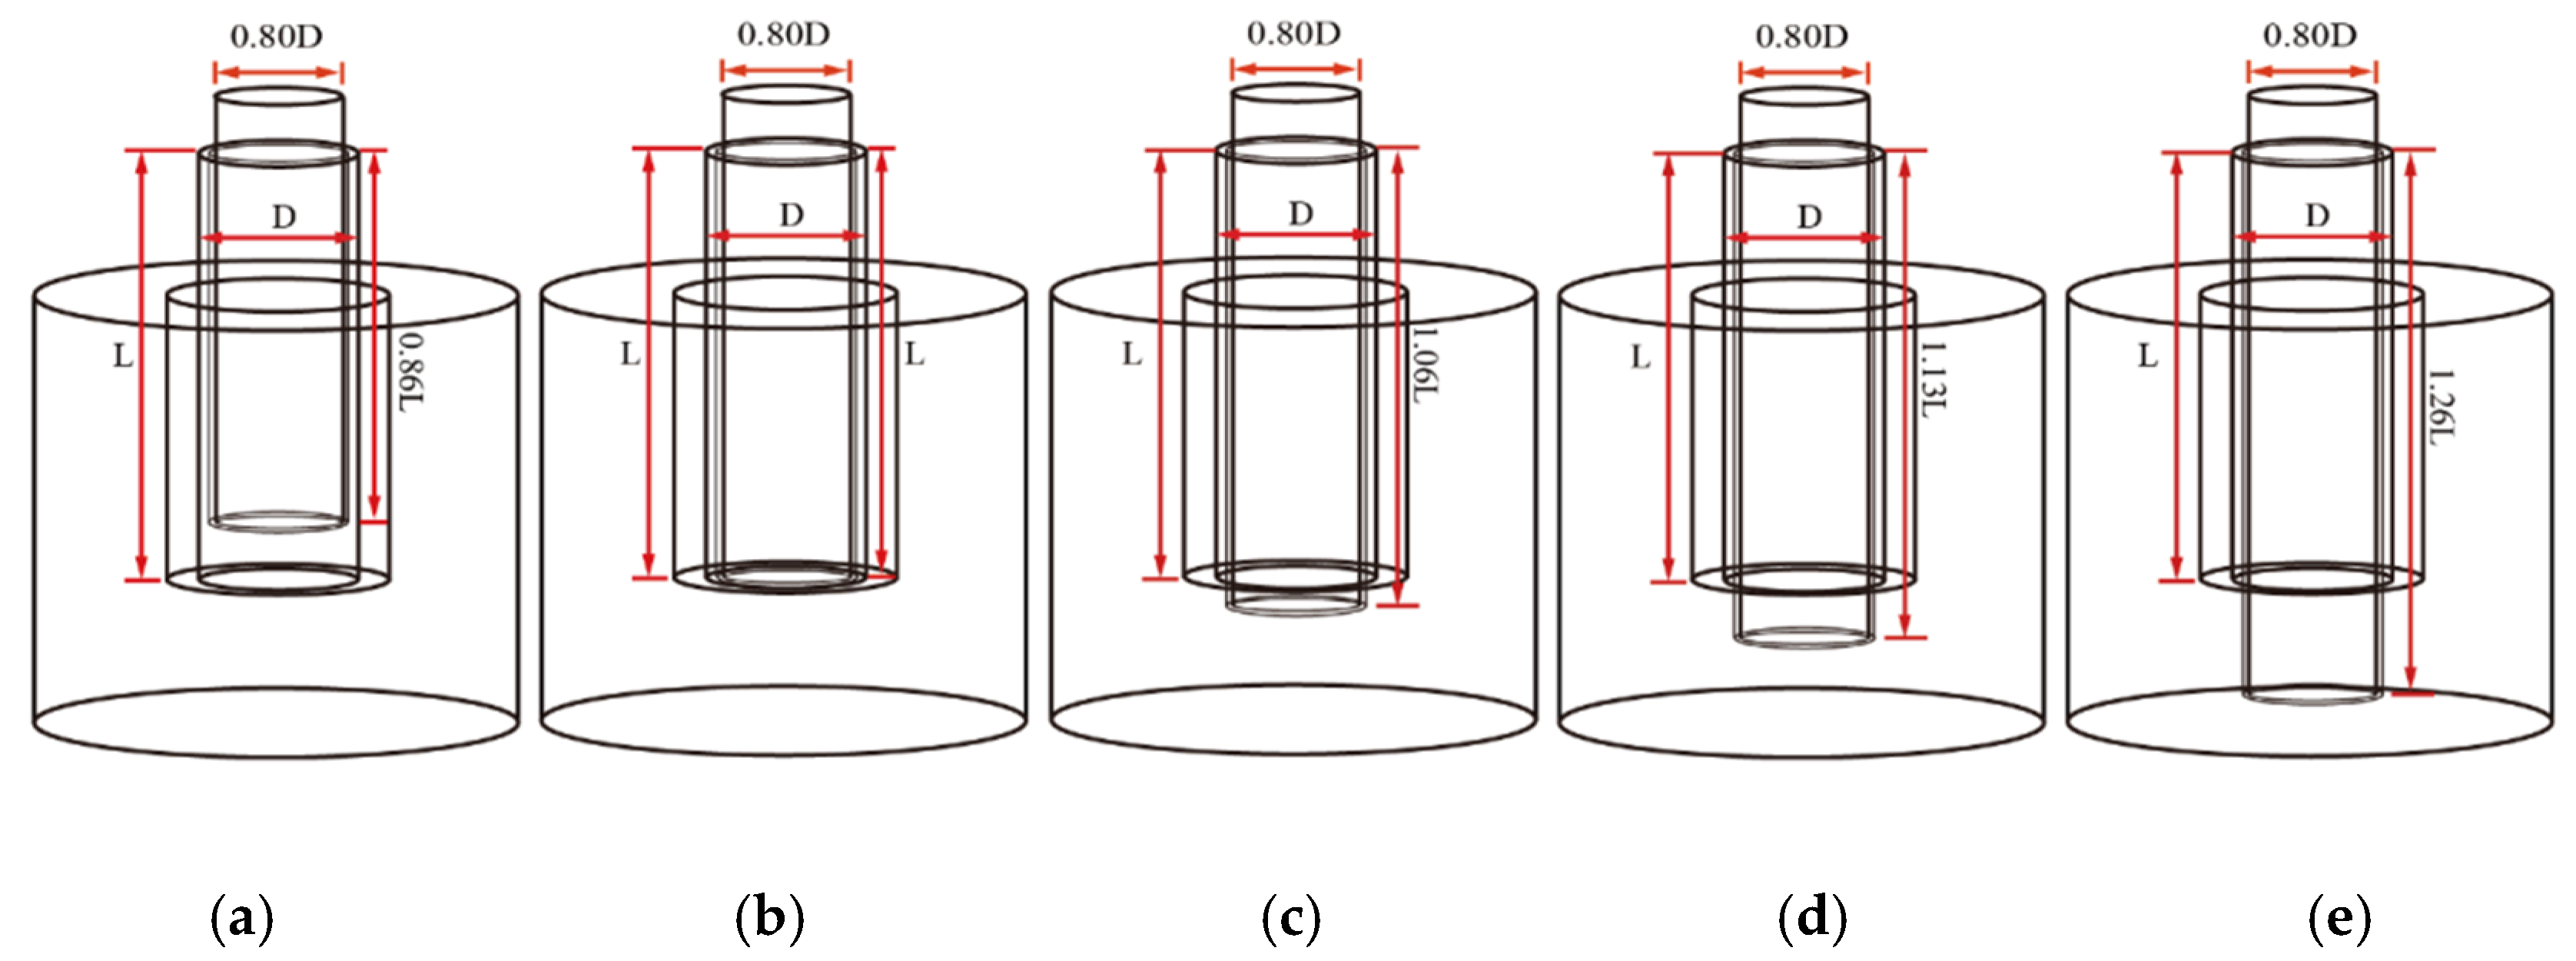
0 = (0.86–1.26)L, the internal vortex-finder diameter is 20 mm, as shown in
Figure 3.
The double vortex-finder hydrocyclone fluid domain is meshed using ICEM18.0 software, as shown in
Figure 1b. To verify the irrelevance of the grid, the tangential velocity with different grid numbers of 150,000, 250,000, 300,000, and 400,000 are measured, as shown in
Figure 4. The results show that the tangential velocity is the same when the mesh number is greater than 300,000, revealing the irrelevance of the grid. The grid number of the hydrocyclone fluid domain is determined to be 300,000 in consideration of the computational cost and simulation accuracy.
2.2. Mathematical Model
The accuracy of the VOF model for predicting the clear water field in the hydrocyclone has been verified, and the model achieves the capture of the air core section by solving the momentum equation (Equation (1)) to predict the flow field characteristics [
26,
27].
where
αq is the volume fraction of the q phase,
vj is the velocity in the
j direction of the
q phase, and
t and
xj represent the time and length of the position, respectively.
The Mixture model can efficiently accomplish low concentration discrete phase classification prediction by calculating the mixed term momentum equation (Equation (2)) and the continuity equation (Equation (3)) [
28,
29].
where
ρm is the density of the phases being mixed,
vm is the average mixed-phase velocity,
p is the pressure,
g is the gravitational force,
F is the bulk force, and
αkρk is the k phase viscosity, and
vdr,k is the k phase drift velocity.
The RSM model meets the prediction of the complex flow field in the hydrocyclone, considering the various anisotropy assumptions in the turbulent flow field [
30,
31,
32], and is solved by the transport equation (Equation (4)).
where
ρμi’μj’ is the mean Reynolds stress,
Dτ,ij is the turbulent diffusion,
DL,ij is the molecular diffusion,
pij is the pressure,
Gij is the generation,
φij is the pressure strain term,
εij is the dissipation,
ρ is the fluid density, and
μk is the fluid viscosity.
2.3. Model Parameters
The RSM model was adopted for the turbulence model, the VOF model and the Mixture model were adopted for the multiphase flow model. The entrance was set to Velocity-inlet, and the exit was set to Pressure-out. SIMPLE was adopted for pressure-velocity coupling, PRESTO was adopted for pressure discretization, and QUICK format was adopted for other discretization methods. The inlet velocity was 2.28 m/s, the reflux coefficient was 1, and the initial pressure of the flow field was 1 standard atmosphere. CaCO
3 particles with a volume fraction of 5.4% are adopted for the dispersion phase, and the particle properties are seen in
Table 1. The flow imbalance error of each phase in unit time is less than 5 × 10
−3 s as the basis for the convergence of the calculation.
2.4. Model Validation
To verify the accuracy and reliability of the model, the VOF coupled with the RSM model was applied to predict the flow field inside the hydrocyclone. The predicted tangential velocity of the flow field is compared with data measured by Hsieh [
33], as can be seen in
Figure 5a. The results show the tangential velocity is basically the same, verifying the accuracy of the VOF model. The results of the classification experiments of CaCO
3 particles are compared with the prediction of the Mixture model, as shown in
Figure 5b. The results show a high consistency, indicating that the Mixture multiphase flow model meets the calculation requirements.
2.5. Central Composite Response Surface Design
The optimal parameters of the study factors and significant factors were found in response surface analysis by fitting with multiple quadratic regression equations [
34]. The central composite response design was one of the most commonly used response surface design methods [
35], widely used in various multi-factor experiments. The comprehensive effect of the interaction of multiple structural factors on hydrocyclone classification efficiency was investigated using the response surface design method. The internal overflow pipe diameter D
0 and insertion depth L
0 were response factors. The optimized value of steepness index K was chosen as the significant factor to effectively predict the effectively of the internal overflow pipe structure parameters on the classification efficiency of microfine particles with 20 μm in particle size and below, which is calculated as equation (Equation (5)). The design factor levels of the response surface are shown in
Table 2.
where
d20,
d30 are the classification rate of the corresponding particle size.
3. Results and Discussion
3.1. Impact of the Internal Vortex-Finder Diameter on the Flow Field
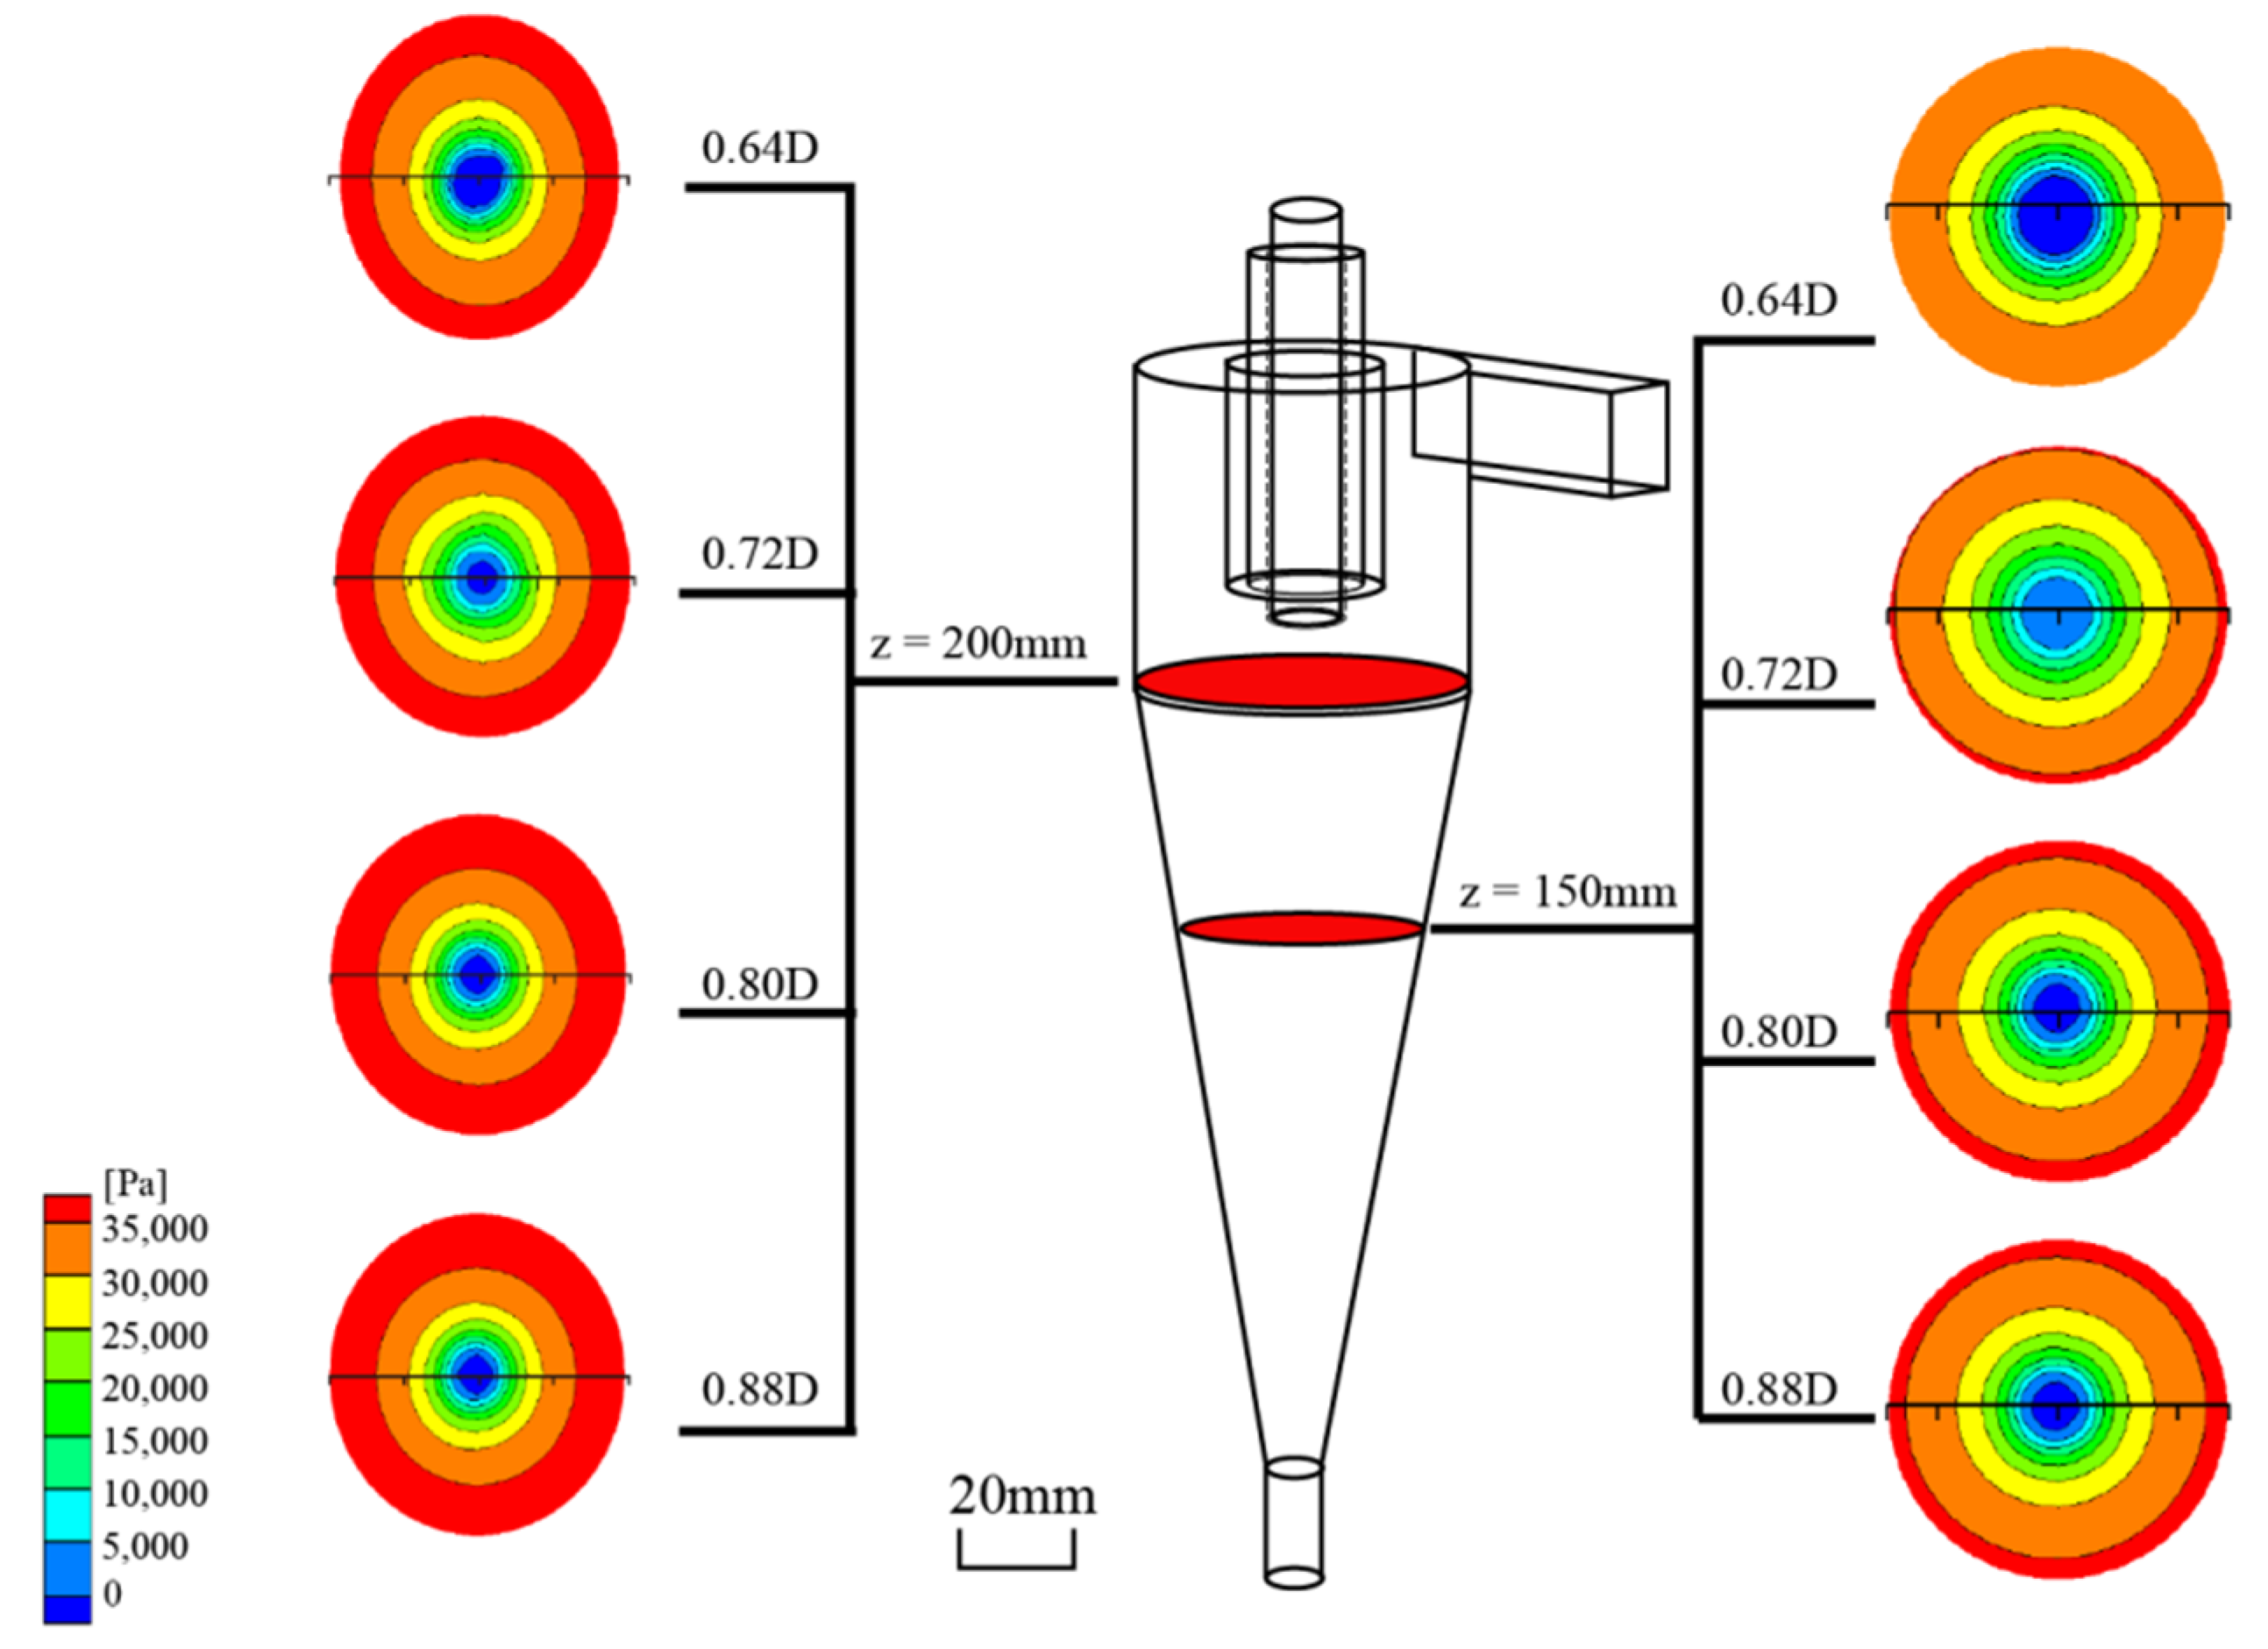
3.1.1. Radial Pressure
Figure 6 shows the diagram of the radial pressure at column and cone sections of the hydrocyclone with different diameters of internal vortex-finder. The variations in diameter have no significant impact on the radial pressure distribution in the flow field at the column section location (z = 200 mm). However, the radial pressure increases with the diameter at the cone section position near the wall area (z = 150 mm). Therefore, the increase in diameter can improve the radial force of the fluid near the wall of the cone section and strengthen the radial motion of the fluid, which is conducive to the particle classification.
3.1.2. Tangential Velocity
Tangential velocity affects the hydrocyclone classification performance.
Figure 7 shows distribution curves of the tangential velocity of the double vortex-finder hydrocyclone at different heights. At z = 150 mm and z = 200 mm, within the diameter of 040 mm, the peak tangential velocity is maximum when the diameter is 0.64D, and the peak tangential velocity is minimum when the diameter is 0.88D. Within the diameter of 4075 mm, no evident difference in the tangential velocities shows that the tangential velocities are affected by the internal vortex-finder diameter. There are mainly microfine particles within the diameter of 040 mm and coarse particles within the diameter of 4075 mm. The internal vortex-finder diameter has no significantly effect on coarse particles, but internal vortex-finders with smaller diameters are beneficial to the classification of microfine particles. Accordingly, the internal vortex-finder diameter can be designed according to particle size distribution characteristics of raw materials and the expected classification.
3.1.3. Air Core
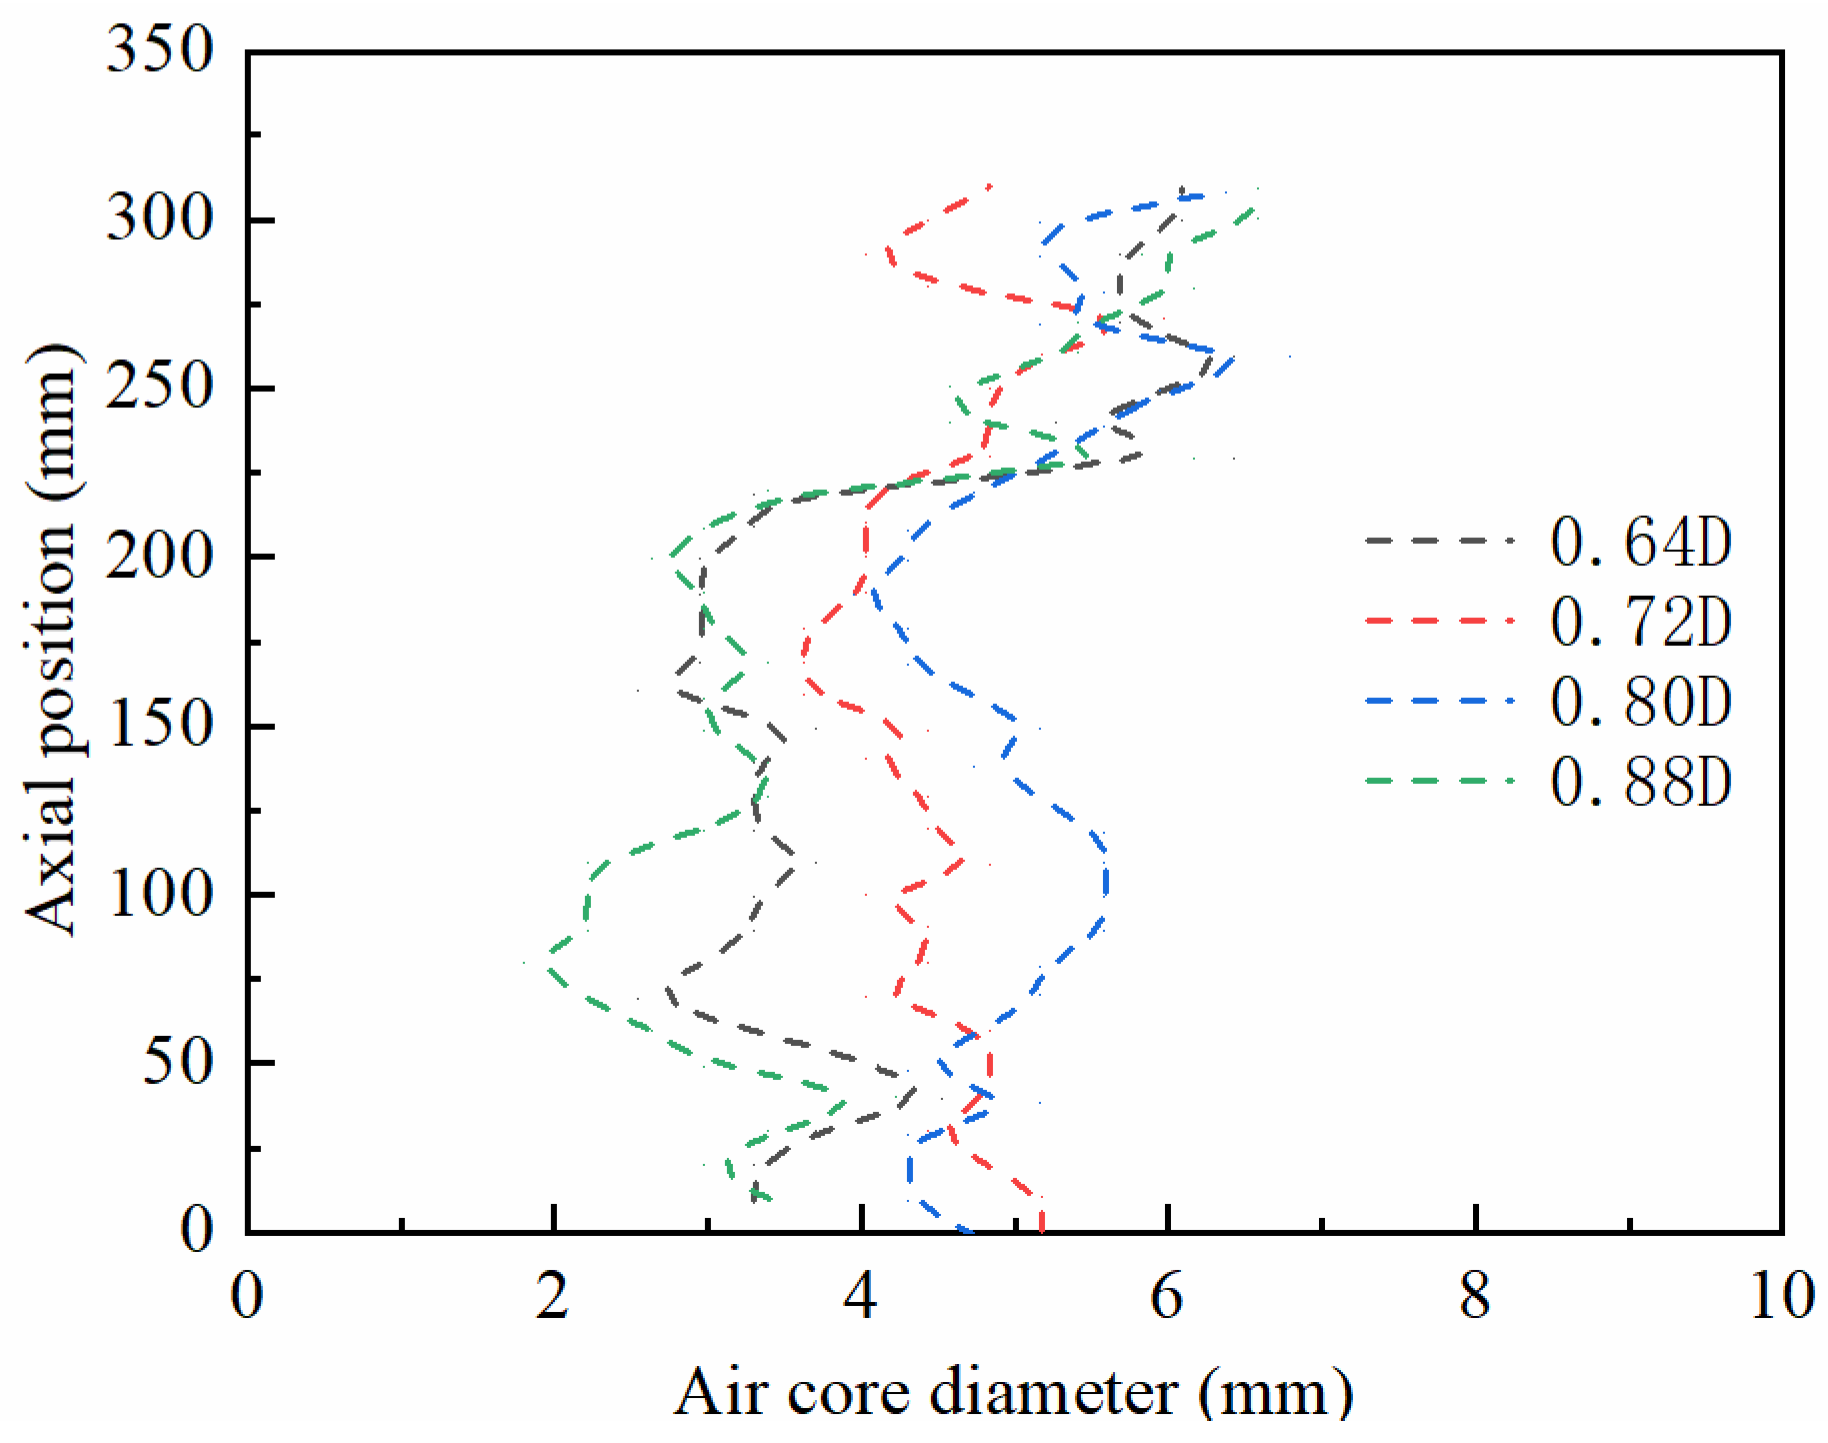
The shape of the air core affects the stability of the flow field. The air core morphology is displayed in
Figure 8. The air core diameters all fluctuate between 2 and 6 mm. The diameters of air core increase significantly at the axial position of about 225 mm, forming a protrusion because the air from the overflow and underflow ports meets here and is restricted by the vortex-finder wall. The air core diameter is most stable when diameter D
0 of the internal vortex-finder is 0.72D, indicating that too large or too small internal vortex-finder diameter will cause the air core to shake violently and is not beneficial to the stabilization of the flow field, thus the internal vortex-finder diameter should be considered in the design of hydrocyclone.
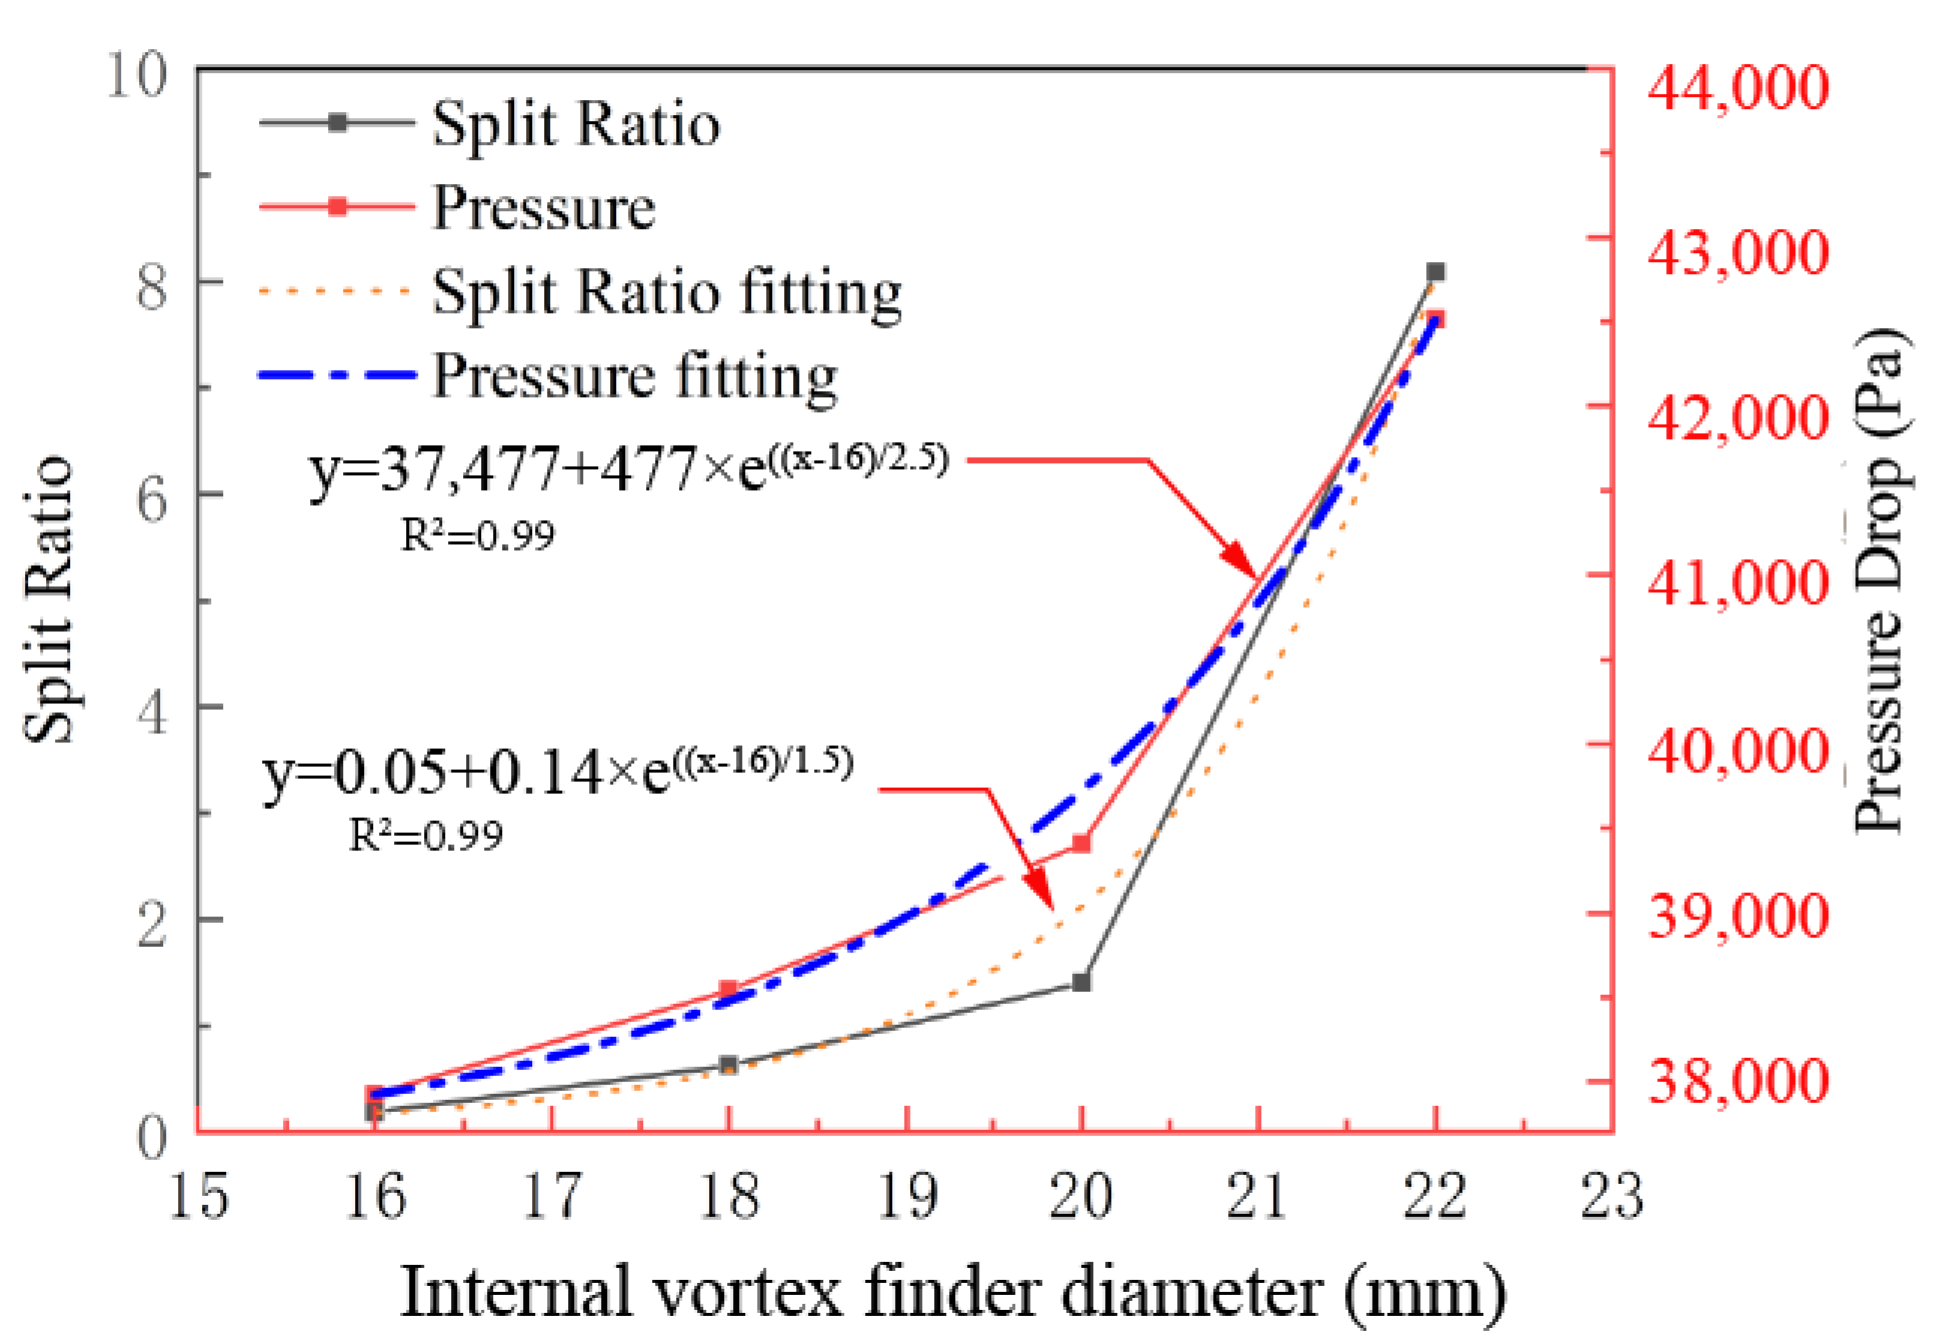
3.1.4. Pressure Drop and the Split Ratio of Internal and External Overflow
Figure 9 illustrates the impact of internal overflow pipe diameter pressure drop and the split ratio of internal and external overflow. The pressure drop of the flow field increases with the internal overflow pipe diameter. Since a large pressure drop means a large energy consumption, the energy consumption in the flow field increases with the internal overflow pipe diameter. Moreover, the increase in the internal overflow pipe diameter increases the split ratio of internal and external overflow. The split ratio of internal and external overflow is only 0.185 when the internal overflow pipe diameter is 16 mm (0.64 D) and up to 1.40 when the internal overflow pipe diameter is 20 mm (0.80 D). When the overflow pipe diameter is small, most of its space is occupied by the air core, causing the split ratio of internal and external overflow to increase rapidly as the internal overflow pipe diameter increases. Therefore, when the internal overflow pipe diameter is less than a certain value, its internal area will be occupied by air, and no product will be separated. In addition, an appropriate increase in the internal overflow pipe diameter will facilitate the overflow of microfine particles from the internal overflow pipe, improving the yield of microfine particles. To better reflect the response of the internal vortex-finder diameter change on the split ratio and pressure drop, the data in the figure was fitted to provide a reference for predicting the distribution of pressure drop and the split ratio of internal and external overflow in internal overflow pipes with different diameters.
3.1.5. Pulp Movement Trajectory
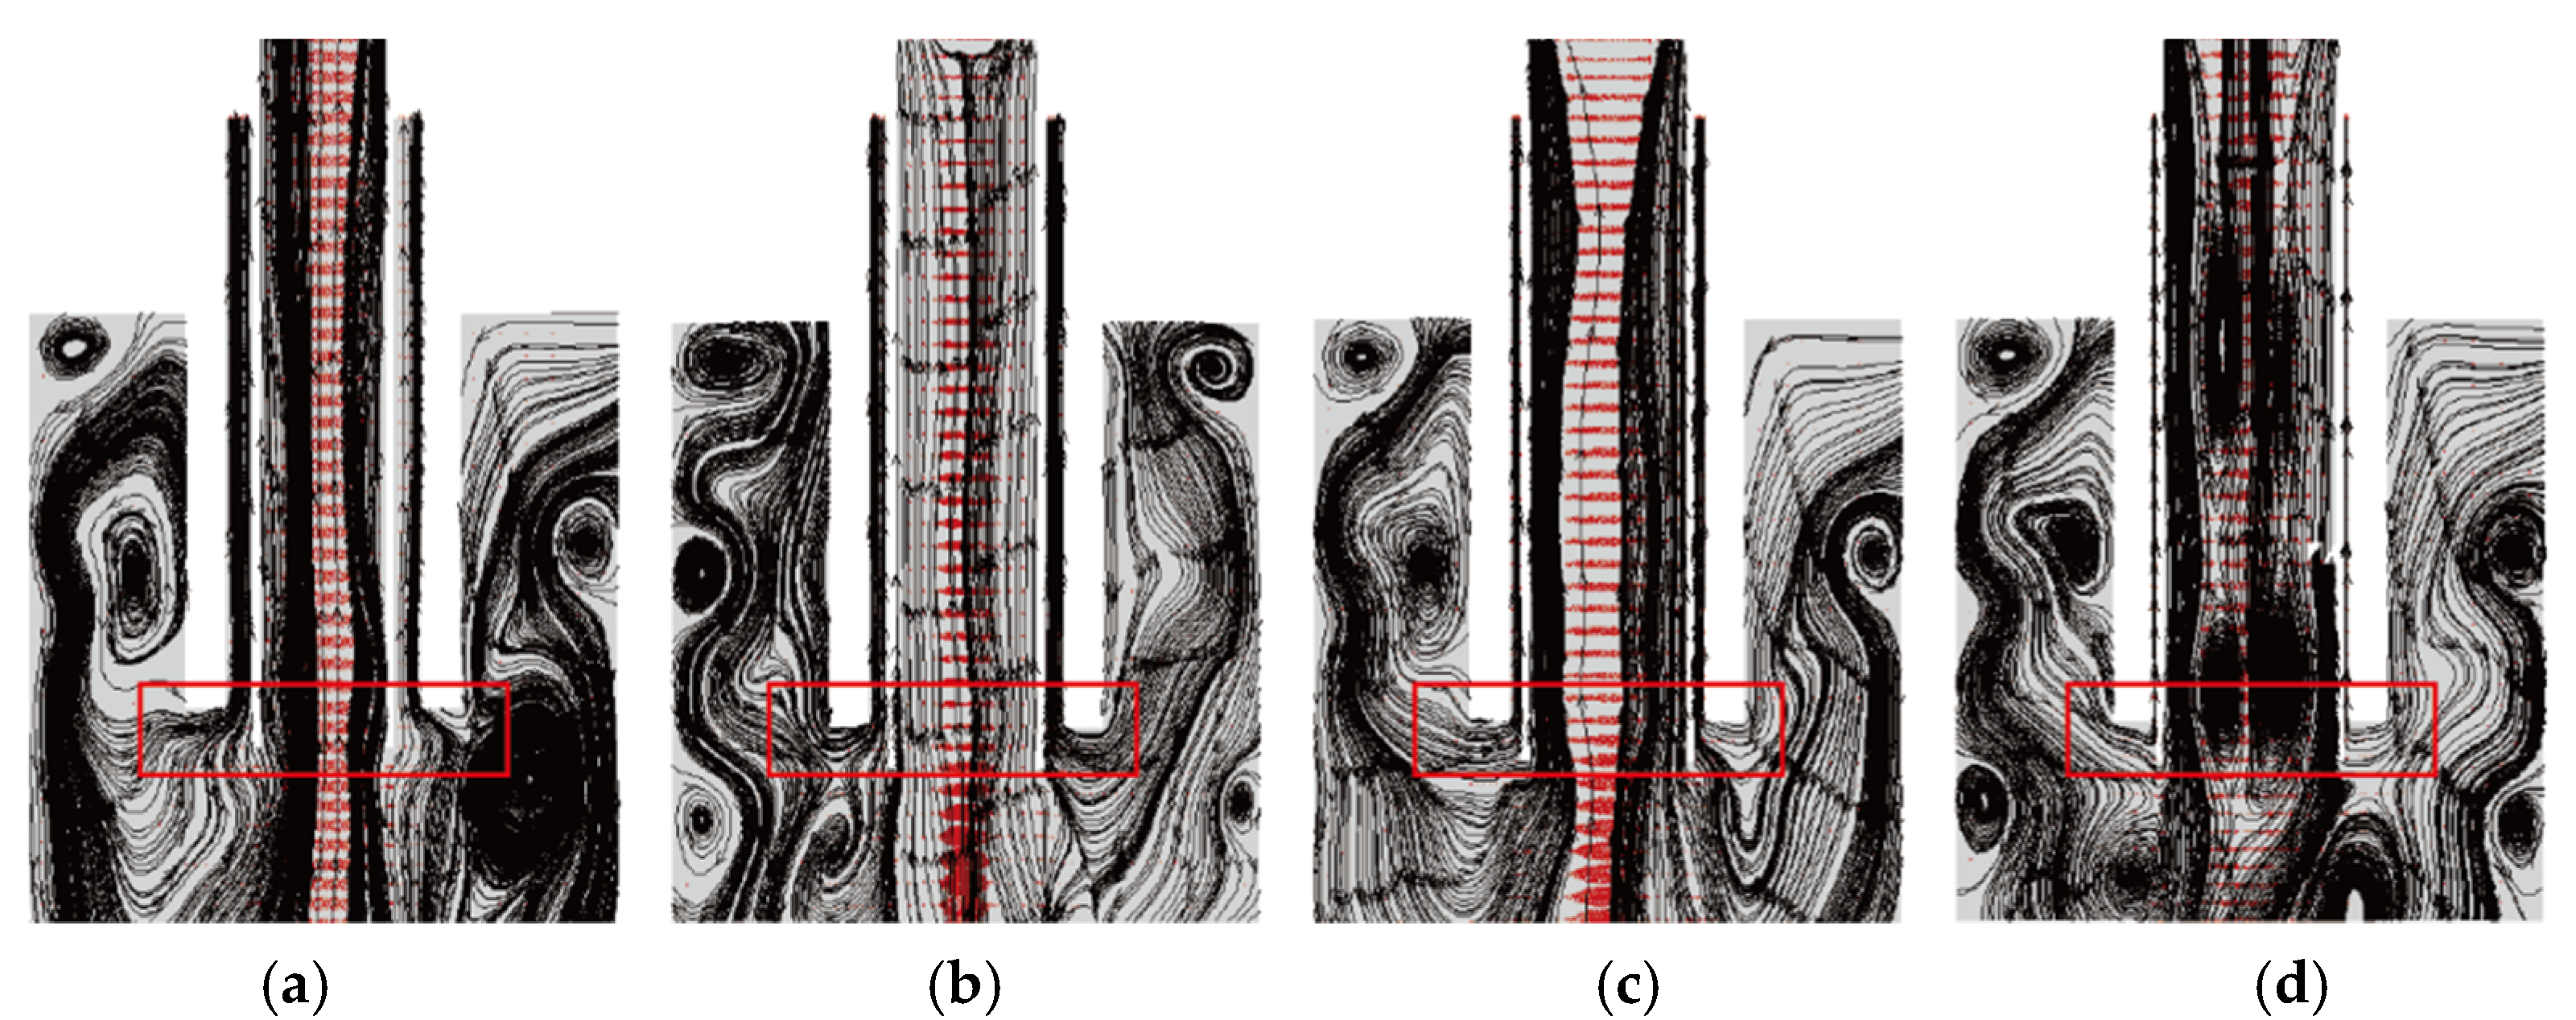
Figure 10 shows the pulp movement trajectory of hydrocyclone column section. Due to the internal vortex-finder, most of the short-circuit flow at the hydrocyclone wall (red box in
Figure 10) flows into the external overflow area, reducing the total amount of short-circuit flow inside the internal vortex-finder. The classification accuracy is reduced due to the short-circuit flow is directly discharged without effective centrifugal classification. Therefore, the internal overflow pipe with a smaller diameter contributes to the fine classification of internal overflow. However, more pulp in the internal overflow pipe with smaller diameter overflows to the outside, reducing the accuracy of the external overflow.
3.2. Impact of the Insertion Depth of the Internal Vortex-Finder on the Flow Field
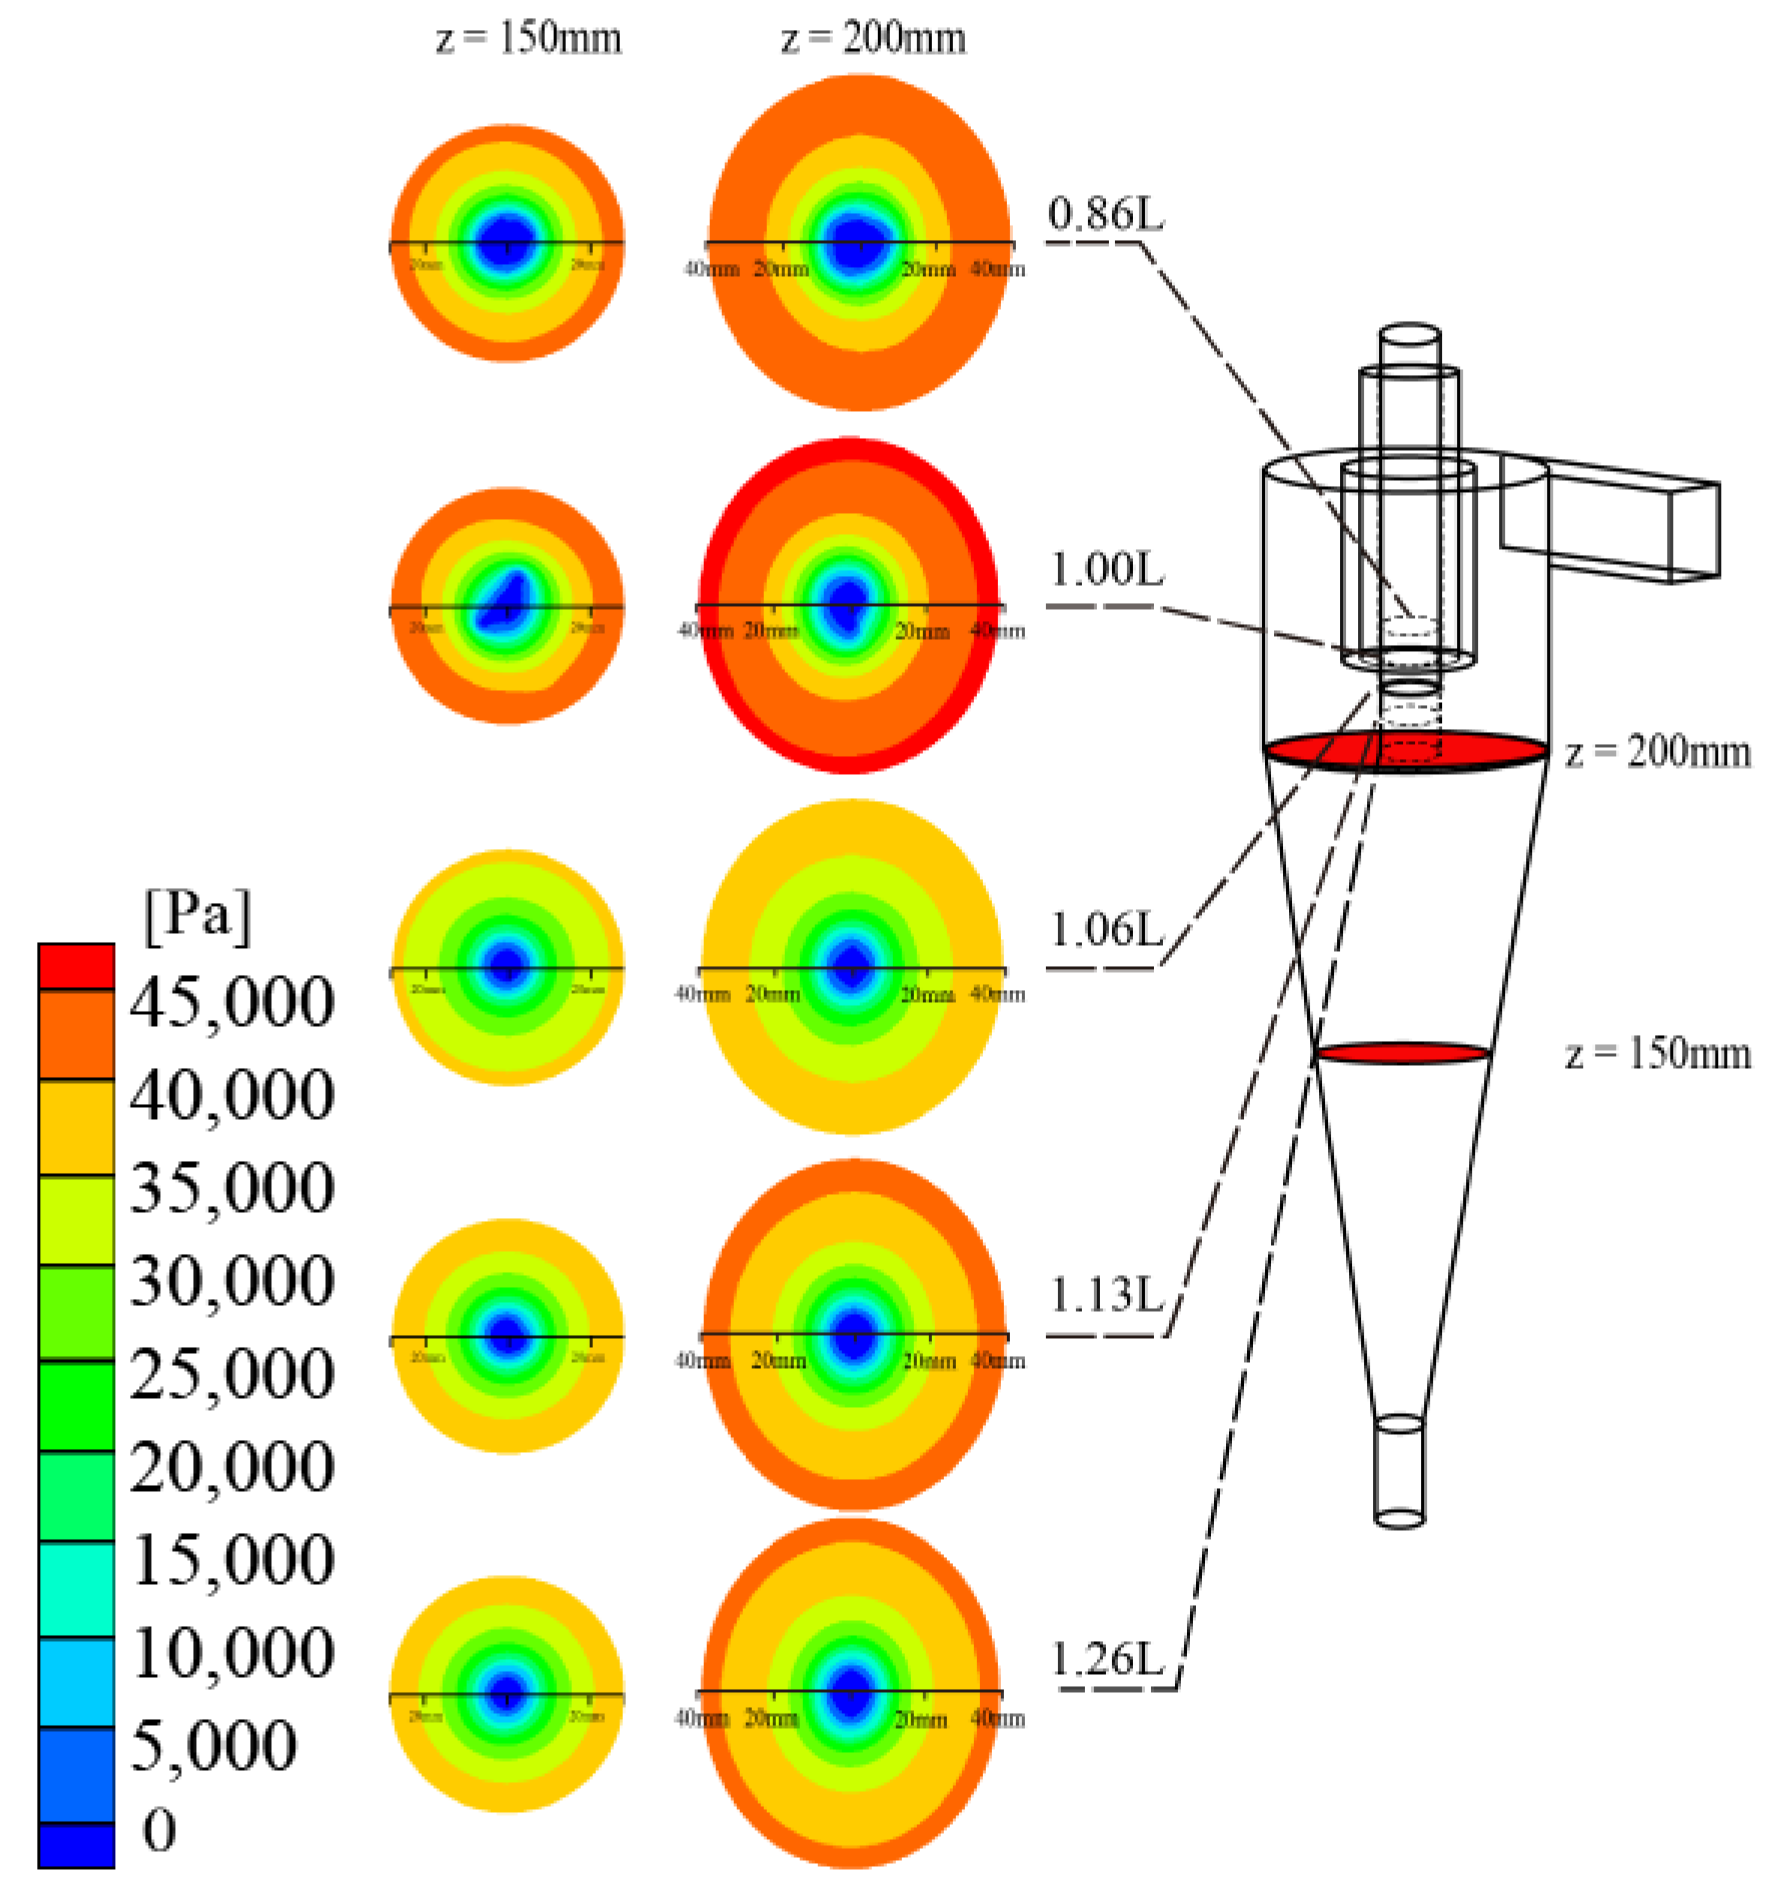
3.2.1. Statistic Pressure Distribution
Figure 11 shows the static pressure distribution of the hydrocyclone. It can be found that the change of the length of the internal overflow pipe has the same effect on the pressure field at different heights. Meanwhile, at a certain height, the radial pressure gradient of the flow field is larger when the internal overflow pipe length is less than or equal to the external overflow pipe length, and the pressure gradient reaches the maximum when the insertion depth of the internal and external vortex finders is the same. Since the direction of the pressure gradient is from the high-pressure area to the low-pressure area, a larger pressure gradient is favorable for the migration of fine particles from the wall to the axis. Thus, when the internal overflow pipe length is less than or equal to the external overflow pipe length, the content of fine particles in the external hydrocyclone region will decrease, improving the classification accuracy of the hydrocyclone.
3.2.2. Tangential Velocity
Figure 12 shows the influence of insertion depth of the internal overflow pipe on tangential velocity. Internal overflow pipe length is 0.86 L, tangential velocity variation is concentrated in the range from −20 mm to 20 mm of hydrocyclone radius, and the tangential velocity reaches the maximum. When the internal overflow pipe length is equal to or huger than the outside, the tangential velocity variation decreases gradually. It can be concluded that the change of the internal overflow pipe length does not significantly affect the centrifugal field of the hydrocyclone when the internal overflow pipe length is equal to or greater than the external overflow pipe.
3.2.3. Pressure Drop and the Split Ratio of Internal and External Overflow
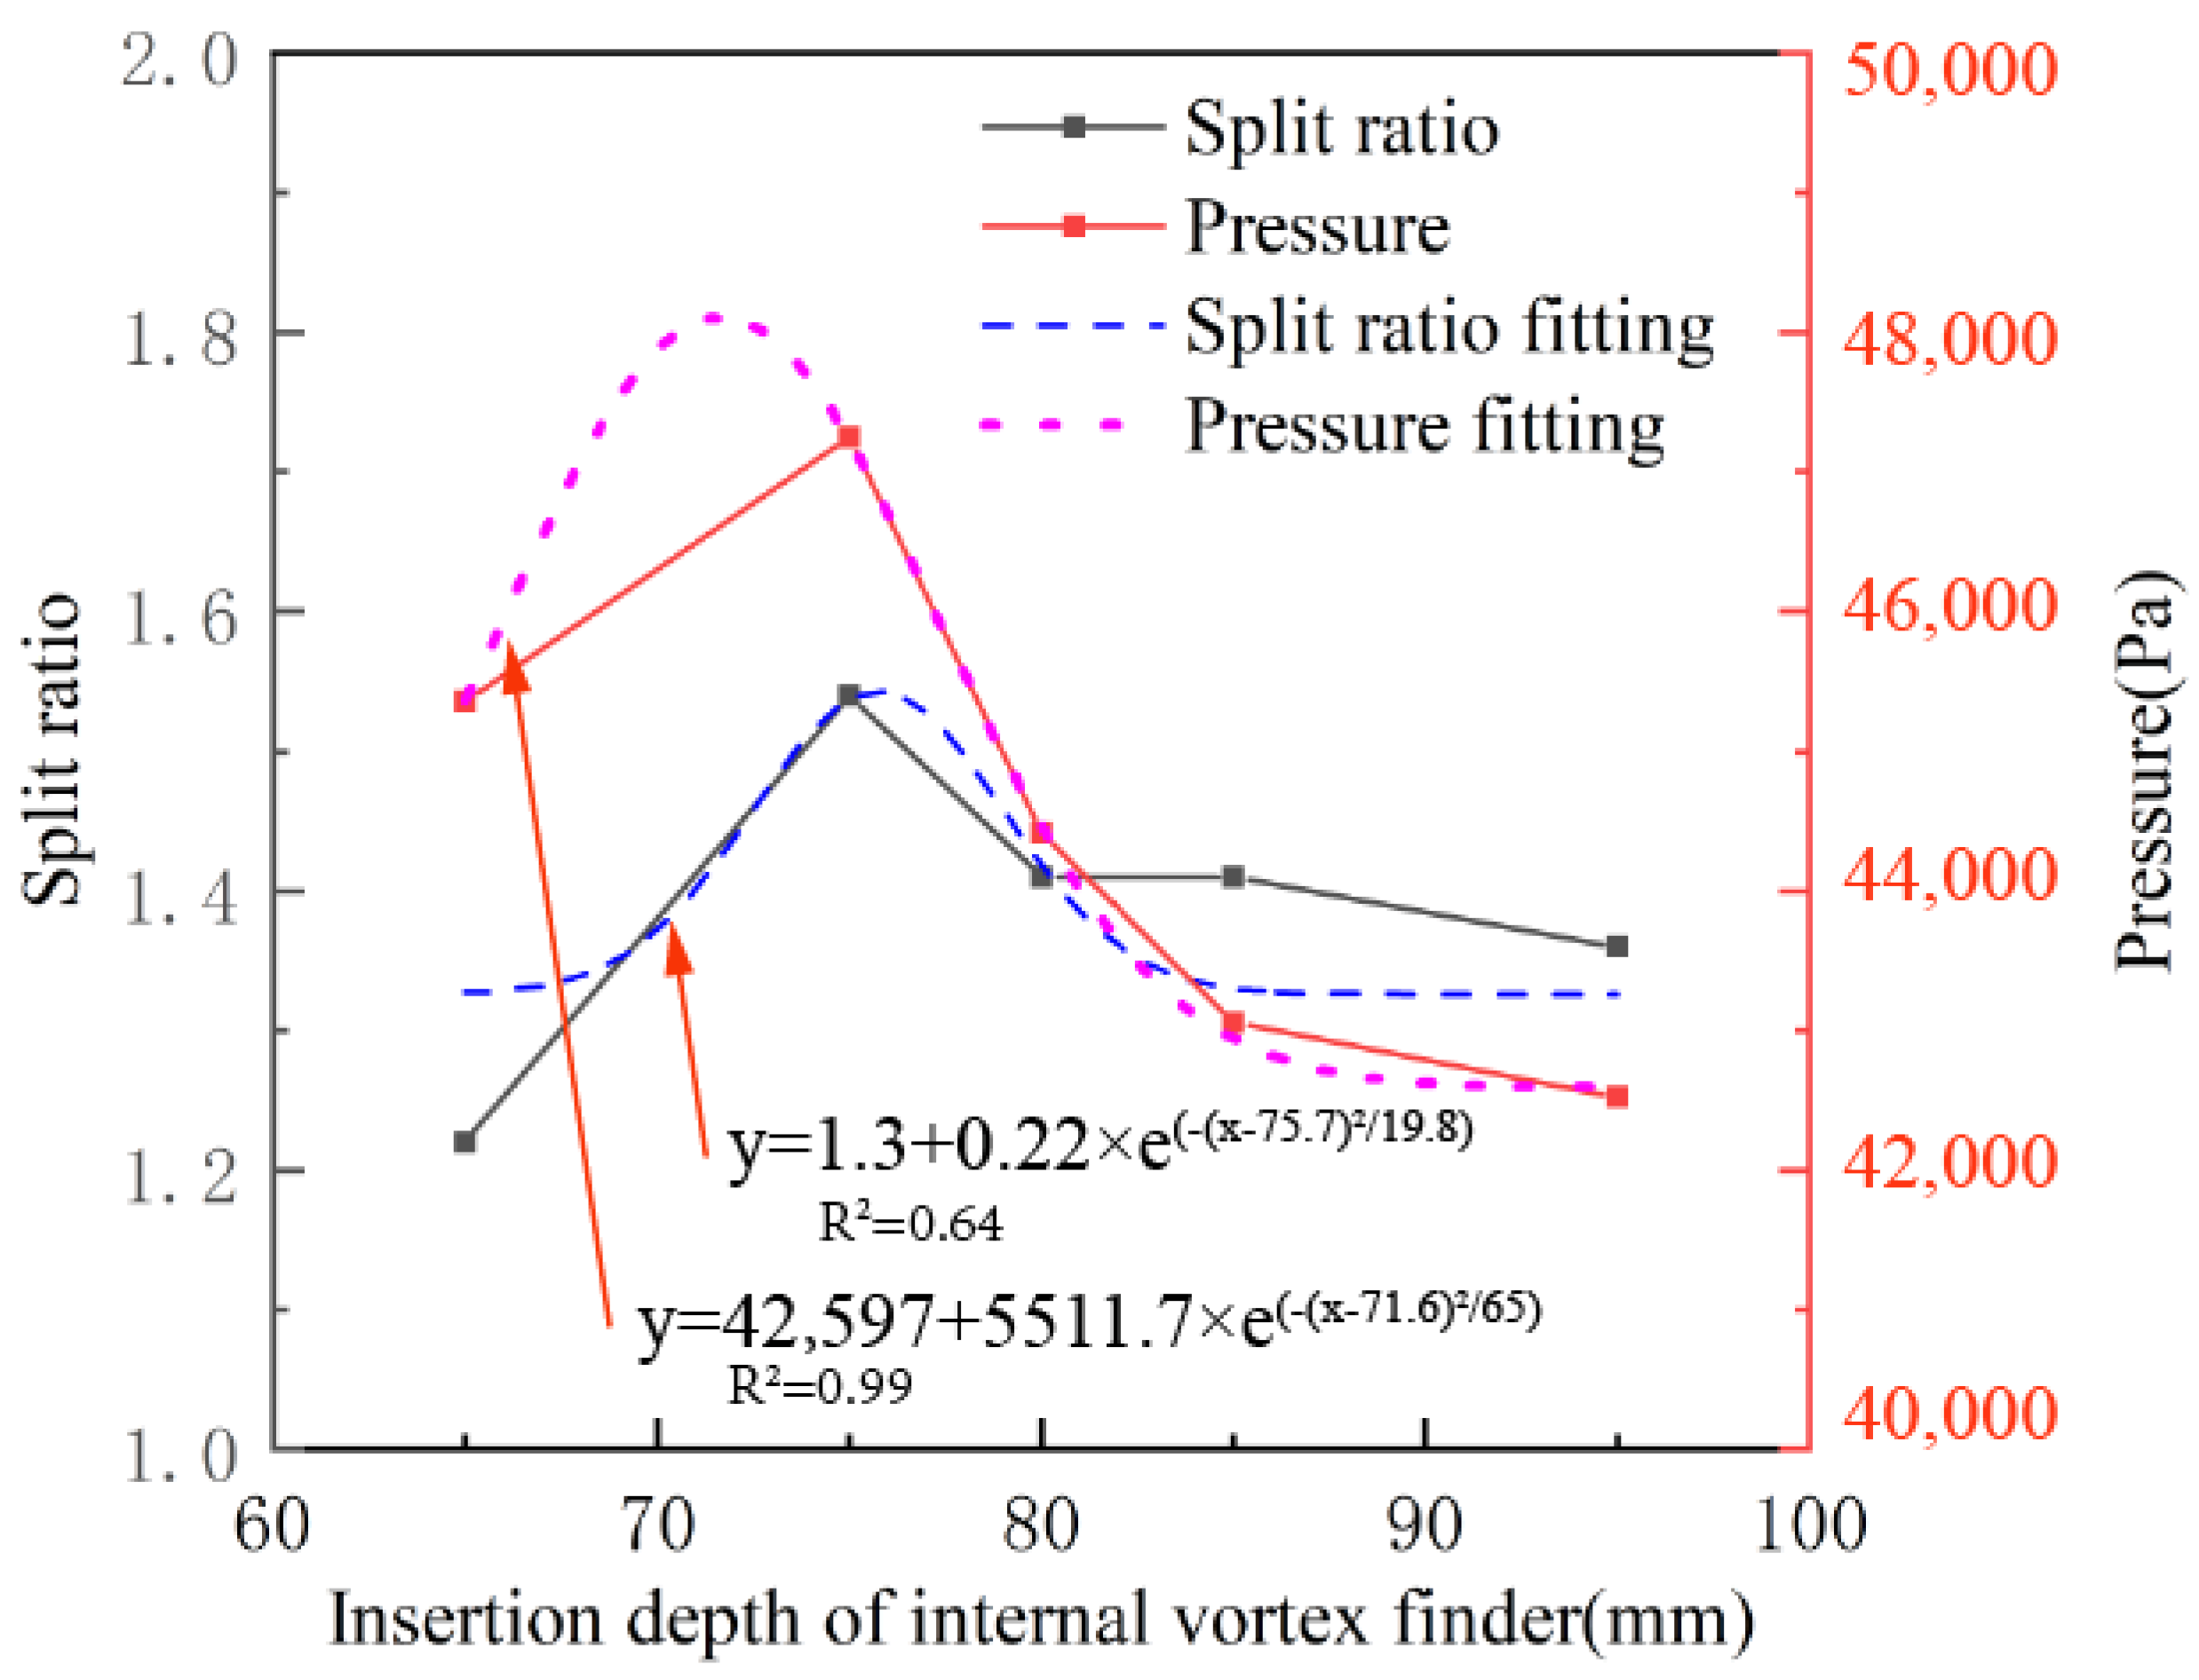
Figure 13 shows the influence of internal overflow pipe length on the hydrocyclone pressure drop and the split ratio of internal and external overflow. The split ratio of internal and external overflow varies from 1.2 to 1.45 with internal vortex-finder lengths. When the insertion depths of internal and external overflow are the same, the split ratio is the largest. Furthermore, the pressure drop is the largest when the insertion depths of the internal and external vortex-finders are the same, indicating that the flush internal and external vortex-finders improve the classification of the flow field. The peak values of pressure drop and the split ratio of internal and external overflow were predicted with data fitting. The results show that the peak pressure drop and peak split ratio correspond to the same internal vortex-finder length, which provides a reference to optimize parameters of the internal vortex-finder insertion length.
3.2.4. Pulp Movement Trajectory
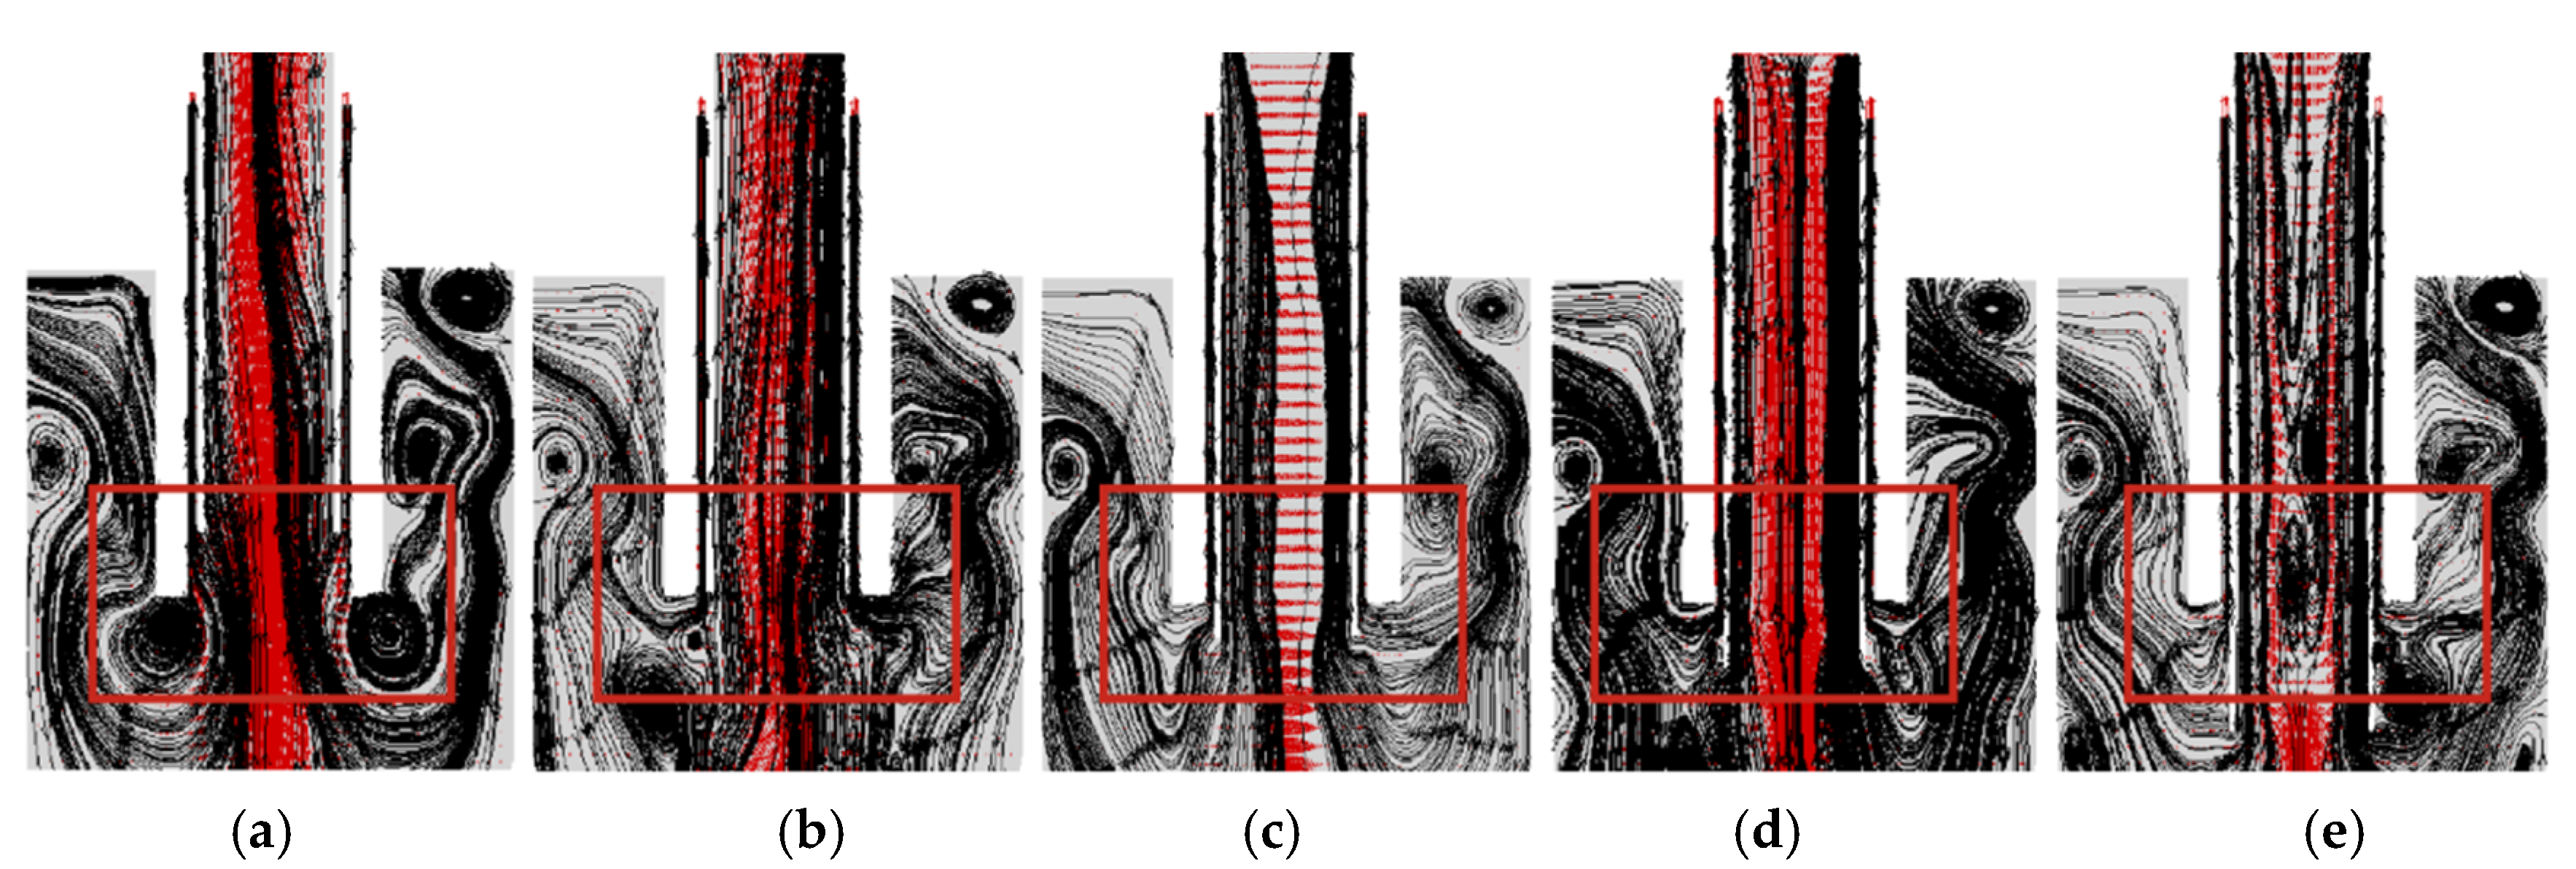
Figure 14 shows the pulp movement trajectory of the hydrocyclone column section with different internal overflow pipe lengths. The axial movement distance of the fluid entering the internal vortex finder gradually increases with the internal overflow pipe length, which is conducive to the residence of the particles in the cyclone field and for particle classification. Meanwhile, the internal overflow pipe length is smaller than the external overflow pipe length, and the vortex is easily formed at the bottom of the vortex-finder, which is not conducive to the stability of the flow field or for the classification accuracy.
3.3. Response Surface Model
3.3.1. Model Design
To further explore the influence of internal overflow pipe diameter and insertion depth on the classification efficiency of the cyclone, an optimization model was established according to the central composite design and response surface methodology, as shown in
Table 3.
Figure 15 shows the internal overflow rates of hydrocyclones with relevant response surfaces.
Figure 15a–i correspond to the first nine combinations in
Table 3, respectively. When the internal overflow pipe diameter is small, the classification efficiency of particles with the particle size of 20 μm and below is low, only around 30%, as shown in
Figure 15a,c,e. When the internal overflow pipe diameter is large, the corresponding microfine particle classification efficiency can reach over 80%, as shown in
Figure 15b,d,f. It should be noted that although increasing the diameter of internal overflow is beneficial to increase the classification efficiency of fine particles, some coarse particles will also be included in the fine particles, reducing the classification accuracy.
3.3.2. Optimization Model Validation
The response function obtained by the quadratic regression equation is as follows.
Analysis of variance and tests need to be performed on the fitted equations for accuracy and reliability [
36], and the results are shown in
Table 4. To some extent,
p-value provides the reliability basis for our model [
37,
38]. The high significance indicates that the fitted regression equation meets the prediction requirements.
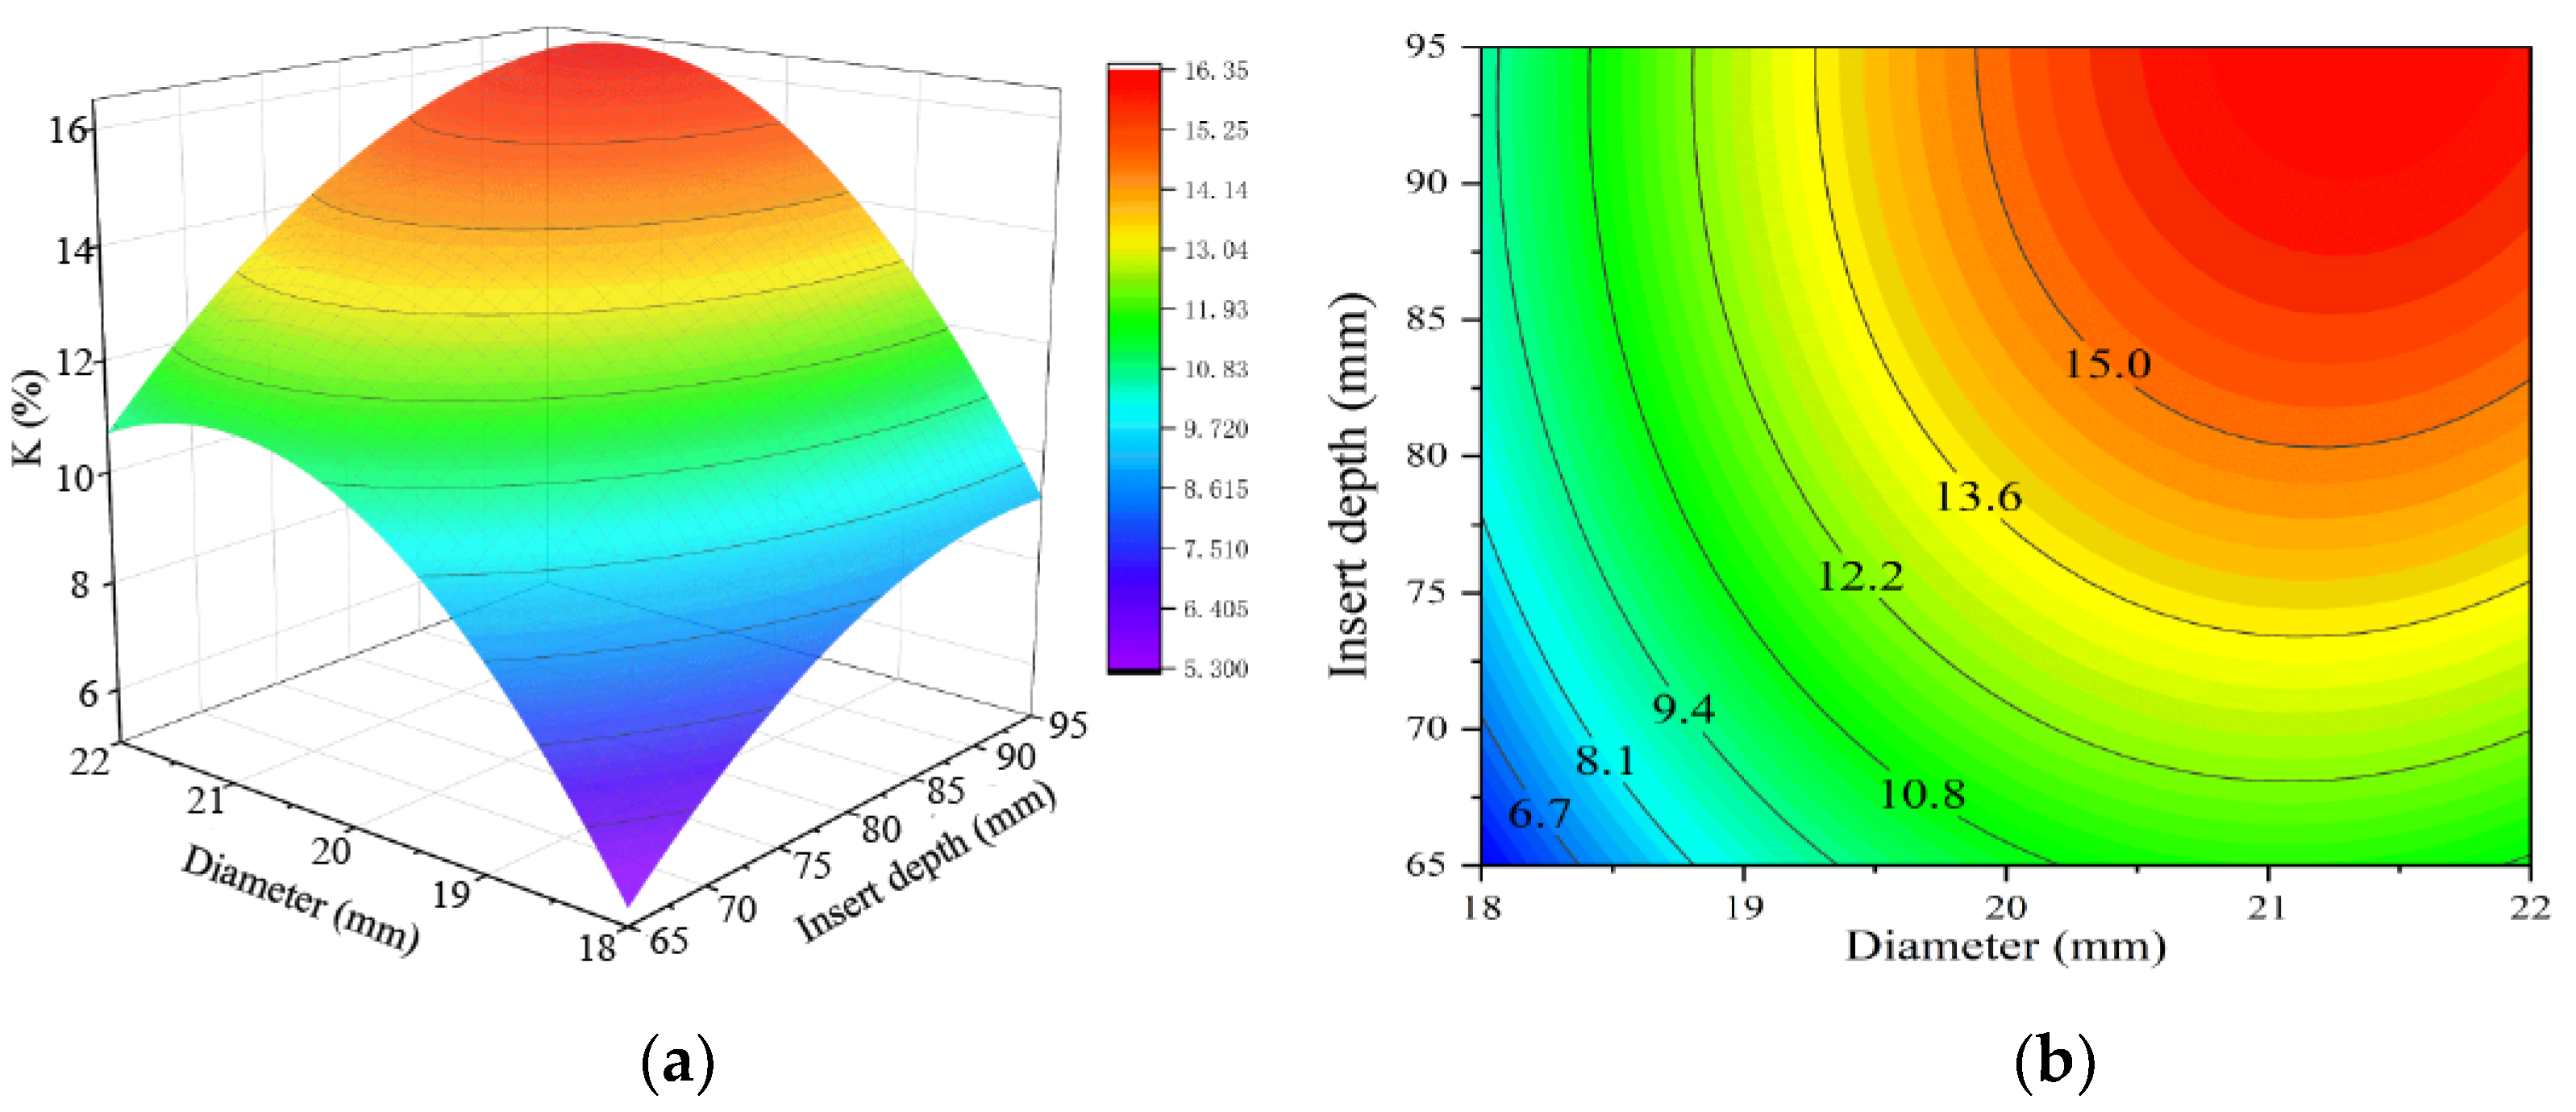
The influence of the internal overflow pipe diameter and insertion depth on the K value is obtained with the central composite response surface optimization. As shown in
Figure 16, when the internal overflow pipe diameter is small, despite the change of the insertion depth, the K value is less than 10%. When the internal overflow pipe diameter is large, the K value is above 12%. Therefore, the classification efficiency of the internal overflow pipe in the hydrocyclone increases with the internal overflow pipe diameter. Meanwhile, when the internal overflow pipe diameter is large, the interaction between the internal overflow pipe diameter and the internal overflow pipe insertion depth becomes obvious. The efficiency and accuracy of classification can remain high with an appropriate increase in the internal overflow pipe diameter and a reduction of the internal overflow pipe insertion depth.
4. Conclusions
With the numerical simulation of the double vortex-finder hydrocyclone and the optimized response surface model of the internal vortex-finder diameter and insertion depth, the following conclusions are drawn.
(1) The flow field pressure drop and split ratio increase with the internal vortex-finder diameter in the double overflow pipe hydrocyclone. The increase in internal overflow pipe length will intensify the flow field fluctuation, and when the internal and external vortex-finder lengths are equal, the flow field pressure drop and split ratio reach the maximum.
(2) The content of fine particles of the internal overflow is positively related to the internal overflow pipe diameter. However, when the ratio of internal and external overflow pipe diameters is over 0.88, the coarse particles in the internal overflow will increase rapidly, reducing the classification accuracy. Moreover, the coarse particle content in the internal overflow pipe gradually decreases with the increase in the insertion depth of the internal overflow pipe.
(3) According to the response surface analysis, when the ratio of internal and external overflow pipe diameters is in the range from 0.8 to 0.88, the interaction between the internal overflow pipe diameter and insertion depth on classification efficiency is obvious. An appropriate increase in the internal overflow pipe diameter and insertion depth improves the efficiency and accuracy of classification.
In this study, the effects of the internal overflow pipe diameter and insertion depth on the flow field and classification performance have been analyzed. However, the effect of the acting force of particles was ignored in the numerical simulations, which needs to be further studied.
Author Contributions
Conceptualization, Y.Z.; Methodology, Y.Z. and L.J.; Software, J.G. and H.W.; Validation, J.G. and H.W.; Formal Analysis, J.G. and L.J; Investigation, Y.Z. and Y.D.; Resources, Y.D. and L.J.; Writing—Original Draft Preparation, Y.Z.; Writing—Review and Editing, J.G. and L.J. All authors have read and agreed to the published version of the manuscript.
Funding
This research was funded by the Natural Science Foundation of Shandong Province, China (ZR2020ME105), the National Natural Science Foundation of China (22108159), and the Natural Science Foundation of Shandong province, China (ZR2021QB068).
Institutional Review Board Statement
Not applicable.
Informed Consent Statement
Not applicable.
Data Availability Statement
Not applicable.
Conflicts of Interest
The authors declare no conflict of interest.
References
- Tian, J.; Ni, L.; Song, T.; Shen, C.; Yao, Y.; Zhao, J.N. Numerical study of foulant-water separation using hydrocyclones enhanced by reflux device: Effect of underflow pipe diameter. Sep. Purif. Technol. 2019, 215, 10–24. [Google Scholar] [CrossRef]
- Suresh, P.D.; Kumar, V.; Sripriya, R.; Chakraborty, S.; Meikap, B.C. Performance characteristics of pilot plant dense media hydrocyclone for beneficiation of coal and 3D CFD simulation. Chem. Eng. Sci. 2010, 65, 4661–4671. [Google Scholar] [CrossRef]
- Xie, H.Y.; Sun, R.; Ren, X.J.; You, Z.C.; Liu, Y.H.; Feng, D.X.; Chen, L.Z. Development of a novel fluidized hydrocyclone concentrator for mineral separation. Sep. Purif. Technol. 2020, 248, 116960. [Google Scholar] [CrossRef]
- Li, S.; Li, R.N.; Nicolleau, F.C.G.A.; Wang, Z.C.; Yan, Y.J.; Xu, Y.; Chen, X. Study on oil–water two phase flow characteristics of the hydrocyclone under periodic excitation. Chem. Eng. Res. Des. 2020, 159, 215–224. [Google Scholar] [CrossRef]
- Kyriakidis, Y.N.; Silva, D.O.L.; Barrozo, M.A.S.; Vieira, L.G.M. Effect of variables related to the separation performance of a hydrocyclone with unprecedented geometric relationships. Powder Technol. 2018, 338, 645–653. [Google Scholar] [CrossRef]
- Padhi, M.; Mangadoddy, N.; Sreenivas, T.; Vakamalla, T.R.; Mainza, A.N. Study on multi-component particle behaviour in a hydrocyclone classifier using experimental and computational fluid dynamics techniques. Sep. Purif. Technol. 2019, 229, 115698. [Google Scholar] [CrossRef]
- Ghodrat, M.; Qi, Z.; Kuang, S.B.; Ji, L.; Yu, A.B. Computational investigation of the effect of particle density on the multiphase flows and performance of hydrocyclone. Miner. Eng. 2016, 90, 55–69. [Google Scholar] [CrossRef]
- Yang, O.; Wang, H.L.; Wang, J.G.; Li, Z.M.; Liu, Y. The coordinated relationship between vortex finder parameters and performance of hydrocyclones for separating light dispersed phase. Sep. Purif. Technol. 2011, 79, 310–320. [Google Scholar] [CrossRef]
- Ghodrat, M.; Kuang, S.B.; Yu, A.B.; Vince, A.; Barnett, G.D.; Barnett, P.J. Numerical analysis of hydrocyclones with different vortex finder configurations. Miner. Eng. 2014, 63, 125–138. [Google Scholar] [CrossRef]
- Tang, B.; Xu, Y.X.; Song, X.F.; Sun, Z.; Yu, J.G. Numerical study on the relationship between high sharpness and configurations of the vortex finder of a hydrocyclone by central composite design. Chem. Eng. J. 2015, 278, 504–516. [Google Scholar] [CrossRef]
- Cui, B.Y.; Zhang, C.E.; Wei, D.Z.; Lu, S.S.; Feng, Y.Q. Effects of feed size distribution on separation performance of hydrocyclones with different vortex finder diameters. Powder Technol. 2017, 322, 114–123. [Google Scholar] [CrossRef]
- Martinez, L.F.; Lavin, A.G.; Mahamud, M.M.; Bueno, J.L. Vortex finder optimum length in hydrocyclone Separation. Chem. Eng. Process. Process Intensif. 2008, 47, 192–199. [Google Scholar] [CrossRef]
- Wang, B.; Yu, A.B. Numerical study of the gas–liquid–solid flow in hydrocyclones with different configuration of vortex finder. Chem. Eng. J. 2008, 135, 33–42. [Google Scholar] [CrossRef]
- Silva, N.K.G.; Silva, D.O.; Vieira, L.G.M.; Barrozo, M.A.S. Effects of underflow diameter and vortex finder length on the performance of a newly designed filtering hydrocyclone. Powder Technol. 2015, 286, 305–310. [Google Scholar] [CrossRef]
- Liu, H.Y.; Wang, Y.; Han, T.L.; Huang, Q.S. Influence of vertex finder configurations on separation of fine particles. CIESC J. 2017, 68, 1921–1931. [Google Scholar] [CrossRef]
- Hwang, I.S.; Jeong, H.J.; Hwang, J. Effects of vortex finder length on flow field and collection efficiency of cyclone in an industrial scale circulating fluidized bed boiler: Numerical study. Int. J. Energy Res. 2020, 44, 7229–7241. [Google Scholar] [CrossRef]
- Tian, J.Y.; Ni, L.; Song, T.; Zhao, J.N. CFD simulation of hydrocyclone-separation performance influenced by reflux device and different vortex-finder lengths. Sep. Purif. Technol. 2019, 233, 116013. [Google Scholar] [CrossRef]
- Noori, M.; Dehghan, R. Toward a better understanding of a Tri-Flo separator using prototyping, central composite design (CCD) and CFD simulation. Int. J. Coal Prep. Util. 2020, 2, 1–21. [Google Scholar] [CrossRef]
- Xu, Y.X.; Tang, B.; Song, X.F.; Yu, J.G. A high-efficiency hydrocyclone designed by response surface methodology for acid hydrolysis residue recycling. R. Soc. Open Sci. 2019, 6, 172339. [Google Scholar] [CrossRef] [Green Version]
- Zhang, Y.; Jiang, M.H.; Zhang, Y. The structure parameters optimization of co-rotating outflow hydrocyclone based on response surface methodology. Chenmical Enginerr. Mach. 2016, 46, 164–167. [Google Scholar]
- Obeng, D.P.; Morrell, S. The JK three-product cyclone-performance and potential applications. Int. J. Miner. Process. 2003, 69, 129–142. [Google Scholar] [CrossRef]
- Zhang, Y.K.; Liu, P.K.; Jiang, L.Y.; Yang, X.H.; Yang, J.R. Numerical Simulation of Flow Field Characteristics and Separation Performance Test of Multi-Product Hydrocyclone. Minerals 2019, 9, 300. [Google Scholar] [CrossRef] [Green Version]
- Klavuz, F.S.; Gulsoy, O.Y. The effect of cone ratio on the separation efficiency of small diameter hydrocyclones. Int. J. Miner. Process. 2010, 98, 163–167. [Google Scholar] [CrossRef]
- He, F.Q.; Zhang, Y.H.; Wang, J.G.; Yang, Q.; Tan, Y.H. Flow Patterns in Mini-Hydrocyclones with Different Vortex Finder Depths. Chem. Eng. Technol. 2013, 6, 1935–1942. [Google Scholar] [CrossRef]
- Vieira, L.G.M.; Barrozo, M.A.S. Effect of vortex finder diameter on the performance of a novel hydrocyclone separator. Miner. Eng. 2014, 57, 50–56. [Google Scholar] [CrossRef]
- Li, F.; Liu, P.K.; Yang, X.H.; Zhang, Y.K. Numerical simulation on the effects of different inlet pipe structures on the flow field and seperation performance in a hydrocyclone. Powder Technol. 2020, 373, 254–266. [Google Scholar] [CrossRef]
- Wang, C.C.; Wu, R.M. Experimental and simulation of a novel hydrocyclone tubular membrane as overflow pipe. Sep. Purif. Technol. 2018, 198, 60–67. [Google Scholar] [CrossRef]
- Kuang, S.B.; Chu, K.W.; Yu, A.B.; Vince, A. Numerical study of liquid–gas–solid flow in classifying hydrocyclones: Effect of feed solids concentration. Miner. Eng. 2012, 31, 17–31. [Google Scholar] [CrossRef]
- Azimian, M.; Bart, H.J. Numerical analysis of hydroabrasion in a hydrocyclone. Pet. Sci. 2016, 13, 304–319. [Google Scholar] [CrossRef] [Green Version]
- Gong, H.F.; Yu, B.; Dai, F.; Peng, Y.; Shao, J. Simulation on performance of a demulsification and dewatering device with coupling double fields: Swirl centrifugal field and high-voltage electric field. Sep. Purif. Technol. 2018, 207, 124–132. [Google Scholar] [CrossRef]
- Ke, R.J.; Shingote, C.; Kadambi, J.R.; Furlan, J.; Visintainer, R. Experimental and Numerical Investigations of the Fluid Flow in a Hydroclyclone with an Air Core, Mining. Metall. Explor. 2020, 37, 277–286. [Google Scholar] [CrossRef]
- Xu, X.; Ge, X.L.; Qian, Y.D.; Wang, H.L.; Yang, Q. Bubble-separation dynamics in a planar cyclone: Experiments and CFD simulations. Aiche J. 2018, 64, 2689–2701. [Google Scholar] [CrossRef]
- Hsieh, K.T.; Rajamani, K. Phenomenological model of the hydrocyclone: Model development and verification for single-phase flow. Int. J. Miner. Process. 1988, 22, 223–237. [Google Scholar] [CrossRef]
- Prashant, D.; Rachit, T.; Kumar, M.A.; Kumar, B.P. Application of response surface methodology for modeling and optimization of spiral separator for processing of iron ore slime. Power Technol. 2015, 275, 105–112. [Google Scholar] [CrossRef]
- Sun, X.; Kim, S.; Yang, S.D.; Kim, H.S.; Yoon, J.Y. Multi-objective optimization of a Stairmand cyclone separator using response surface methodology and computational fluid dynamics. Power Technol. 2019, 320, 51–65. [Google Scholar] [CrossRef]
- Ye, J.X.; Xu, Y.X.; Song, X.F.; Yu, J.G. Numerical modelling and multi-objective optimization of the novel hydrocyclone for ultra-fine particles classification. Chem. Eng. Sci. 2019, 7, 1072–1084. [Google Scholar] [CrossRef]
- Jing, J.Q.; Zhang, S.J.; Qin, M.; Luo, J.Q.; Shan, Y.T.; Cheng, Y.Z.; Tan, J.T. Numerical simulation study of offshore heavy oil desanding by hydrocyclones. Sep. Purif. Technol. 2021, 285, 118051. [Google Scholar] [CrossRef]
- Yu, J.F.; Fu, J.; Cheng, H.; Cui, Z.W. Recycling of rare earth particle by mini-hydrocyclones. Waste Manag. 2017, 61, 362–371. [Google Scholar] [CrossRef]
Figure 1.
Hydrocyclone construction and meshing diagram. (a) Structure diagram. (b) Mesh.
Figure 1.
Hydrocyclone construction and meshing diagram. (a) Structure diagram. (b) Mesh.
Figure 2.
Double vortex-finder hydrocyclone in different diameter configurations. (a) 0.64D (b) 0.72D (c) 0.80D (d) 0.88D.
Figure 2.
Double vortex-finder hydrocyclone in different diameter configurations. (a) 0.64D (b) 0.72D (c) 0.80D (d) 0.88D.
Figure 3.
Double vortex-finder hydrocyclone in different length configurations. (a) 0.86L (b) 1.00L (c) 1.06L (d) 1.13L (e) 1.26L.
Figure 3.
Double vortex-finder hydrocyclone in different length configurations. (a) 0.86L (b) 1.00L (c) 1.06L (d) 1.13L (e) 1.26L.
Figure 4.
Verification of grid independence.
Figure 4.
Verification of grid independence.
Figure 5.
Validation data for the mathematical modeling. (a) Validation of VOF (b) Validation of Mixture.
Figure 5.
Validation data for the mathematical modeling. (a) Validation of VOF (b) Validation of Mixture.
Figure 6.
Influence of internal vortex-finder diameter on radial pressure.
Figure 6.
Influence of internal vortex-finder diameter on radial pressure.
Figure 7.
Influence of internal overflow pipe diameter on tangential velocity. (a) z = 150 mm (b) z = 200 mm.
Figure 7.
Influence of internal overflow pipe diameter on tangential velocity. (a) z = 150 mm (b) z = 200 mm.
Figure 8.
Boundary curve of air core.
Figure 8.
Boundary curve of air core.
Figure 9.
The impact of internal vortex-finder diameter on pressure drop and split ratio.
Figure 9.
The impact of internal vortex-finder diameter on pressure drop and split ratio.
Figure 10.
The movement track of liquid under different internal vortex-finder diameters. (a) 0.64D (b) 0.72D (c) 0.80D (d) 0.88D.
Figure 10.
The movement track of liquid under different internal vortex-finder diameters. (a) 0.64D (b) 0.72D (c) 0.80D (d) 0.88D.
Figure 11.
Influence of the insertion depth of the internal overflow pipe on the pressure.
Figure 11.
Influence of the insertion depth of the internal overflow pipe on the pressure.
Figure 12.
Influence of insertion depth of the internal vortex finder on tangential velocity. (a) z = 150 mm (b) z = 200 mm.
Figure 12.
Influence of insertion depth of the internal vortex finder on tangential velocity. (a) z = 150 mm (b) z = 200 mm.
Figure 13.
Influence of the insertion depth of the internal vortex finder on pressure drop and split ratio.
Figure 13.
Influence of the insertion depth of the internal vortex finder on pressure drop and split ratio.
Figure 14.
Slurry movement trajectory of hydrocyclone under different length of internal vortex finder. (a) 0.86L (b) 1.00L (c) 1.06L (d) 1.13L (e) 1.26L.
Figure 14.
Slurry movement trajectory of hydrocyclone under different length of internal vortex finder. (a) 0.86L (b) 1.00L (c) 1.06L (d) 1.13L (e) 1.26L.
Figure 15.
Internal overflow classification efficiency. (a) Test 1 (b) Test 2 (c) Test 3 (d) Test 4 (e) Test 5 (f) Test 6 (g) Test 7 (h) Test 8 (i) Test 9.
Figure 15.
Internal overflow classification efficiency. (a) Test 1 (b) Test 2 (c) Test 3 (d) Test 4 (e) Test 5 (f) Test 6 (g) Test 7 (h) Test 8 (i) Test 9.
Figure 16.
Response surface diagram. (a) Three-dimensional response diagram (b) Response surface relationship contour map.
Figure 16.
Response surface diagram. (a) Three-dimensional response diagram (b) Response surface relationship contour map.
Table 1.
Particle properties.
Table 1.
Particle properties.
| Size/μm | Value of Simulation/μm | Fraction Finer Than Size/% |
|---|
| −5 | 2.50 | 6.48 |
| 5~10 | 7.50 | 17.96 |
| 10~15 | 12.50 | 31.85 |
| 15~25 | 20.00 | 57.41 |
| 25~35 | 30.00 | 75.93 |
| 35~45 | 40.00 | 89.81 |
| 45~55 | 50.00 | 96.21 |
| 55~60 | 57.50 | 100.00 |
Table 2.
Response surface design levels.
Table 2.
Response surface design levels.
| Symbol | Low Levels | High Levels |
|---|
| D0 | 0.64D | 0.88D |
| L0 | 0.86L | 1.26L |
Table 3.
Numerical simulation design of central composite response surface.
Table 3.
Numerical simulation design of central composite response surface.
| Test No. | L0 | D0 | K |
|---|
| 1 | 18.00 | 65.00 | 6.01 |
| 2 | 22.00 | 65.00 | 11.22 |
| 3 | 18.00 | 95.00 | 9.58 |
| 4 | 22.00 | 95.00 | 16.30 |
| 5 | 17.17 | 80.00 | 3.92 |
| 6 | 22.83 | 80.00 | 12.87 |
| 7 | 20.00 | 58.79 | 7.83 |
| 8 | 20.00 | 101.21 | 14.74 |
| 9 | 20.00 | 80.00 | 14.00 |
| 10 | 20.00 | 80.00 | 14.00 |
| 11 | 20.00 | 80.00 | 14.00 |
| 12 | 20.00 | 80.00 | 14.00 |
| 13 | 20.00 | 80.00 | 14.00 |
Table 4.
Error analysis.
| Sources | Adjusted Sums
of Squares (SS) | Degree of
Freedom (DF) | Adjusted Means
Squares (MS) | F-Value | p-Value |
|---|
| Model | 168.89 | 5.00 | 33.78 | 118.81 | <0.0001 |
| D0 | 75.59 | 1.00 | 75.59 | 265.90 | <0.0001 |
| L0 | 42.47 | 1.00 | 42.47 | 149.39 | <0.0001 |
| D0 × L0 | 0.57 | 1.00 | 0.57 | 2.02 | 0.1986 |
| D0 × D0 | 45.86 | 1.00 | 45.86 | 161.32 | <0.0001 |
| L0 × L0 | 8.76 | 1.00 | 8.76 | 30.83 | 0.0009 |
| Publisher’s Note: MDPI stays neutral with regard to jurisdictional claims in published maps and institutional affiliations. |
© 2022 by the authors. Licensee MDPI, Basel, Switzerland. This article is an open access article distributed under the terms and conditions of the Creative Commons Attribution (CC BY) license (https://creativecommons.org/licenses/by/4.0/).
