
Application of Untargeted Metabolomics to Determine Volatile Compounds from the Spanish Plant Arctostaphylos uva-ursi Used as Tea

 , and
, and
Abstract
:
1. Introduction
2. Materials and Methods
2.1. Reagents
2.2. Samples Treatment
2.3. Equipment and GC Conditions
2.4. Qualitative Analysis
2.5. Optimisation of HS-SPME-GC-MS Conditions
2.6. Antioxidant Activity
2.6.1. DPPH Method
2.6.2. ORAC Method
2.6.3. Total Phenolic Content
2.6.4. Statistical Analysis
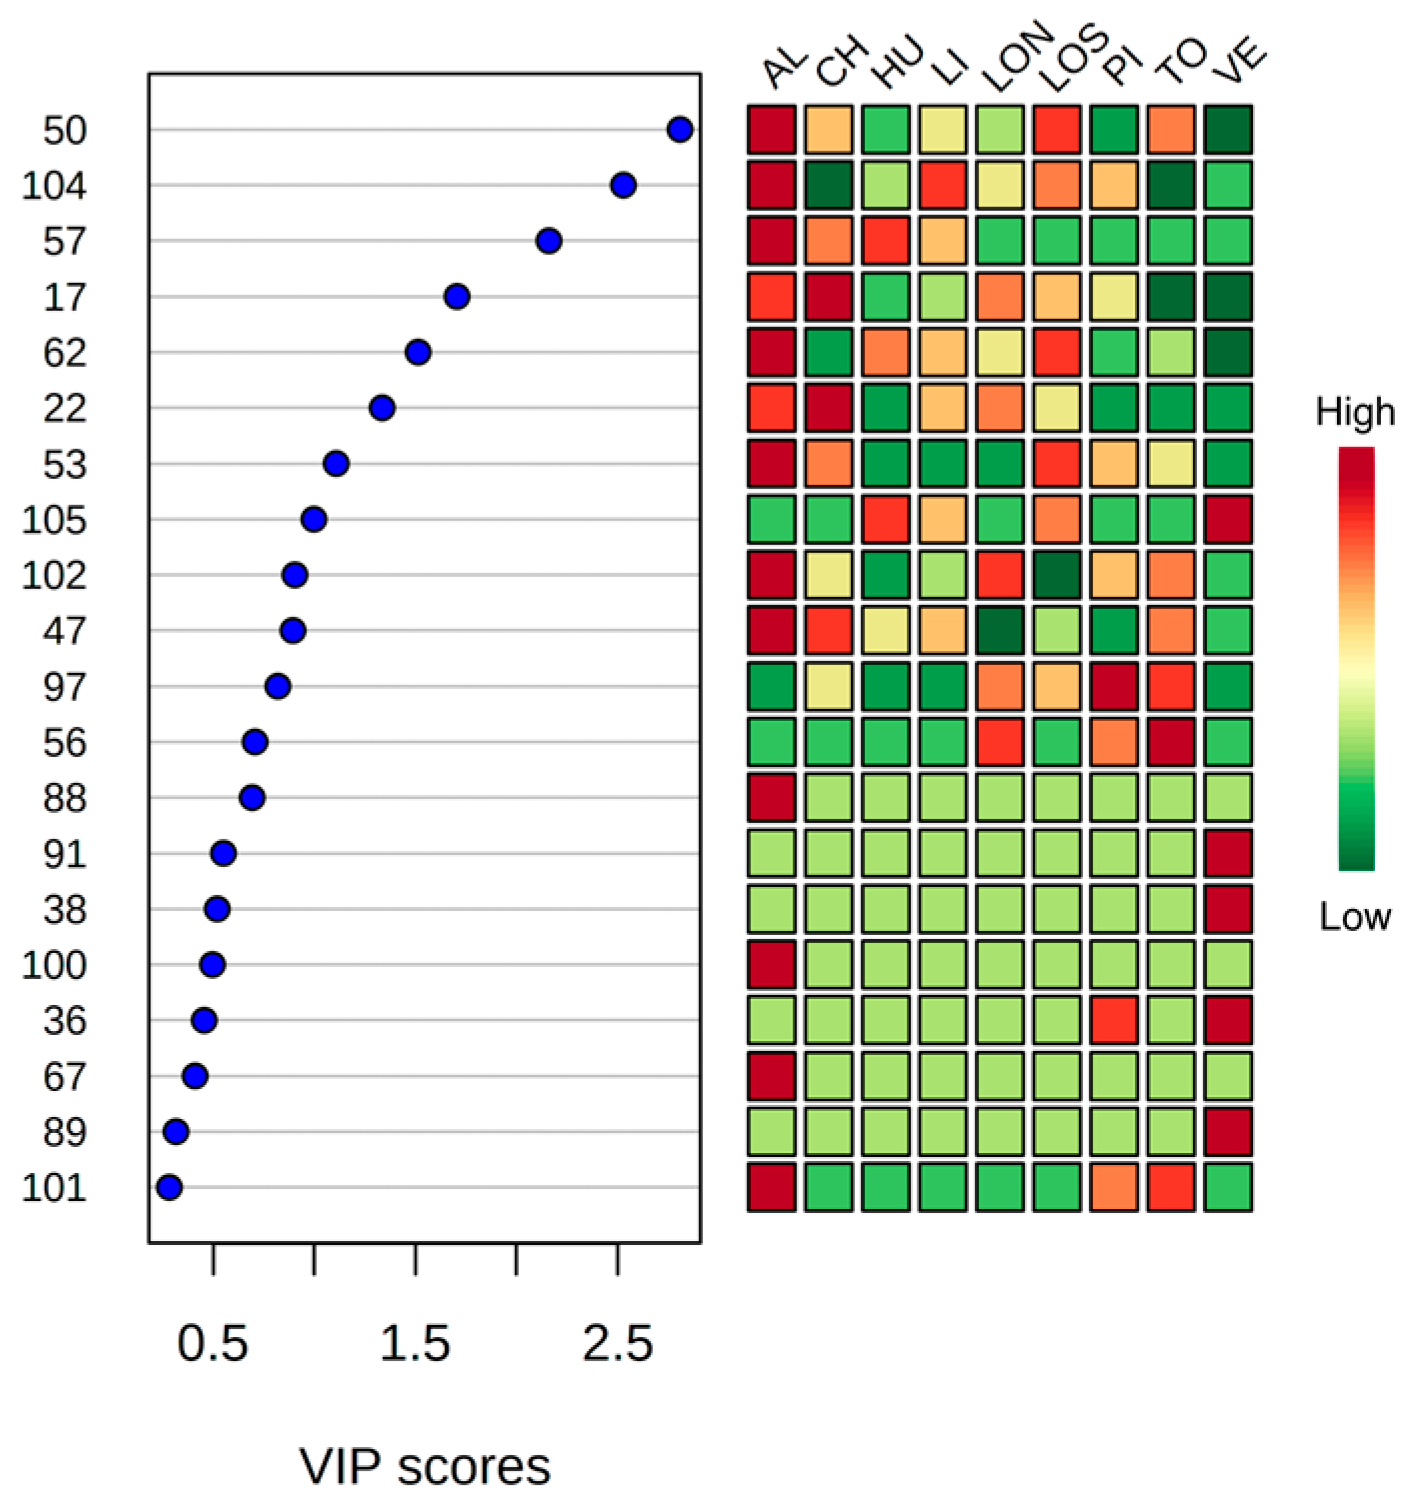
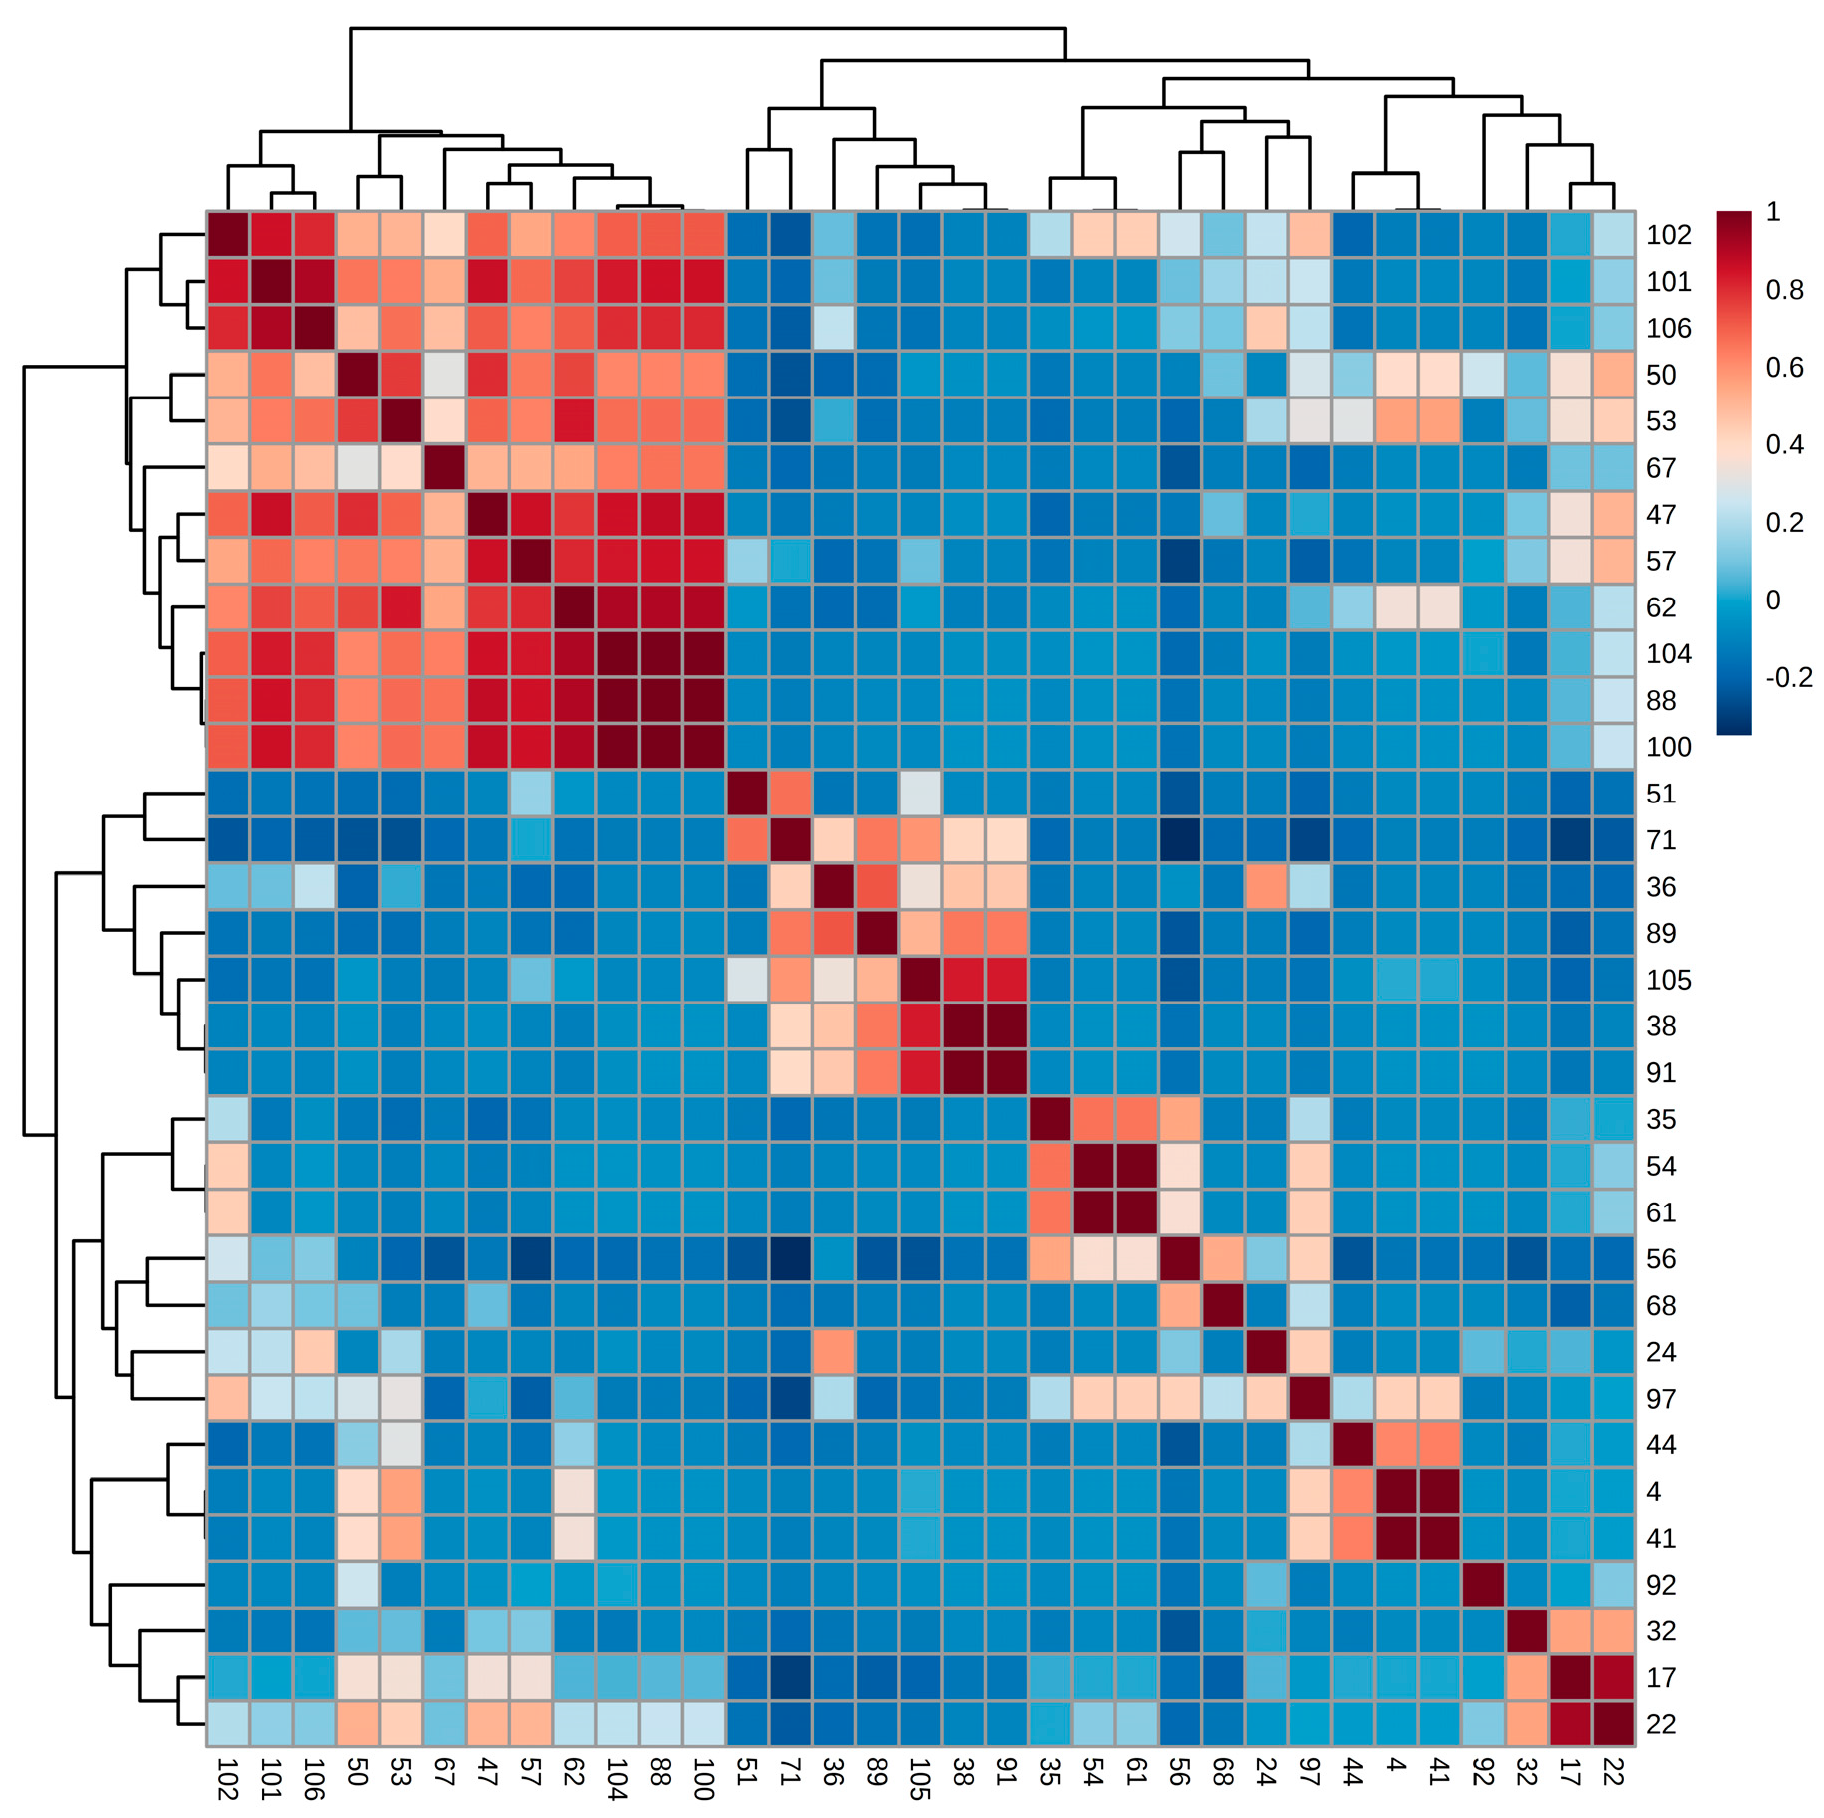
3. Results and Discussion
3.1. Optimisation of HS-SPME-GC-MS Conditions
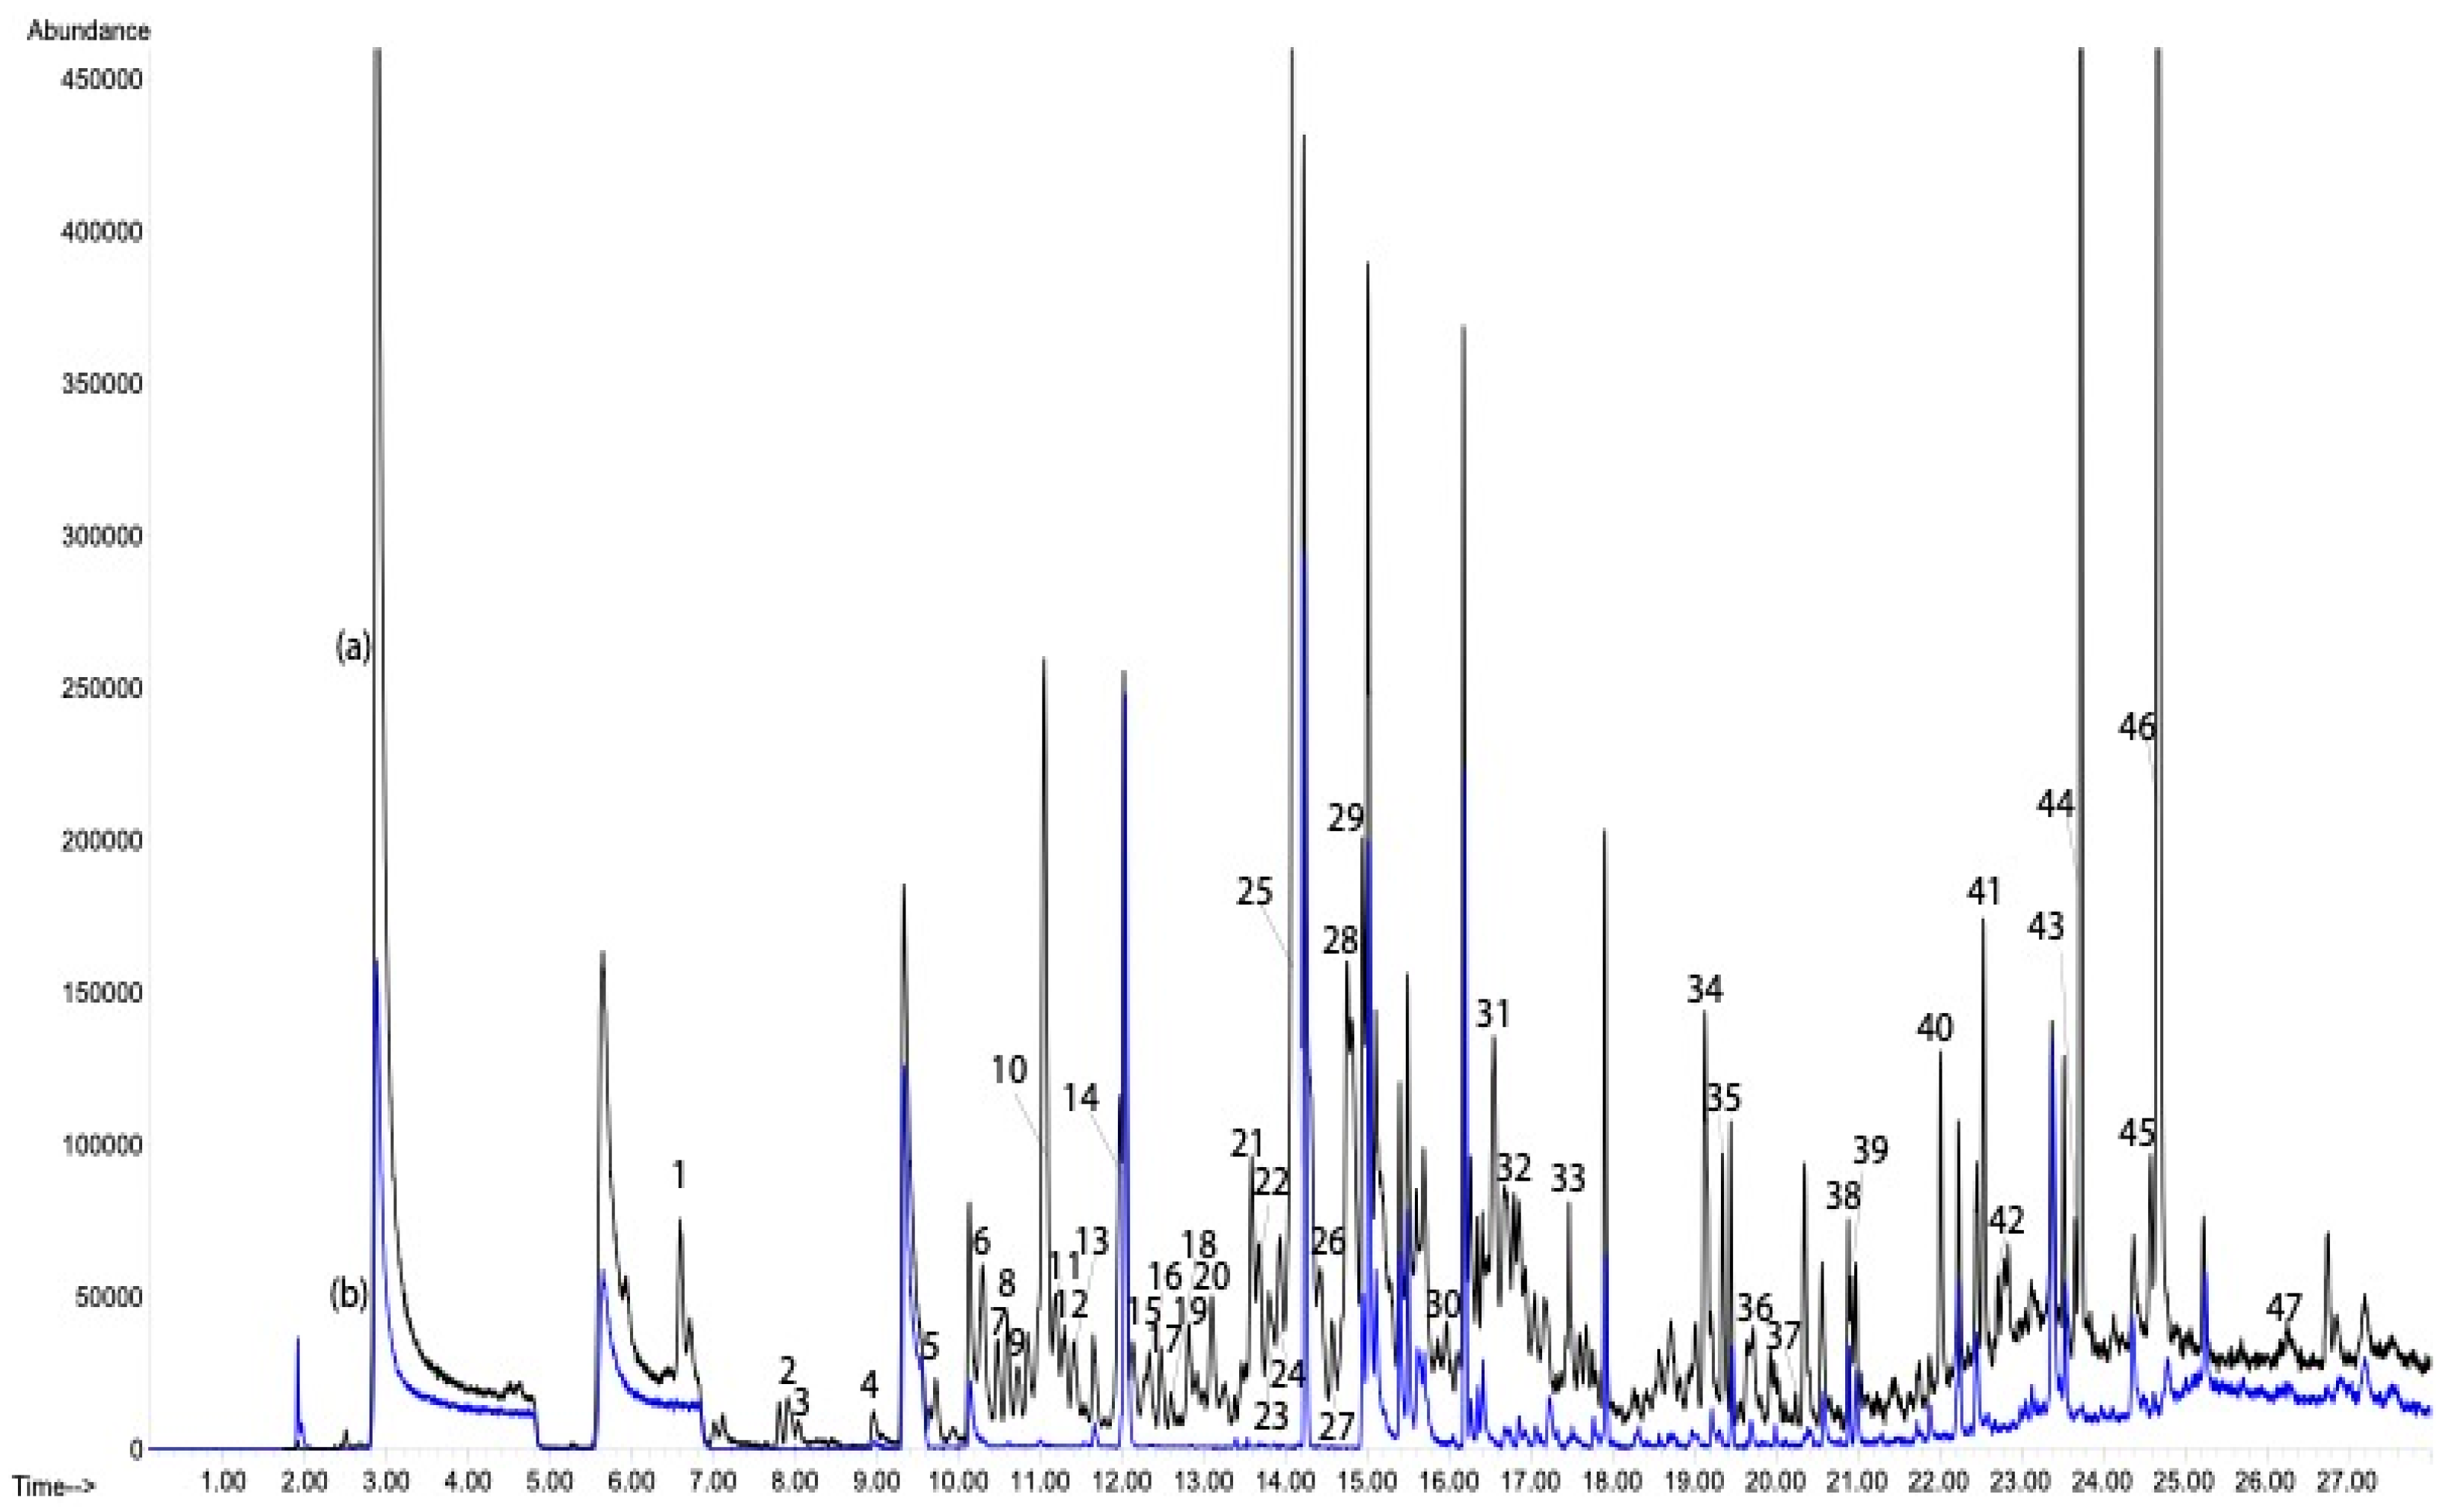
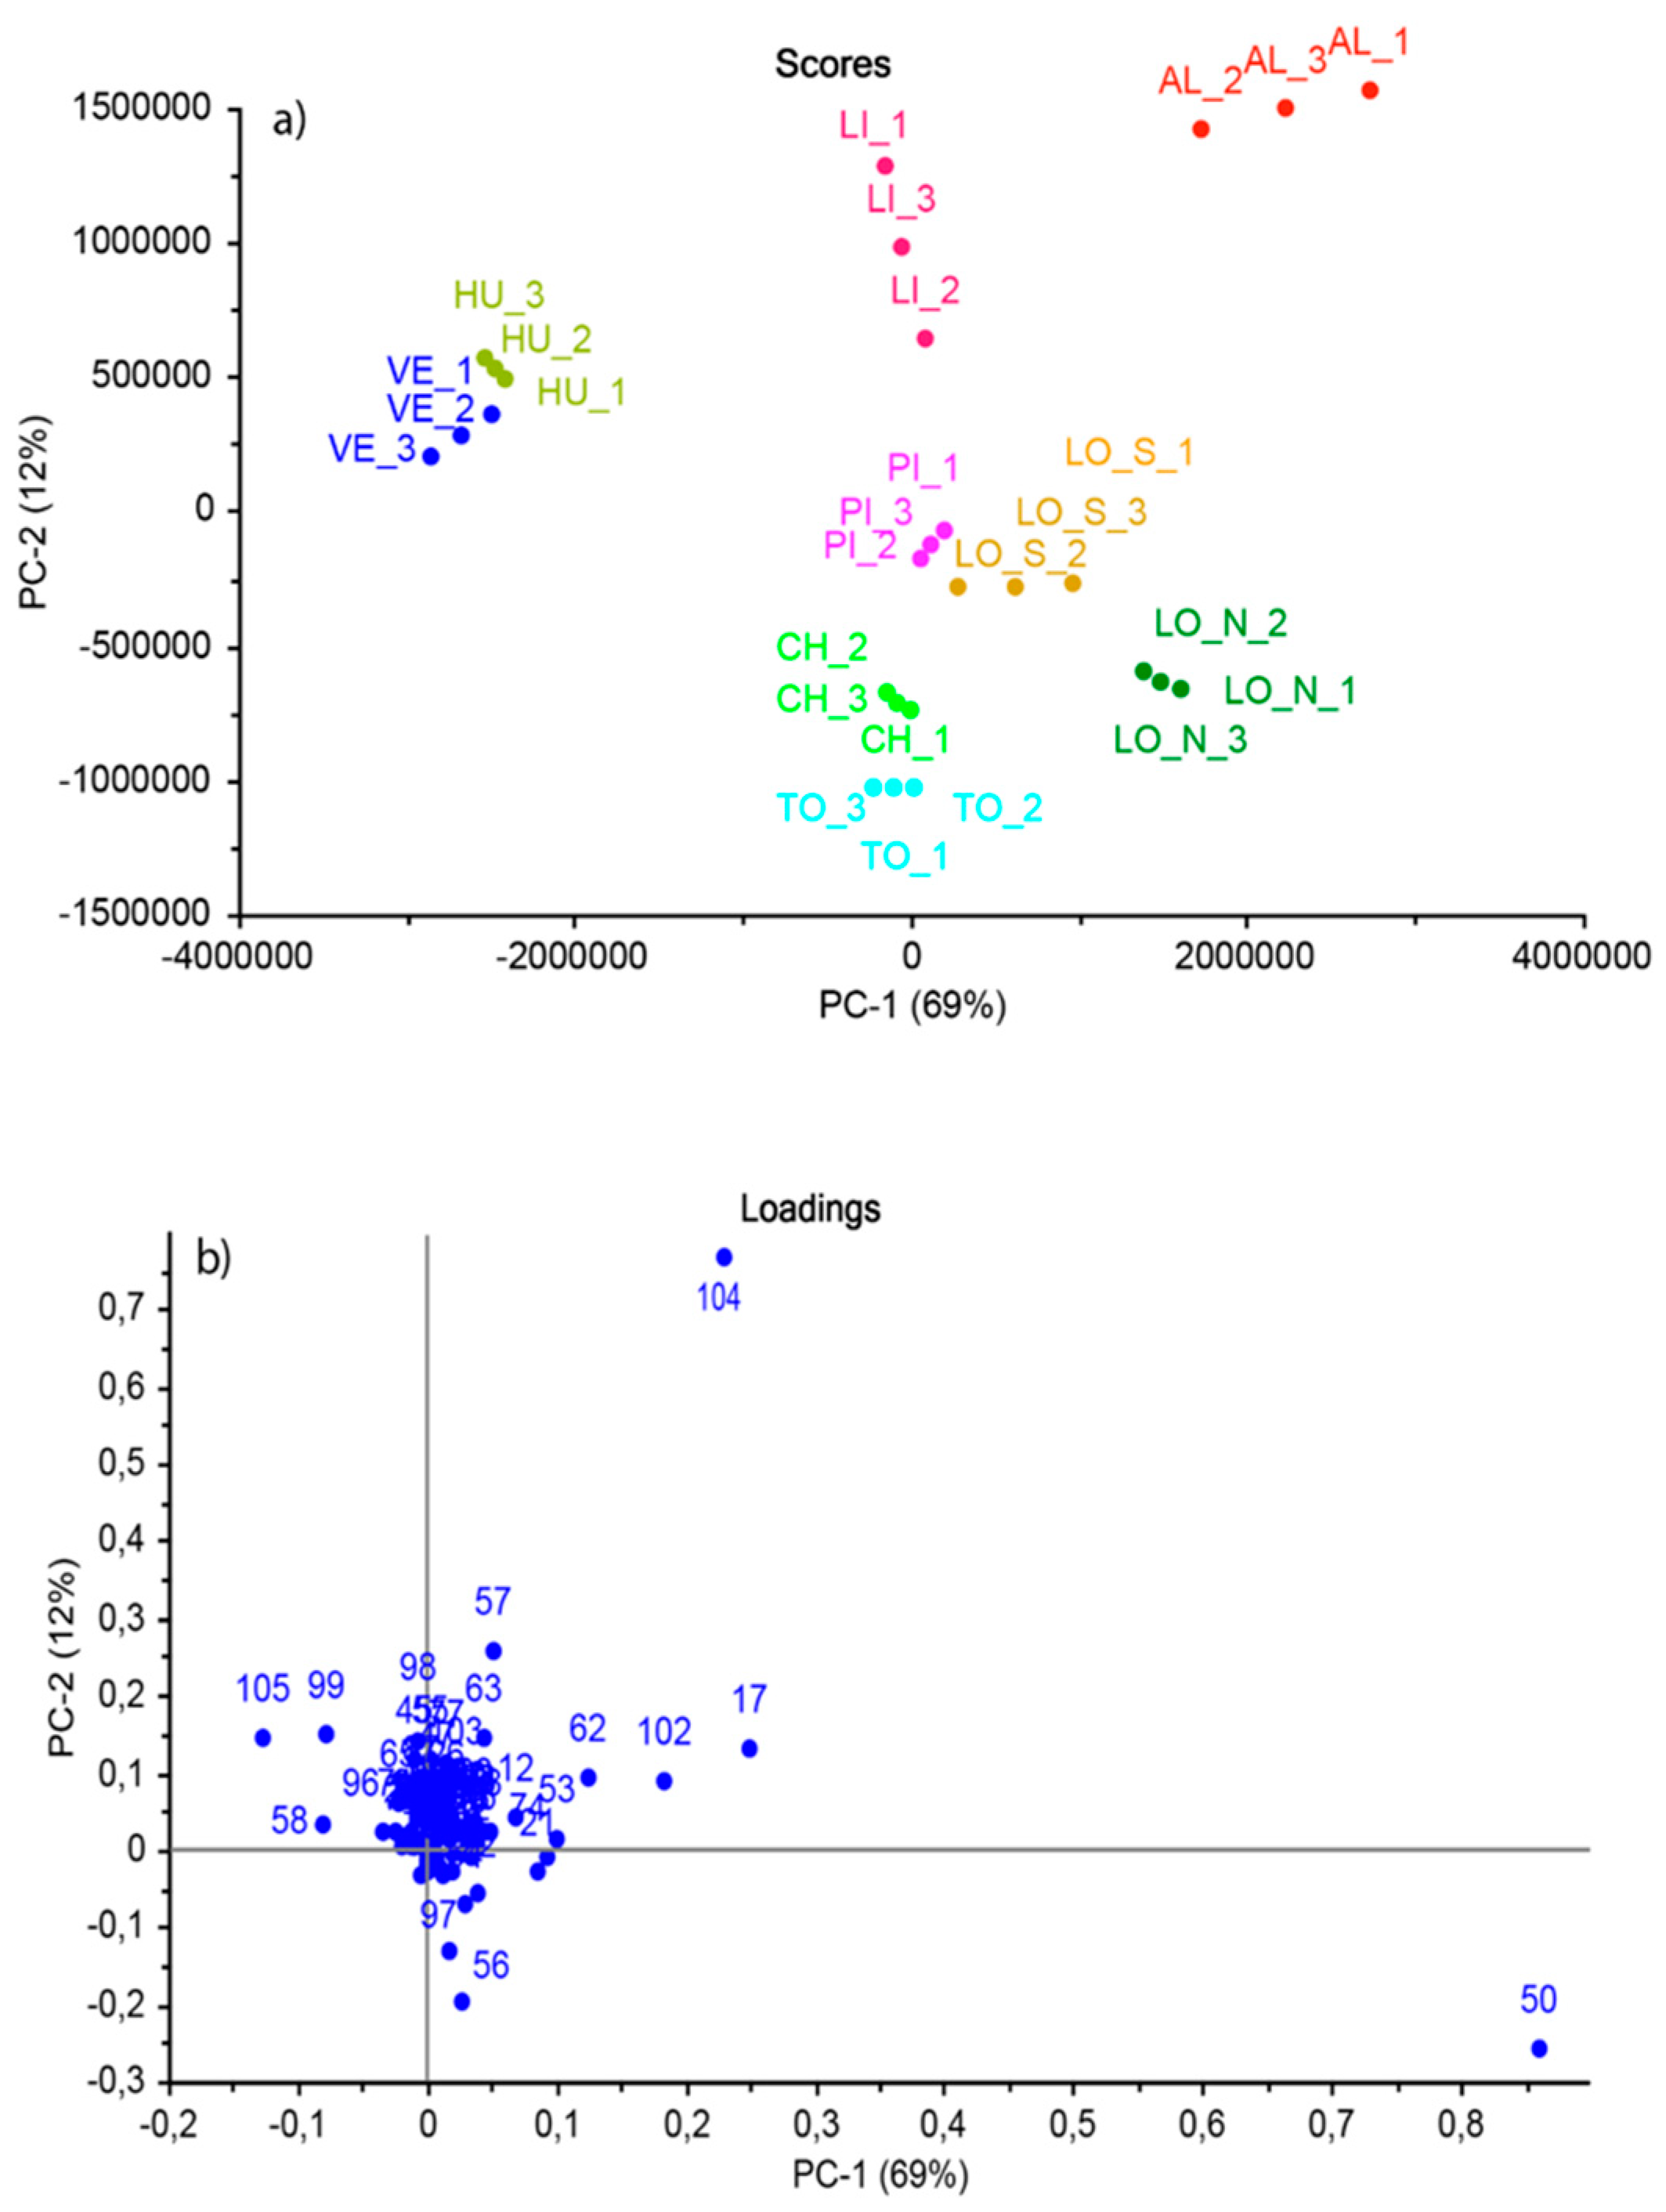
3.2. Qualitative Analysis
3.3. Antioxidant Activity and Total Phenolic Content
Antioxidant Markers
4. Conclusions
Author Contributions
Funding
Institutional Review Board Statement
Informed Consent Statement
Data Availability Statement
Acknowledgments
Conflicts of Interest
Appendix A

| No | tR (min) | Compound * | CAS | Structure | KI |
|---|---|---|---|---|---|
| 1 | 6.58 | 4-ethyldecane | 1636-44-8 |  | 1092 |
| 2 | 7.77 | 5-methylundecane | 1632-70-8 |  | 1144 |
| 3 | 7.81 | 2-butyl-1-octanol | 3913-02-8 |  | 1146 |
| 4 | 7.81 | carbonic acid decyl nonyl ester | 1000383-15-8 |  | 1146 |
| 5 | 7.90 | docosyl octyl ether | 1000406-38-9 |  | 1150 |
| 6 | 7.91 | hexyl pentyl ether | 32357-83-8 |  | 1150 |
| 7 | 8.03 | 3,8-dimethyldecane | 17312-55-9 |  | 1155 |
| 8 | 8.031 | 2-propyl-1-heptanol | 10042-59-8 |  | 1156 |
| 9 | 8.95 | N,N-bis(2,4-dimethylphenyl)-acetamide | 52812-80-3 |  | 1197 |
| 10 | 8.95 | lysergamide | 478-94-4 |  | 1197 |
| 11 | 9.73 | 1-iodo-dodecane | 4292-19-7 |  | 1238 |
| 12 | 10.29 | dodecane | 112-40-3 |  | 1268 |
| 13 | 10.47 | 3,8-dimethyl-undecane | 17301-30-3 |  | 1278 |
| 14 | 10.59 | 4-ethyl-undecane | 17312-59-3 |  | 1285 |
| 15 | 10.71 | 2,3,7-trimethyl-decane | 62238-13-5 |  | 1291 |
| 16 | 10.84 | 5-ethyl-5-methyl-decane | 17312-74-2 |  | 1298 |
| 17 | 11.04 | 2,3,6-trimethyl-decane | 62238-12-4 |  | 1311 |
| 18 | 11.18 | 5-ethyl-undecane | 17453-94-0 |  | 1319 |
| 19 | 11.29 | 3,5-dimethyl-piperidine | 35794-11-7 |  | 1326 |
| 20 | 11.41 | 4,8-dimethyl-undecane | 17301-33-6 |  | 1334 |
| 21 | 11.97 | tridecane | 629-50-5 |  | 1369 |
| 22 | 12.13 | docosyl nonyl ether | 1000406-37-9 |  | 1379 |
| 23 | 12.33 | 11-methyldodecanol | 85763-57-1 |  | 1392 |
| 24 | 12.33 | 6-ethyl-3-octyl ester chloroacetic acid | 1000279-99-8 |  | 1392 |
| 25 | 12.33 | 2-heptyl-3-methyloxirane | 54125-39-2 |  | 1392 |
| 26 | 12.33 | 2-hexyl-1-decanol | 2425-77-6 |  | 1392 |
| 27 | 12.34 | decyl ether | 2456-28-2 |  | 1392 |
| 28 | 12.42 | 1,1,4-trimethyl-cyclohexane | 7094-27-1 |  | 1398 |
| 29 | 12.47 | n-tridecan-1-ol | 112-70-9 |  | 1401 |
| 30 | 12.47 | 1-hexadecanol | 36653-82-4 |  | 1401 |
| 31 | 12.59 | 1,2,4-trimethyl-cyclohexane | 2234-75-5 |  | 1410 |
| 32 | 12.59 | 6-ethyl-3-octyl ester trichloroacetic acid | 147-93-3 |  | 1410 |
| 33 | 12.59 | 1,1-dimethyl-2-propyl-cyclohexane | 81983-71-3 |  | 1410 |
| 34 | 12.60 | hexyl octyl ether | 17071-54-4 |  | 1410 |
| 35 | 12.60 | diedecyl ester decanedioic acid | 2432-89-5 |  | 1410 |
| 36 | 12.61 | 6-ethyloct-3-yl ethyl ester oxalic acid | 1000309-33-9 |  | 1411 |
| 37 | 12.81 | 6-methyl-5-hepten-2-one | 100-93-0 |  | 1426 |
| 38 | 12.82 | 3-(3,4-dimethoxyphenyl)-6-nitro-coumarin | 331949-94-1 |  | 1426 |
| 39 | 12.81 | 2-isopropyl-5-methyl-1-heptanol | 91337-07-4 |  | 1426 |
| 40 | 12.91 | 2-methyl-tridecane | 1560-96-9 |  | 1433 |
| 41 | 12.98 | decyl undecyl ester carbonic acid | 1000383-16-0 |  | 1439 |
| 42 | 13.09 | 1-iodo-tetradecane | 19218-94-1 |  | 1446 |
| 43 | 13.24 | 2,2,3,3,5,6,6-heptamethyl-heptane | 7225-67-4 |  | 1458 |
| 44 | 13.46 | decyl dodecyl ester carbonic acid | 1000383-16-1 |  | 1474 |
| 45 | 13.58 | tetradecane | 629-59-4 |  | 1482 |
| 46 | 13.67 | eicosyl nonyl ether | 1000406-37-8 |  | 1489 |
| 47 | 13.80 | 2-tetradecyl ester methoxyacetic acid | 1000282-04-8 |  | 1499 |
| 48 | 13.92 | heptyl isobutyl ketone | 19594-40-2 |  | 1508 |
| 49 | 13.92 | 2-methyl-tetratetradecane | 1560-95-8 |  | 1508 |
| 50 | 14.10 | 1,3-bis(1,1-dimethylethyl)-benzene | 1014-60-4 |  | 1521 |
| 51 | 14.32 | p-cymene | 99-87-6 |  | 1537 |
| 52 | 14.56 | pentadecane | 629-62-9 |  | 1556 |
| 53 | 14.74 | 2,4-heptadienal | 4313-03-5 |  | 1569 |
| 54 | 14.75 | 1,3-dimethyl-1h-pyrazole | 694-48-4 |  | 1570 |
| 55 | 14.76 | 2-ethyl-3-methylcyclopentene | 19780-56-4 |  | 1570 |
| 56 | 14.81 | 1-ethyl-cyclohexene | 1453-24-3 |  | 1574 |
| 57 | 14.81 | 3-ethyl-1,4-hexadiene | 2080-89-9 |  | 1575 |
| 58 | 15.17 | benzoic acid | 3782-84-1 |  | 1601 |
| 59 | 15.28 | 2-octyl-1-decanol | 45235-48-1 |  | 1611 |
| 60 | 15.97 | 2-methyl-pentadecane | 1560-93-6 |  | 1667 |
| 61 | 16.10 | tetradecyl vinyl ester carbonic acid | 1000382-54-5 |  | 1678 |
| 62 | 16.54 | hexadecane | 544-76-3 |  | 1715 |
| 63 | 16.74 | 2,6,6-trimethyl-1-cyclohexene-1-carboxaldehyde | 432-25-7 |  | 1731 |
| 64 | 16.79 | beta-cyclocitral | 432-26-7 |  | 1738 |
| 65 | 16.84 | 7-methyl-pentadecane | 6165-40-8 |  | 1743 |
| 66 | 17.05 | sarcocapnidine | 87069-33-8 |  | 1762 |
| 67 | 17.68 | 3-methylbut-3-enyl undecyl ester fumaric acid | 1000348-91-0 |  | 1819 |
| 68 | 17.68 | 3-methylbut-3-enyl pentadecyl ester fumaric acid | 1000348-91-4 |  | 1819 |
| 69 | 17.68 | octadecanoic acid | 57-11-4 |  | 1819 |
| 70 | 18.22 | 2-methylene cyclobutanone | 17714-43-1 |  | 1868 |
| 71 | 18.31 | naphthalene | 91-20-3 |  | 1876 |
| 72 | 18.57 | isobutyl tetradecyl ether | 1000406-32-7 |  | 1899 |
| 73 | 18.72 | isopropyl tetradecyl ether | 1000406-34-0 |  | 1913 |
| 74 | 19.13 | 2,4-dimethylbenzaldehyde | 15764-16-6 |  | 1955 |
| 75 | 19.13 | benzaldehyde | 53951-50-1 |  | 1955 |
| 76 | 19.18 | 3,5-dimethylbenzaldehyde | 5779-95-3 |  | 1960 |
| 77 | 19.34 | geranyl acetone isomer 1 | 689-67-8 |  | 1976 |
| 78 | 19.35 | geranyl acetone isomer 2 | 105-87-3 |  | 1977 |
| 79 | 19.64 | benzyl alcohol | 100-51-6 |  | 2006 |
| 80 | 19.72 | cis-2-(1-pentenyl)furan | 70424-13-4 | 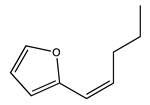 | 2013 |
| 81 | 19.93 | tricyclo[4,4,0,0(2,8)]decane | 49700-59-6 |  | 2034 |
| 82 | 19.93 | neophytadiene | 504-96-1 | 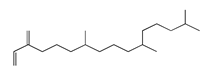 | 2034 |
| 83 | 19.93 | 5-methyleneoctahydro-1H-indene | 1000152-00-6 | 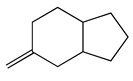 | 2034 |
| 84 | 19.93 | bicyclo[3,3,1]non-2-en-9-one | 4844-11-5 |  | 2035 |
| 85 | 20.24 | cyclohexanol | 55000-30-1 |  | 2066 |
| 86 | 20.35 | 3-buten-2-one | 79-77-6 |  | 2077 |
| 87 | 20.92 | β-ionone | 23267-57-4 |  | 2134 |
| 88 | 20.97 | phenol | 108-95-2 |  | 2141 |
| 89 | 21.04 | [(2-methylpropyl)thio]-benzene | 13307-61-4 |  | 2148 |
| 90 | 21.05 | 2-isopropyl-5,5-dimethylcyclohex-2-enone | 1000191-19-3 |  | 2149 |
| 91 | 21.53 | glycerol 1,2-diacetate | 102-62-5 |  | 2200 |
| 92 | 21.75 | 1-methylethyl benzoate | 939-48-0 | 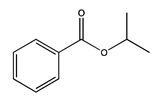 | 2225 |
| 93 | 22.01 | 6,10,14-trimethyl-2-pentadecanone | 502-69-2 | 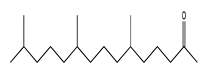 | 2254 |
| 94 | 22.02 | 6-methyl-2-tridecanone | 73105-73-4 |  | 2255 |
| 95 | 22.02 | 6,10-dimethyl-2-undecanone | 1604-34-2 |  | 2255 |
| 96 | 22.058 | 3-furanacetic acid | 39212-21-0 |  | 2259 |
| 97 | 22.54 | 4-(1-hydroxyallyl)-2-methoxyphenol | 112465-50-6 |  | 2313 |
| 98 | 22.54 | 2-propanone | 2503-46-0 |  | 2313 |
| 99 | 22.54 | 5-pentyl-1,3-benzenediol | 500-66-3 |  | 2313 |
| 100 | 22.72 | 2-decyl dodecyl ester fumaric acid | 1000348-59-3 |  | 2334 |
| 101 | 23.66 | dihydro methyl jasmonate | 24851-98-7 |  | 2437 |
| 102 | 23.73 | 2,4-di-tert-butylphenol | 96-76-4 |  | 2444 |
| 103 | 24.59 | 1,2-benzenedicarboxilic acid | 88-99-3 |  | 2527 |
| 104 | 24.68 | 5,6,7,7a-tetrahydro-4,4,7a-trimethyl-2(4h)-benzofuranone | 15356-74-8 |  | 2534 |
| 105 | 24.88 | mequinol | 150-76-5 | 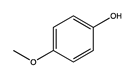 | 2551 |
| 106 | 26.26 | butyl octyl phthalate | 84-78-6 |  | 2654 |
| 107 | 26.76 | 2-methylbenzathiazole | 120-75-2 |  | 2687 |
| No | Compound * | Class | AL | CH | HU | LO_S | LO_N | LI | PI | TO | VE |
|---|---|---|---|---|---|---|---|---|---|---|---|
| 1 | 4-ethyldecane | alkane | • | • | • | • | • | ||||
| 2 | 5-methylundecane | alkane | • | • | |||||||
| 3 | 2-butyl-1-octanol | alcohol | • | • | • | ||||||
| 4 | decyl nonyl ester carbonic acid | ester | • | ||||||||
| 5 | docosyl octyl ether | ether | • | • | • | • | • | ||||
| 6 | hexyl pentyl ether | ether | • | ||||||||
| 7 | 3,8-dimethyl-decane | alkane | • | • | • | ||||||
| 8 | 2-propyl-1-heptanol | alcohol | • | ||||||||
| 9 | N,N-bis(2,4-dimethyl phenyl)-acetamide | amide | • | ||||||||
| 10 | lysergamide | amide | • | • | • | ||||||
| 11 | 1-iodo-dodecane | alkane | • | • | • | • | |||||
| 12 | dodecane | alkane | • | • | • | • | • | • | • | ||
| 13 | 3,8-dimethyl-undecane | alkane | • | • | • | • | • | • | |||
| 14 | 4-ethyl-undecane | alkane | • | • | • | • | • | • | • | ||
| 15 | 2,3,7-trimethyl-decane | alkane | • | • | • | • | • | • | |||
| 16 | 5-ethyl-5-methyl-decane | alkane | • | • | • | • | • | • | • | ||
| 17 | 2,3,6-trimethyl-decane | alkane | • | • | • | • | • | • | • | • | |
| 18 | 5-ethyl-undecane | alkane | • | • | • | • | • | • | • | ||
| 19 | 3,5-dimethyl-piperidine | amine | • | • | • | • | • | • | • | ||
| 20 | 4,8-dimethyl-undecane | alkane | • | • | • | • | • | • | • | ||
| 21 | tridecane | alkane | • | • | • | • | • | • | |||
| 22 | docosyl nonyl ether | ether | • | • | • | • | • | ||||
| 23 | 11-methyldodecanol | alcohol | • | ||||||||
| 24 | 6-ethyl-3-octyl ester chloroacetic acid | ester | • | • | • | • | |||||
| 25 | 2-heptyl-3-methyloxirane | ether | • | ||||||||
| 26 | 2-hexyl-1-decanol | alcohol | • | • | • | ||||||
| 27 | decyl ether | ether | |||||||||
| 28 | 1,1,4-trimethyl-cyclohexane | alkane | • | ||||||||
| 29 | N-tridecan-1-ol | alcohol | • | • | |||||||
| 30 | 1-hexadecanol | alcohol | • | • | |||||||
| 31 | 1,2,4-trimethyl-cyclohexane | alkane | • | ||||||||
| 32 | 6-ethyl-3-octyl ester trichloroacetic acid | ester | • | ||||||||
| 33 | 1,1-dimethyl-2-propyl-cyclohexane | alkane | • | • | |||||||
| 34 | hexyl octyl ether | ether | |||||||||
| 35 | diedecyl ester decanedioic acid | ester | • | ||||||||
| 36 | 6-ethyloct-3-yl ethyl ester oxalic acid | ester | • | • | • | ||||||
| 37 | 6-methyl-5-hepten-2-one | ketone | • | • | • | • | |||||
| 38 | 3-(3,4-dimethoxy phenyl)-6-nitro-coumarin | aromatic | • | • | |||||||
| 39 | 2-isopropyl-5-methyl-1-heptanol | alcohol | • | ||||||||
| 40 | 2-methyl-tridecane | alkane | • | • | • | ||||||
| 41 | decyl undecyl ester carbonic acid | ester | • | ||||||||
| 42 | 1-iodo-tetradecane | alkane | • | • | • | • | • | • | • | ||
| 43 | 2,2,3,3,5,6,6-heptamethyl-heptane | alkane | • | • | • | • | • | ||||
| 44 | decyl dodecyl ester carbonic acid | ester | • | ||||||||
| 45 | tetradecane | alkane | • | • | • | • | • | • | • | • | • |
| 46 | eicosyl nonyl ether | ether | • | • | • | • | • | • | • | • | |
| 47 | 2-tetradecyl ester methoxyacetic acid | ester | • | • | • | • | • | • | • | • | |
| 48 | heptyl isobutyl ketone | ketone | • | • | • | • | • | • | • | • | |
| 49 | 2-methyl-tetratetradecane | alkane | • | ||||||||
| 50 | 1,3-bis(1,1-dimethylethyl)-benzene | aromatic | • | • | • | • | • | • | • | • | • |
| 51 | p-cymene | aromatic | • | ||||||||
| 52 | pentadecane | alkane | • | • | • | • | • | • | • | ||
| 53 | 2,4-heptadienal | aldehyde | • | • | • | • | • | ||||
| 54 | 1,3-dimethyl-1h-pyrazole | amine | • | ||||||||
| 55 | 2-ethyl-3-methylcyclopentene | alkane | • | ||||||||
| 56 | 1-ethyl-cyclohexene | alkane | • | • | • | ||||||
| 57 | 3-ethyl-1,4-hexadiene | diene | • | • | • | • | |||||
| 58 | benzoic acid | carboxylic acid | • | • | |||||||
| 59 | 2-octyl-1-decanol | alcohol | • | ||||||||
| 60 | 2-methyl-pentadecane | alkane | • | • | |||||||
| 61 | tetradecyl vinyl ester carbonic acid | ester | • | ||||||||
| 62 | hexadecane | alkane | • | • | • | • | • | • | • | • | |
| 63 | 2,6,6-trimethyl-1-cyclohexene-1-carboxaldehyde | aldehyde | • | • | • | • | |||||
| 64 | beta-cyclocitral | aldehyde | • | • | • | • | • | ||||
| 65 | 7-methyl-pentadecane | alkane | • | • | |||||||
| 66 | sarcocapnidine | cyclic | • | • | • | ||||||
| 67 | 3-methylbut-3-enyl undecyl ester fumaric acid | ester | • | ||||||||
| 68 | 3-methylbut-3-enyl pentadecyl ester fumaric acid | ester | |||||||||
| 69 | octadecanoic acid | carboxylic acid | • | ||||||||
| 70 | 2-methylene cyclobutanone | alkane | • | ||||||||
| 71 | naphthalene | aromatic | • | • | |||||||
| 72 | isobutyl tetradecyl ether | ether | • | ||||||||
| 73 | isopropyl tetradecyl ether | ether | • | • | |||||||
| 74 | 2,4-dimethyl benzaldehyde | aldehyde | • | • | • | • | • | ||||
| 75 | benzaldehyde | aldehyde | • | • | |||||||
| 76 | 3,5-dimethyl benzaldehyde | aldehyde | • | • | |||||||
| 77 | geranyl acetone isomer 1 | ketone | • | • | • | • | • | ||||
| 78 | geranyl acetone isomer 2 | ketone | • | • | • | ||||||
| 79 | benzyl alcohol | alcohol | • | • | • | • | |||||
| 80 | cis-2-(1-pentenyl) furan | ether | • | ||||||||
| 81 | tricyclo[4,4,0,0(2,8)]decane | alkane | • | ||||||||
| 82 | neophytadiene | diene | • | • | |||||||
| 83 | 5-methylene octahydro-1H-indene | alkane | • | • | |||||||
| 84 | bicyclo[3,3,1]non-2-en-9-one | ketone | • | ||||||||
| 85 | cyclohexanol | alcohol | • | ||||||||
| 86 | 3-buten-2-one | ketone | • | • | • | • | • | • | • | • | • |
| 87 | β-ionone | ketone | • | • | • | ||||||
| 88 | phenol | phenol | • | ||||||||
| 89 | [(2-methylpropyl) thio]-benzene | aromatic | • | ||||||||
| 90 | 2-isopropyl-5,5-dimethylcyclohex-2-enone | ketone | • | ||||||||
| 91 | glycerol 1,2-diacetate | ester | • | ||||||||
| 92 | 1-methylethyl benzoate | ester | • | ||||||||
| 93 | 6,10,14-trimethyl-2-pentadecanone | ketone | • | • | |||||||
| 94 | 6-methyl-2-tridecanone | ketone | • | ||||||||
| 95 | 6,10-dimethyl-2-undecanone | ketone | • | • | • | • | • | ||||
| 96 | 3-furanacetic acid | carboxylic acid | • | ||||||||
| 97 | 4-(1-hydroxyallyl)-2-methoxyphenol | phenol | • | • | • | • | • | ||||
| 98 | 2-propanone | ketone | • | • | |||||||
| 99 | 5-pentyl-1,3-benzenediol | alcohol | • | • | |||||||
| 100 | 2-decyl dodecyl ester fumaric acid | ester | • | ||||||||
| 101 | dihydro methyl jasmonate | ester | • | • | • | ||||||
| 102 | 2,4-di-tert-butylphenol | phenol | • | • | • | • | • | • | • | • | |
| 103 | 1,2-benzene dicarboxylic acid | carboxylic acid | • | • | • | • | • | ||||
| 104 | 5,6,7,7a-tetrahydro-4,4,7a-trimethyl-2(4h)-benzofuranone | terpene | • | • | • | • | • | • | |||
| 105 | mequinol | phenol | • | • | • | ||||||
| 106 | butyl octyl phthalate | ester | • | • | • | ||||||
| 107 | 2-methylbenza thiazole | thiazole | • |
References
- Amarowicz, R.; Pegg, R.B.; Rahimi-Moghaddam, P.; Barl, B.; Weil, J.A. Free-radical scavenging capacity and antioxidant activity of selected plant species from the Canadian prairies. Food Chem. 2004, 84, 551–562. [Google Scholar] [CrossRef]
- Asensio, E.; Vitales, D.; Pérez, I.; Peralba, L.; Viruel, J.; Montaner, C.; Vallès, J.; Garnatje, T.; Sales, E. Phenolic compounds content and genetic diversity at population level across the natural distribution range of bearberry (Arctostaphylos uva-ursi, ericaceae) in the iberian peninsula. Plants 2020, 9, 1250. [Google Scholar] [CrossRef]
- Cui, T.; Nakamura, K.; Ma, L.; Li, J.Z.; Kayahara, H. Analyses of arbutin and chlorogenic acid, the major phenolic constituents in Oriental pear. J. Agric. Food Chem. 2005, 53, 3882–3887. [Google Scholar] [CrossRef]
- Panusa, A.; Petrucci, R.; Marrosu, G.; Multari, G.; Gallo, F.R. UHPLC-PDA-ESI-TOF/MS metabolic profiling of Arctostaphylos pungens and Arctostaphylos uva-ursi. A comparative study of phenolic compounds from leaf methanolic extracts. Phytochemistry 2015, 115, 79–88. [Google Scholar] [CrossRef]
- Dykes, G.A.; Amarowicz, R.; Pegg, R.B. Enhancement of nisin antibacterial activity by a bearberry (Arctostaphylos uva-ursi) leaf extract. Food Microbiol. 2003, 20, 211–216. [Google Scholar] [CrossRef]
- Samoilova, Z.; Smirnova, G.; Muzyka, N.; Oktyabrsky, O. Medicinal plant extracts variously modulate susceptibility of Escherichia coli to different antibiotics. Microbiol. Res. 2014, 169, 307–313. [Google Scholar] [CrossRef]
- Cybulska, P.; Thakur, S.D.; Foster, B.C.; Scott, I.M.; Leduc, R.I.; Arnason, J.T.; Dillon, J.A.R. Extracts of canadian first nations medicinal plants, used as natural products, inhibit neisseria gonorrhoeae isolates with different antibiotic resistance profiles. Sex. Transm. Dis. 2011, 38, 667–671. [Google Scholar] [CrossRef]
- Jurica, K.; Gobin, I.; Kremer, D.; Čepo, D.V.; Grubešić, R.J.; Karačonji, I.B.; Kosalec, I. Arbutin and its metabolite hydroquinone as the main factors in the antimicrobial effect of strawberry tree (Arbutus unedo L.) leaves. J. Herb. Med. 2017, 8, 17–23. [Google Scholar] [CrossRef]
- Naczk, M.; Pegg, R.B.; Amarowicz, R. Protein-precipitating capacity of bearberry-leaf (Arctostaphylos uva-ursi L. Sprengel) polyphenolics. Food Chem. 2011, 124, 1507–1513. [Google Scholar] [CrossRef]
- Pavloviç, D.R.; Brankoviç, S.; Kovačeviç, N.; Kitiç, D.; Veljkoviç, S. Comparative study of spasmolytic properties, antioxidant activity and phenolic content of arbutus unedo from Montenegro and Greece. Phyther. Res. 2011, 25, 749–754. [Google Scholar] [CrossRef]
- Cobaleda-Velasco, M.; Alanis-Bañuelos, R.E.; Almaraz-Abarca, N.; Rojas-López, M.; González-Valdez, L.S.; Ávila-Reyes, J.A.; Rodrigo, S. Phenolic profiles and antioxidant properties of Physalis angulata L. as quality indicators. J. Pharm. Pharmacogn. Res. 2017, 5, 114–128. [Google Scholar]
- Colon, M.; Nerin, C. Role of catechins in the antioxidant capacity of an active film containing green tea, green coffee, and grapefruit extracts. J. Agric. Food Chem. 2012, 60, 9842–9849. [Google Scholar] [CrossRef]
- Huang, D.; Boxin, O.U.; Prior, R.L. The chemistry behind antioxidant capacity assays. J. Agric. Food Chem. 2005, 53, 1841–1856. [Google Scholar] [CrossRef]
- Prior, R.L.; Wu, X.; Schaich, K. Standardized methods for the determination of antioxidant capacity and phenolics in foods and dietary supplements. J. Agric. Food Chem. 2005, 53, 4290–4302. [Google Scholar] [CrossRef]
- Pyrzynska, K.; Pȩkal, A. Application of free radical diphenylpicrylhydrazyl (DPPH) to estimate the antioxidant capacity of food samples. Anal. Methods 2013, 5, 4288–4295. [Google Scholar] [CrossRef]
- Carocho, M.; Morales, P.; Ferreira, I.C.F.R. Antioxidants: Reviewing the chemistry, food applications, legislation and role as preservatives. Trends Food Sci. Technol. 2018, 71, 107–120. [Google Scholar] [CrossRef] [Green Version]
- Carocho, M.; Ferreira, I.C.F.R. A review on antioxidants, prooxidants and related controversy: Natural and synthetic compounds, screening and analysis methodologies and future perspectives. Food Chem. Toxicol. 2013, 51, 15–25. [Google Scholar] [CrossRef]
- Altemimi, A.; Lakhssassi, N.; Baharlouei, A.; Watson, D.G.; Lightfoot, D.A. Phytochemicals: Extraction, isolation, and identification of bioactive compounds from plant extracts. Plants 2017, 6, 42. [Google Scholar] [CrossRef]
- Yanishlieva-Maslarova, N.V.; Heinonen, I.M. 10-Sources of natural antioxidants: Vegetables, fruits, herbs, spices and teas. In Woodhead Publishing Series in Food Science, Technology and Nutrition; Pokorny, J., Yanishlieva, N., Gordon, M., Eds.; Woodhead Publishing: Sawston, UK, 2001; pp. 210–263. ISBN 978-1-85573-463-0. [Google Scholar]
- Pokorný, J. Are natural antioxidants better–and safer–than synthetic antioxidants? Eur. J. Lipid Sci. Technol. 2007, 109, 629–642. [Google Scholar] [CrossRef]
- Wrona, M.; Blasco, S.; Becerril, R.; Nerin, C.; Sales, E.; Asensio, E. Antioxidant and antimicrobial markers by UPLC®–ESI-Q-TOF-MSE of a new multilayer active packaging based on Arctostaphylos uva-ursi. Talanta 2019, 196, 498–509. [Google Scholar] [CrossRef]
- Song, X.C.; Canellas, E.; Asensio, E.; Nerín, C. Predicting the antioxidant capacity and total phenolic content of bearberry leaves by data fusion of UV–Vis spectroscopy and UHPLC/Q-TOF-MS. Talanta 2020, 213, 120831. [Google Scholar] [CrossRef]
- MR WATT SRL MR WATT Make Your Own Energy. Available online: https://www.mrwatt.eu/es/content/radiacion-solar-en-espana (accessed on 28 February 2022).
- Djebari, S.; Wrona, M.; Boudria, A.; Salafranca, J.; Nerin, C.; Bedjaoui, K.; Madani, K. Study of bioactive volatile compounds from different parts of Pistacia lentiscus L. extracts and their antioxidant and antibacterial activities for new active packaging application. Food Control 2021, 120, 107514. [Google Scholar] [CrossRef]
- Gavril, G.L.; Wrona, M.; Bertella, A.; Świeca, M.; Râpă, M.; Salafranca, J.; Nerín, C. Influence of medicinal and aromatic plants into risk assessment of a new bioactive packaging based on polylactic acid (PLA). Food Chem. Toxicol. 2019, 132, 110662. [Google Scholar] [CrossRef] [PubMed]
- Kaanin-Boudraa, G.; Brahmi, F.; Wrona, M.; Nerín, C.; Hadjal, S.; Madani, K.; Boulekbache-Makhlouf, L. Citrus × paradisi essential oil as a promising agent for margarine storage stability: Composition and antioxidant capacity. J. Food Process. Preserv. 2021, 45, e15374. [Google Scholar] [CrossRef]
- Bentayeb, K.; Vera, P.; Rubio, C.; Nerin, C. Adaptation of the ORAC assay to the common laboratory equipment and subsequent application to antioxidant plastic films. Anal. Bioanal. Chem. 2009, 394, 903–910. [Google Scholar] [CrossRef]
- Skowyra, M.; Falguera, V.; Azman, N.A.M.; Segovia, F.; Almajano, M.P. The effect of perilla frutescens extract on the oxidative stability of model food emulsions. Antioxidants 2014, 3, 38–54. [Google Scholar] [CrossRef] [Green Version]
- Pascoal, A.; Quirantes-Piné, R.; Fernando, A.L.; Alexopoulou, E.; Segura-Carretero, A. Phenolic composition and antioxidant activity of kenaf leaves. Ind. Crop. Prod. 2015, 78, 116–123. [Google Scholar] [CrossRef]
- Spadaccino, G.; Frabboni, L.; Petruzzi, F.; Disciglio, G.; Mentana, A.; Nardiello, D.; Quinto, M. Essential oil characterization of Prunus spinosa L., Salvia officinalis L., Eucalyptus globulus L., Melissa officinalis L. and Mentha x piperita L. by a volatolomic approach. J. Pharm. Biomed. Anal. 2021, 202, 114167. [Google Scholar] [CrossRef]
- Cozzolino, R.; Pace, B.; Cefola, M.; Martignetti, A.; Stocchero, M.; Fratianni, F.; Nazzaro, F.; De Giulio, B. Assessment of volatile profile as potential marker of chilling injury of basil leaves during postharvest storage. Food Chem. 2016, 213, 361–368. [Google Scholar] [CrossRef]
- Song, X.C.; Canellas, E.; Wrona, M.; Becerril, R.; Nerin, C. Comparison of two antioxidant packaging based on rosemary oleoresin and green tea extract coated on polyethylene terephthalate for extending the shelf life of minced pork meat. Food Packag. Shelf Life 2020, 26, 100588. [Google Scholar] [CrossRef]
- Silva, C.L.; Câmara, J.S. Profiling of volatiles in the leaves of Lamiaceae species based on headspace solid phase microextraction and mass spectrometry. Food Res. Int. 2013, 51, 378–387. [Google Scholar] [CrossRef]
- Linker, R.A.; Lee, D.H.; Ryan, S.; Van Dam, A.M.; Conrad, R.; Bista, P.; Zeng, W.; Hronowsky, X.; Buko, A.; Chollate, S.; et al. Fumaric acid esters exert neuroprotective effects in neuroinflammation via activation of the Nrf2 antioxidant pathway. Brain 2011, 134, 678–692. [Google Scholar] [CrossRef] [PubMed] [Green Version]
- Denisov, E.T.; Afanas’Ev, I.B. Oxidation and Antioxidants in Organic Chemistry and Biology, 1st ed.; CRC Press: Boca Raton, FL, USA, 2005; ISBN 9781420030853. [Google Scholar]
- Wang, K.; Jin, P.; Cao, S.; Shang, H.; Yang, Z.; Zheng, Y. Methyl jasmonate reduces decay and enhances antioxidant capacity in Chinese bayberries. J. Agric. Food Chem. 2009, 57, 5809–5815. [Google Scholar] [CrossRef] [PubMed]
- Francenia Santos-Sánchez, N.; Salas-Coronado, R.; Villanueva-Cañongo, C.; Hernández-Carlos, B. Antioxidant Compounds and Their Antioxidant Mechanism. In Antioxidants; Shalaby, E., Ed.; IntechOpen: London, UK, 2019; pp. 1–28. [Google Scholar]
- Wang, S.; Meckling, K.A.; Marcone, M.F.; Kakuda, Y.; Tsao, R. Synergistic, additive, and antagonistic effects of food mixtures on total antioxidant capacities. J. Agric. Food Chem. 2011, 59, 960–968. [Google Scholar] [CrossRef]


| Sample Name | Harvest Area | Province | Altitude (m) | Harvest Time | Solar Radiation (MJ/m2) |
|---|---|---|---|---|---|
| AL | Albarracín | Teruel | 1337 | September | 492 |
| CH | Chelva | Valencia | 984 | September | 484 |
| HU | Huétor | Granada | 1354 | November | 509 |
| LO_S | Loarre | Huesca | 1401 | September | 491 |
| LO_N | Loarre | Huesca | 1401 | November | 236 |
| LI | Lierta | Huesca | 590 | September | 491 |
| PI | Pina de Montalgrao | Castellón | 1278 | September | 483 |
| TO | El Toro | Castellón | 999 | September | 483 |
| VE | Los Vélez | Almería | 1369 | September | 536 |
| Number | Compound |
|---|---|
| 1 | 4-Ethyldecane |
| 2 | Docosyl octyl ether |
| 3 | 3,8-Dimethyldecane |
| 4 | Lysergamide |
| 5 | 1-Iodododecane |
| 6 | Dodecane |
| 7 | 3,8-Dimethylundecane |
| 8 | 4-Ethylundecane |
| 9 | 2,3,7-Trimethyldecane |
| 10 | 5-Ethyl-5-methyldecane |
| 11 | 2,3,6-Trimethyldecane |
| 12 | 5-Ethylundecane |
| 13 | 3,5-Dimethylpiperidine |
| 14 | 4,8-Dimethylundecane |
| 15 | Tridecane |
| 16 | Docosyl nonyl ether |
| 17 | 2-Hexyl-1-decanol |
| 18 | 1-Hexadecanol |
| 19 | 1,2,4-Trimethylcyclohexane |
| 20 | 6-Methyl-5-hepten-2-one |
| 21 | 1-Iodotetradecane |
| 22 | Tetradecane |
| 23 | Eicosyl nonyl ether |
| 24 | Methoxyacetic acid 2-tetradecyl ester |
| 25 | Heptyl isobutyl ketone |
| 26 | 1,3-bis(1,1-Dimethylethyl)-benzene |
| 27 | Pentadecane |
| 28 | 2,4-Heptadienal |
| 29 | 3-Ethyl-1,4-hexadiene |
| 30 | 2-Methylpentadecane |
| 31 | Hexadecane |
| 32 | 2,6,6-Trimethyl-1-cyclohexene-1-carboxaldehyde |
| 33 | Fumaric acid 3-methylbut-3-enyl undecyl ester |
| 34 | 2,4-Dimethylbenzaldehyde |
| 35 | Geranyl acetone isomer 1 |
| 36 | Tricyclo[4,4,0,0(2,8)]decane |
| 37 | 3-Buten-2-one |
| 38 | β-Ionone |
| 39 | Phenol |
| 40 | 6,10,14-Trimethyl-2-pentadecanone |
| 41 | 2-Propanone |
| 42 | Fumaric acid 2-decyl dodecyl ester |
| 43 | dihydromethyljasmonate |
| 44 | 2,4-di-tert-Butylphenol |
| 45 | 1,2-Benzenedicarboxilic acid |
| 46 | 5,6,7,7a-Tetrahydro-4,4,7a-trimethyl-2(4H)-benzofuranone |
| 47 | Butyl octyl phthalate |
| Sample | CAOX DPPH * IC50 (µg/g) | CAOX ORAC * (g Trolox/g of Sample) | Total Phenolic Content * (mg GAE/g Sample DW) |
|---|---|---|---|
| AL | 876 ± 84 | 29.96 ± 0.50 | 145.9 ± 6.8 |
| CH | 824 ± 82 | 27.34 ± 0.50 | 167.2 ± 10.2 |
| HU | 861 ± 53 | 27.46 ± 0.50 | 154.6 ± 17.3 |
| LO_S | 711 ± 12 | 24.03 ± 0.44 | 171.9 ± 19.4 |
| LO_N | 846 ± 53 | 27.78 ± 0.51 | 177.1 ± 11.0 |
| LI | 1066 ± 75 | 28.77 ± 0.53 | 156.1 ± 13.4 |
| PI | 1126 ± 19 | 33.11 ± 0.61 | 133.5 ± 18.8 |
| TO | 922 ± 116 | 30.43 ± 0.56 | 146.9 ± 13.0 |
| VE | 792 ± 9 | 24.95 ± 0.46 | 145.5 ± 11.3 |
| No | Compound * | Class | AL | CH | HU | LO_S | LO_N | LI | PI | TO | VE |
|---|---|---|---|---|---|---|---|---|---|---|---|
| 1 | oxalic acid 6-ethyloct-3-yl ethyl ester | ester | • | • | • | ||||||
| 2 | 3-(3,4-dimethoxyphenyl)-6-nitrocoumarin | aromatic | • | • | |||||||
| 3 | methoxyacetic acid 2-tetradecyl ester | ester | • | • | • | • | • | • | • | • | |
| 4 | 1,3-bis(1,1-dimethylethyl)benzene | aromatic | • | • | • | • | • | • | • | • | • |
| 5 | 2,4-heptadienal | aldehyde | • | • | • | • | • | ||||
| 6 | 3-ethyl-1,4-hexadiene | diene | • | • | • | • | |||||
| 7 | benzoic acid | carboxylic acid | • | • | |||||||
| 8 | 2,6,6-trimethyl-1-cyclohexene-1-carboxaldehyde | aldehyde | • | • | • | • | |||||
| 9 | fumaric acid 3-methylbut-3-enyl undecyl ester | ester | • | ||||||||
| 10 | phenol | phenol | • | ||||||||
| 11 | [(2-methylpropyl)thio]-benzene | aromatic | • | ||||||||
| 12 | glycerol 1,2-diacetate | ester | • | ||||||||
| 13 | 3-furanacetic acid | carboxylic acid | • | ||||||||
| 14 | 4-(1-hydroxyallyl)-2-methoxyphenol | phenol | • | • | • | • | • | ||||
| 15 | 5-pentyl-1,3-benzenediol | alcohol | • | • | |||||||
| 16 | fumaric acid 2-decyl dodecyl ester | ester | • | ||||||||
| 17 | dihydromethyljasmonate | ester | • | • | • | ||||||
| 18 | 2,4-di-tert-butylphenol | phenol | • | • | • | • | • | • | • | • | |
| 19 | 5,6,7,7a-tetrahydro-4,4,7a-trimethyl-2(4H)-benzofuranone | terpene | • | • | • | • | • | • | |||
| 20 | mequinol | phenol | • | • | • |
Publisher’s Note: MDPI stays neutral with regard to jurisdictional claims in published maps and institutional affiliations. |
© 2022 by the authors. Licensee MDPI, Basel, Switzerland. This article is an open access article distributed under the terms and conditions of the Creative Commons Attribution (CC BY) license (https://creativecommons.org/licenses/by/4.0/).
Share and Cite
Wrona, M.; Pezo, D.; Rovito, M.A.; Vera, P.; Nerín, C.; Asensio, E. Application of Untargeted Metabolomics to Determine Volatile Compounds from the Spanish Plant Arctostaphylos uva-ursi Used as Tea. Separations 2022, 9, 68. https://doi.org/10.3390/separations9030068
Wrona M, Pezo D, Rovito MA, Vera P, Nerín C, Asensio E. Application of Untargeted Metabolomics to Determine Volatile Compounds from the Spanish Plant Arctostaphylos uva-ursi Used as Tea. Separations. 2022; 9(3):68. https://doi.org/10.3390/separations9030068
Chicago/Turabian StyleWrona, Magdalena, Davinson Pezo, Maria Anna Rovito, Paula Vera, Cristina Nerín, and Esther Asensio. 2022. "Application of Untargeted Metabolomics to Determine Volatile Compounds from the Spanish Plant Arctostaphylos uva-ursi Used as Tea" Separations 9, no. 3: 68. https://doi.org/10.3390/separations9030068
APA StyleWrona, M., Pezo, D., Rovito, M. A., Vera, P., Nerín, C., & Asensio, E. (2022). Application of Untargeted Metabolomics to Determine Volatile Compounds from the Spanish Plant Arctostaphylos uva-ursi Used as Tea. Separations, 9(3), 68. https://doi.org/10.3390/separations9030068