
Determination of Antibiotic Residues in Aquaculture Products by Liquid Chromatography Tandem Mass Spectrometry: Recent Trends and Developments from 2010 to 2020

Abstract
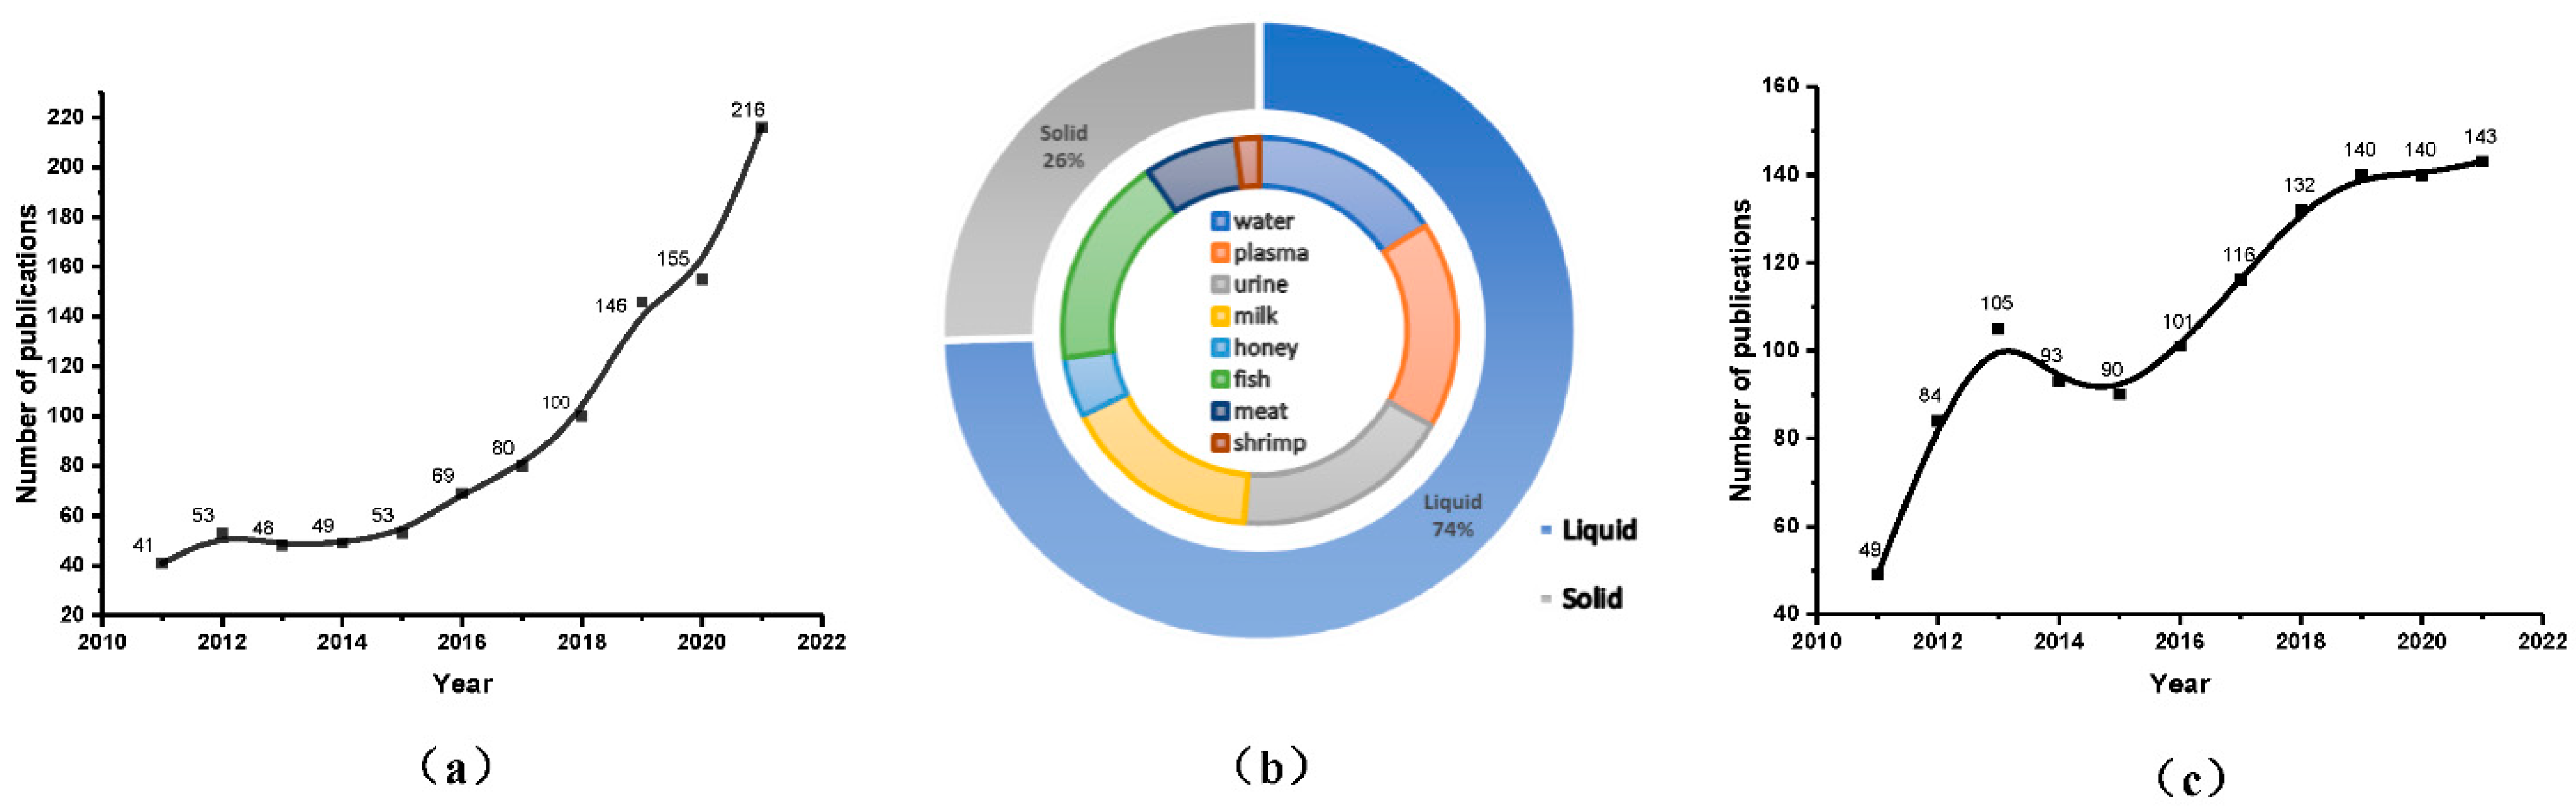
:1. Introduction
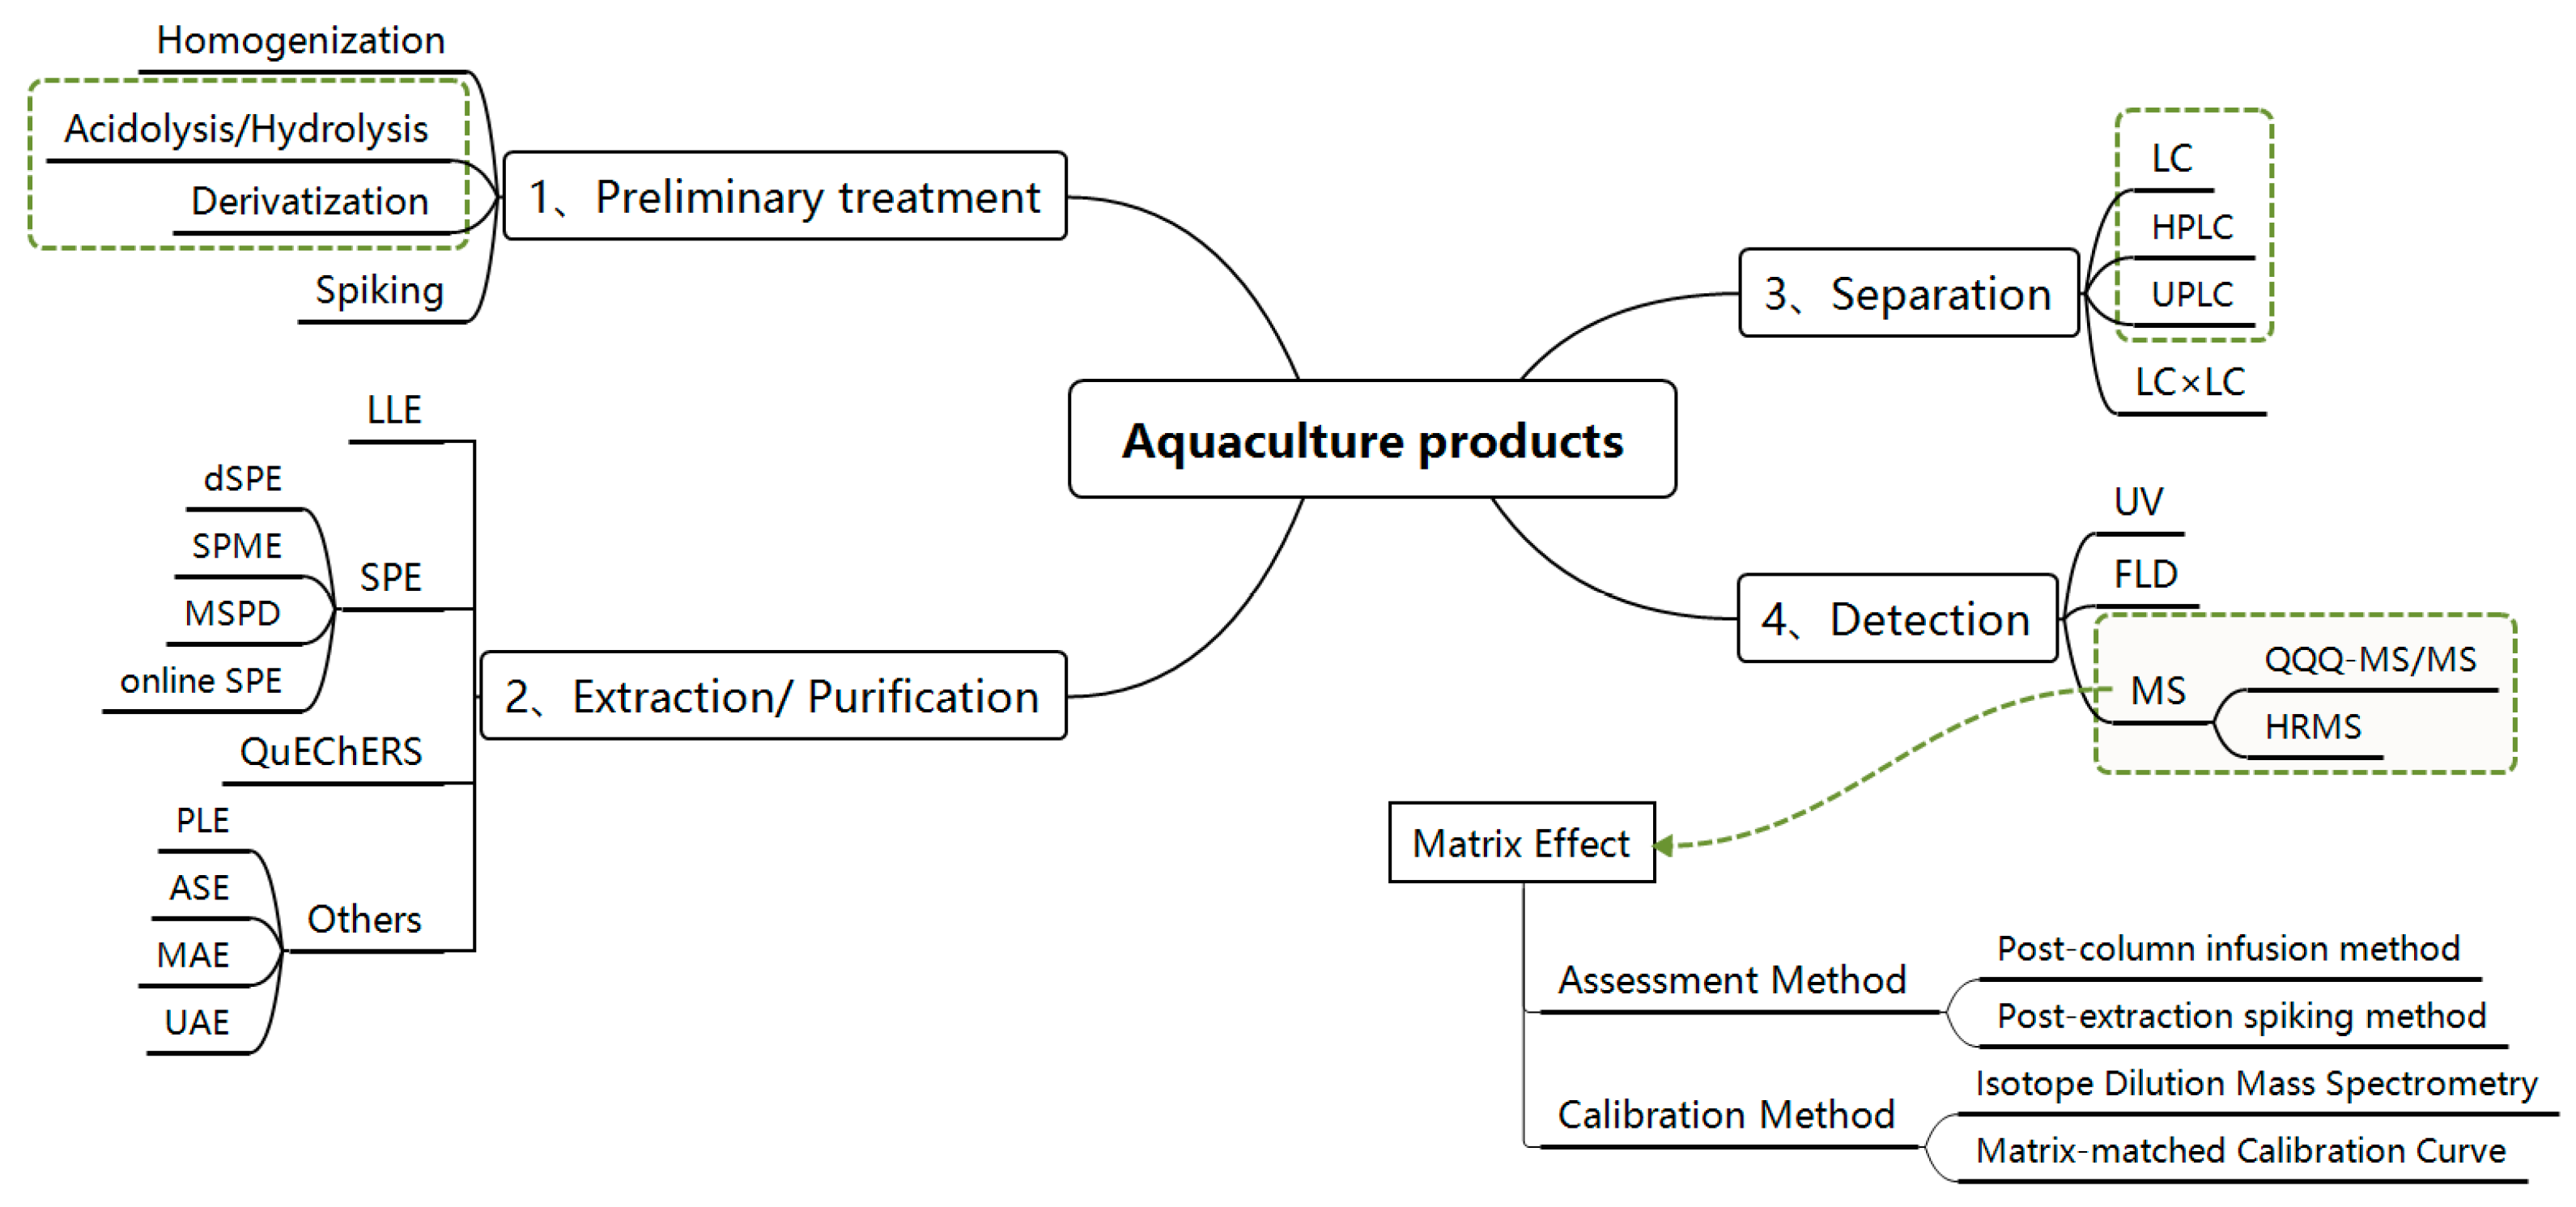
2. Sample Pre-Treatments
2.1. Hydrolysis and Derivatization
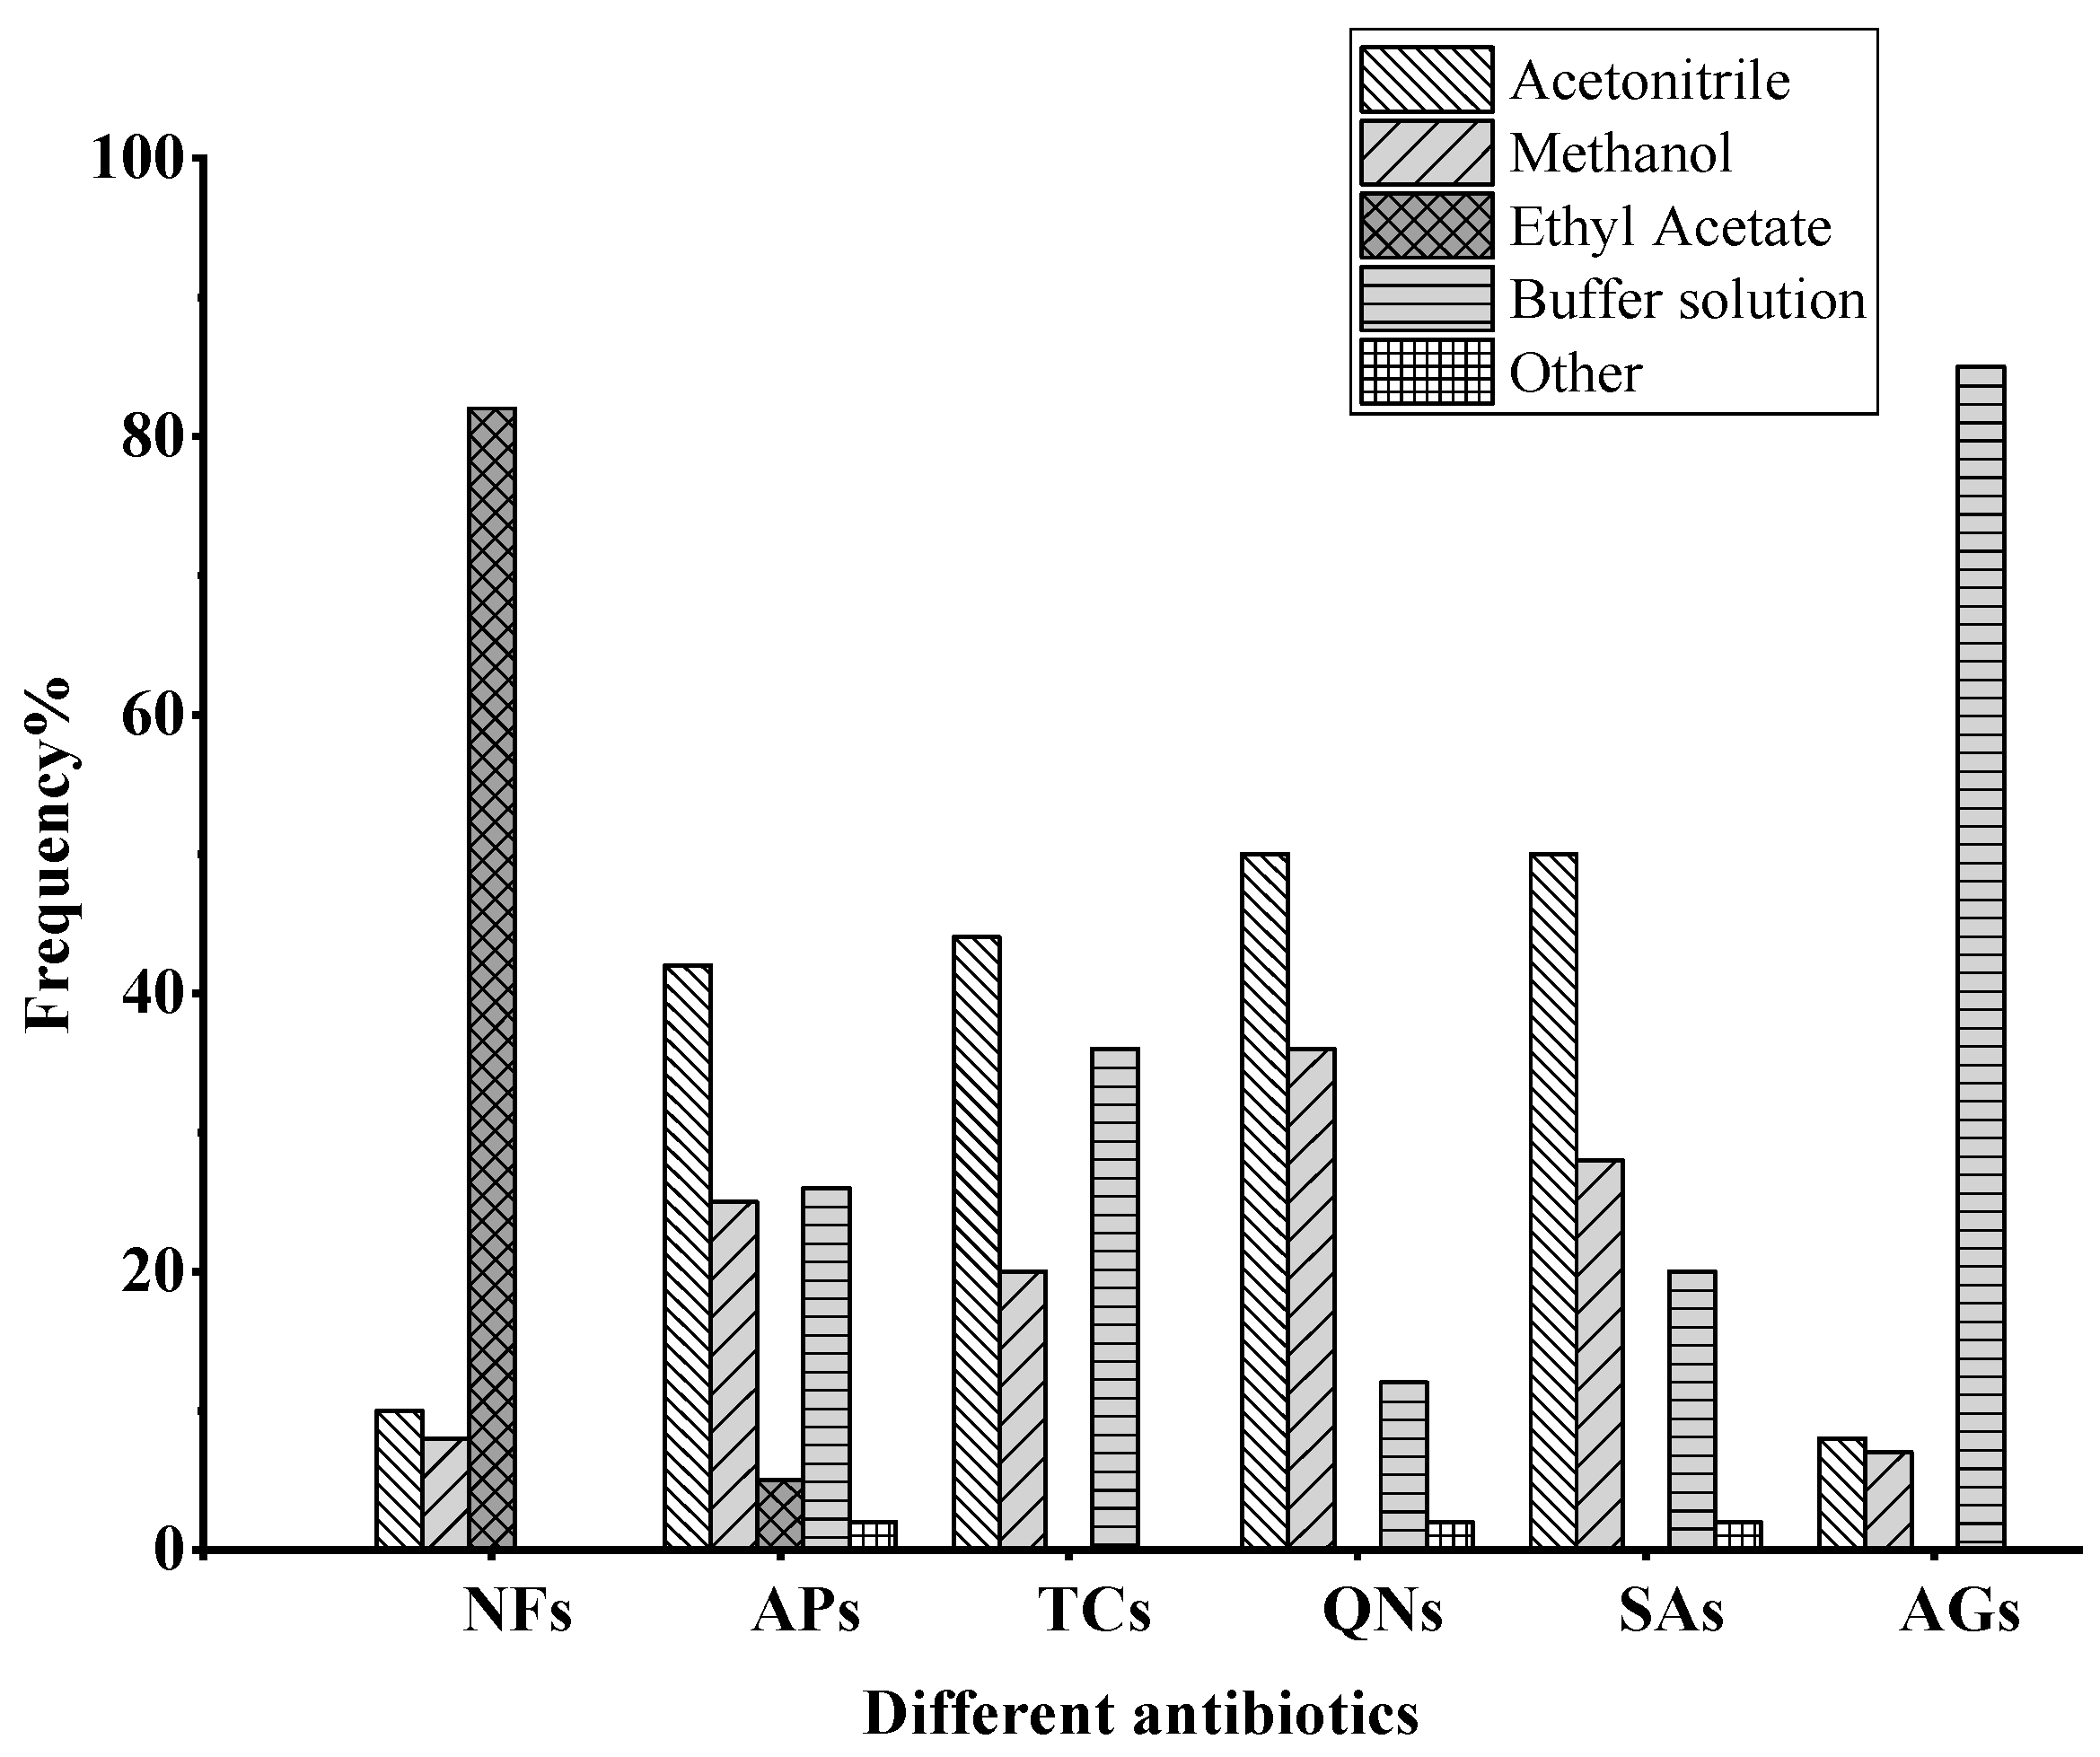
2.2. Extraction and Purification Methods
2.2.1. Liquid–Liquid Extraction (LLE)
2.2.2. Solid-Phase Extraction (SPE)
2.2.3. Other Techniques
3. Liquid Chromatography-Mass Spectrometry Detection Technique
4. Matrix Effect
5. Antibiotic Food Matrix CRMs
6. Conclusions
Supplementary Materials
Author Contributions
Funding
Institutional Review Board Statement
Informed Consent Statement
Data Availability Statement
Conflicts of Interest
References
- Mo, W.Y.; Chen, Z.; Leung, H.M.; Leung, A.O.W. Application of veterinary antibiotics in China’s aquaculture industry and their potential human health risks. Environ. Sci. Pollut. Res. 2015, 24, 8978–8989. [Google Scholar] [CrossRef] [PubMed]
- Santos, L.; Ramos, F. Analytical strategies for the detection and quantification of antibiotic residues in aquaculture fishes: A review. Trends Food Sci. Technol. 2016, 52, 16–30. [Google Scholar] [CrossRef]
- Sun, M.; Chang, Z.; Van den Brink, P.J.; Li, J.; Zhao, F.; Rico, A. Environmental and human health risks of antimicrobials used in Fenneropenaeus chinensis aquaculture production in China. Environ. Sci. Pollut. Res. Int. 2016, 23, 15689–15702. [Google Scholar] [CrossRef] [PubMed]
- Liu, X.; Steele, J.C.; Meng, X.Z. Usage, residue, and human health risk of antibiotics in Chinese aquaculture: A review. Environ. Pollut. 2017, 223, 161–169. [Google Scholar] [CrossRef]
- Justino, C.I.L.; Duarte, K.R.; Freitas, A.C.; Panteleitchouk, T.S.L.; Duarte, A.C.; Rocha-Santos, T.A.P. Contaminants in aquaculture: Overview of analytical techniques for their determination. TrAC 2016, 80, 293–310. [Google Scholar] [CrossRef]
- Du, N.N.; Chen, M.M.; Sheng, L.Q.; Chen, S.S.; Xu, H.J.; Liu, Z.D.; Song, C.F.; Qiao, R. Determination of nitrofuran metabolites in shrimp by high performance liquid chromatography with fluorescence detection and liquid chromatography-tandem mass spectrometry using a new derivatization reagent. J. Chromatogr. A 2014, 1327, 90–96. [Google Scholar] [CrossRef]
- Luo, X.; Yu, Y.; Kong, X.; Wang, X.; Ji, Z.; Sun, Z.; You, J. Rapid microwave assisted derivatization of nitrofuran metabolites for analysis in shrimp by high performance liquid chromatography-fluorescence detector. Microchem. J. 2019, 150. [Google Scholar] [CrossRef]
- Santos, L.; Barbosa, J.; Castilho, M.C.; Ramos, F.; Ribeiro, C.A.F.; Silveira, M.I.N.d. Determination of chloramphenicol residues in rainbow trouts by gas chromatography–mass spectometry and liquid chromatography–tandem mass spectometry. Anal. Chim. Acta 2005, 529, 249–256. [Google Scholar] [CrossRef]
- Pan, L. Studies on the Binding Effection of Protein with Pesticides or Veterinary Drugs and Their Detective Application. Master’s Thesis, Yantai University, Yantai, China, 2018. [Google Scholar]
- Mateen, A.; Khan, S.M.; Musarrat, J. Differential binding of tetracyclines with serum albumin and induced structural alterations in drug-bound protein. Int. J. Biol. Macromol. 2002, 30, 243–249. [Google Scholar] [CrossRef]
- Li, H.; Yin, J.; Liu, Y.; Shang, J. Effect of protein on the detection of fluoroquinolone residues in fish meat. J. Agric. Food Chem. 2012, 60, 1722–1727. [Google Scholar] [CrossRef]
- Zhang, Y. The Interaction of Antibiotics with Protein and High Throughput Screening of Drug Residues in Fish Based on HPLC-Q-TOF-MS. Master’s Thesis, Shaanxi University of Science and Technology, Xi’an, China, 2019. [Google Scholar]
- Leitner, A.Z.P.; Lindner, W. Determination of the metabolites of nitrofuran antibiotics in animal tissue by high-performance liquid chromatography–tandem mass spectrometry. J. Chromatogr. A. 2001, 939, 49–58. [Google Scholar] [CrossRef]
- Zhang, Y.; Qiao, H.; Chen, C.; Wang, Z.; Xia, X. Determination of nitrofurans metabolites residues in aquatic products by ultra-performance liquid chromatography-tandem mass spectrometry. Food Chem. 2016, 192, 612–617. [Google Scholar] [CrossRef] [PubMed]
- An, H.; Henry, M.; Cain, T.; Tran, B.; Paek, H.C.; Farley, D. Determination of Total Nitrofuran Metabolites in Shrimp Muscle Using Liquid Chromatography/Tandem Mass Spectrometry in the Atmospheric Pressure Chemical Ionization Mode. J. AOAC Int. 2012, 95, 1222–1233. [Google Scholar] [CrossRef] [PubMed]
- Aldeek, F.; Hsieh, K.C.; Ugochukwu, O.N.; Gerard, G.; Hammack, W. Accurate Quantitation and Analysis of Nitrofuran Metabolites, Chloramphenicol, and Florfenicol in Seafood by Ultrahigh-Performance Liquid Chromatography–Tandem Mass Spectrometry: Method Validation and Regulatory Samples. J. Agric. Food. Chem. 2017, 66, 5018–5030. [Google Scholar] [CrossRef] [PubMed]
- Fernando, R.; Munasinghe, D.M.S.; Gunasena, A.R.C.; Abeynayake, P. Determination of nitrofuran metabolites in shrimp muscle by liquid chromatography-photo diode array detection. Food Control. 2017, 72, 300–305. [Google Scholar] [CrossRef]
- Kaufmann, A.; Butcher, P.; Maden, K.; Walker, S.; Widmer, M. Determination of nitrofuran and chloramphenicol residues by high resolution mass spectrometry versus tandem quadrupole mass spectrometry. Anal. Chim. Acta. 2015, 862, 41–52. [Google Scholar] [CrossRef] [PubMed]
- Øye, B.E.; Couillard, F.D.S.V. Complete validation according to current international criteria of a confirmatory quantitative method for the determination of nitrofuran metabolites in seafood by liquid chromatography isotope dilution tandem mass spectrometry. Food Chem. 2019, 300, 125175. [Google Scholar] [CrossRef]
- Valera-Tarifa, N.M.; Plaza-Bolaños, P.; Romero-González, R.; Martínez-Vidal, J.L.; Garrido-Frenich, A. Determination of nitrofuran metabolites in seafood by ultra high performance liquid chromatography coupled to triple quadrupole tandem mass spectrometry. J. Food Compos. Anal. 2013, 30, 86–93. [Google Scholar] [CrossRef]
- Chen, D.; Delmas, J.M.; Hurtaud-Pessel, D.; Verdon, E. Development of a multi-class method to determine nitroimidazoles, nitrofurans, pharmacologically active dyes and chloramphenicol in aquaculture products by liquid chromatography-tandem mass spectrometry. Food Chem. 2020, 311, 125924. [Google Scholar] [CrossRef]
- Tao, Y.; Chen, D.; Wei, H.; Yuanhu, P.; Liu, Z.; Huang, L.; Wang, Y.; Xie, S.; Yuan, Z. Development of an accelerated solvent extraction, ultrasonic derivatisation LC-MS/MS method for the determination of the marker residues of nitrofurans in freshwater fish. Food Addit. Contam. Part A 2012, 29, 736–745. [Google Scholar] [CrossRef]
- Wang, K.; Kou, Y.; Wang, M.; Ma, X.; Wang, J. Determination of Nitrofuran Metabolites in Fish by Ultraperformance Liquid Chromatography-Photodiode Array Detection with Thermostatic Ultrasound-Assisted Derivatization. ACS Omega 2020, 5, 18887–18893. [Google Scholar] [CrossRef] [PubMed]
- Palaniyappan, V.; Nagalingam, A.K.; Ranganathan, H.P.; Kandhikuppam, K.B.; Kothandam, H.P.; Vasu, S. Microwave-assisted derivatisation and LC-MS/MS determination of nitrofuran metabolites in farm-raised prawns (Penaeus monodon). Food Addit. Contam. Part A 2013, 30, 1739–1744. [Google Scholar] [CrossRef]
- Luo, X.; Sun, Z.; Wang, X.; Yu, Y.; Ji, Z.; Zhang, S.; Li, G.; You, J. Determination of nitrofuran metabolites in marine products by high performance liquid chromatography–fluorescence detection with microwave-assisted derivatization. New J. Chem. 2019, 43, 2649–2657. [Google Scholar] [CrossRef]
- Wang, Q.; Wang, X.F.; Jiang, Y.Y.; Li, Z.G.; Cai, N.; Guan, W.Q.; Huang, K.; Zhao, D.H. Determination of 5-nitro-2-furaldehyde as marker residue for nitrofurazone treatment in farmed shrimps and with addressing the use of a novel internal standard. Sci. Rep. 2019, 9, 19243. [Google Scholar] [CrossRef] [PubMed]
- Zhang, S.; Li, P.; Yan, Z.; Long, J.; Zhang, X. Identification and quantification of nitrofurazone metabolites by ultraperformance liquid chromatography-quadrupole time-of-flight high-resolution mass spectrometry with precolumn derivatization. Anal. Bioanal. Chem. 2017, 409, 2255–2260. [Google Scholar] [CrossRef] [PubMed]
- Zhang, S.; Guo, Y.; Yan, Z.; Sun, X.; Zhang, X. A selective biomarker for confirming nitrofurazone residues in crab and shrimp using ultra-performance liquid chromatography–tandem mass spectrometry. Anal. Bioanal. Chem. 2015, 407, 8971–8977. [Google Scholar] [CrossRef] [PubMed]
- Kaufmann, A.; Butcher, P.; Maden, K. Determination of aminoglycoside residues by liquid chromatography and tandem mass spectrometry in a variety of matrices. Anal. Chim. Acta 2012, 711, 46–53. [Google Scholar] [CrossRef]
- Li, J.; Song, X.; Zhang, M.; Li, E.; He, L. Simultaneous Determination of Aminoglycoside Residues in Food Animal Muscles by Mixed-Mode Liquid Chromatography-Tandem Mass Spectrometry. Food Anal. Methods 2018, 11, 1690–1700. [Google Scholar] [CrossRef]
- Lombardo-Agüí, M.; García-Campaña, A.M.; Cruces-Blanco, C.; Gámiz-Gracia, L. Determination of quinolones in fish by ultra-high performance liquid chromatography with fluorescence detection using QuEChERS as sample treatment. Food Control 2015, 50, 864–868. [Google Scholar] [CrossRef]
- Guidi, L.R.; Tette, P.A.S.; Gloria, M.B.A.; Fernandes, C. A simple and rapid LC-MS/MS method for the determination of amphenicols in Nile tilapia. Food Chem. 2018, 262, 235–241. [Google Scholar] [CrossRef]
- Bortolotte, A.R.; Daniel, D.; de Campos Braga, P.A.; Reyes, F.G.R. A simple and high-throughput method for multiresidue and multiclass quantitation of antimicrobials in pangasius (Pangasionodon hypophthalmus) fillet by liquid chromatography coupled with tandem mass spectrometry. J. Chromatogr. B 2019, 1124, 17–25. [Google Scholar] [CrossRef] [PubMed]
- Chen, J.; Wei, Z.; Cao, X.-Y. QuEChERS Pretreatment Combined with Ultra-performance Liquid Chromatography–Tandem Mass Spectrometry for the Determination of Four Veterinary Drug Residues in Marine Products. Food Anal. Methods 2019, 12, 1055–1066. [Google Scholar] [CrossRef]
- Wu, J.; Qian, Y.; Zhang, C.; Zheng, T.; Chen, L.; Lu, Y.; Wang, H. Application of Graphene-based Solid-Phase Extraction Coupled with Ultra High-performance Liquid Chromatography-Tandem Mass Spectrometry for Determination of Macrolides in Fish Tissues. Food Anal. Methods 2013, 6, 1448–1457. [Google Scholar] [CrossRef]
- Sismotto, M.; Paschoal, J.A.R.; Teles, J.A.; de Rezende, R.A.E.; Reyes, F.G.R. A simple liquid chromatography coupled to quadrupole time of flight mass spectrometry method for macrolide determination in tilapia fillets. J. Food Compos. Anal. 2014, 34, 153–162. [Google Scholar] [CrossRef]
- Grande-Martínez, Á.; Moreno-González, D.; Arrebola-Liébanas, F.J.; Garrido-Frenich, A.; García-Campaña, A.M. Optimization of a modified QuEChERS method for the determination of tetracyclines in fish muscle by UHPLC–MS/MS. J. Pharm. Biomed. Anal. 2018, 155, 27–32. [Google Scholar] [CrossRef]
- Shin, D.; Kang, H.-S.; Jeong, J.; Kim, J.; Choe, W.J.; Lee, K.S.; Rhee, G.-S. Multi-residue Determination of Veterinary Drugs in Fishery Products Using Liquid Chromatography-Tandem Mass Spectrometry. Food Anal. Methods 2018, 11, 1815–1831. [Google Scholar] [CrossRef]
- Lopes, R.P.; Reyes, R.C.; Romero-González, R.; Vidal, J.L.M.; Frenich, A.G. Multiresidue determination of veterinary drugs in aquaculture fish samples by ultra high performance liquid chromatography coupled to tandem mass spectrometry. J. Chromatogr. B 2012, 895-896, 39–47. [Google Scholar] [CrossRef]
- Serra-Compte, A.; Alvarez-Munoz, D.; Rodriguez-Mozaz, S.; Barcelo, D. Fast methodology for the determination of a broad set of antibiotics and some of their metabolites in seafood. Food Chem. Toxicol. 2017, 104, 3–13. [Google Scholar] [CrossRef]
- Yuan, G.; Zhu, Z.; Yang, P.; Lu, S.; Liu, H.; Liu, W.; Liu, G. Simultaneous determination of eight nitrofuran residues in shellfish and fish using ultra-high performance liquid chromatography–tandem mass spectrometry. J. Food Compos. Anal. 2020, 92, 103540. [Google Scholar] [CrossRef]
- Jia, W.; Chu, X.; Chang, J.; Wang, P.G.; Chen, Y.; Zhang, F. High-throughput untargeted screening of veterinary drug residues and metabolites in tilapia using high resolution orbitrap mass spectrometry. Anal. Chim. Acta 2017, 957, 29–39. [Google Scholar] [CrossRef]
- Dickson, L.C. Performance characterization of a quantitative liquid chromatography-tandem mass spectrometric method for 12 macrolide and lincosamide antibiotics in salmon, shrimp and tilapia. J. Chromatogr. B 2014, 967, 203–210. [Google Scholar] [CrossRef] [PubMed]
- Habibi, B.; Ghorbel-Abid, I.; Lahsini, R.; Ben Hassen, D.C.; Trabelsi-Ayadi, M. Development and validation of a rapid HPLC method for multiresidue determination of erythromycin, clarithromycin, and azithromycin in aquaculture fish muscles. Acta Chromatogr. 2019, 31, 109–112. [Google Scholar] [CrossRef]
- Orlando, E.A.; Costa Roque, A.G.; Losekann, M.E.; Colnaghi Simionato, A.V. UPLC–MS/MS determination of florfenicol and florfenicol amine antimicrobial residues in tilapia muscle. J. Chromatogr. B 2016, 1035, 8–15. [Google Scholar] [CrossRef] [PubMed]
- Evaggelopoulou, E.N.; Samanidou, V.F. Development and validation of an HPLC method for the determination of six penicillin and three amphenicol antibiotics in gilthead seabream (Sparus aurata) tissue according to the European Union Decision 2002/657/EC. Food Chem. 2013, 136, 1322–1329. [Google Scholar] [CrossRef] [PubMed]
- Liu, Y.Y.; Hu, X.L.; Bao, Y.F.; Yin, D.Q. Simultaneous determination of 29 pharmaceuticals in fish muscle and plasma by ultrasonic extraction followed by SPE-UHPLC-MS/MS. J. Sep. Sci. 2018, 41, 2139–2150. [Google Scholar] [CrossRef] [PubMed]
- Li, T.; Wang, C.; Xu, Z.; Chakraborty, A. A coupled method of on-line solid phase extraction with the UHPLCMS/MS for detection of sulfonamides antibiotics residues in aquaculture. Chemosphere 2020, 254, 126765. [Google Scholar] [CrossRef] [PubMed]
- Tang, Y.Y.; Lu, H.F.; Lin, H.Y.; Shin, Y.C.; Hwang, D.F. Development of a Quantitative Multi-Class Method for 18 Antibiotics in Chicken, Pig, and Fish Muscle using UPLC-MS/MS. Food Anal. Methods 2012, 5, 1459–1468. [Google Scholar] [CrossRef]
- Sun, X.; Yang, Y.; Tian, Q.; Shang, D.; Xing, J.; Zhai, Y. Determination of gentamicin C components in fish tissues through SPE-Hypercarb-HPLC-MS/MS. J. Chromatogr. B 2018, 1093–1094, 167–173. [Google Scholar] [CrossRef]
- Gbylik, M.; Posyniak, A.; Mitrowska, K.; Bladek, T.; Zmudzki, J. Multi-residue determination of antibiotics in fish by liquid chromatography-tandem mass spectrometry. Food Addit. Contam. Part A 2013, 30, 940–948. [Google Scholar] [CrossRef]
- Pan, X.D.; Wu, P.G.; Jiang, W.; Ma, B.J. Determination of chloramphenicol, thiamphenicol, and florfenicol in fish muscle by matrix solid-phase dispersion extraction (MSPD) and ultra-high pressure liquid chromatography tandem mass spectrometry. Food Control 2015, 52, 34–38. [Google Scholar] [CrossRef]
- Shen, Q.; Jin, R.; Xue, J.; Lu, Y.; Dai, Z. Analysis of trace levels of sulfonamides in fish tissue using micro-scale pipette tip-matrix solid-phase dispersion and fast liquid chromatography tandem mass spectrometry. Food Chem. 2016, 194, 508–515. [Google Scholar] [CrossRef]
- Wang, Y.; Chen, L. Analysis of malachite green in aquatic products by carbon nanotube-based molecularly imprinted—matrix solid phase dispersion. J. Chromatogr. B 2015, 1002, 98–106. [Google Scholar] [CrossRef] [PubMed]
- Mondal, S.; Xu, J.Q.; Chen, G.S.; Huang, S.M.; Huang, C.Y.; Yin, L.; Ouyang, G.F. Solid-phase microextraction of antibiotics from fish muscle by using MIL-101(Cr)NH2-polyacrylonitrile fiber and their identification by liquid chromatography-tandem mass spectrometry. Anal. Chim. Acta 2019, 1047, 62–70. [Google Scholar] [CrossRef] [PubMed]
- Kung, T.A.; Tsai, C.W.; Ku, B.C.; Wang, W.H. A generic and rapid strategy for determining trace multiresidues of sulfonamides in aquatic products by using an improved QuEChERS method and liquid chromatography-electrospray quadrupole tandem mass spectrometry. Food Chem. 2015, 175, 189–196. [Google Scholar] [CrossRef]
- Munaretto, J.S.; May, M.M.; Saibt, N.; Zanella, R. Liquid chromatography with high resolution mass spectrometry for identification of organic contaminants in fish fillet: Screening and quantification assessment using two scan modes for data acquisition. J. Chromatogr. A 2016, 1456, 205–216. [Google Scholar] [CrossRef]
- Liu, Y.; Yang, H.; Yang, S.; Hu, Q.; Cheng, H.; Liu, H.; Qiu, Y. High-performance liquid chromatography using pressurized liquid extraction for the determination of seven tetracyclines in egg, fish and shrimp. J. Chromatogr. B 2013, 917–918, 11–17. [Google Scholar] [CrossRef]
- Hoff, R.B.; Pizzolato, T.M.; Peralba, M.; Diaz-Cruz, M.S.; Barcelo, D. Determination of sulfonamide antibiotics and metabolites in liver, muscle and kidney samples by pressurized liquid extraction or ultrasound-assisted extraction followed by liquid chromatography-quadrupole linear ion trap-tandem mass spectrometry (HPLC-QqLIT-MS/MS). Talanta 2015, 134, 768–778. [Google Scholar] [CrossRef]
- Kazakova, J.; Fernandez-Torres, R.; Ramos-Payan, M.; Bello-Lopez, M.A. Multiresidue determination of 21 pharmaceuticals in crayfish (Procambarus clarkii) using enzymatic microwave-assisted liquid extraction and ultrahigh-performance liquid chromatography-triple quadrupole mass spectrometry analysis. J. Pharm. Biomed. Anal. 2018, 160, 144–151. [Google Scholar] [CrossRef] [PubMed]
- Jansomboon, W.; Boontanon, S.K.; Boontanon, N.; Polprasert, C.; Thi Da, C. Monitoring and determination of sulfonamide antibiotics (sulfamethoxydiazine, sulfamethazine, sulfamethoxazole and sulfadiazine) in imported Pangasius catfish products in Thailand using liquid chromatography coupled with tandem mass spectrometry. Food Chem. 2016, 212, 635–640. [Google Scholar] [CrossRef] [PubMed]
- Chumanee, S.; Sutthivaiyakit, S.; Sutthivaiyakit, P. New Reagent for Trace Determination of Protein-Bound Metabolites of Nitrofurans in Shrimp Using Liquid Chromatography with Diode Array Detector. J. Agric. Food Chem. 2009, 57, 1752–1759. [Google Scholar] [CrossRef] [PubMed]
- Dasenaki, M.E.; Thomaidis, N.S. Multi-residue determination of 115 veterinary drugs and pharmaceutical residues in milk powder, butter, fish tissue and eggs using liquid chromatography-tandem mass spectrometry. Anal. Chim. Acta 2015, 880, 103–121. [Google Scholar] [CrossRef]
- Gaspar, A.F.; Santos, L.; Rosa, J.; Leston, S.; Barbosa, J.; Vila Pouca, A.S.; Freitas, A.; Ramos, F. Development and validation of a multi-residue and multi-class screening method of 44 antibiotics in salmon (Salmo salar) using ultra-high-performance liquid chromatography/time-of-flight mass spectrometry: Application to farmed salmon. J. Chromatogr. B 2019, 1118–1119, 78–84. [Google Scholar] [CrossRef] [PubMed]
- Grabicova, K.; Vojs Stanova, A.; Koba Ucun, O.; Borik, A.; Randak, T.; Grabic, R. Development of a robust extraction procedure for the HPLC-ESI-HRPS determination of multi-residual pharmaceuticals in biota samples. Anal. Chim. Acta 2018, 1022, 53–60. [Google Scholar] [CrossRef]
- Guidi, L.R.; Santos, F.A.; Ribeiro, A.C.; Fernandes, C.; Silva, L.H.; Gloria, M.B. A simple, fast and sensitive screening LC-ESI-MS/MS method for antibiotics in fish. Talanta 2017, 163, 85–93. [Google Scholar] [CrossRef] [PubMed]
- Zhao, F.; Gao, X.; Tang, Z.; Luo, X.; Wu, M.; Xu, J.; Fu, X. Development of a simple multi-residue determination method of 80 veterinary drugs in Oplegnathus punctatus by liquid chromatography coupled to quadrupole Orbitrap mass spectrometry. J. Chromatogr. B 2017, 1065–1066, 20–28. [Google Scholar] [CrossRef]
- Miossec, C.; Mille, T.; Lanceleur, L.; Monperrus, M. Simultaneous determination of 42 pharmaceuticals in seafood samples by solvent extraction coupled to liquid chromatography-tandem mass spectrometry. Food Chem. 2020, 322, 126765. [Google Scholar] [CrossRef] [PubMed]
- Liang, Y.; Zhou, T. Recent advances of online coupling of sample preparation techniques with ultra high performance liquid chromatography and supercritical fluid chromatography. J. Sep. Sci. 2019, 42, 226–242. [Google Scholar] [CrossRef]
- Ma, J.; Fan, S.; Sun, L.; He, L.; Zhang, Y.; Li, Q. Rapid analysis of fifteen sulfonamide residues in pork and fish samples by automated on-line solid phase extraction coupled to liquid chromatography–tandem mass spectrometry. Food Sci. Hum. Wellness 2020, 9, 363–369. [Google Scholar] [CrossRef]
- Hurtado de Mendoza, J.; Maggi, L.; Bonetto, L.; Rodríguez Carmena, B.; Lezana, A.; Mocholí, F.A.; Carmona, M. Validation of antibiotics in catfish by on-line solid phase extraction coupled to liquid chromatography tandem mass spectrometry. Food Chem. 2012, 134, 1149–1155. [Google Scholar] [CrossRef]
- Bonfiglio, R.; King, R.C.; Olah, T.V.; Merkle, K. The Effects of Sample Preparation Methods on the Variability of the Electrospray Ionization Response for Model Drug Compounds. Rapid Commun. Mass Spectrom. 1999, 13, 1175–1185. [Google Scholar] [CrossRef]
- Van Eeckhaut, A.; Lanckmans, K.; Sarre, S.; Smolders, I.; Michotte, Y. Validation of bioanalytical LC-MS/MS assays: Evaluation of matrix effects. J. Chromatogr. B 2009, 877, 2198–2207. [Google Scholar] [CrossRef] [PubMed]
- Kim, D.; Kim, B.; Hyung, S.-W.; Lee, C.H.; Kim, J. An optimized method for the accurate determination of nitrofurans in chicken meat using isotope dilution–liquid chromatography/mass spectrometry. J. Food Compos. Anal. 2015, 40, 24–31. [Google Scholar] [CrossRef]
- Ferrer, C.; Lozano, A.; Aguera, A.; Giron, A.J.; Fernandez-Alba, A.R. Overcoming matrix effects using the dilution approach in multiresidue methods for fruits and vegetables. J. Chromatogr. A 2011, 1218, 7634–7639. [Google Scholar] [CrossRef] [PubMed]
- Lee, S.; Kim, B.; Kim, J. Development of isotope dilution-liquid chromatography tandem mass spectrometry for the accurate determination of fluoroquinolones in animal meat products: Optimization of chromatographic separation for eliminating matrix effects on isotope ratio measurements. J. Chromatogr. A 2013, 1277, 35–41. [Google Scholar] [CrossRef] [PubMed]
- Douny, C.; Widart, J.; De Pauw, E.; Silvestre, F.; Kestemont, P.; Tu, H.T.; Phuong, N.T.; Maghuin-Rogister, G.; Scippo, M.-L. Development of an analytical method to detect metabolites of nitrofurans. Aquaculture 2013, 376, 54–58. [Google Scholar] [CrossRef]


| Analyte (Number) | Preliminary Treatment | Extraction and Purification | Recovery | Detection Method | LODs/CCα (μg·kg−1) | LOQs/CCβ (μg·kg−1) | Ref. |
|---|---|---|---|---|---|---|---|
| NFs (4) | Acidolysis (HCl), derivatization (2-NBA, shock, 37 °C, 16 h) | SPE: HLB | 88~112% | UPLC-ESI-MS/MS | 0.5 | 1.5 | [14] |
| NFs (4) | EtOAc; Hex | 101.6~105.9% | LC-APCI-MS/MS | 0.05–0.2 | 0.25 | [15] | |
| NFs (4), APs (2) | H2O; EtOAc | 85~110% (APs) | UPLC-ESI-MS/MS | 0.1–1 | 0.25–1 | [16] | |
| NFs (8), CAP | EtOAc; Hex, SPE by HLB | 97~108% (expect PSH, DNSH, NPIR) | UHPLC-ESI-HRMS | 0.01–0.1 a | 0.01–0.18 b | [18] | |
| NFs (4) | EtOAc; Hex | 84~115% | LC-ESI-MS/MS | 0.1–0.8 a | 0.3–0.9 b | [19] | |
| NFs (8) | EtOAc; Hex | 91.6~107.3 % | UHPLC-ESI-MS/MS | 0.01–0.2; NSTY (2.0) | 0.04–0.5; NSTY (5.0) | [41] | |
| NFs (4) | Acidolysis (TCA), derivatization (2-NBA, ultrasound, 40 °C, 1 h) | ASE: MEOH/5% TCA (1/1, v/v); SPE: HLB | 77.2~97.4% | LC-ESI-MS/MS | 0.07–0.13 a | 0.31–0.49 b | [22] |
| SEM | Acidolysis (HCl), derivatization (DNPH, ultrasound, 30 °C, 5 min) | EtOAc; SPE: neutral alumina and HLB | 80.8~104.4% | UPLC-ESI-MS/MS | 0.05 | 0.1 | [26] |
| APs (3) | / | ACN/H2O (1:1, v/v), EtOAc; MSPD: C18 | 82.4~99.8% | UPLC-ESI-MS/MS | 0.02–0.06 a | 0.11–0.16 b | [52] |
| APs (3) | / | EtOAC:NH3·H2O (98:2, v:v) | 80~92% | HPLC-ESI-MS/MS | 0.019–54.9 a | 0.068–64.88 b | [32] |
| FF, FFA | / | EtOAC:NH3·H2O (98:2, v:v); Hex, SPE: Phenyl | 96.3%(FF);83.0%(FFA) | UPLC–ESI-MS/MS | 6 (FF) 1 (FFA) | 25 (FF) 3 (FFA) | [45] |
| SAs (18) | Acidolysis | UAE: 0.1% FA in ACN; On-line SPE: MCX and HLB | 71.5~102% | Online-SPE-UHPLC—MS/MS | 1.46–15.5 | 4.90–51.6 | [48] |
| SAs (16) | Acidolysis | ASE: 0.2% FA in ACN; Hex | about 100% | HPLC-QqLIT-MS/MS | 10 | 25 | [59] |
| SAs (14) | / | ACN; d-SPE: C18 | 80.2~93.5% | HPLC-ESI-MS/MS | 1.49–10.9 a | 1.71–11.4 b | [56] |
| SAs (14) | / | PT-MSPD: HLB | 83~90% | UPLC–ESI-MS/MS | 2.3–16.4 | 6.9–54.7 | [53] |
| TCs (5) | / | EDTA-McIlvaine, ACN; SPE: C18 | 80~105% | LC–ESI-MS/MS | 0.5–1.3 | 1.7–4.4 | [37] |
| AGs (13) | / | 0.05 g/mL TCA in water; SPE: MCX | 45~85% | UHPLC-ESI-MS/MS | / | 2–25 | [29] |
| AGs (9) | / | USA: PBS; SPE: Poly-Sery and MCX | 65~110% | HPLC-ESI-MS/MS | 2–10 a | 6–25 b | [30] |
| MAs (5) | / | MeOH; SPE: Graphene; Hex | 81.7~110.5% | UPLC-Qtrap-MS/MS | 0.09–0.72 | 0.3–0.77 | [35] |
| MAs (6) | / | MeOH; Hex | 77~109% | HPLC-QTOF-HRMS | 5.8–27 | 17–82 | [36] |
| QNs, SAs, TCs | Acidolysis | 1% FA in water, ACN | 83~100% | UHPLC-ESI-MS/MS | 107–114 a | 112–129 b | [40] |
| NFs, NIIMs, CAP, MG | Acidolysis (HCl), derivation (2-NBA,60 °C, 2 h) | EtOAC, ACN, Hex, MgSO4 | 77.2~125.6% | HPLC-ESI-MS/MS | 0.07–1.65 a | / | [21] |
| TCs, APs, SAs, TMP, FQNs, MALs | / | MEOH; SPE: HLB | 61~111% | UHPLC-ESI-MS/MS | / | 0.03–6.67 | [49] |
Publisher’s Note: MDPI stays neutral with regard to jurisdictional claims in published maps and institutional affiliations. |
© 2022 by the authors. Licensee MDPI, Basel, Switzerland. This article is an open access article distributed under the terms and conditions of the Creative Commons Attribution (CC BY) license (https://creativecommons.org/licenses/by/4.0/).
Share and Cite
Xiao, Y.; Liu, S.; Gao, Y.; Zhang, Y.; Zhang, Q.; Li, X. Determination of Antibiotic Residues in Aquaculture Products by Liquid Chromatography Tandem Mass Spectrometry: Recent Trends and Developments from 2010 to 2020. Separations 2022, 9, 35. https://doi.org/10.3390/separations9020035
Xiao Y, Liu S, Gao Y, Zhang Y, Zhang Q, Li X. Determination of Antibiotic Residues in Aquaculture Products by Liquid Chromatography Tandem Mass Spectrometry: Recent Trends and Developments from 2010 to 2020. Separations. 2022; 9(2):35. https://doi.org/10.3390/separations9020035
Chicago/Turabian StyleXiao, Yueting, Shuyu Liu, Yuan Gao, Yan Zhang, Qinghe Zhang, and Xiuqin Li. 2022. "Determination of Antibiotic Residues in Aquaculture Products by Liquid Chromatography Tandem Mass Spectrometry: Recent Trends and Developments from 2010 to 2020" Separations 9, no. 2: 35. https://doi.org/10.3390/separations9020035
APA StyleXiao, Y., Liu, S., Gao, Y., Zhang, Y., Zhang, Q., & Li, X. (2022). Determination of Antibiotic Residues in Aquaculture Products by Liquid Chromatography Tandem Mass Spectrometry: Recent Trends and Developments from 2010 to 2020. Separations, 9(2), 35. https://doi.org/10.3390/separations9020035