1. Introduction
Selenium (Se), as a crucial microelement, is an indispensable nutrient for normal activity of human body [
1]. Previous studies have reported the role of Se in protecting human body from acne, psoriasis, multiple sclerosis, colorectal cancer, cervical dysplasia, esophageal cancer, and stomach cancer [
2]. The deficiency of Se can induce a number of degenerative diseases, such as endemic Kashin–Beck disease [
3]. Human health may be improved, if intake of Se is increased in a reasonable range. And the main and safe source of selenium supplementation for humans is diet. Thus, Se-enriched foods which have beneficial functions to our health have been emerging in recent years.
Eggs, which have been regarded as a source of bioactive compounds of animal origin for many years, are considered as an important constituent of diet due to their nutritional value, such as enrichment in proteins, vitamins, and minerals [
4,
5]. Se content in eggs can easily be manipulated to give increased levels [
6]. Therefore, Se-enriched eggs are currently sold in many countries and have become the main source of Se supplementation for humans. Nowadays Se-enriched eggs on the market are usually labeled only by content of total selenium. But the bioavailability, metabolic pathway and physiological functions of Se were not only determined by the intake level, but also depend on the chemical forms of element [
7,
8,
9]. Therefore, except for determining the total Se content, the composition of Se species in food should be fully considered when evaluating the Se-enriched food quality.
Researchers have spent tremendous effort to perform analysis of Se and its speciation in eggs. To date, a series of techniques (i.e., spectrofluorometry, atomic spectrometry) was reported for the analysis of total Se in eggs [
10,
11,
12]. However, speciation studies of Se in eggs are still scarce in literature. Lipiec et al. attempted to use high-performance liquid chromatography combined with inductively coupled plasma mass spectrometry (HPLC-ICP-MS) simultaneous determining selenomethionine (SeMet), selenocysteine (SeCys), and inorganic Se(IV) in egg white lyophilisate powder and yolk protein precipitate which were defatted by cyclohexan. The detection limits were 60, 3, and 10 µg kg
−1 (dry weight) for SeCys, Se(IV), and SeMet, respectively, and the precision was 5–10% [
13]. Sun and Feng developed a method using HG-AFS by depositing albumen with trichloroacetic acid to determination organic and inorganic Se in fresh Se-enriched eggs [
14]. Up to now, there were few reports about the analysis method of Se species in fresh liquid whole egg.
It was well known that most of Se was believed to be incorporated into proteins through biotransformation in animal. And organic Se species (SeMet, selenocystine (SeCys
2), and methylselenocysteine (MeSeCys)) were more effective in alleviating deficiency symptoms [
15,
16]. In this work, the existence of SeCys
2, SeMet, and MeSeCys in eggs was mainly concerned. HPLC-ICP-MS is one of the most commonly used methods due to its high sensitivity towards Se and tolerance to the sample matrix [
17,
18,
19]. Therefore, a simple procedure applying in routine laboratory to determine the concentrations of individual seleno-amino acides (SeCys
2, SeMet, and MeSeCys) in fresh liquid whole eggs was attempted to be developed using HPLC-ICP-MS. Enzymatic hydrolysis was used for releasing the Se-amino acid from proteins. Particular attention was paid to the optimization of enzymatic hydrolysis procedure, and matrix effect in analysis was also critically evaluated. Finally, this method was applied to the Se speciation of fresh egg and cooked egg.
2. Materials and Methods
2.1. Reagents and Solutions
Chemicals/solvents used in this study were analytical reagent or higher. Ultrapure water (Millipore, Burlington, MA, USA) was used in all samples and standard preparations. Seleno-DL-cystine (SeCys2), Methylselenocysteine (MeSeCys, 95%), Seleno-L-methionine (SeMet, 98%), sodium selenite (Se(IV), 99%), and sodium selenate (Se(VI)) were purchased from Sigma-Aldrich (Shanghai, China). The enzymes: Protease XIV (from Streptomyces griseus), Protease XIII (from Aspergillus saitoi), Protease XXIV (from bacterial), Pronase K (from Tritirachium album), Protease VIII (from Bacillus licheniformis), Pronase (from Streptomyces griseus), Papain (from papaya latex), Trypsin (from porcine pancreas), Pepsin (from porcine gastric mucosa) and Lipase (from porcine pancreas) were purchased from Sigma-Aldrich. Ammonium acetate (HPLC grade) was purchased from Fisher Scientific (Shanghai, China). Methanol (HPLC grade) was purchased from Honeywell Burdick & Jackson (Muskegon, MI, USA). Tris(hydroxymethyl)amino methane hydrochloride and Tetrabutyl-ammonium hydroxide (TBAH 40 wt.% solution in methanol) was obtained from Shanghai Macklin Biochemical Co., Ltd. (Shanghai, China). NaH2PO4·2H2O, Na2HPO4·12H2O, NaHCO3, and NH4HCO3 were purchased from Beijing Chemical Works (Beijing, China).
The certain amount standards of five Se species were each accurately weighed and transferred into individual 50 mL brown glass volumetric flasks. They were dissolved with ultrapure water to produce five Se species standard stock solutions of 50 mg L−1 (as Se element). The stock solutions were stored at 4 °C in dark and used within one month. A mixed standard working solution (5 mg L−1) containing equal concentrations of five Se species was prepared from these individual stock solutions by the gradient dilution method and serially diluted to make 2, 5, 10, 30, 50, and 100 μg L−1 standards.
2.2. Sample Collection and Preparation
The liquid whole egg sample that used for all of optimizations was made up of egg white and egg yolk. In order to ensure the homogeneity of liquid whole egg sample, several eggs of one brand were sufficiently mixed in a beaker using an electric eggbeater. Then homogenized liquid whole egg was divided into PTEF sample vials (50 g per bottle) under nitrogen gas protection, and stored in freezer (−70 °C). Before sample pretreatment, the liquid whole egg sample was taken from freezer (−70 °C) and thawed at room temperature.
The Se-enriched eggs of one brand used in cooking processing were obtained in local store. The boiled egg sample was prepared by fresh egg immersed in 500 mL tap water, then boiled for 15 min. Then the samples were cooled to room temperature, peeled and mixed with a mixer. The poached egg sample was prepared by peeling fresh egg immersed in 500 mL of boiling tap water for 10 min. Then the samples were drained, cooled to room temperature and mixed with a mixer. The egg flower soup was prepared by mixed fresh egg liquid poured in 500 mL of boiling tap water for 2 min. Then the solid was drained, cooled to room temperature and mixed with a mixer. The steamed egg custard was prepared by the egg mixture (fresh egg liquid:water = 1:1.5) steamed for 10 min in 300 mL boiled tap water. Then the solid was cooled to room temperature and mixed with a mixer. The experimental procedures were carried out in triplicate. Selenium was not detected in tap water used for cooking.
2.3. Instrumental Analysis
An Agilent 7900 ICP-MS (Agilent Technologies, Santa Clara, CA, USA) was used for establishing the method. The optimized settings of ICP-MS were as follows: sampling depth, 8 mm; RF power, 1550 W; temperature of the atomizer chamber, 2 °C; carrier gas flow rate, 0.85 L min−1; make-up gas, 0.20 L min−1; He gas flow rate, 3.8 mL min−1; acquisition mode, time resolved analysis (TRA); monitored isotope, 78Se and 80Se; integration time, 0.5 s.
For HPLC, an Agilent 1260 Infinity II LC system (Agilent Technologies, Santa Clara, CA, USA) with a binary pump and autosampler were used. The column outlet of HPLC system was connected to micro-Mist nebulizer using PEEK tubing (0.25 mm i.d. × 104 cm length). The mobile phase in ion-pairing reversed-phase chromatography (Columns: Agilent Extend C18 (4.6 mm × 250 mm, 5 μm), Agilent Eclipse XDB C18 (4.6 mm × 250 mm, 5 μm), Agilent Eclipse Plus C18 (4.6 mm × 250 mm, 5 μm), and Agilent StableBond (4.6 mm × 250 mm, 5 μm)) was composed of 0.5 mM TBAH, 10 mM ammonium acetate, and 2% methanol (v/v). The pH of the solution mentioned above was adjusted with adding acetic acid to 5.5. The mobile phase in anion-exchange chromatography (Column: Hamilton PRP X-100 (4.1 mm × 250 mm, 10 μm)) was composed of 5 mM citric acid (pH = 5.0). Before use, they were filtered through 0.45 μm filters and degassed by ultrasound. The flow rate was set to 1 mL min−1. 50 μL of sample was injected using an auto-sampler device. The samples were separated at room temperature (25 °C).
2.4. Microwave Digestion for Total Se Determination
A sample (2 g whole egg sample or 2 mL supernatant of extracts) was digested with a mixture of 5 mL of HNO3 and 2 mL of H2O2 using closed-vessel microwave digestion system (TOPEX, PreeKem, Shanghai, China). The digestion conditions were as follows: 3 min at 80 °C, 3 min at 100 °C, 3 min at 130 °C, 3 min at 160 °C, and 25 min at 190 °C. The volume of solution was reduced below 1 mL using an electric evaporation block at 120 °C. After cooling down, the digest was transferred to volumetric flask, diluted to 25 mL with ultrapure water, and filtered through a 0.45 μm filter. The procedure was performed in triplicate and blank tests were also carried out. The accuracy and precision of this method were validated against reference material GBW 10018 (National Research Center, Beijing, China).
2.5. Extraction of Se Species from Egg Using Different Procedures
Five extraction procedures, water extraction, acid extraction (0.1 M HCl), basic extraction (0.1 M NaOH), buffer extraction (25 mM ammonium acetate buffer containing 5% of methanol (v/v)), and enzymatic hydrolysis were studied. Except for enzymatic hydrolysis, four extraction procedures were carried out as follows: 10 mL of corresponding solution was added to 2.5 g of homogenized liquid whole egg in 50 mL centrifuge tube. Samples were sonicated for 30 min at room temperature. Then, the mixtures were thoroughly homogenized by shaking in water bath shaker (165 rpm, 37 °C) for 18 h. After extraction process, samples were centrifuged for 5 min at 10,000 rpm. The supernatant was transferred to other centrifuge tube and stored at −70 °C until analysis. Measurements of total Se (for extraction yield) in extracts were performed by microwave digestion inductively coupled plasma mass spectrometry method. For Se species analysis, the extracts were filtered using 10.0 kDa ultrafiltration membranes (Merck Millipore Ltd., Tullagreen, Carrigtwohill, County Cork, Ireland). In the batch of enzymatic hydrolysis, 10 mL of ultrapure water were added to 2.5 g of liquid whole egg in 50 mL centrifuge tube with sonicating for 30 min. Then 50 mg protease XIV was added to the centrifuge tube. Other details of the experiment were the same as that shown above. The procedure was performed in triplicate and blank tests were also carried out.
2.6. Optimization of the Enzymatic Hydrolysis Procedure
In this section, the parameters of enzymatic hydrolysis procedures (i.e., extraction solution, types and amount of enzyme) were optimized. The five extraction solutions (ultrapure water, Tris-HCl (100 mM, pH = 7.5), PBS (100 mM, pH = 7.5), NaHCO3 (100 mM, pH = 8), and NH4HCO3 (100 mM, pH = 8) were studied in the system with 50 mg protease XIV. The extraction procedures of different enzyme type and enzyme usage were investigated under Tris-HCl (100 mM, pH = 7.5) buffer solution. Other details of experiment (i.e., experimental temperature, time and so on) were the same as that listed in the previous section. Measurements of Se species in the extracts were performed by HPLC-ICP-MS.
Meanwhile, spike recovery test was also applied. A mixture of SeCys2, MeSeCys, and SeMet (0.2 μg g−1 (in egg)) was added to the sample. The spiked sample was mixed thoroughly in a vortex mixter (IKA, Staufen, Germany) for several minutes and then placed for 2 h in order to make the added Se species mixed well with the sample. Then the pretreatment procedure of spiked sample was the same as unspiked sample. Optimum conditions of enzymatic hydrolysis were selected by comprehensive consideration the concentration of Se species extracted from unspiked egg and the spike recovery of spiked sample.
2.7. Method Validation
2.7.1. Linearity
The linearity of the method was evaluated within the standard concentration range for liquid whole egg. Linear regression (weighted 1/x2) was used to produce the best fit for the concentration/peak area ratio relationship for SeCys2, MeSeCys, SeMet, Se(IV), and Se(VI) in ultrapure water. The limit of detection (LOD) and quantitation (LOQ) was defined as the concentration corresponding to 3 times and 10 times signal to noise (S/N), respectively.
2.7.2. Recovery Assay
The accuracy and precision of the method were characterized by spiked liquid whole egg. The calculated volumes of mixed standard solutions of Se species were added to samples to generate fortified samples with three different spiked concentrations (0.1, 0.2 and 0.4 μg g−1). Subsequently, enzymatic hydrolysis and HPLC-ICP-MS detection were performed using the optimal conditions. Five replicate treatments for each spike concentration were carried out. The quantitative results by external calibration method and standard addition calibration method were used for calculating the spike recovery, respectively.
2.7.3. Matrix Effect
Matrix effect refers to the matrix often significantly interfering with the analyte analysis process. It is an important parameter that affects the selectivity and sensitivity of quantitative analysis, and the matrix effect is calculated with the following Equation (1):
where
ME (%) is matrix effect;
k1 is the slope of matrix standard curve;
k2 is the slope of solvent standard.
The matrix effects can be divided into three regions according to the value of ME (%). No matrix effect is considered when ME is in the range of −20–20%. When ME is between 20 and 50% or between −50 and −20%, there is a medium matrix effect, while a strong matrix effect is less than −50% or more than 50%. Positive and negative values mean signal enhancement and suppressions induced by matrix, respectively [
20].
3. Results and Discussion
3.1. Evaluation of Different Sample Extraction Procedures
The aim of this study was to establish a method that could both efficiently extract of Se species and be able to keep the original Se speciation information in egg. For this purpose, several sample preparation methods (i.e., extraction with nonbuffered and buffered solution, enzymatic hydrolysis) were selected for Se speciation of liquid whole egg sample [
2,
16,
17,
18,
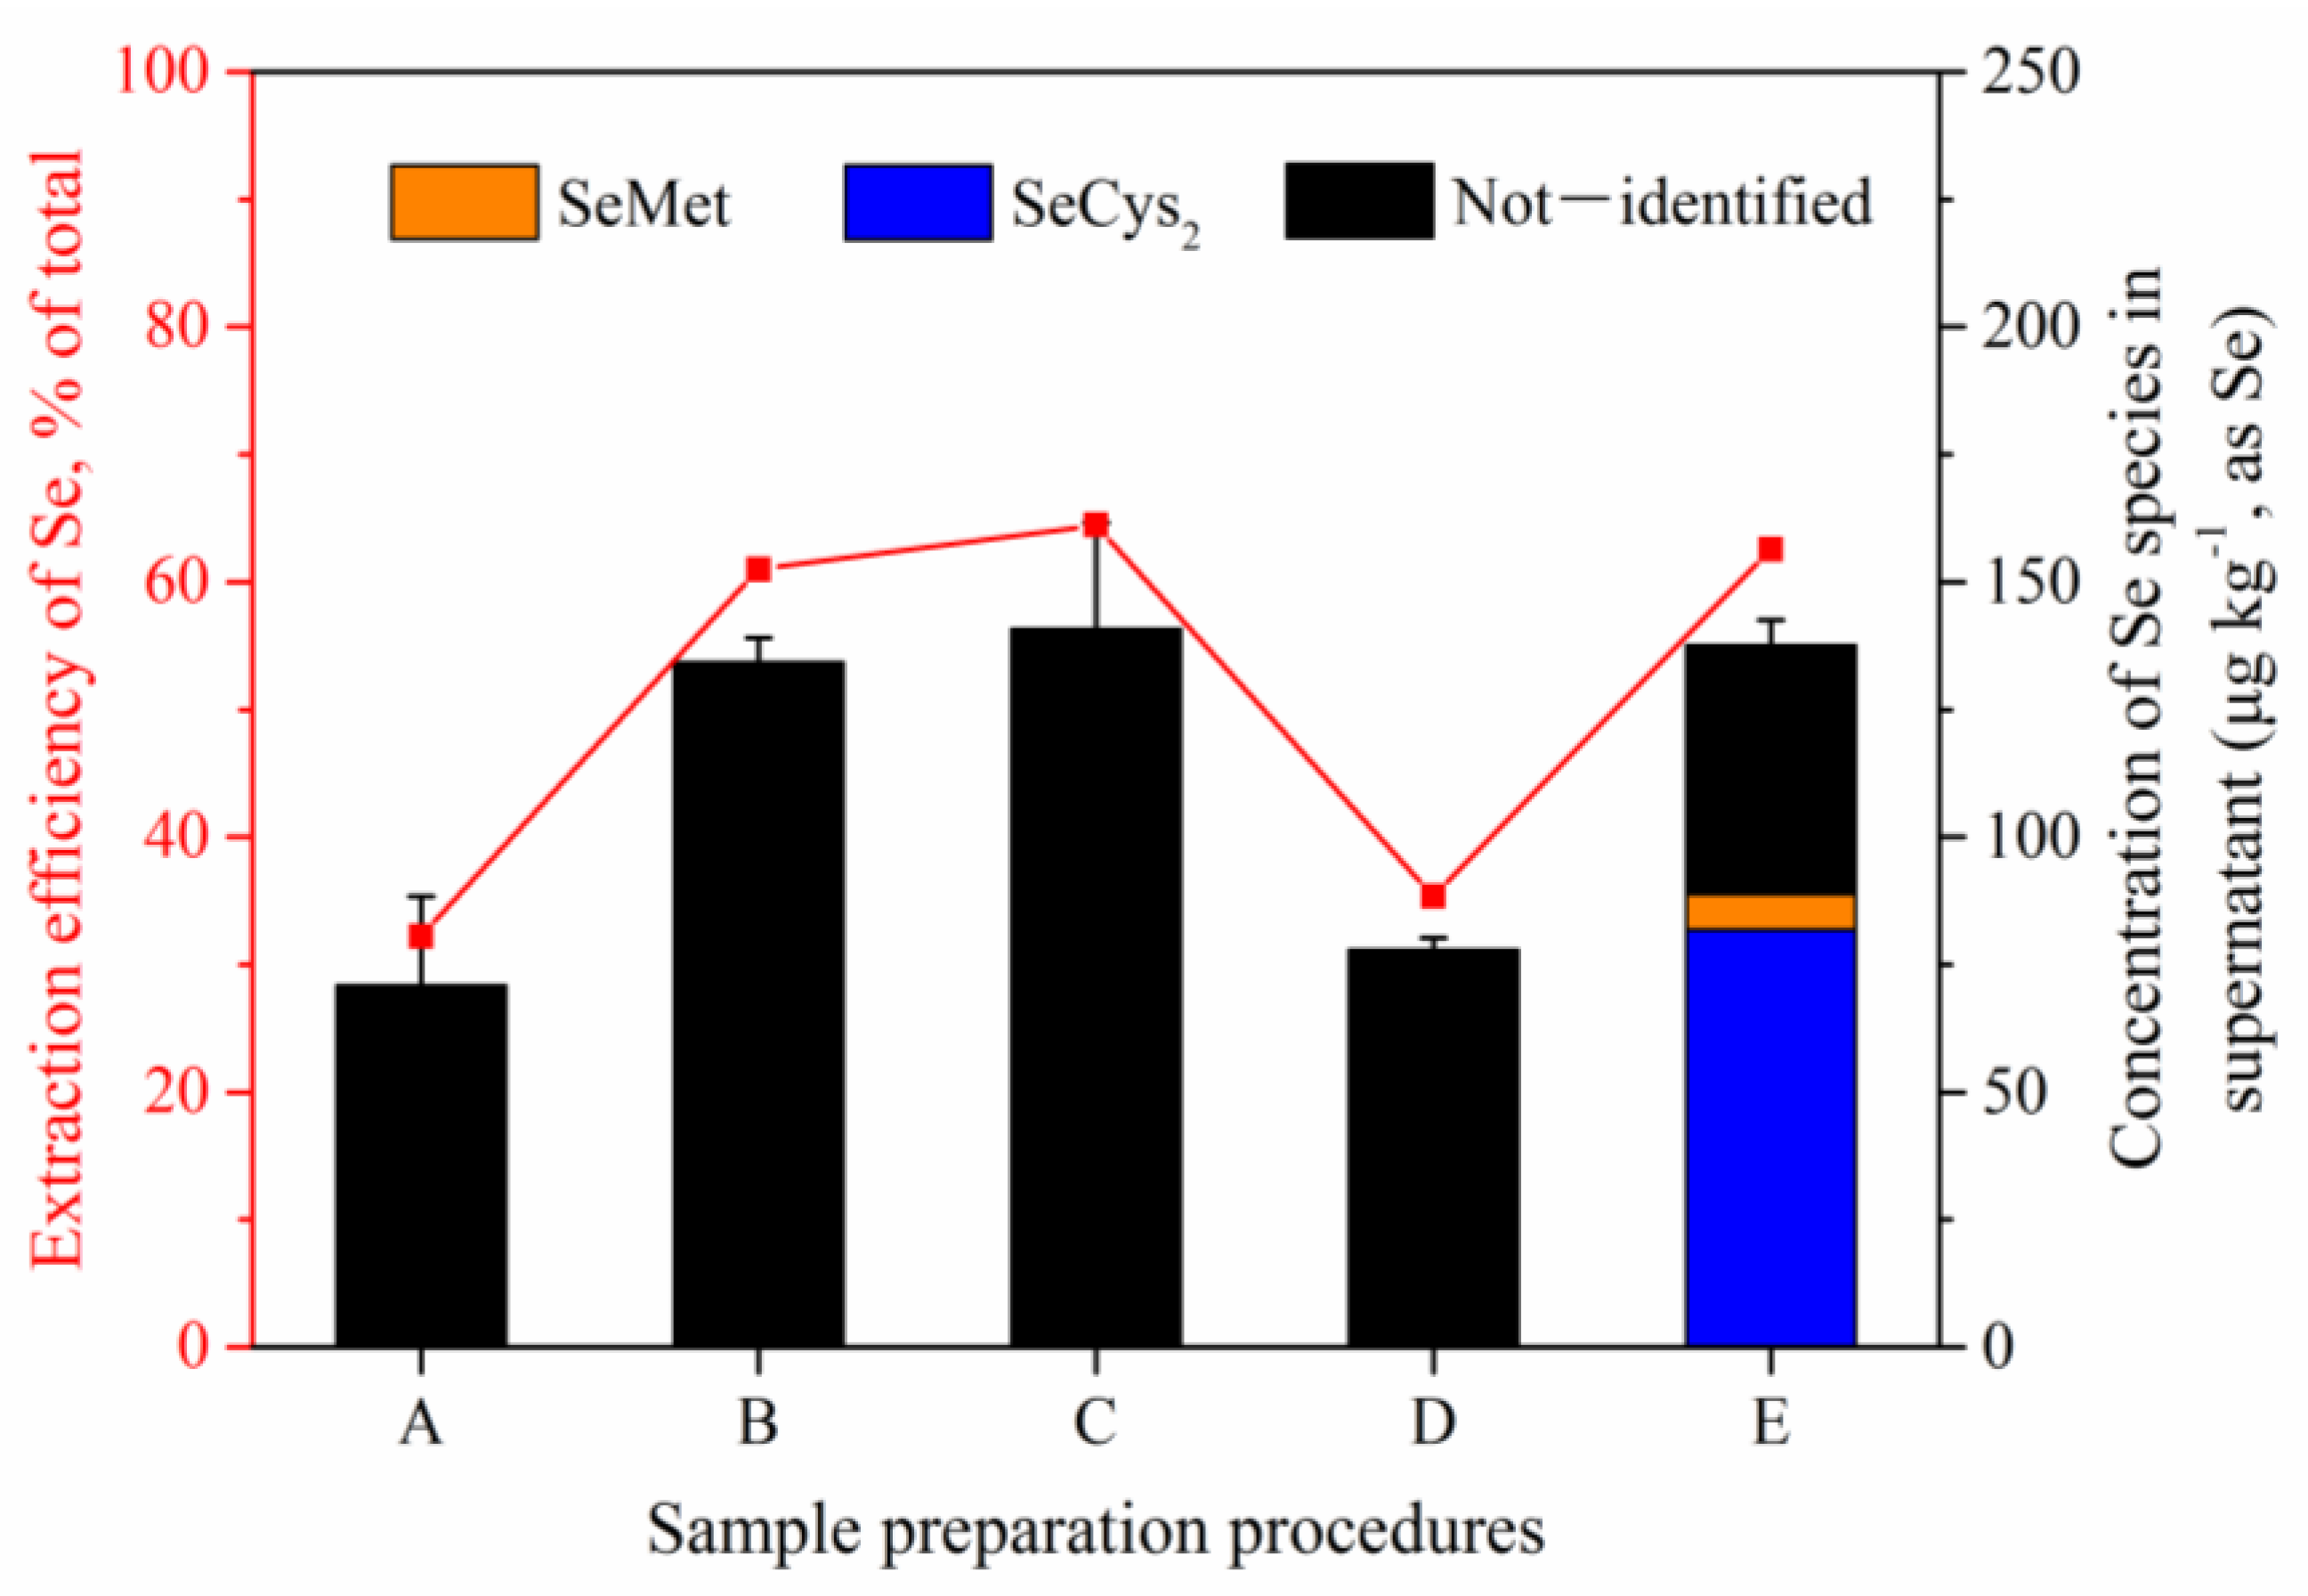
19]. The concentration of total Se in supernatants under different preparation procedure was determined by microwave-ICP-MS. The extraction efficiency of Se was calculated by following equation: extraction efficiency (%) = amount of Se detected in supernatant/amount of Se detected in liquid whole egg × 100.
The extraction efficiencies of Se with different pretreatment procedure (extraction with ultrapure water, HCl, NaOH, ammonium acetate buffer, or protease XIV) were shown in
Figure 1. Compared with the pretreatment method of ultrapure water and buffer solution, the concentrations of Se extracted with HCl, NaOH and enzyme were higher, accounting for more than 60% of the total Se content (218.40 ± 21.10 μg kg
−1) of egg (
Figure 1). Then, the supernatant was analyzed by HPLC-ICP-MS for Se species (
Figure 1 and
Figure S1). As shown in
Figure S1, no peak was observed in the chromatogram of supernatant extracted with HCl, and two unknown peaks were observed in that with NaOH. However, large amounts of target organic Se species (SeCys
2 and SeMet) were observed in the system with enzymatic hydrolysis. The concentrations of SeCys
2 and SeMet were 81.80 ± 0.53 μg kg
−1 and 6.96 ± 0.20 μg kg
−1 (as Se), respectively. According to reports, the intake of Se converted by hen organism was bonded to protein and present mainly in organic forms in eggs [
13,
14]. The results of Se species extracted from egg by enzymatic hydrolysis were consistent with this conclusion. Enzymatic hydrolysis method had high extraction efficiency and could guarantee the integrity of Se species in samples [
21]. Therefore, enzymatic hydrolysis was selected as the pretreatment method for Se speciation of egg, and the optimization of enzymatic hydrolysis was investigated below.
3.2. Optimization of Enzymatic Hydrolysis Parameters
3.2.1. Extraction Solution
In the literature, different extraction solutions have been applied to a variety of food matrices to achieve high extraction efficiency of Se species from samples [
7,
22]. In this work, the study of extraction solutions was carried out both by comparing the extracted original concentration of Se species from eggs and the results of spike recovery test. The experiment results were listed in
Table 1.
As shown in
Table 1, the extracted amounts of three Se species were affected largely by extraction solution. The sum of extracted three Se species using Tris-HCl buffer solution was largest among five extraction solutions, and the value was 92.93 ± 0.25 μg kg
−1, which accounted for 42.5 ± 0.1% of the total Se found in eggs. Meanwhile, the sum of three Se species extracted by PBS buffer solution was the lowest (45.01 ± 1.10 μg kg
−1). But interestingly, the spike recoveries of SeCys
2, MeSeCys, and SeMet were influenced by extraction solution slightly. The average spike recoveries of SeCys
2, MeSeCys, and SeMet with different extraction solutions were 64.5 ± 8.3%, 66.9 ± 9.6%, and 79.6 ± 0.8%, respectively. The Se species added to samples were water-soluble amino acids (SeCys
2, MeSeCys, and SeMet), which were different from that bound to actual samples. Therefore, activity of enzyme influencing by extraction solution affected slightly on the spike recoveries of three Se species. Considering extracted concentrations from egg and spike recoveries of Se species in different extraction solution system overall, Tris-HCl buffer solution (100 mM, pH 7.5) was chosen as the optimal extraction solution in this study.
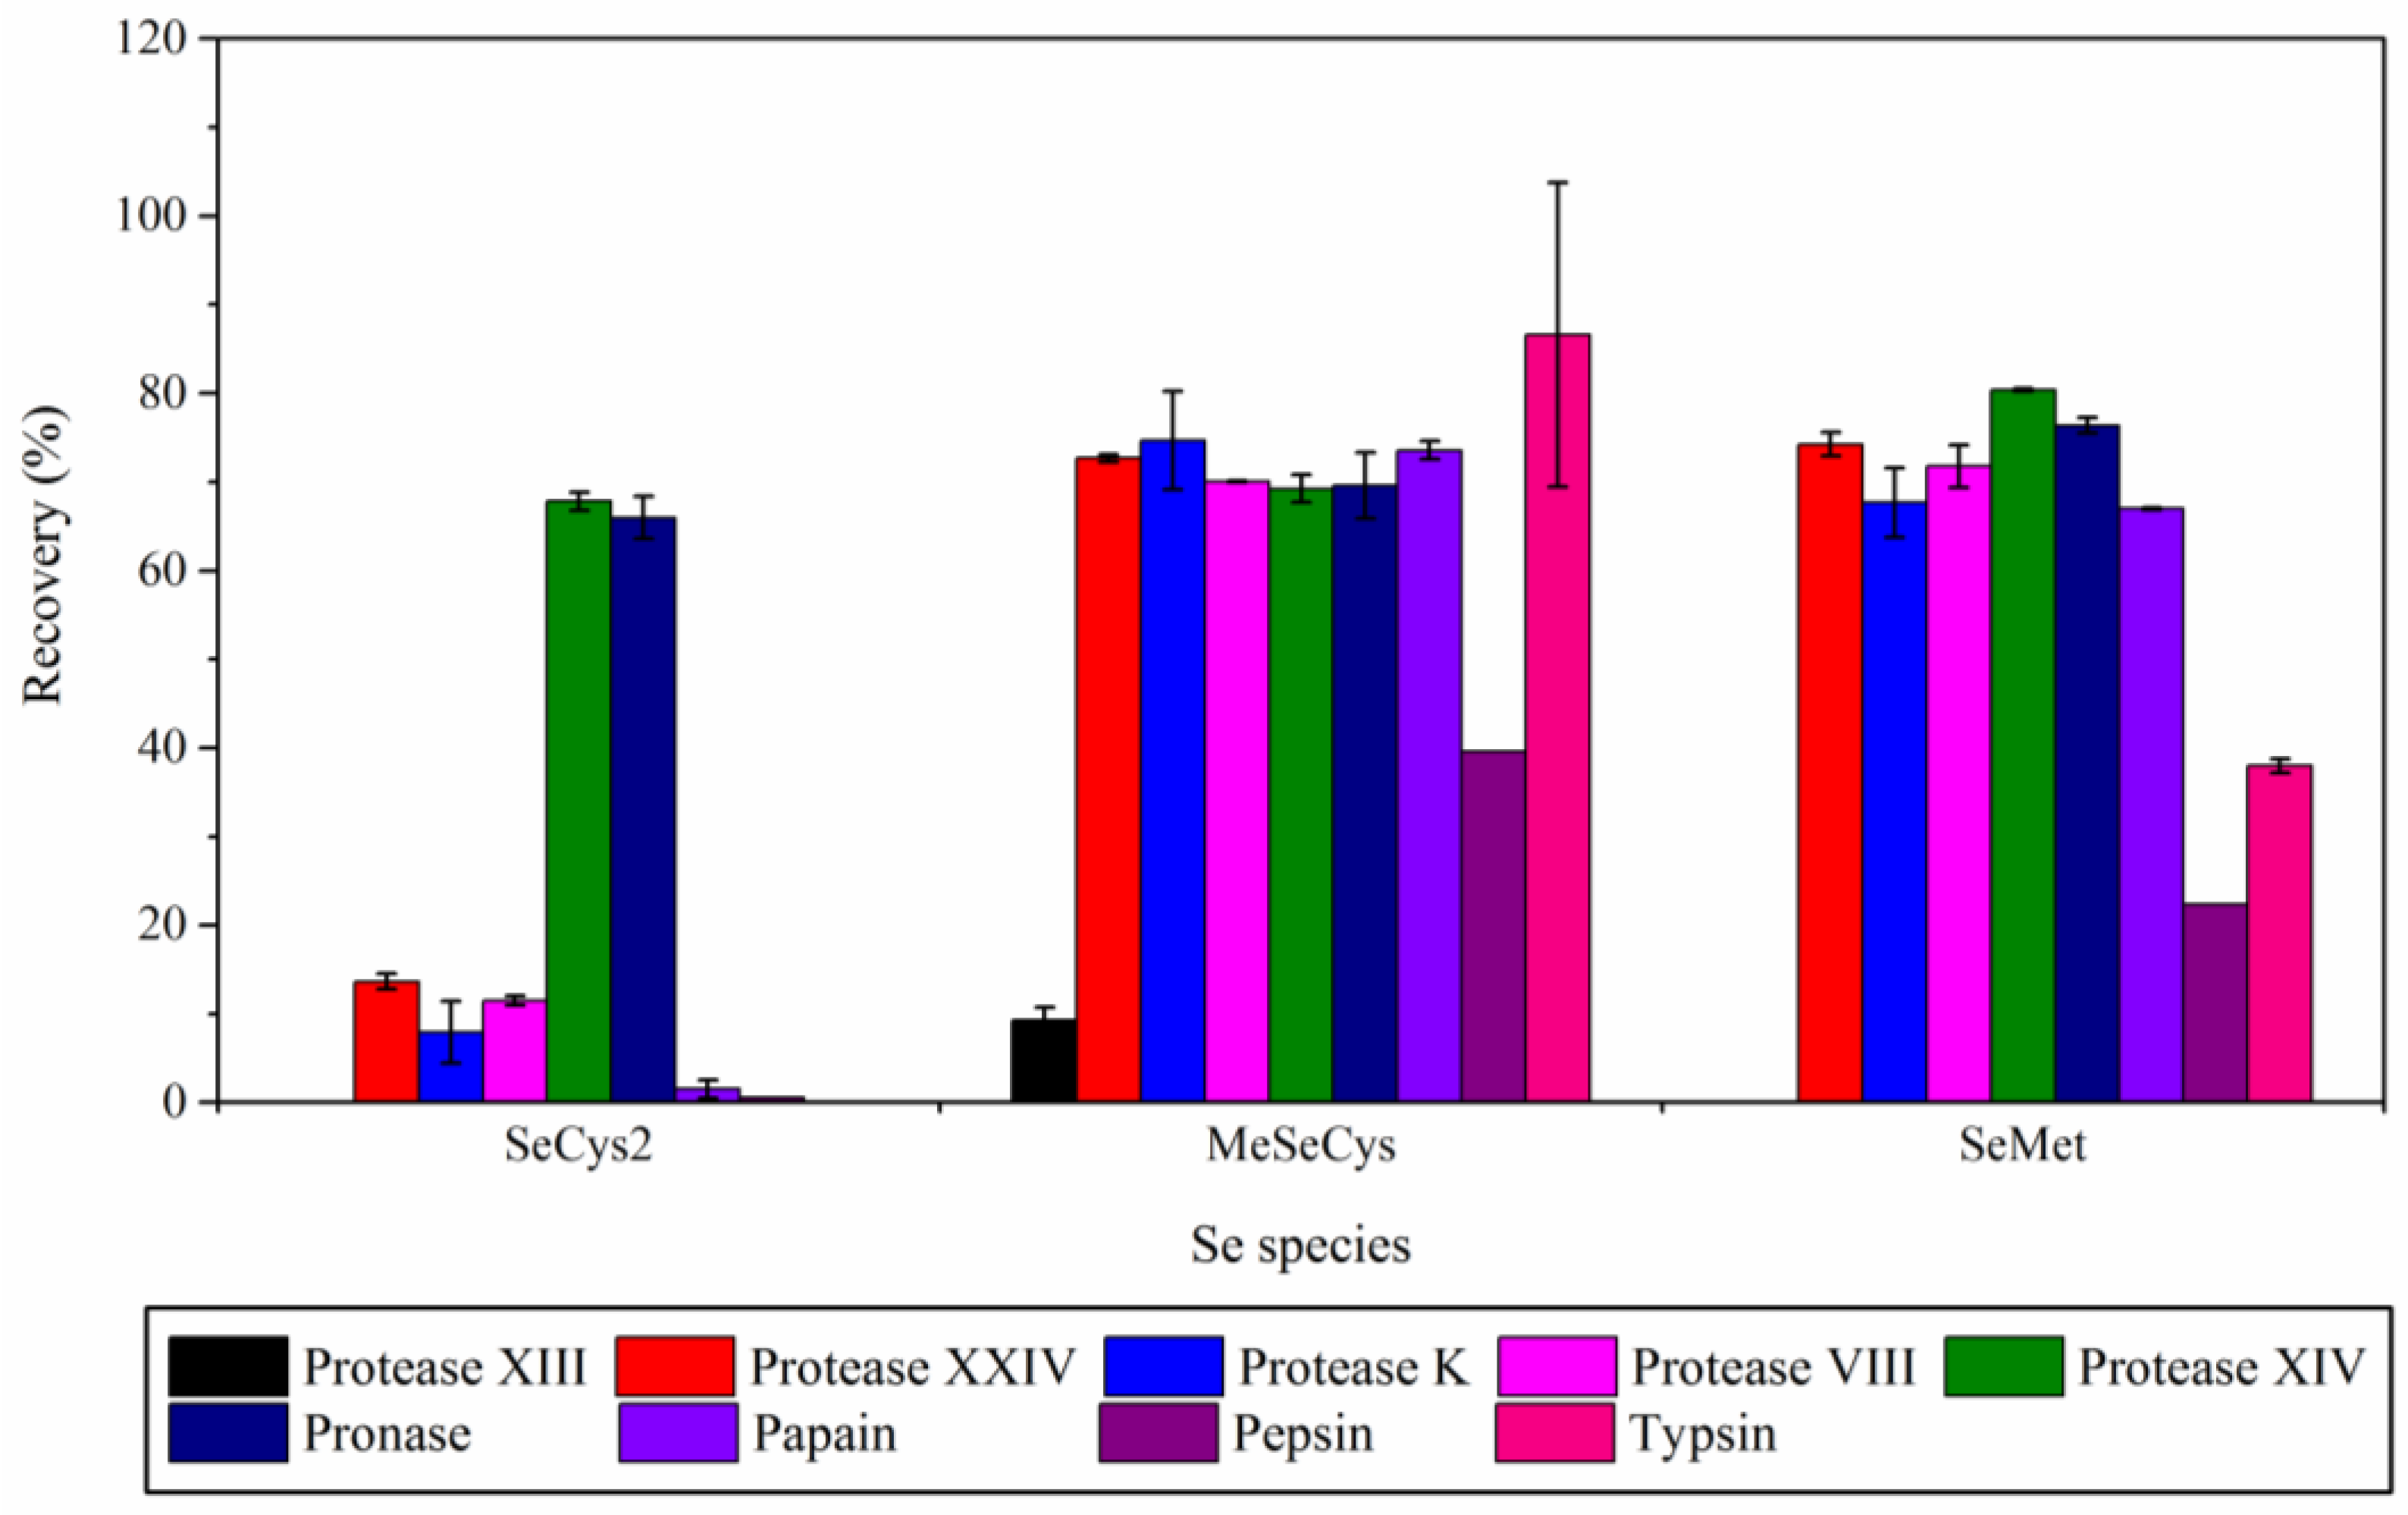
3.2.2. Protease
Recently, the common proteases developed in market are mainly animal-derived proteases, plant-derived proteases and microbial-derived proteases. According to previous studies, this work selected animal-derived proteases (pepsin and trypsin), plant-derived proteases (papain), and microbial-derived proteases (protease XIII, protease XXIV, protease K, protease VIII, protease XIV, and pronase) to evaluate the extraction of Se species in liquid whole egg [
2,
21,
22,
23]. The spike recoveries of three Se species in system with different enzymes were shown in
Figure 2.
As shown in
Figure 2, the spike recoveries of three selenium species in system with animal-derived protease were poor. In trypsin system, SeCys
2 was almost not extracted (the spike recovery was less than 10%), while the spike recovery of MeSeCys was 86.6%. In pepsin system, the spike recoveries of three Se species were all below 40%. In plant-derived protease system (i.e., papain), SeCys
2 was not extracted while the spike recoveries of other two Se species were 73.6% for MeSeCys and 67.0% for SeMet. Among the microbial-derived proteases, protease XIV and pronase were suitable for the extraction of three Se species from eggs. In the enzymatic hydrolysis procedure with protease XIV or pronase, the spike recoveries of three Se species were both above 67.8%.
It was worth noting that the spike recoveries of three Se species in system with protease XIV or pronase were similar, which might be attributed to the same source of two enzymes. The highest spike recovery of Se from antarctic krill samples was also achieved by pronase E [
21]. In addition, the concentration of Se species (85.74 ± 1.36 μg kg
−1 for SeCys
2, and 8.23 ± 0.25 μg kg
−1 for SeMet) extracted from unspiked sample by enzymatic hydrolysis system with pronase was largest. Finally, enzymatic hydrolysis procedure with pronase was chosen for the quantitative Se species extraction of liquid whole eggs in this work.
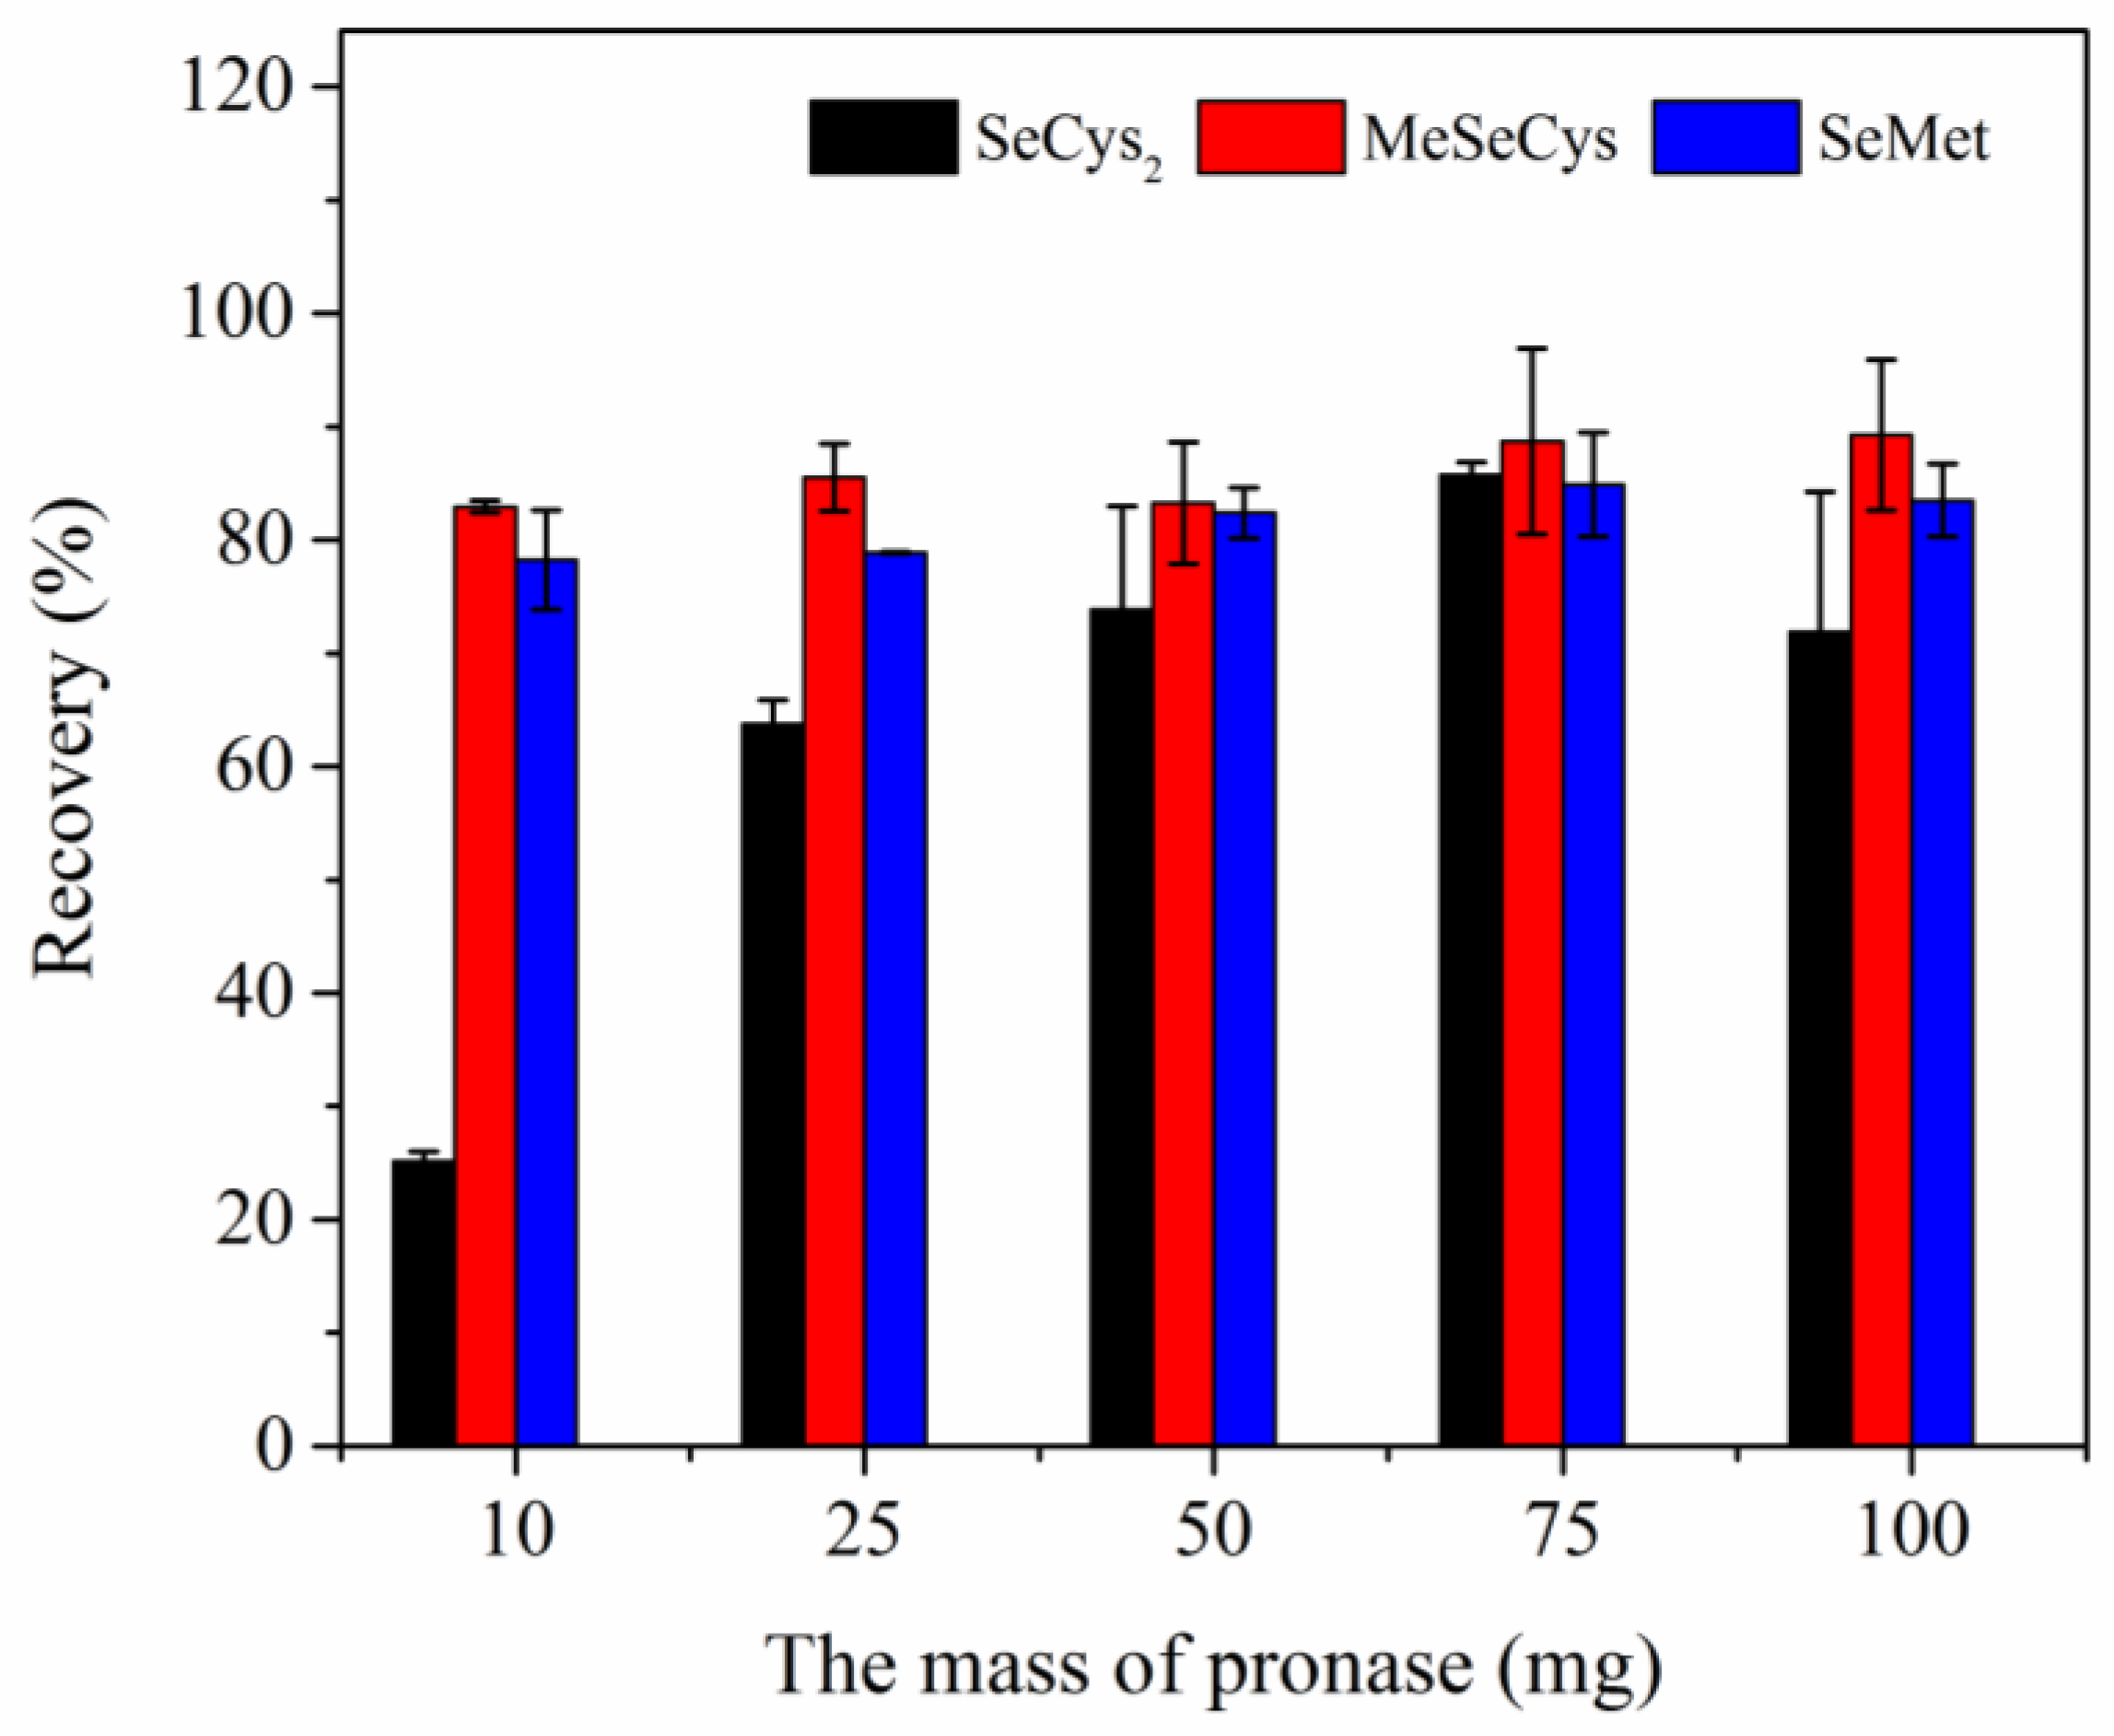
3.2.3. Pronase Usage
Optimization of enzyme usage was performed to find out the optimal Sample/Enzyme ratio in extraction step. Three Se species in egg sample were extracted using 10.0 mL of 100 mM Tris HCl (pH 7.5) containing varying amounts of pronase (10, 25, 50, 75, and 100 mg) for 18 h. As shown in
Figure 3, the spike recoveries of SeCys
2 and SeMet increased with increasing the amount of pronase (10–75 mg). When the amount of pronase reached to 100 mg, the spike recoveries of SeCys
2 and SeMet were decreased compared to those of 75 mg pronase system. And the maximum spike recoveries were obtained under the system containing 75 mg of pronase. On the contrary, the spike recovery of MeSeCys did not change obviously with the amount of pronase increasing.
The Se species in unspiked egg sample extracted by enzymatic hydrolysis with different pronase usage were also analyzed in this work. The experiment results showed that extracted concentration of SeCys
2 was significantly affected by the usage of pronase (10 mg: 22.76 ± 2.36 μg kg
−1 (as Se); 75 mg: 87.94 ± 3.07 μg kg
−1 (as Se)). When the usage of pronase in system was small, the enzymatic hydrolysis of protein in eggs was incomplete. With the usage of pronase increasing from 75 mg to 100 mg, extracted concentration of SeCys
2 was almost unchanged (75 mg: 87.94 ± 3.07 μg kg
−1 (as Se); 100 mg: 89.16 ± 3.90 μg kg
−1 (as Se)). This result was not quite the same as spike recoveries of SeCys
2 (75 mg: 85.8 ± 1.1%; 100 mg: 71.9 ± 12.4%). In addition, the extraction concentrations of other two Se species were affected slightly by the usage of pronase in system. Finally, 75 mg of pronase was selected as the optimal usage in further experiments for 2.5 g of liquid whole egg sample. The optimal enzyme/sample ratio of eggs (3:100) in this study was higher than that in enzymatic hydrolysis of chicken breast sample (1:10) [
2]. This may be due to higher moisture content (70–80%) of liquid whole egg than that of chicken breast lyophilized powder sample.
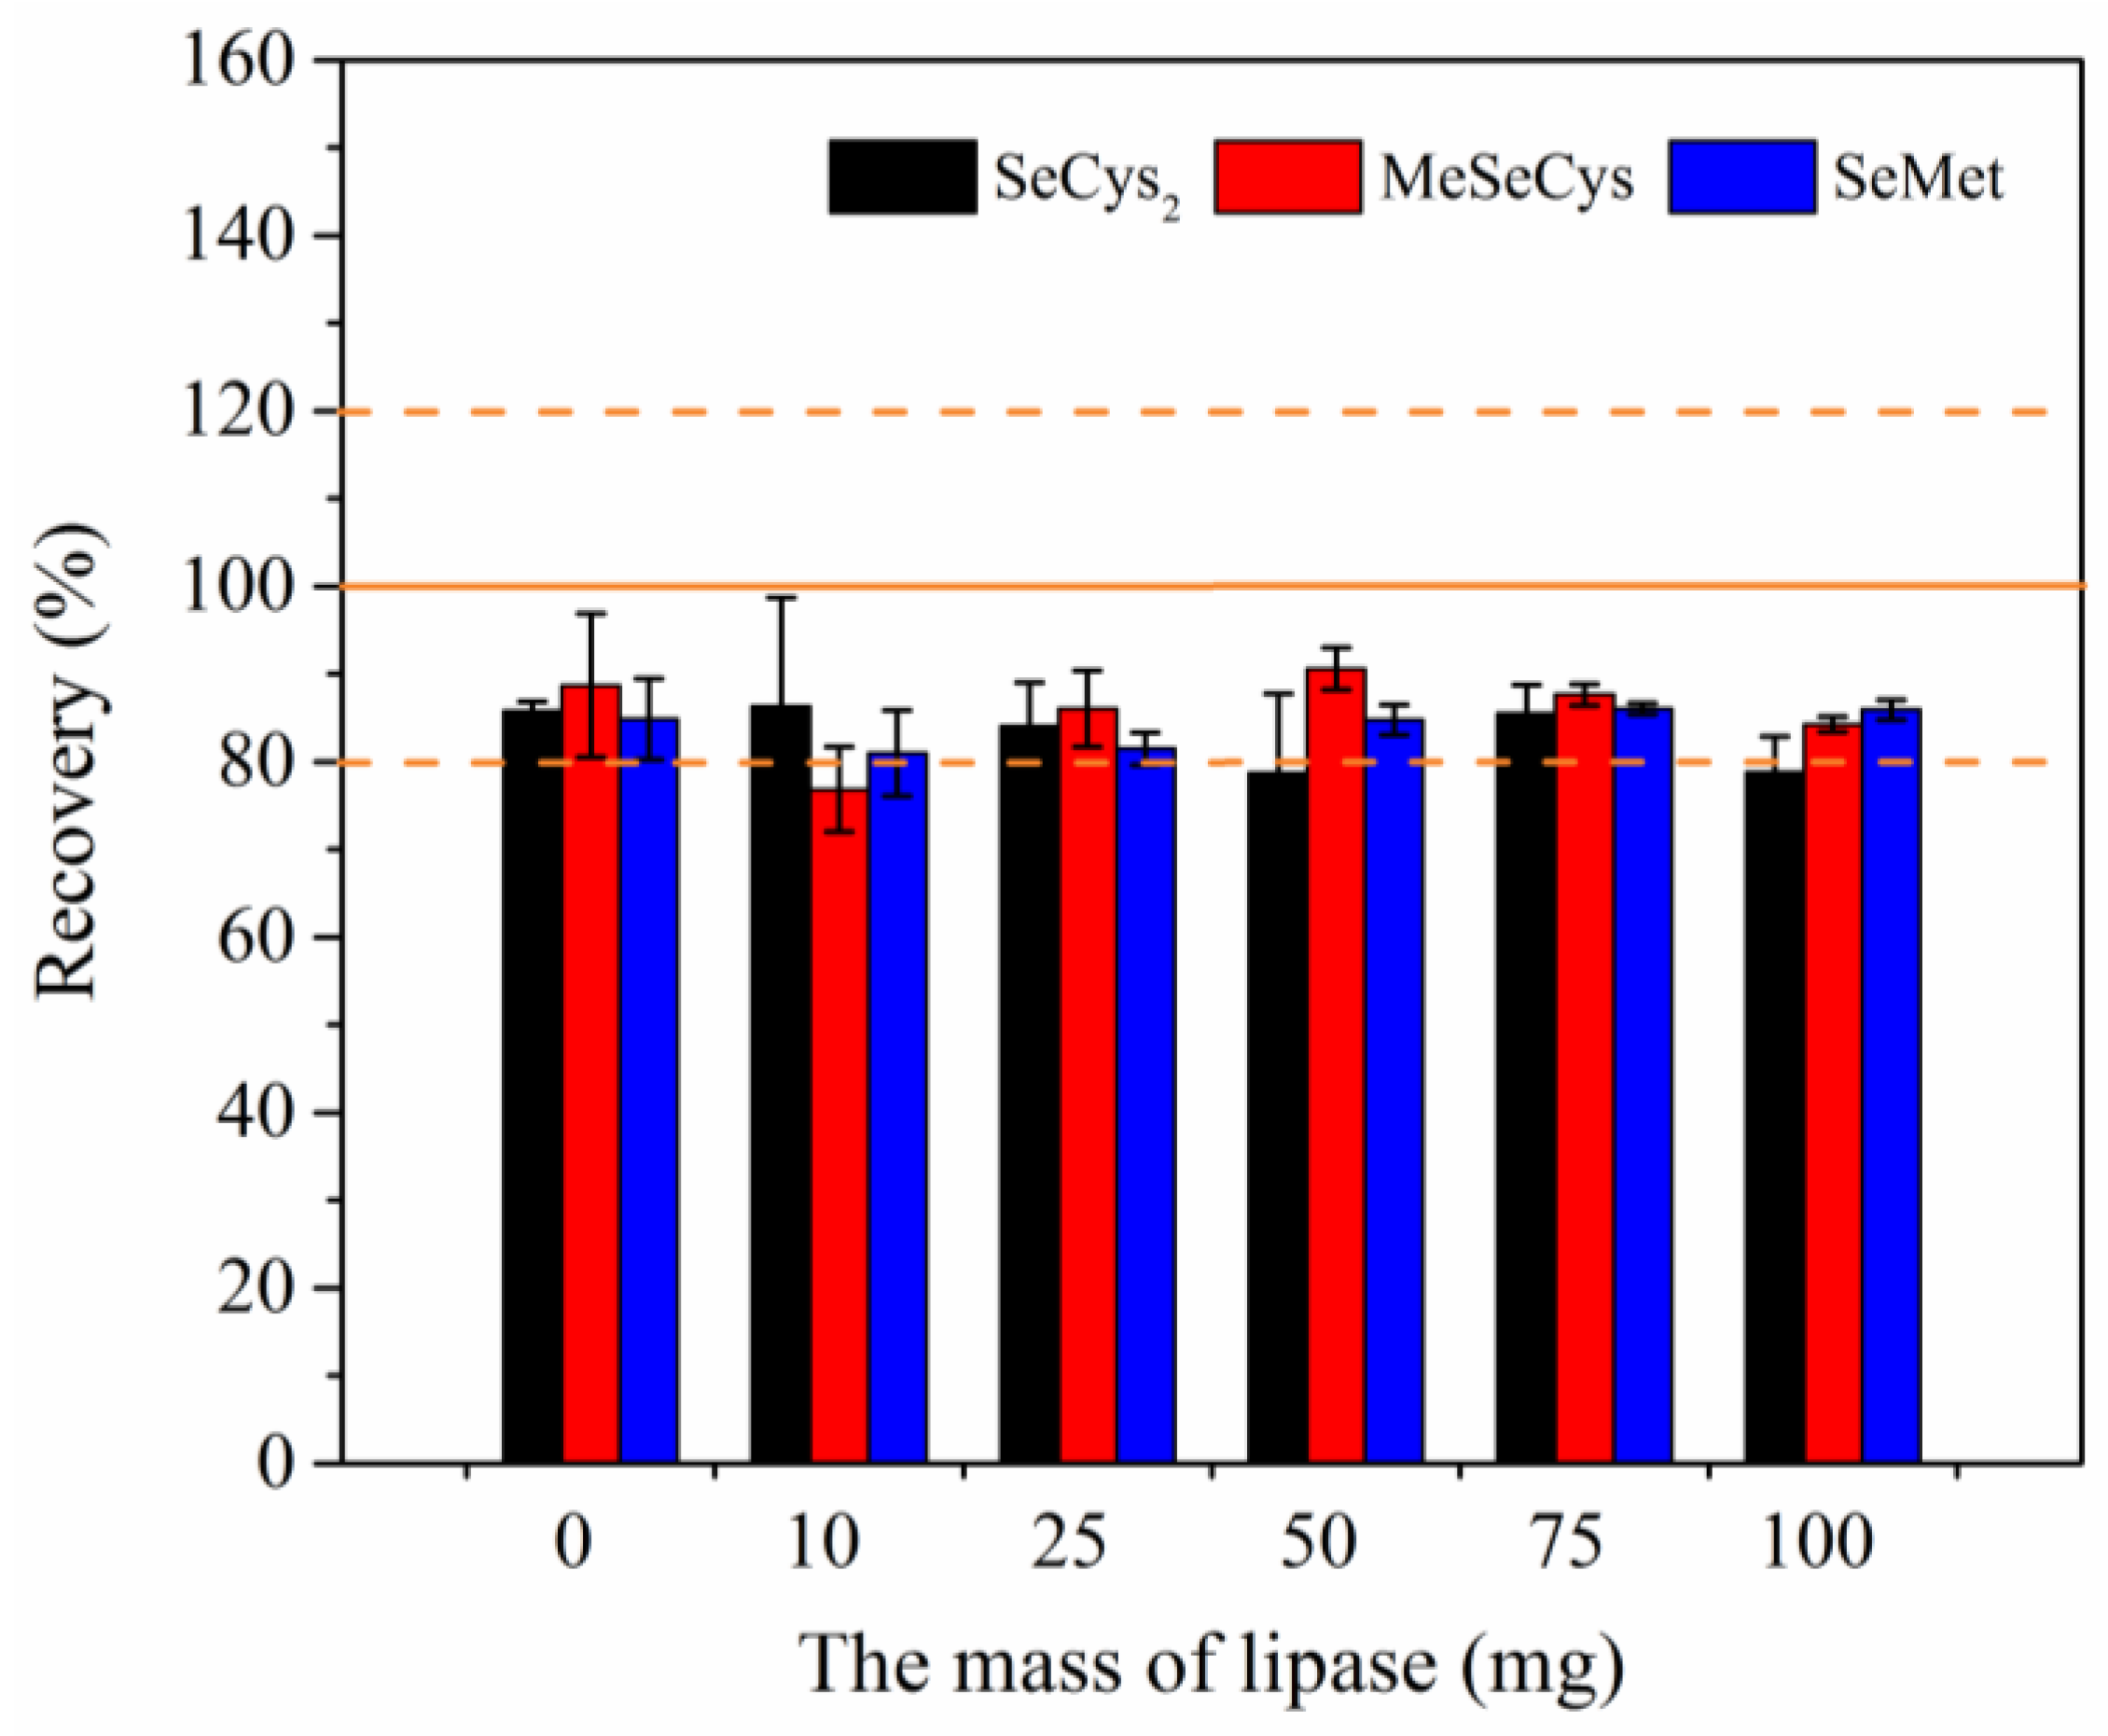
3.2.4. Lipase Usage
As is well known, eggs are not only rich in protein (14–16%) but also high in fat (10–12%). The analysis of Se species was interfered by fat present in sample. Fat cannot be hydrolyzed by protease; therefore, the introduction of lipase in pretreatment process was necessary. In this work, Se in egg sample was extracted using 10.0 mL of 100 mM Tris-HCl (pH 7.5) containing 75 mg of pronase and varying amounts of lipase (0, 10, 25, 50, 75, and 100 mg) for 18 h. And the results were showed in
Figure 4.
As shown in
Figure 4, the spike recoveries of Se species were affected by lipase usage slightly. The average spike recoveries of Se species were 83.2 ± 3.5%, 85.7 ± 4.8%, and 84.0 ± 2.2% for SeCys
2, MeSeCys, and SeMet, respectively. The spike recoveries of three Se species were optimum in the system with 75 mg of lipase (Recovery > 80% and RSD < 5%), as shown in
Figure 4. And in this condition, more Se species extracted from unspiked sample were obtained. The concentration of SeCys
2 was 90.79 ± 5.29 μg kg
−1, and the concentration of SeMet was 17.14 ± 0.95 μg kg
−1. A mixture of 75 mg pronase and 75 mg lipase was selected as the optimal usage of enzyme in further experiments for 2.5 g of liquid whole egg sample. With the addition of lipase, the supernatant of samples became clearer after enzymatic hydrolysis procedure. It was indicated that egg sample underwent a higher extent of enzymatic hydrolysis. The use of lipase made the supernatant easier to filter through 10.0 kDa ultrafiltration membranes.
3.3. Chromatographic Separation
Ion-exchange chromatography and ion-pairing reversed-phase chromatography have been widely used for the separation of Se compounds. In this study, two types of columns as mentioned previously were selected to evaluate their performances in Se species separation. For the ion-pairing reversed-phase chromatography systems, four typical reversed C18 columns, namely, Agilent StableBond (SB-Aq) (4.6 mm × 250 mm, 5 μm), Agilent Extend C18 (4.6 mm × 250 mm, 5 μm), Agilent Eclipse XDB C18 (4.6 mm × 250 mm, 5 μm) and Agilent Eclipse Plus C18 (4.6 mm × 250 mm, 5 μm) were tested. The compositions of mobile phases were given in the section of instrumental analysis.
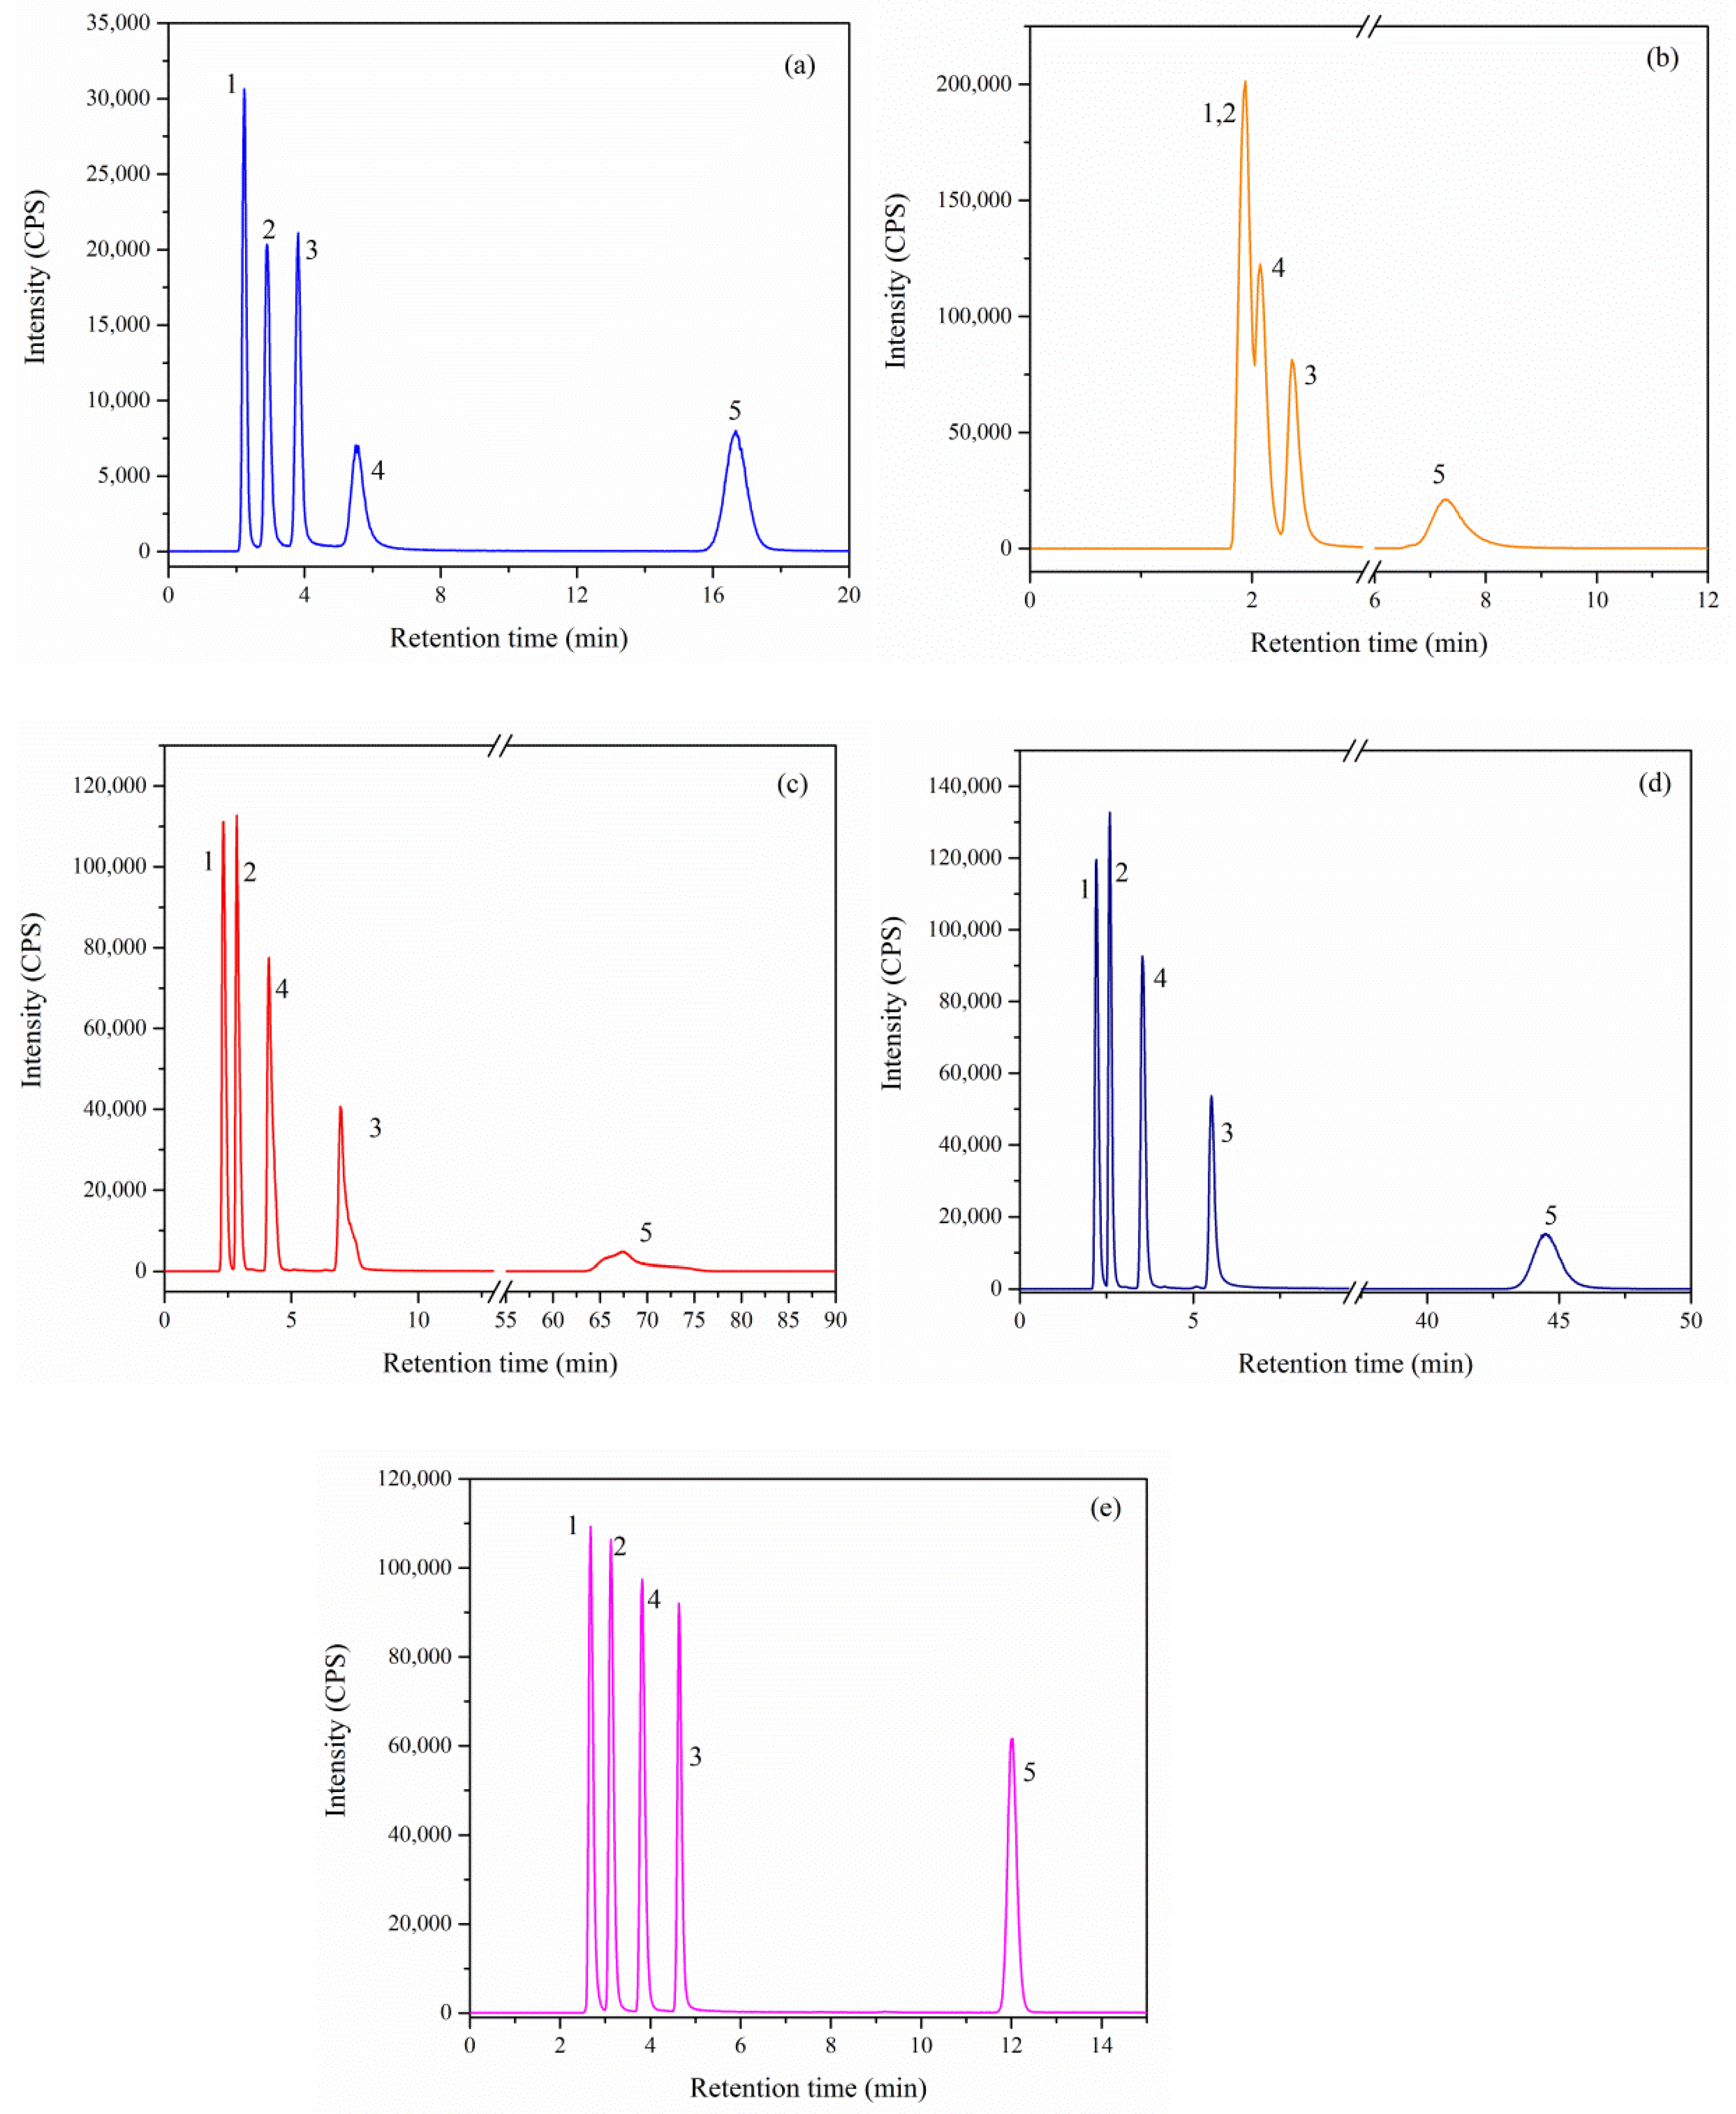
As shown in
Figure 5, five Se species can be well separated on Hamilton PRP X-100 column with citric acid as the eluent within 20 min. The retention times of SeCys
2, MeSeCys, Se(IV), SeMet, and Se(VI) were 2.23, 2.89, 3.82, 5.51, and 16.67 min, respectively. The peak intensity of SeCys
2 (30,615 CPS of peak height) was highest among five Se species. In ion-pairing reversed-phase chromatography, excellent sensitivities of all tested Se species were obtained due to the methanol in mobile phase boost signal intensity for Se by ICP-MS. The peak intensities for five Se species obtained using ion-pairing reversed-phase chromatography were notably 3 times higher than on Hamilton PRP X-100 column (
Figure 5).
Although Extend C18, Eclipse XDB C18, Eclipse Plus C18 and SB-Aq columns have the same retention mechanism, the retention behavior of five Se species were markedly different on these columns. Organic Se species were easily separated on Eclipse XDB C18, Eclipse Plus C18, and SB-Aq columns within 6 min. However, co-elution of three organic Se species was observed on Extend C18 column. Compared with SB-Aq column, the peak shape and intensities for inorganic Se species obtained from Extend C18, Eclipse XDB C18, and Eclipse Plus C18 column were poor. In addition, the retention time of Se(VI) was 67.49 min in Eclipse XDB C18 columns. Overall, for simultaneous determination of organic and inorganic Se compounds, SB-Aq column could provide the least peak broadening and symmetry, as well as closely eluting peaks and satisfactory resolution of both compounds (R > 1.5). Therefore, Agilent SB-Aq column was selected for the further analysis of Se compounds in egg samples.
3.4. Analytical Performance of the Method
The analytical performance data (i.e., calibration curves, linear correlation coefficients, and so on) under optimal instrument conditions were summarized in
Table S1. The working curve of Se species was linear (R > 0.999) in concentration range of 2–100 μg L
−1. The LOQs of HPLC–ICP-MS were calculated as 1.86 μg L
−1 for SeCys
2, 1.62 μg L
−1 for MeSeCys, 1.82 μg L
−1 for SeMet, 2.37 μg L
−1 for Se(IV), and 1.98 μg L
−1 for Se(VI), respectively. In the enzymatic extracts of eggs, except Se species, amino acids and their salts, chlorides and other substances might exist. To determine Se species accurately, matrix effects were evaluated by performing standard addition calibrations and external calibrations. The calculated MEs using Equation (1) were −13% for SeCys
2, 8% for MeSeCys, and 9% for SeMet. These MEs were between −20% and 20%, indicating that there was no matrix effect [
20]. In addition, the values of spike recovery were tested by F-test. At a confidence level of 95%, no significant differences were found. And recoveries of three Se species were in the range from 85.5% to 98.2% (
Table 2), within the limit of 80–120%, showing that the matrix effects could be excluded. Therefore, the method was capable of analyzing three seleno-amino acid in liquid whole egg satisfactorily.
3.5. Determination of Se Species in Real Egg Samples
3.5.1. Se Speciation of Fresh Egg
The developed method was employed for the determination of Se species in different brands of regular eggs and Se-enriched eggs, which were purchased from local stores. As shown in
Table 3, SeCys
2 and SeMet were the dominant Se species in egg, and they added up to about 59 ± 4% of total Se. There was no significant difference in the content of SeCys
2 detected in regular and Se-enriched eggs, but the content of total Se and SeMet had significant difference. The concentration of SeMet increased significantly in Se-enriched eggs. No MeSeCys was identified in all tested egg samples. It was noting that other Se species were not observed in all tested eggs (
Figure S2), and the unknown Se species were accounted for 40% of total Se content. Except for SeCys
2, MeSeCys, and SeMet, Se element could present as other seleno-amino acids (i.e., selenourea, selenoethionine, selenomethionine-Se-oxide, and so on) in organisms [
7,
23,
24]. In further studies, more methods and techniques (i.e., UHPLC-ESI-QqQ-MS/MS or UHPLC-ESI-Orbitrap-MS/MS) should be attempted for the identification of unknown Se species in eggs.
3.5.2. Se Speciation in Egg Cooking Procedures
Eggs are usually consumed using various cooking methods. Several studies have shown that food processing can modify the species distribution [
16,
25]. Therefore, the influence of cooking process on content of total Se and Se species in Se-enriched eggs was evaluated. Once cooked, the samples were submitted to enzymatic hydrolysis by using the optimal conditions applied to fresh egg. The extracts were analyzed by HPLC-ICP-MS. After the cooking processing, new Se species was not observed in egg samples. The percentage of SeCys
2 was 29.3% for boiled egg, 33.9% for poached egg, 30.0% for egg flower soup, and 45.0% for steamed egg custard. Meanwhile, the percentage of SeMet was 25.3% for boiled egg, 25.7% for poached egg, 19.6% for egg flower soup, and 32.3% for steamed egg custard. It was worth noting that the percentages of SeCys
2 and SeMet in steamed egg custard were the highest. The main reason of seleno-amino acid transformation has been attributed to the high temperature applied in cooking that may change the chemical distribution of Se species [
16].
As shown in
Table 4, when eggs were cooked by boiling, a larger amount of total Se was released from egg to water without protection by egg shell. The amount of total Se in aqueous of egg flower soup was as high as 42.8% of total Se in whole egg. Meanwhile, SeCys
2 and SeMet were detected in aqueous. Therefore, when Se-enriched eggs used for cooking egg flower soup, it was recommended that the aqueous and solid were eaten together to ensure the full uptake of Se in eggs.


