Article

Simple and Sensitive Analysis of Clenbuterol in Urine Matrices by UHPLC-MS/MS Method with Online-SPE Sample Preparation

by
Kristián Slíž
1,2,
Dominika Olešová
3,
Juraj Piešťanský
2,4 and
Peter Mikuš
1,2,*
1
Department of Pharmaceutical Analysis and Nuclear Pharmacy, Faculty of Pharmacy, Comenius University Bratislava, Odbojárov 10, 832 32 Bratislava, Slovakia
2
Toxicologic and Antidoping Centre, Faculty of Pharmacy, Comenius University Bratislava, Odbojárov 10, 832 32 Bratislava, Slovakia
3
Slovak Academy of Sciences, Biomedical Research Center, Institute of Experimental Endocrinology, Dúbravská Cesta 9, 845 45 Bratislava, Slovakia
4
Department of Galenic Pharmacy, Faculty of Pharmacy, Comenius University Bratislava, Odbojárov 10, 832 32 Bratislava, Slovakia
*
Author to whom correspondence should be addressed.
Separations 2022, 9(12), 440; https://doi.org/10.3390/separations9120440
Submission received: 21 November 2022 / Revised: 6 December 2022 / Accepted: 12 December 2022 / Published: 14 December 2022

Abstract

:
Clenbuterol is one of the most misused anabolic agents in professional sports. Therefore, the monitoring of clenbuterol in body fluids such as human urine is related to the development of rapid, selective and sensitive analytical methods that produce reliable results. In this work, these requirements were met by a two-dimensional separation method based on online solid-phase extraction coupled with ultra-high performance liquid chromatography–tandem mass spectrometry (SPE–UHPLC–MS/MS). The developed method provides favorable performance parameters, and it is characterized by minimum manual steps (only dilution and the addition of an internal standard) in the sample preparation. A limit of quantification (LOQ) of 0.1 ng/mL, excellent linearity (0.9999), remarkable precision (1.26% to 8.99%) and high accuracy (93.1% to 98.7%) were achieved. From a practical point of view, the analytical performance of the validated SPE–UHPLC–MS/MS method was demonstrated on blinded spiked urine samples from ten healthy volunteers. The estimated concentrations of clenbuterol were in accordance with their corresponding nominal values, as supported by the precision and accuracy data (relative standard deviation ≤5.4%, relative error ≤11%). The fulfillment of the World Anti-Doping Agency’s screening and confirmation criteria indicates that the proposed method is suitable for implementation in routine use in toxicologic and antidoping laboratories. Due to its high orthogonality and separation efficiency, the SPE–UHPLC–MS/MS method should also be easily adapted to the separation of structurally related compounds (such as clenbuterol metabolites). Thus, future antidoping applications could also include monitoring of clenbuterol metabolites, providing a longer detection widow.

1. Introduction

Clenbuterol (Figure 1) is an orally bioavailable, directly acting sympathomimetic agent with a mainly β-adrenergic activity that binds to β2 receptors with high affinity and selectivity [1]. After ingestion, clenbuterol is readily absorbed (70–90%) and slowly eliminated from the body (half-life: 30–36 h) [2]. It is removed from the body mainly unchanged by the renal route (40–60% of the dose administered) and has eight minor Phase I metabolites (generally <6% of the dose administered) [2]. Phase II metabolites are not present [2]. When clenbuterol binds to β2-adrenoceptors, it activates adenylyl cyclase, leading to an increase in the intracellular concentration of the second messenger cyclic adenosine monophosphate (cAMP) and the activation of protein kinase A (PKA) [1]. In the tracheobronchial tree, cAMP and PKA inhibit smooth muscle contraction by opening K+ channels and by down-regulating myosin light-chain kinase activity [1]. For this reason, the most important therapeutic action of clenbuterol is relaxation of the smooth muscle of the airways in the management of reversible obstruction of the airways, such as bronchial asthma and chronic obstructive pulmonary disease [2].
Furthermore, continued use of high oral doses of clenbuterol can elicit an off-target anabolic response in skeletal muscle and a lipolytic response in adipose tissue [3]. Despite the lack of clinical approval for this use, clenbuterol is already available as a performance-enhancing substance in black market products [4]. Due to the potent anabolic and weight loss effects of clenbuterol and its presence in illegal dietary supplements, sold over the Internet, athletes are at risk of misuse [4]. Consequently, clenbuterol is listed in the category of “Other Anabolic Agents” in Section S1.2 of the World Anti-Doping Agency’s (WADA) Prohibited List, and its use in sport is prohibited at all times (both in and out of competition) [5]. However, as observed by WADA accredited laboratories in annual published Anti-Doping Testing Figures Reports, clenbuterol has been attributed to the majority of all adverse analytical findings in the category S1.2 of prohibited substances [6].
The monitoring of clenbuterol in multicomponent biological matrices is linked with the development of advanced, selective and sensitive analytical methods that produce reliable (i.e., both precise and accurate) results [2]. In doping control, WADA currently approves only gas chromatography–mass spectrometry (GC–MS) and liquid chromatography–MS (LC–MS) based approaches [7]. As a GC–MS (or GC–MS/MS) approach requires time-consuming derivatization steps to improve analyte volatility, LC–MS/MS has become the main analytical technique for clenbuterol determination due to its shorter total analysis time and the avoidance of any derivatization procedures [8].
Multiple LC–MS/MS methods have been developed for the identification of clenbuterol on a wide scale of complex matrices, including pharmaceutical preparations [9,10], hair [11,12,13,14], animal tissues [15,16] and recently dried blood spots [17]. Furthermore, various innovative LC-MS/MS methods have been developed for the routine monitoring of clenbuterol in human urine [18,19,20,21,22,23,24]. Sample preparation procedures that were used in these LC–MS/MS analyses included liquid-liquid extraction (LLE) [18,19,20,21] and solid-phase extraction (SPE) [22,23,24]. LLE was characterized by the evaporation of organic solvent and the reconstitution of the analyte by a mobile phase [18,19,20,21]. SPE was characterized by the loading and concentration of analyte and the removal of interfering substances from urine to improve detection in the following instrumental analysis [22,23,24]. Today, SPE has become the preferred sample preparation procedure for doping control analysis in human urine [25]. However, when performed manually [22,23,24], the SPE procedure can be time and resource consuming, and, moreover, due to extensive handling of the sample (more than 10 steps in the process), additional errors can be introduced in the LC–MS/MS analysis.
Therefore, the focus of our study was to develop and validate an advanced ultra-high performance LC–MS/MS (UHPLC–MS/MS) method with minimum sample handling that would offer a combination of the advantages of SPE with a fast and simple dilute-and-shoot method. The sample preparation procedure was based on the online-SPE approach, where an additional extraction column was attached in front of the analytical column via a proper valve system (serving as an interface). The result is a fully automated SPE–UHPLC–MS/MS method for the identification and quantification of clenbuterol in human urine, which has been beneficial in (i) simplifying and reducing the time required for the overall analytical process, (ii) improving the sample throughput (due to a high degree of automatization plus the UHPLC regime), (iii) improving the reliability of the results (due to the minimization of sample handling and losses of the analytes), and (iv) improving selectivity, the prerequisite for unambiguous identification of the analytes in complex matrices (due to a high degree of orthogonality of the multidimensional analytical system).

2. Materials and Methods

2.1. Chemicals and Reagents

The analytical standards for clenbuterol hydrochloride and clenbuterol-d9 hydrochloride (used as the internal standard–IS) were obtained from Sigma-Aldrich (St. Louis, MO, USA). Buffer constituents and solvents, i.e., formic acid (FA), acetic acid (AA), ammonium formate (NH4Fo), ammonium acetate (NH4Ac), methanol (MeOH), acetonitrile (ACN), were obtained from Sigma-Aldrich (St. Louis, MO, USA) and VWR International (Radnor, PA, USA) in LC–MS quality. High-purity water (MPW) was prepared by a Millipore Direct Q water purification system obtained from Merck (Darmstadt, Germany). Negative urine control (SurineTM) was obtained from Sigma-Aldrich (St. Louis, MO, USA).

2.2. Online Solid Phase Extraction (Online-SPE)

The online-SPE was based on a standard LC dual-pump system, in which an additional extraction column was attached before the analytical column via a valve system. As an extraction column, a Poroshell 120 EC-C18 (2.1 × 50 mm, 1.9 μm particle size; Agilent Technologies, Santa Clara, CA, USA) was used. As illustrated in Figure 2, the extraction column was installed upstream to a two-position, eight-port liquid chromatography valve (Agilent Technologies, Palo Alto, CA, USA). For Step 1 (see also Figure 2), the sample loading and washing, the valve was set to position 1–3, which directs the liquid stream through the extraction column and into a waste container. This procedure traps the analyte in the extraction column and flushes the matrix compounds, such as proteins or salts, into the waste [25]. After 6 min, the valve switches from position 1–3 to 1–7, thus leading the stream through the analytical column to the mass spectrometer. Shortly after the valve is switched (Step 2), the solvent gradient is started and the elution of the analyte from the extraction column begins. After finishing the separation, the system is flushed and re-equilibrated (Step 3) for the analysis of the next sample.

2.3. LC–MS Conditions

The experiment was carried out using an Agilent Infinity 1290 liquid chromatography apparatus (Agilent Technologies, Palo Alto, CA, USA) configured with a two-position, eight-port switching valve. The liquid chromatography apparatus was coupled with a triple quadrupole (Agilent 6410 Triple Quadrupole) mass spectrometer equipped with an electrospray ionization source operated in positive ionization mode. Mass Hunter software was used for the acquisition and processing of data from the liquid chromatography–mass spectrometry apparatus. The triple quadrupole parameters were optimized by flow injections of pure standards. The drying gas temperature and flow rate were set at 350 °C and 13 L/min, respectively. The nebulizing gas pressure was 60 psi and the capillary voltage was 2500 V. Other optimized mass spectrometry parameters and selected multiple reaction monitoring (MRM) transitions are summarized in Table 1. The chromatographic separation of clenbuterol was carried out using a Kinetex Evo C18 column (2.1 × 100 mm, 2.6 μm particle size; Phenomenex, Torrance, CA, USA). The following mobile phase was chosen as optimal: 0.1% v/v AA (solvent A) and MeOH (solvent B). After loading and washing the extraction column with 5% solvent B for 6 min, the valve switched to position 2 and separation of the analyte continued as follows: 5% solvent B for 0.5 min, gradient from 5% to 95% B for 4.5 min and 95% B for 2 min. Separation was carried out with a constant flow of 500 µL/min and a constant temperature at 40 °C. After the separation was completed, the system was flushed and re-equilibrated with 5% solvent B for a total time of 7 min: 4 min in valve position 2 and 3 min in valve position 1 (Supplementary Material, Table S1). The injection volume of the sample was 100 μL.

2.4. Procedures for Stock Solutions, Standards and Samples

The stock solutions of clenbuterol (100 µg/mL) and IS (100 µg/mL) were prepared separately by dissolving 1 mg of analytical standard of clenbuterol and 1 mg of the IS in 10 mL of MPW and stored at −20 °C in the freezer. The stock solution of clenbuterol was serially diluted with MPW to obtain working standard solutions of the desired concentration range (from 0.001 to 10 µg/mL). The IS stock solution was diluted with MPW to give a concentration of 0.5 µg/mL (working solution). The calibration standards were prepared by adding 100 µL of the clenbuterol working solutions into 880 µL MPW and with the IS working solution (20 µL, final concentration of 10 ng/mL). The tested calibration concentrations of clenbuterol ranged from 0.1 to 50 ng/mL.
Quality control (QC) samples were prepared from SurineTM (4 times diluted with MPW) and pooled human urine (from 3 healthy volunteers: 2 women and 1 man; 4 times diluted with MPW) spiked with the working solution of clenbuterol at low, medium and high concentrations (0.5, 2.5 and 25 ng/mL, respectively) and with the working solution of IS (20 µL, final concentration 10 ng/mL).
Blinded samples in the concentration range of 0.4 to 50 ng/mL were prepared by co-workers from the Toxicologic and Antidoping Centre by adding 25 µL of the working solutions of clenbuterol to 1955 µL SurineTM (4 times diluted with MPW) or human urine (from 10 individual donors: 5 women and 5 men; 4 times diluted with MPW) and with the IS working solution (20 µL, final concentration of 10 ng/mL).

2.5. Method Validation

Validation of the method was performed according to the recommendations of the ICH Q2(R1) guideline [26]. Linearity was evaluated as the ability to obtain test results directly proportional to the concentration of analyte in the sample using calibration standards in the concentration range of 0.1–50 ng/mL (6 levels in total). Calibration standards were prepared by spiking the reference solution (mobile phase) with the clenbuterol analytical standard and the IS. Each calibration standard was measured three times. The calibration curve was obtained by applying weighted linear regression for the ratio of the peak area of the analyte to the IS [27]. Limit of quantification (LOQ) was determined as the lowest concentration on the calibration curve, where the response was at least 10 times the response of the blank [27]. A similar procedure was applied to the investigation of the limit of detection (LOD), where the response was at least three times the response of the blank [27].
The carry-over effect was observed by adding a blank sample between all calibration levels (n = 6). The presence of MRM transitions of clenbuterol in the blank samples was calculated (%).
Precision and accuracy were tested by the analysis of quality control (QC) samples at low, medium and high concentration levels of clenbuterol: 0.5, 2.5 and 25 ng/mL, respectively. QC samples were prepared by spiking the blank matrices—SurineTM and pooled urine—with the analytical standard and the IS of clenbuterol. Repeatability represents the intraday precision and is characterized as the precision under the same operating conditions over a short interval of time, typically within one day (run by run) [27]. Therefore, it was measured by repeated analysis of QC samples in three replicates per day and was consequently calculated as the relative standard deviation (%RSD) of the measurements [27]. The intermediate precision (interday precision) was evaluated by repeated analysis of the QC samples in three replicates per day for three consecutive days [27]. The corresponding accuracy of the obtained intraday and interday QC samples data was calculated as the relative error (% RE) [27].
Analytical recovery and matrix effect (ME), investigated at the same concentration levels as the QC samples, were evaluated using the above-mentioned spiked matrices. Each sample was measured five times. Recovery was calculated by comparing the concentrations (ng/mL) of clenbuterol found in spiked matrices with the corresponding reference values (obtained by analyzing the reference solutions without the matrix) [28]. The matrix effect (ME) was calculated by dividing the peak area of the clenbuterol standard in a reference solution without the matrix with the peak area of the same clenbuterol concentration spiked into a SurineTM or pooled urine blank matrix [28].
Benchtop stability was tested by analyzing the QC samples left on the benchtop for 24 h. Autosampler stability was tested by analyzing QC samples stored in the autosampler at 6 °C for 24 h. Freeze–thaw stability was tested by analyzing QC samples after three freeze–thaw cycles at −80 °C. Each sample was measured five times. The results of the stability tests were calculated by comparing the concentrations after testing with those found in the freshly prepared QC samples [28].

2.6. WADA Criteria for Method Application

According to the WADA identification criteria, the ratios of at least two MRM transitions of the targeted analyte in a positive sample and a reference sample must be compared [29]. The abundance of the MRM transitions was determined from the peak area. The relative abundance was calculated by dividing the area of the less intense signal by the area of the more intense signal (100%). Additionally, the difference in the retention times of the targeted analyte in both sample types must not exceed the maximum tolerated value of 0.5% [29]. The ability of the developed SPE–UHPLC–MS/MS method to fulfill these criteria was evaluated using the blinded samples. Each of the blinded samples was measured three times.

3. Results and Discussion

3.1. Method Optimization

The SPE–UHPLC–MS/MS method for the determination of clenbuterol has been optimized evaluating the following parameters:
MS/MS conditions. Optimization of the MS detection step was performed with the use of clenbuterol standard solution at the 100 µg/mL concentration level. The following parameters were optimized in the MS detection stage: desolvation gas temperature (tested range 200 to 400 °C), desolvation gas flow (10–15 L/min), capillary voltage (1000 to 5000 V) and fragmentor voltage (80 to 200 V). The optimal values of these parameters were 350 °C, 13 L/min, 2500 V and 90 V, respectively, considering the highest stability and intensity of the analytical signal as the main criteria. The dependence of the peak area on the collision energy was tested in the range of 0 to 80 V. Optimum values of the collision energy for the produced clenbuterol fragments, providing their highest peak areas, are summarized in Table 1. The protonated molecule [M+H]+ of clenbuterol was found at m/z 277.0 and dissociated under collision-induced dissociation conditions into four major product ions observed at m/z 259.0 (not used for quantification due to nonspecific H2O losses in a collision cell), 203.0 (used for quantification: 277.0 → 203.0), 168.1 (alternative identifier) and 132.1 (selected as identifier: 277.0 → 132.1), the formation of which was suggested to result from subsequent losses of H2O, i-butene from the N-side chain, chlorine radical and hydrochloric acid. The selected MS conditions were used in a further optimization procedure of the separation (UHPLC) and sample preparation (online-SPE) steps.
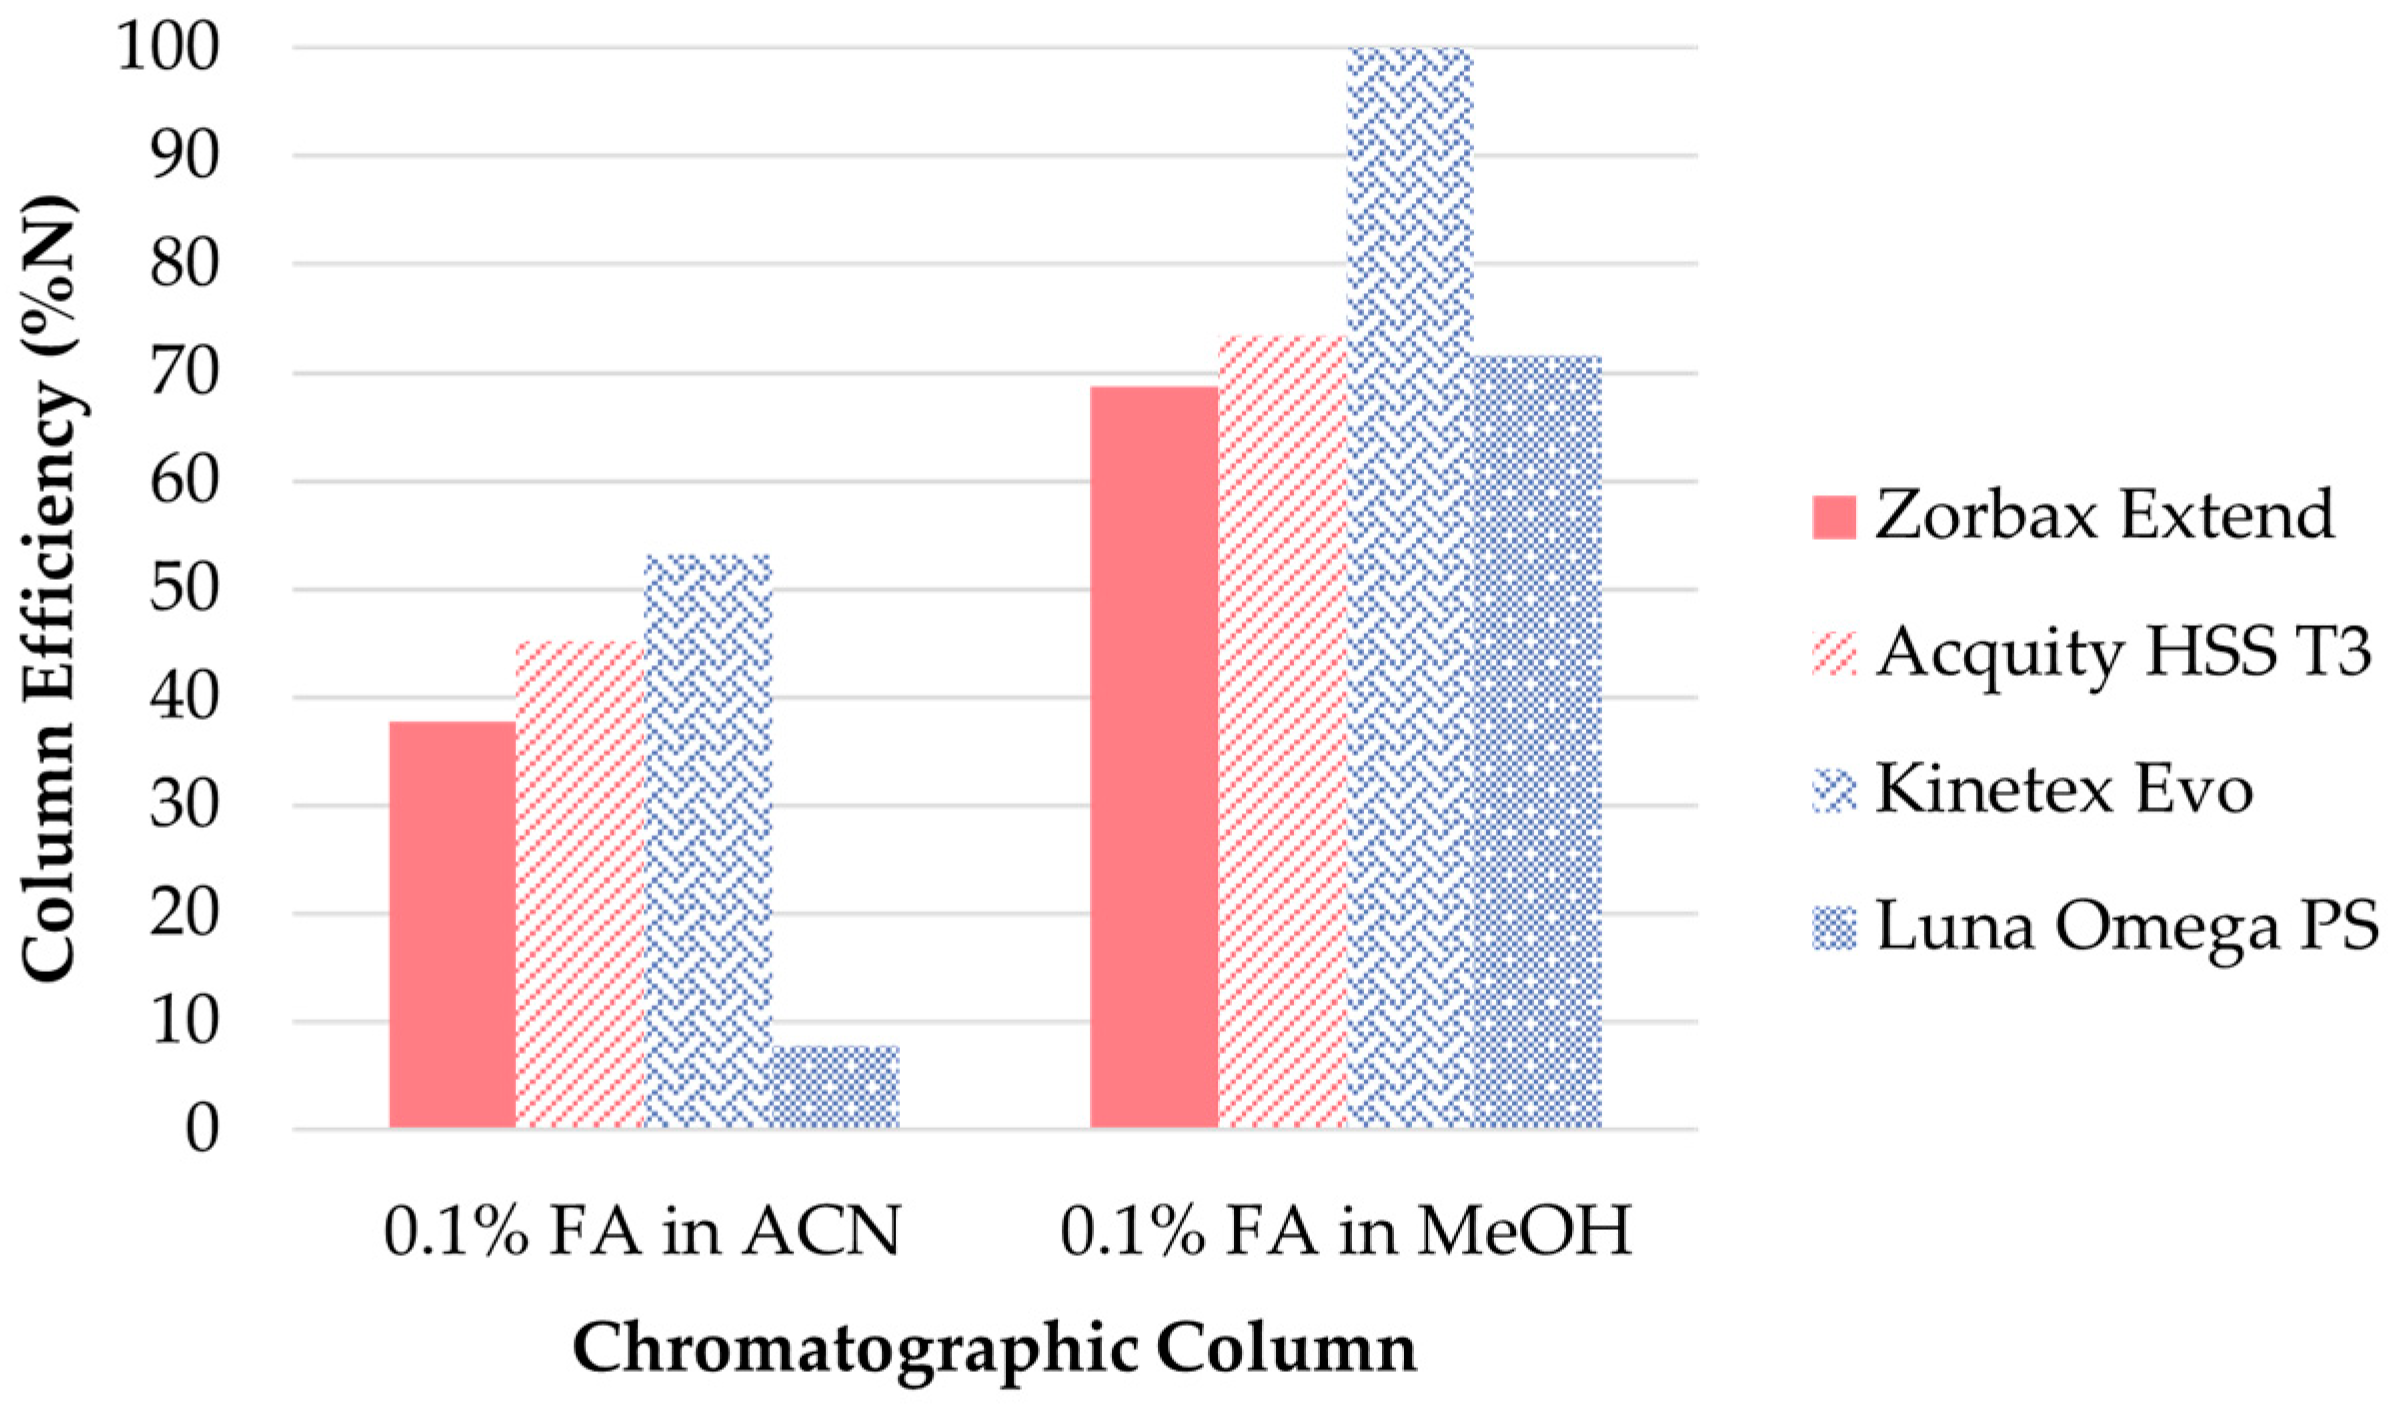
UHPLC conditions. Optimization of the UHPLC separation step was performed using the clenbuterol standard solution at the 10 ng/mL concentration level. The first step in the optimization of the UHPLC separation was the selection of a suitable stationary phase. Several reverse phase columns with different interaction mechanisms were tested: (i) silica-based columns with improved retention of polar compounds: Acquity HSS T3 (Waters, Wexford, Ireland), Luna Omega PS (Phenomenex, Torrance, CA, USA) and Kinetex Evo (Phenomenex, Torrance, CA, USA) and (ii) Zorbax Extend (Agilent Technologies, Santa Clara, CA, USA) column with bidentate bonding and double-endcapping that provided maximum deactivation of the silica surface. The mobile phase consisted of MeOH or ACN and 0.1% FA in MPW. The best separation efficiency (expressed as relative (%) number of theoretical plates N) of clenbuterol, the appropriate peak shape, peak height and peak area, along with one of the shortest elution times was achieved using the Kinetex Evo column as a stationary phase and MeOH as an organic solvent (Figure 3).
In the next step, the effect of the different mobile phase additives on retention characteristics and detector response was tested. The additives included: 0.1% FA (unadjusted or adjusted by 1.0 mM NH4Fo) and 0.1% AA (unadjusted or adjusted by 1.0 mM NH4Ac) in MeOH. The type of additive tested had almost no effect on the retention times. When the peak shapes were considered, all of the additives applied provided acceptable results. Thus, peak height and area were considered as the main criteria for the optimization of the method. As illustrated in Figure 4, the use of 0.1% AA was superior to the other additives in the mobile phase.
Online-SPE conditions. Optimization of the sample preparation step was performed with the use of the clenbuterol standard spiked at the 10 ng/mL concentration level in the SurineTM and pooled urine blank matrices. The following parameters were optimized: (i) the eluting power of the loading solution (expressed as the concentration of MeOH) and (ii) the washing step time. The concentration of MeOH in the loading solution was tested in the range of 5% to 30%. As illustrated in Figure 5, significant differences were registered in the peak areas in the concentration of 5 and 15% MeOH, while for 30% the peak area was zero (i.e., clenbuterol was completely eluted from the extraction column in the waste).
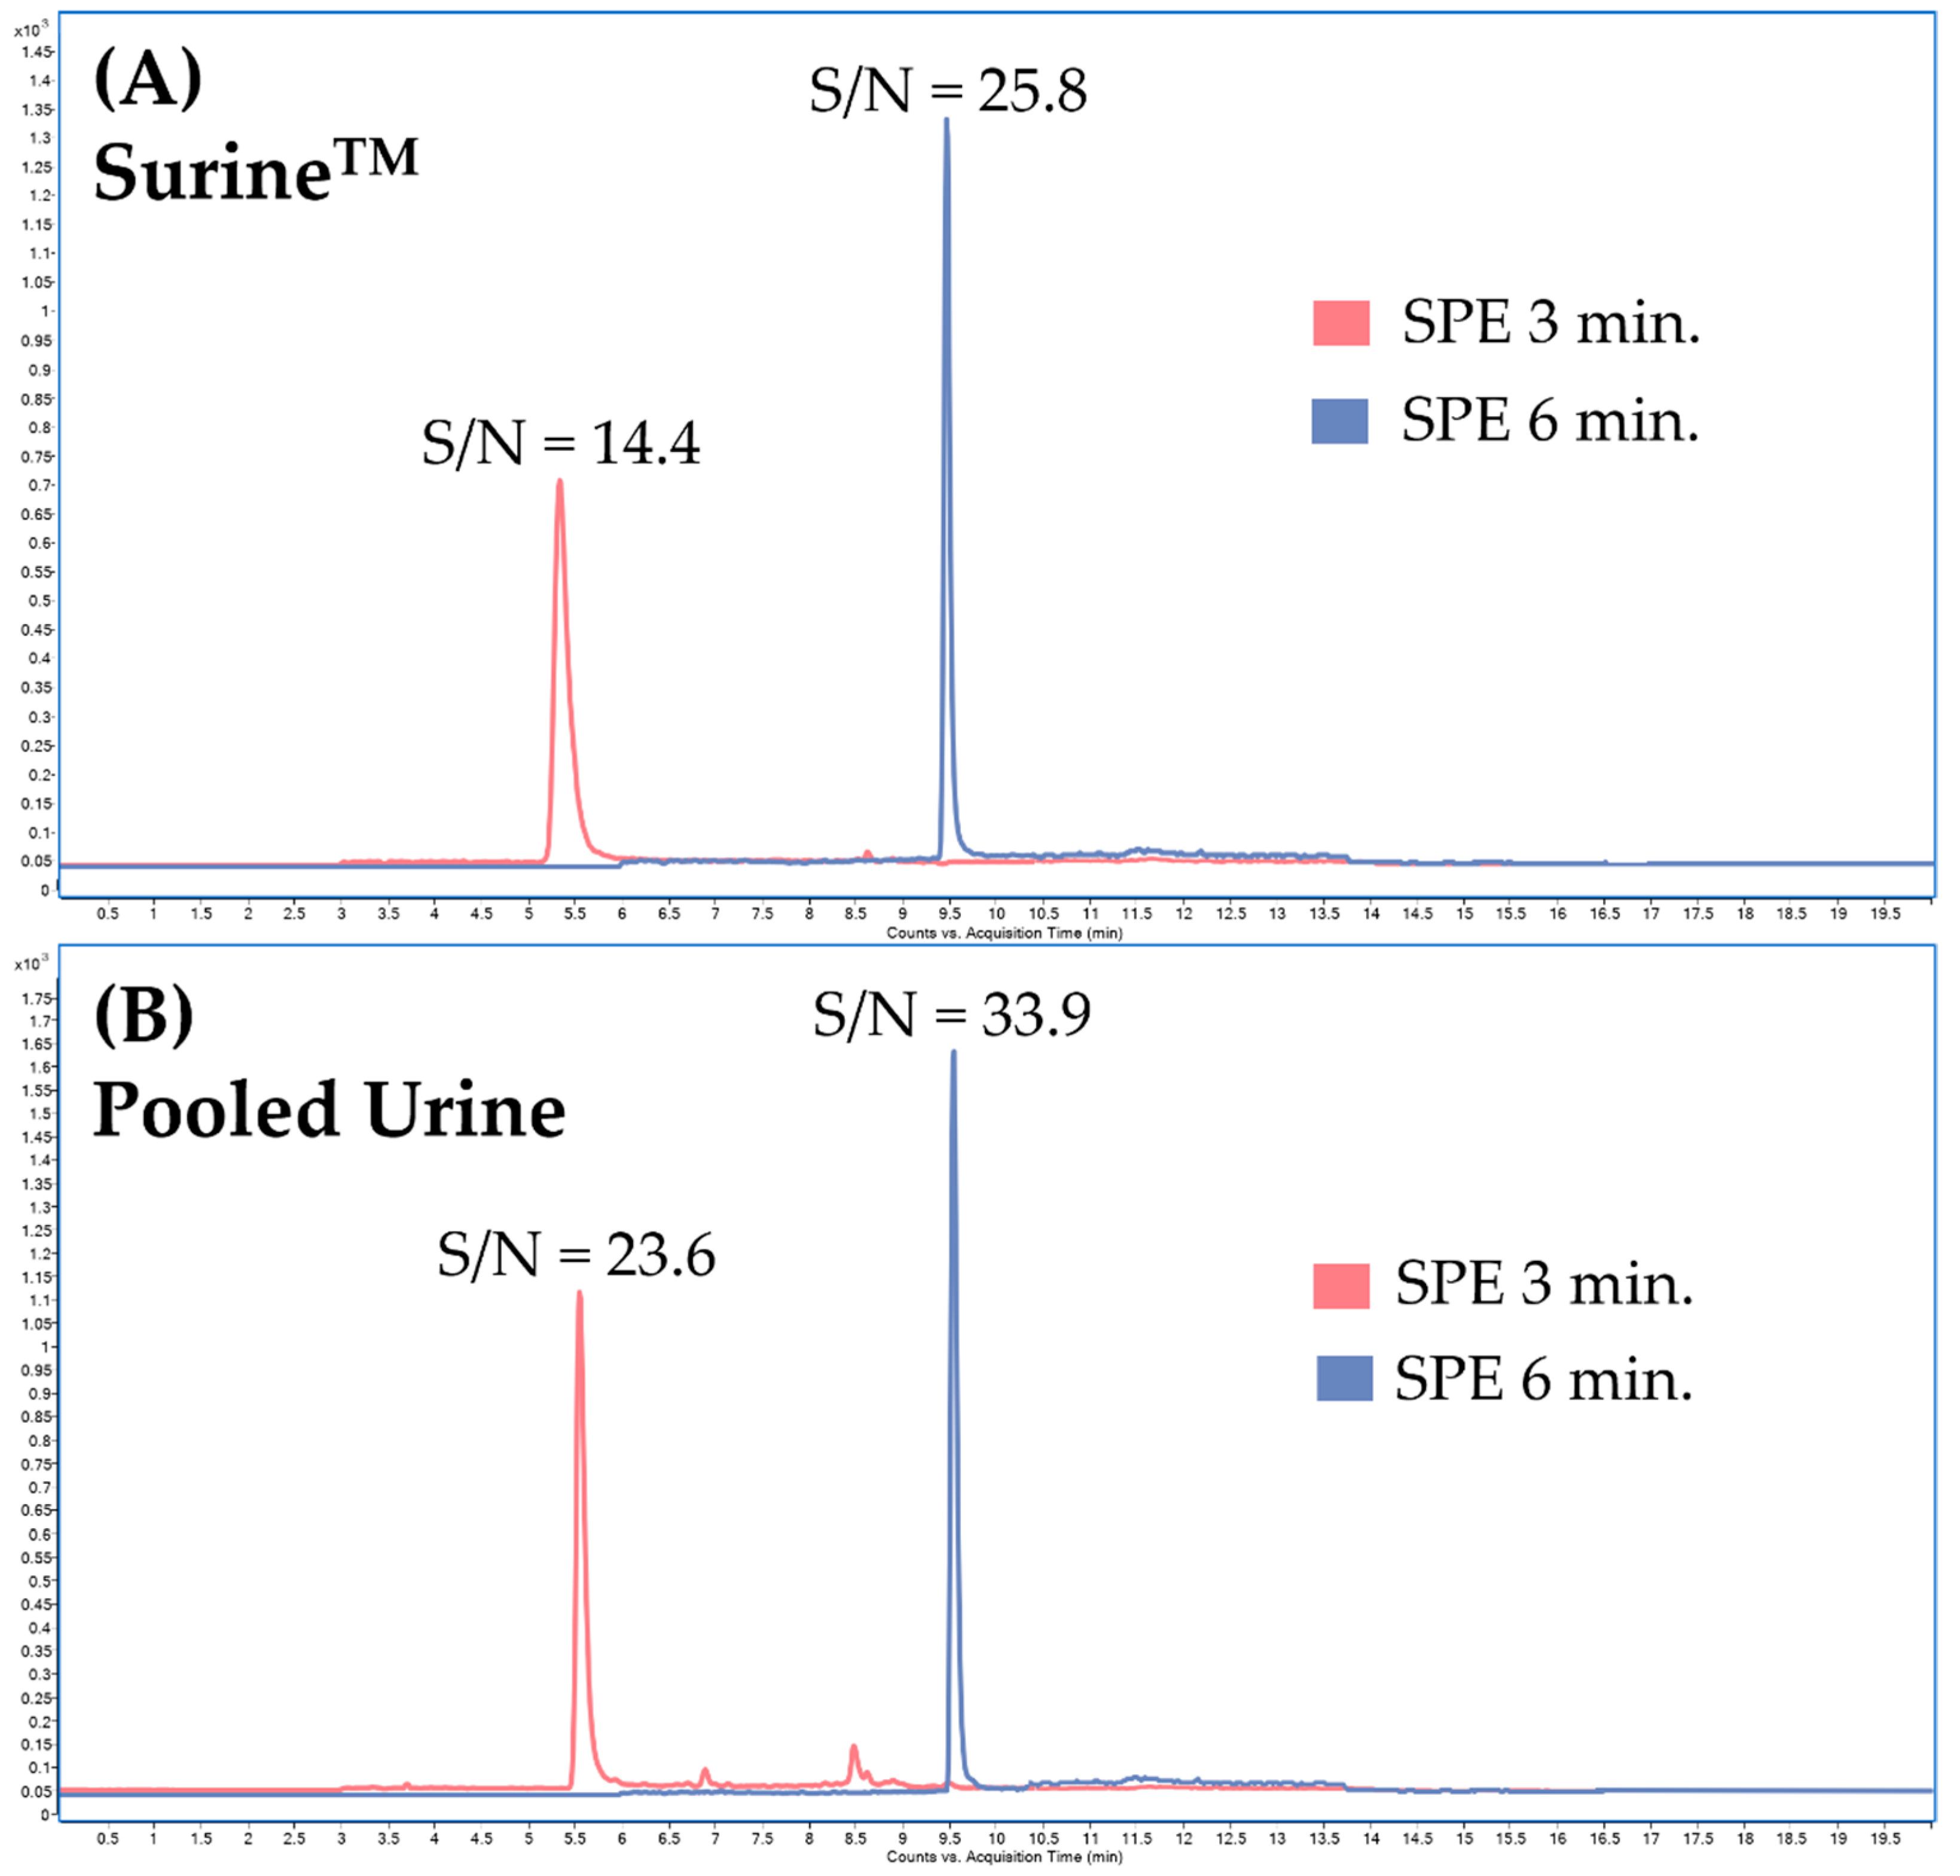
Additional optimization of sample clean-up in the online-SPE step was based on changing the washing time of the loading solution (5% MeOH) (Figure 5) to increase the signal-to-noise ratio (S/N). By changing the washing time in the online-SPE from 3 to 6 min, we succeeded in suppressing the interference while increasing the detector response; see Figure 6.
The optimized UHPLC–MS/MS method with online-SPE sample preparation provides an effective alternative to previously published LC–MS/MS methods [17,18,19,20,21,22,23]. By introducing the fully automated procedure, we have reduced the sample handling to minimum (only dilution of the sample), and therefore eliminated the risk of additional errors in the analytical process.

3.2. Method Validation

The SPE–UHPLC–MS/MS method for the determination of clenbuterol has been validated by evaluating the following parameters:
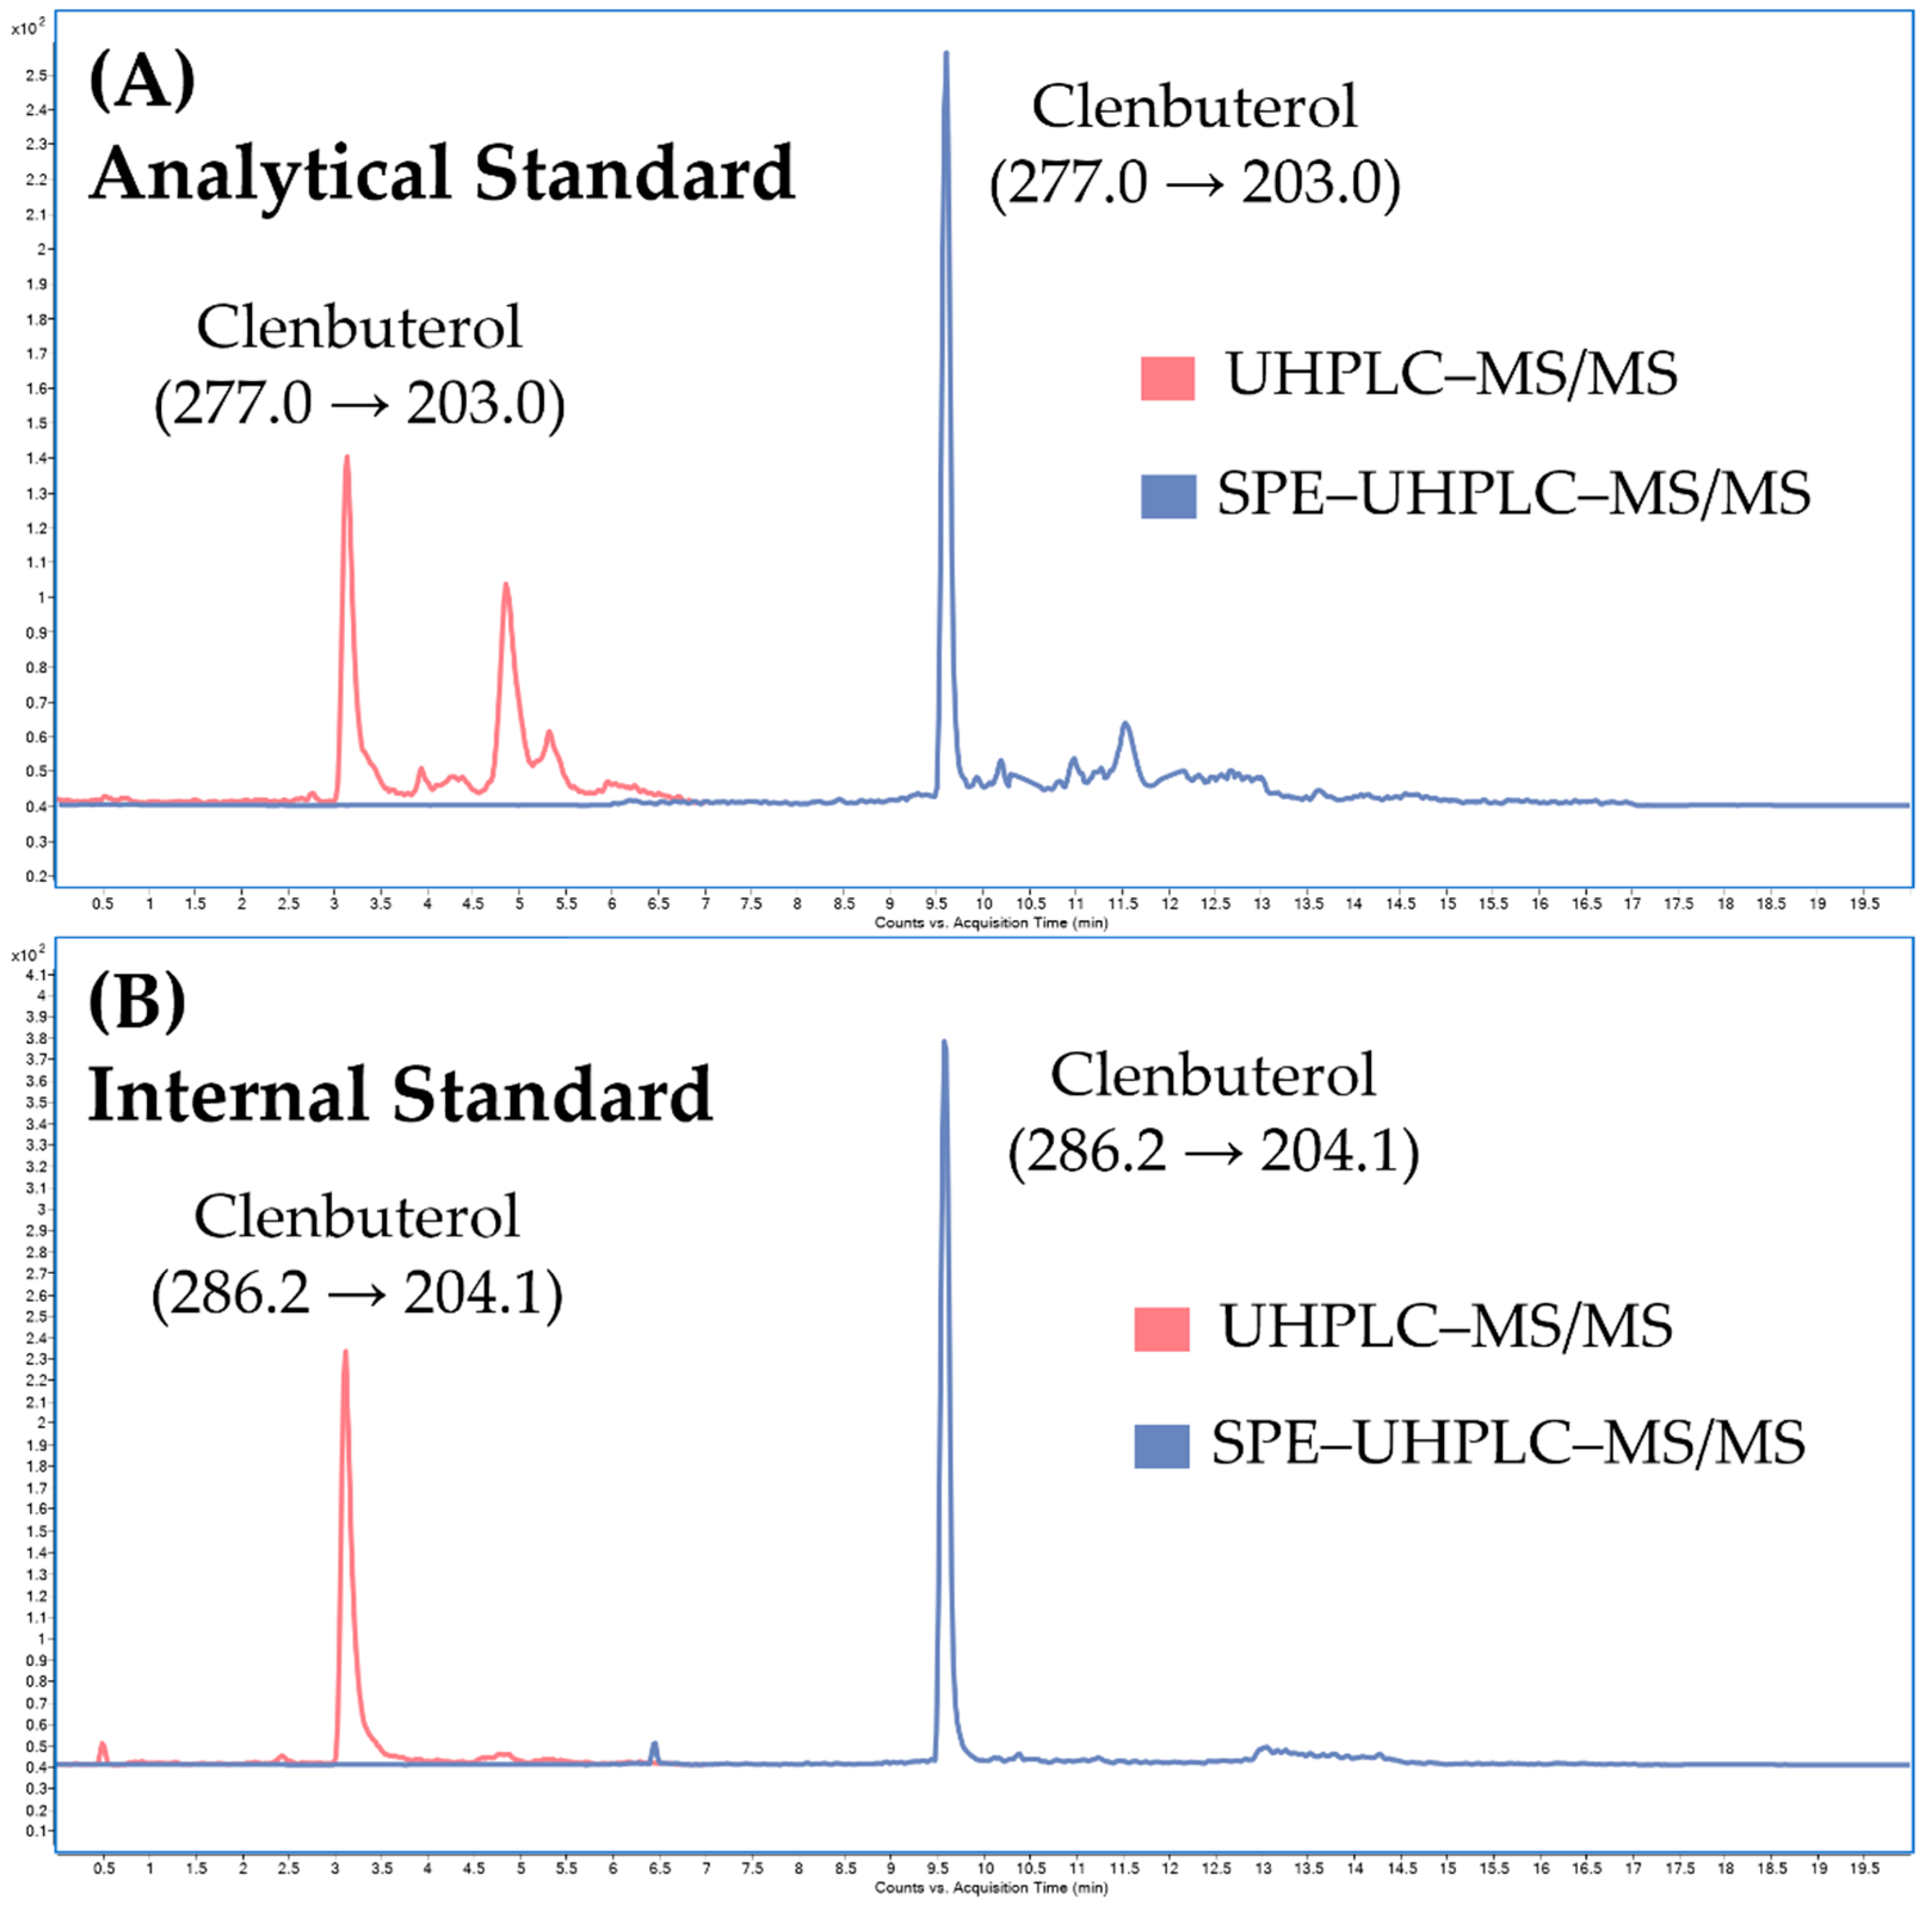
Calibration parameters and carry-over effect. The calibration parameters of the SPE–UHPLC–MS/MS method are summarized in Table 2. The linearity exceeded two decadic orders with a determination coefficient (r2) of 0.9999. No carry-over effect was observed between the calibration levels. The limit of quantification (LOQ), which represents the first point of the calibration line, was 0.1 ng/mL (see Figure 7). LOQ of 0.1 ng/mL satisfies the WADA’s Minimum Required Performance Levels (MRPL) for clenbuterol (0.2 ng/mL). MRPL is the minimum concentration of a non-threshold substance or a metabolite or marker of a non-threshold substance that laboratories shall be able to detect (Initial Testing Procedure) and identify (Confirmation Procedure) in routine operations [29]. The limit of detection (LOD) was 0.0125 ng/mL, which is comparable to previously published LC–MS/MS methods for routine monitoring of clenbuterol in human urine [17,18,19,20,21,22,23].
Precision and accuracy. The results of the analysis of the QC samples are summarized in Table 3 and Table 4 (for SurineTM and pooled urine matrices, respectively). The intraday accuracies for all concentration levels and both matrices were in the range of 89.5 to 98.7%, while the interday accuracies varied from 93.1 to 98.5%. The intraday and interday precisions were not higher than 4.86% and 8.99%, respectively. These values demonstrated acceptable reliability of the developed SPE–UHPLC–MS/MS method.
Recovery and matrix effect. The results of the analysis of the recoveries and the matrix effects normalized to the IS are summarized in the Supplementary Material, Tables S2 and S3. The recovery, calculated from the QC samples, was in the range of 100.18 to 112.28%. The corresponding values of the matrix effect using the IS were below 12.5%.
Stability. The stability of clenbuterol in pooled urine samples was acceptable under different conditions (i.e., dwelling on the benchtop or in the autosampler, or freeze–thaw) as indicated by the data given in the Supplementary Material, Table S4. The changes in quantitative parameters of the analyte undergoing the tests were less than 5%.

3.3. Method Application

Following the validation process, the fitness of the developed SPE–UHPLC–MS/MS method for routine toxicologic and antidoping purposes was demonstrated on the analysis of blinded samples.
The results of the time and mass recognition of the MRM transitions of clenbuterol in the blinded samples are summarized in the Supplementary Material, Tables S5–S8. Briefly, the difference in the retention times in both sample types did not exceed the maximum tolerated value of 0.5%, and the difference in the relative abundances of two MRM transitions of clenbuterol was in the range of tolerated values: >0–9.63%.
Having assessed the identification step, the focus shifted toward the estimation of the concentration for each blinded sample. Furthermore, the blinded samples were “unblinded” and the estimated concentrations of the samples were compared with their corresponding nominal values, and thus the precision and accuracy of the obtained results were evaluated. According to these results (RSD ≤ 5.4%, RE ≤ 11%; summarized in the Supplementary Material, Tables S9 and S10), the developed SPE–UHPLC–MS/MS method could represent an effective tool for the determination of clenbuterol in the routine toxicologic and antidoping analysis.

4. Conclusions

The developed fully integrated SPE–UHPLC–MS/MS approach represents an attractive solution for the monitoring of trace clenbuterol levels in human urine matrices. The sample preparation is reduced to a simple dilution by diluting the sample with water and adding an internal standard solution. The main benefits include (i) minimum sample handling and preparation (due to the online-SPE loading and washing step), (ii) short analysis time and high sample throughput (due to the UHPLC separation), (iii) high sensitivity (due to the triple quadrupole detection) and (iv) high selectivity (due to the SPE–UHPLC–MS/MS arrangement with online sample preparation). The total analysis time is 20 min per sample, which represents approximately 72 samples analyzed in 24 h. The method is characterized by satisfactory validation parameters and fulfillment of WADA screening and confirmation criteria. Considering the high reliability, sensitivity, selectivity, sample throughput, and a high degree of automation of the analytical procedure, the developed method is favorable for routine use in toxicological and antidoping laboratories. As a future perspective, this novel highly sensitive approach could be applied to simple and fast monitoring of time vs. concentration dependences of clenbuterol in human urine samples taken from a healthy volunteer after administration of a single dose of clenbuterol. Due to high orthogonality of the hyphenated method with multiple dimensions, it gives good perspectives also for its adaptation to the separation of structurally related compounds such as clenbuterol metabolites (to prolong the period of monitoring clenbuterol residues in positive samples).

Supplementary Materials

The following supporting information can be downloaded at: https://www.mdpi.com/article/10.3390/separations9120440/s1, Table S1. Gradient of the mobile phase and positions of the switching valve in the SPE–UHPLC–MS/MS method, Table S2. Recovery and matrix effect of the developed SPE–UHPLC–MS/MS method from the analysis of QC samples in SurineTM, Table S3. Recovery and matrix effect of the developed SPE–UHPLC–MS/MS method from the analysis of QC samples in pooled urine, Table S4. Stability of clenbuterol from the analysis of QC samples in pooled urine, Table S5. Comparison of retention time of two MRM transitions for blinded samples in SurineTM, Table S6. Relative abundances of two MRM transitions for blinded samples in SurineTM, Table S7. Comparison of retention time of two MRM transitions for blinded samples in urine, Table S8. Relative abundances of two MRM transitions for blinded samples in urine, Table S9. Precision (% RSD) and accuracy (% RE) of the developed SPE–UHPLC–MS/MS method from analysis of blinded samples in SurineTM, Table S10. Precision (% RSD) and accuracy (% RE) of the developed SPE–UHPLC–MS/MS method from analysis of blinded samples in urine.

Author Contributions

Conceptualization, J.P. and P.M.; methodology, J.P. and P.M.; optimization and validation, K.S. and D.O.; resources, K.S. and P.M.; data curation, K.S. and D.O.; writing—original draft preparation, K.S.; writing—review and editing, J.P. and P.M.; visualization, K.S.; supervision, P.M.; funding acquisition, P.M. All authors have read and agreed to the published version of the manuscript.

Funding

This work was supported by the projects VEGA 1/0514/22, KEGA 027UK-4/2020 and UK/321/2022.

Institutional Review Board Statement

The study was conducted according to the guidelines of the Declaration of Helsinki and approved by the Ethics Committee of the Faculty of Pharmacy Comenius University in Bratislava (protocol code 05/2021, date of approval: 15 December 2021).

Informed Consent Statement

Informed consent was obtained from all subjects involved in the study.

Data Availability Statement

Data are available from the authors (K.S. and D.O.).

Acknowledgments

The analytical experiments were carried out in the Toxicologic and Antidoping Centre at the Faculty of Pharmacy Comenius University Bratislava. This work was supported also by the Faculty of Pharmacy Comenius University Bratislava.

Conflicts of Interest

The authors declare no conflict of interest.

References

  1. Al-Majed, A.A.; Khalil, N.Y.; Khbrani, I.; Abdel-Aziz, H.A. Clenbuterol Hydrochloride. Profiles Drug Subst. Excip. Relat. Methodol. 2017, 42, 91–123. [Google Scholar] [PubMed]
  2. Parr, M.K.; Opferman, G.; Schanzer, W. Analytical methods for the detection of clenbuterol. Bioanalysis 2009, 1, 437–450. [Google Scholar] [CrossRef] [PubMed]
  3. Jessen, S.; Solheim, S.A.; Jacobson, G.A.; Eibye, K.; Bangsbo, J.; Nordsborg, N.B.; Hostrup, M. Beta2-adrenergic agonist clenbuterol increases energy expenditure and fat oxidation, and induces mTOR phosphorylation in skeletal muscle of young healthy men. Drug Test. Anal. 2020, 12, 610–618. [Google Scholar] [CrossRef]
  4. Parr, M.K.; Koehler, K.; Geyer, H.; Guddat, S.; Schanzer, W. Clenbuterol marketed as dietary supplement. Biomed. Chromatogr. 2008, 22, 298–300. [Google Scholar] [CrossRef] [PubMed]
  5. World Anti-Doping Agency. 2022 Prohibited List; World Anti-Doping Agency: Montreal, QC, Canada. Available online: https://www.wada-ama.org/sites/default/files/resources/files/2022list_final_en.pdf (accessed on 25 August 2022).
  6. World Anti-Doping Agency. Anti-Doping Testing Figures Report; World Anti-Doping Agency: Montreal, QC, Canada. Available online: https://www.wada-ama.org/en/resources/anti-doping-stats/anti-doping-testing-figures-report (accessed on 25 August 2022).
  7. World Anti-Doping Agency. 2021 International Standard for Laboratories; World Anti-Doping Agency: Montreal, QC, Canada. Available online: https://www.wada-ama.org/sites/default/files/resources/files/isl_2021.pdf (accessed on 25 August 2022).
  8. Yang, Z.; Wu, M.; He, G.; Dong, Y.; Ouyang, G.; Wu, Y.; Lu, J.; Yang, S.; Xu, Y.; Wang, X. An Improved LC–MS–MS Method for the Determination of Clenbuterol in Human Urine. LCGC Eur. 2012, 25, 612–617. [Google Scholar]
  9. Velasco-Bejarano, B.; Bautista, J.; Noguez, M.O.; Camacho, E.; Rodriguez, M.E.; Rodriguez, L. Resolution of R-(−) and S-(+)- enantiomers of clenbuterol in pharmaceutical preparations and black-market products using liquid chromatography-tandem mass spectrometry. Drug Test. Anal. 2017, 9, 1738–1743. [Google Scholar] [CrossRef] [PubMed] [Green Version]
  10. Prajapati, K.J.; Kothari, C. Development and Validation of a Stability Indicating LC-MS/MS Method for the Determination of Clenbuterol HCl. Drug Res. 2020, 70, 552–562. [Google Scholar] [CrossRef]
  11. Jia, J.Y.; Zhang, L.N.; Lu, Y.L.; Zhang, M.Q.; Liu, G.Y.; Liu, Y.M.; Lu, C.; Li, S.J.; Lu, Y.; Zhang, R.W.; et al. Hair analysis, a reliable and non-invasive method to evaluate the contamination by clenbuterol. Ecotoxicol. Environ. Saf. 2013, 93, 186–190. [Google Scholar] [CrossRef]
  12. Li, L.; Zhang, J.; Tang, C.; Zhao, Q. Accumulation of clenbuterol residues in the hair of Chinese Simmental beef cattle during and after treatment. J. Anal. Toxicol. 2014, 38, 52–56. [Google Scholar] [CrossRef]
  13. Krumbholz, A.; Anielski, P.; Gfrerer, L.; Graw, M.; Geyer, H.; Schanzer, W.; Dvorak, J.; Thieme, D. Statistical significance of hair analysis of clenbuterol to discriminate therapeutic use from contamination. Drug Test. Anal. 2014, 6, 1108–1116. [Google Scholar] [CrossRef]
  14. Duvivier, W.F.; van Beek, T.A.; Meijer, T.; Peeters, R.J.; Groot, M.J.; Sterk, S.S.; Nielen, M.W. Ultratrace LC-MS/MS analysis of segmented calf hair for retrospective assessment of time of clenbuterol administration in Agriforensics. J. Agric. Food Chem. 2015, 63, 493–499. [Google Scholar] [CrossRef] [PubMed]
  15. Montes Nino, A.M.; Granja, R.; Reche, K.; Giannotti, F.M.; de Souza, J.; Ferrari, S.; Dos Santos, A.D.; Wanschel, A.; Salerno, A.G. Laboratory validation of an LC-MS/MS method for the detection of ractopamine, clenbuterol and salbutamol in bovine and swine muscle at sub-μg kg-1 regulatory limits. Food Addit. Contam. Part A Chem. Anal. Control Expo. Risk Assess. 2017, 34, 785–792. [Google Scholar] [PubMed]
  16. Yikilmaz, Y.; Kuzukiran, O.; Erdogan, E.; Sen, F.; Kirmizibayrak, O.; Filazi, A. The determination of β-agonist residues in bovine tissues using liquid chromatography-tandem mass spectrometry. Biomed. Chromatogr. 2020, 34, e4926. [Google Scholar] [CrossRef] [PubMed]
  17. Solheim, S.A.; Jessen, S.; Morkeberg, J.; Thevis, M.; Dehnes, Y.; Eibye, K.; Hostrup, M.; Nordsborg, N.B. Single-dose administration of clenbuterol is detectable in dried blood spots. Drug Test. Anal. 2020, 12, 1366–1372. [Google Scholar] [CrossRef] [PubMed]
  18. Thevis, M.; Opfermann, G.; Schanzer, W. Liquid chromatography/electrospray ionization tandem mass spectrometric screening and confirmation methods for beta2-agonists in human or equine urine. J. Mass Spectrom. 2003, 38, 1197–1206. [Google Scholar] [CrossRef]
  19. Guddat, S.; Fußholler, G.; Geyer, H.; Thomas, A.; Braun, H.; Haenelt, N.; Schwenke, A.; Klose, C.; Thevis, M.; Schanzer, W. Clenbuterol—Regional food contamination a possible source for inadvertent doping in sports. Drug Test. Anal. 2012, 4, 534–538. [Google Scholar] [CrossRef]
  20. Nicoli, R.; Petrou, M.; Badoud, F.; Dvorak, J.; Saugy, M.; Baume, N. Quantification of clenbuterol at trace level in human urine by ultra-high pressure liquid chromatography-tandem mass spectrometry. J. Chromatogr. A 2013, 1292, 142–150. [Google Scholar] [CrossRef]
  21. He, G.; Sheng, L.; Zhang, J.; Wu, Y.; Zhao, X.; Xu, Y.; Lu, J. Enantiomeric analysis of clenbuterol in Chinese people by LC-MS/MS to distinguish doping abuse from meat contamination. Bioanalysis 2020, 12, 783–790. [Google Scholar] [CrossRef]
  22. Melwanki, M.B.; Huang, S.D.; Fuh, M.R. Three-phase solvent bar microextraction and determination of trace amounts of clenbuterol in human urine by liquid chromatography and electrospray tandem mass spectrometry. Talanta 2007, 72, 373–377. [Google Scholar] [CrossRef]
  23. Musenga, A.; Cowan, D.A. Use of ultra-high pressure liquid chromatography coupled to high resolution mass spectrometry for fast screening in high throughput doping control. J. Chromatogr. A 2013, 1288, 82–95. [Google Scholar] [CrossRef]
  24. Thevis, M.; Thomas, A.; Beuck, S.; Butch, A.; Dvorak, J.; Schanzer, W. Does the analysis of the enantiomeric composition of clenbuterol in human urine enable the differentiation of illicit clenbuterol administration from food contamination in sports drug testing? Rapid Commun. Mass Spectrom. 2013, 27, 507–512. [Google Scholar] [CrossRef] [PubMed]
  25. Goschl, L.; Gmeiner, G.; Enev, V.; Kratena, N.; Gartner, P.; Forsdahl, G. Development and validation of a simple online-SPE method coupled to high-resolution mass spectrometry for the analysis of stanozolol-N-glucuronides in urine samples. Drug Test. Anal. 2020, 12, 1031–1040. [Google Scholar] [CrossRef] [PubMed]
  26. ICH. ICH Harmonised Tripartite Guideline: Validation of Analytical Procedures: Text and Methodology, 4th ed.; European Medicines Agency: Amsterdam, The Netherlands, 2005. Available online: https://www.ich.org/page/quality-guidelines (accessed on 8 September 2022).
  27. Stefanik, O.; Horniakova, A.; Cizmarova, I.; Matuskova, M.; Mikusova, V.; Mikus, P.; Piestansky, J. Enhanced Sample Throughput Capillary Zone Electrophoresis with UV Detection in Hydrodynamically Closed System for Determination of Ibuprofen. Separations 2022, 9, 118. [Google Scholar] [CrossRef]
  28. Galba, J.; Piešťanský, J.; Kováč, A.; Olešová, D.; Cehlár, O.; Kertys, M.; Kozlík, P.; Chaľová, P.; Tirčová, B.; Slíž, K.; et al. Fast and Sensitive Screening of Oxandrolone and Its Major Metabolite 17-Epi-Oxandrolone in Human Urine by UHPLC—MS/MS with On-Line SPE Sample Pretreatment. Molecules 2021, 26, 480. [Google Scholar] [CrossRef] [PubMed]
  29. World Anti-Doping Agency. Minimum Criteria for Chromatographic-Mass Spectrometric Confirmation of the Identity of Analytes for Doping Control Purposes: TD2021IDCR; World Anti-Doping Agency: Montreal, QC, Canada, 2020; Available online: https://www.wada-ama.org/sites/default/files/resources/files/td2021idcr_final_eng_0.pdf (accessed on 19 September 2022).
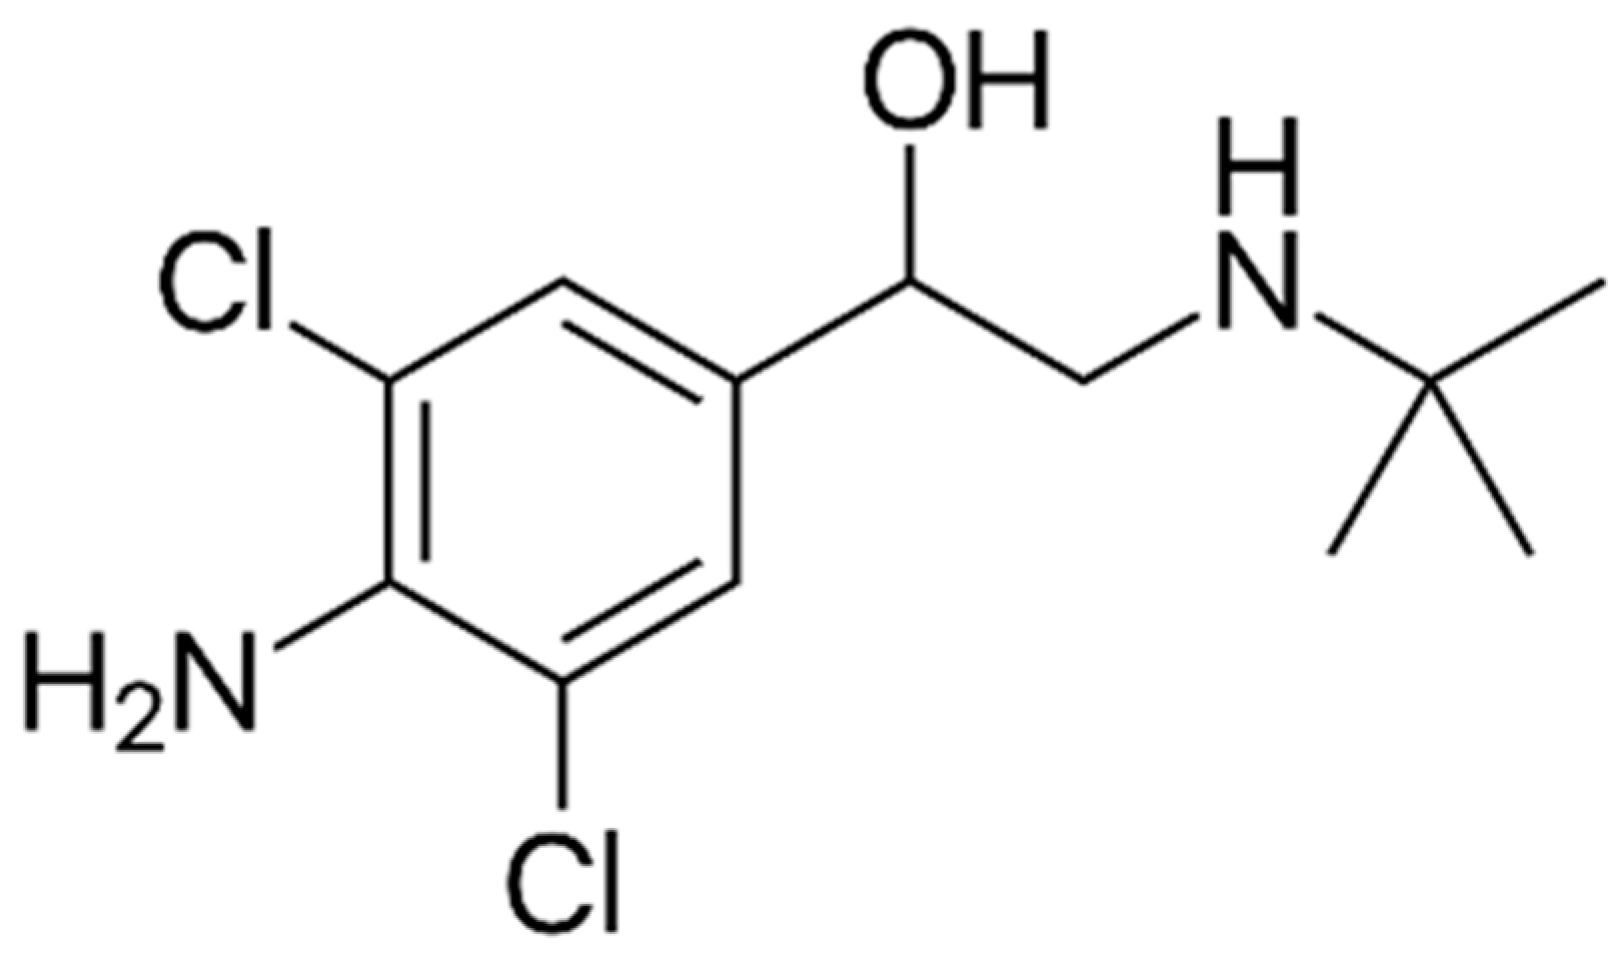
Figure 1. Structure of clenbuterol (1-(4-Amino-3,5-dichlorophenyl)-2-tert-butylaminoethanol).
Separations 09 00440 g001
Figure 2. Online solid-phase extraction procedure: (A) Schematic illustration of the valve switch system: Step 1, Analyte loading on extraction column and washing of interfering substances from urine to improve detection in the following instrumental analysis; Step 2, Elimination of the analyte from extraction column, separation on analytical column and tandem mass spectrometry (MS/MS) measurement; (B) Temporal progression of the experimental procedure.
Separations 09 00440 g002
Figure 3. Comparison of the separation efficiency of clenbuterol in different stationary phases.
Separations 09 00440 g003
Figure 4. Influence of different mobile phase additives on (A) peak height and (B) peak area of clenbuterol.
Separations 09 00440 g004
Figure 5. Influence of the different concentrations of solvent B (methanol) in the loading solution (5% or 15%) and the time of the loading and washing step (3, 6 or 9 min) on the peak area of clenbuterol in (A) SurineTM and (B) pooled urine.
Separations 09 00440 g005
Figure 6. Influence of the loading and washing time of the washing solution (5% methanol) on the signal-to-noise (S/N) ratio of the sample. Clenbuterol multiple reaction monitoring (MRM) chromatogram: (A) SurineTM spiked with the standard of clenbuterol with loading and washing time of 3 min or 6 min, (B) pooled urine spiked with the standard of clenbuterol with loading and washing time of 3 min or 6 min.
Separations 09 00440 g006
Figure 7. Illustrative chromatograms obtained from analysis of (A) the analytical standard of clenbuterol and (B) the internal standard (clenbuterol-d9) spiked in the pooled urine at the LOQ concentration level (0.1 ng/mL) under UHPLC–MS/MS conditions (without online-SPE), and SPE–UHPLC–MS/MS conditions.
Separations 09 00440 g007
Table 1. Multiple reaction monitoring (MRM) transitions and optimized mass spectrometer parameters used for the determination of clenbuterol and corresponding internal standard (IS) by SPE–UHPLC–MS/MS method.
CompoundMRM TransitionFragmentor Voltage [V]Collision Energy [V]
clenbuterol277.0 → 203.0 (qualifier)9010
clenbuterol277.0 → 132.1 (identifier)9010
clenbutetol-d9 (IS)286.2 → 204.1 (qualifier)9010
clenbutetol-d9 (IS)286.2 → 133.1 (identifier)9010
Table 2. Calibration parameters of the developed SPE–UHPLC–MS/MS method.
ParameterClenbuterol
Linear range [ng/mL]0.1 to 50
Slope (a)0.9999
SDa (n = 18)0.0027
Intercept (b)0.0013
SDb (n = 18)0.0562
r20.9999
tR [min] (n = 18)9.483
LOD [ng/mL]0.0125
LOQ [ng/mL]0.1
SDa—standard deviation of slope; SDb—standard deviation of intercept; tR—retention time.
Table 3. Precision (%RSD) and accuracy (%RE) of the developed SPE–UHPLC–MS/MS method from the analysis of QC samples in SurineTM.
QC SampleIntraday, n = 3Interday, n = 9
Nominal
[ng/mL]
Found
[ng/mL]
RSD [%]RE [%]Found
[ng/mL]
RSD [%]RE [%]
0.50.452.41−10.50.474.96−5.5
2.52.351.40−5.92.448.11−2.6
2523.641.70−5.426.387.70−5.5
Table 4. Precision (%RSD) and accuracy (%RE) of the developed SPE–UHPLC–MS/MS method from the analysis of QC samples in pooled urine.
QC SampleIntraday, n = 3Interday, n = 9
Nominal
[ng/mL]
Found
[ng/mL]
RSD [%]RE [%]Found
[ng/mL]
RSD [%]RE [%]
0.50.474.86−5.10.494.80−1.6
2.52.472.96−1.32.468.99−1.5
2523.771.26−4.926.728.17−6.9
Publisher’s Note: MDPI stays neutral with regard to jurisdictional claims in published maps and institutional affiliations.