Article

Parameter Effects and Optimisation in Supercritical Fluid Extraction of Phenolic Compounds from Labisia pumila

by
Shazana Azfar Radzali
1,2,
Masturah Markom
1,2,* and
Noorashikin Md Saleh
1,2
1
Department of Chemical and Process Engineering, Faculty of Engineering and Built Environment, Universiti Kebangsaan Malaysia (UKM), Bangi 43600, Selangor, Malaysia
2
Research Centre for Sustainable Process Technology (CESPRO), Faculty of Engineering & Built Environment, Universiti Kebangsaan Malaysia (UKM), Bangi 43600, Selangor, Malaysia
*
Author to whom correspondence should be addressed.
Separations 2022, 9(12), 385; https://doi.org/10.3390/separations9120385
Submission received: 19 October 2022 / Revised: 15 November 2022 / Accepted: 17 November 2022 / Published: 22 November 2022

Abstract

:
Labisia pumila, locally referred to as kacip fatimah, is one of the important herbs utilised in traditional medicine. Nonetheless, to the best of the researchers’ knowledge, the optimum application of Supercritical Fluid Extraction (SFE) has not been reported for Labisia pumila (L. pumila) extraction and the understanding of this study may offer preliminary insight into the preparation of standardised extracts of L. pumila enriched with natural antioxidants prior to commercialisation at the industrial level. Response surface methodology (RSM) was used to optimise supercritical carbon dioxide extraction (SC-CO2) of functional phenolic compounds from L. pumila leaves. The factors studied were pressure, temperature, percentage of ethanol in co-solvent, and co-solvent concentration. The results demonstrated that the percentage of ethanol in co-solvent, temperature, and co-solvent concentration in the supercritical mixture had significant effects on the extraction of L. pumila. Based on the RSM results, the optimal SC-CO2 extraction conditions were at 283 bar, 32 °C, 78% (v/v) of ethanol-water in co-solvent, and 16% (v/v) of co-solvent concentration, which allowed the recovery of 14.051 ± 0.76% (g/g) of extraction yield, 1.2650 ± 0.10% (g/g) of gallic acid, 0.441 ± 0.29% (g/g) of methyl gallate, and 1.382 ± 0.37% (g/g) of caffeic acid. The experimental values were in agreement with the one predicted by RSM models, confirming the suitability of the model for optimisation of the extraction conditions.

Graphical Abstract

1. Introduction

Labisia pumila (vernacular name: “kacip fatimah”) is one of the most famous and abundant medicinal plants found in Malaysia, Thailand, and Indonesia that has attracted great attention from the locals for its medicinal and nutritional benefits [1]. It has been recorded that the components of this plant are rich sources of phenolic antioxidants [2], and it has been known to have multiple biological effects [3]. Most of the phytochemicals extracted from L. pumila extract are phenolic compounds, including phenolic acids (gallic acid, methyl gallate, and caffeic acid), flavonoids, and other phytochemicals (carotenoids and ascorbic acids) as mentioned by [2,4,5]. L. pumila can be used to contract the birth canal, improve childbirth, regain body strength in delivery mothers, and reduce abdominal fats [6]. Aqueous extracts of the Malaysian herb L. pumila have also been introduced in the prevention of heart disease and cancer [3]. Tsao and Deng [7] stated that phenolic acids from herbs have antioxidant activities that surpass the values presented by vitamins C and E. Numerous nutraceutical products containing the extracted components or powdered form of L. pumila do not have information on the bioactive constituents existing in the product. Therefore, identification and quantification of the chemical presence in the herbs are important for verification and standardisation purposes. Extraction is the first important step in the recovery and isolation of compounds of interest from the plant materials. The main objective of extraction is to provide a maximum extraction yield obtained from the plant and extract of the best quality that consists of a high concentration of the favoured targeted antioxidant constituents [8,9].
Numerous techniques are available for extracting phenolics from the plants, including decoction extraction, soxhlet extraction, supercritical fluid extraction (SFE), ultrasound-assisted extraction, and microwave-assisted extraction (MAE) [10,11,12,13,14,15,16]. Nevertheless, in previous findings, the yield of phenolic acid was quite low in comparison with those of traditional techniques, and the selectivity of the targeted antioxidant recovered from the herb remained uncertain. The disadvantages of traditional phenolic extraction methods have been reported, such as the low quality of an extract with unsatisfactory extraction yields and also being uneconomic [17]. The studies performed by Panja [18] indicated that SC-CO2 extraction is a cleaner option than the conventional techniques and is more selective and efficient for phenolic extraction. In addition, in many cases, SFE provided recoveries that were comparable to, or even better than, those of solvent extraction techniques [19,20,21,22]. Furthermore, the solvating strength of supercritical fluid can be modified by altering the temperature and pressure and, hence, it may reach a remarkably high selectivity [23,24].
Optimisation of extraction parameters is one of the most important factors that should be considered in SFE in order to improve the final recovery of the desired components. There are various factors, such as time, pressure, co-solvent concentration, temperature, particle size, and co-solvent flow rate, which are known to affect the extraction process of phenolic compounds [25,26]. Individual screening of these parameters at a time is laborious and requires lots of trial and error. Thus, establishment of an optimisation technique for phenolic extraction is required. Other than the important information gained through the phase equilibrium engineering, it is essential to optimise the processes by using experimental designs and statistical modelling [27,28]. Response surface methodology (RSM) is a useful and popular statistical method that has been practiced in research to study complex variable processes and to determine the region where extraction conditions are optimised [29]. Nevertheless, the feasibility of using this technique for phenolic acid extraction from L. pumila has not yet been explored. In addition, SFE has received wide interest for the extraction of natural products in addition to MAE due to some benefits, such as reduced solvent consumption, fast extraction time, reduced solvent consumption, lower operating temperature, and increased efficiency. However, the scale-up processes are often interrupted by the lack of understanding of the extraction mechanism of the specific components.
This paper is the continuation of our previous paper [30], which studied the effects of different types and concentrations of co-solvents based on yield, composition, and antioxidants capacity of extract prior to optimisation studies. Other conventional and modern methods conducted by other researchers for phenolics extraction of L. pumila have already been discussed in the paper [30]. In our previous work [30], we discovered that the SC-CO2 with co-solvent 70% ethanol–water is a better option to pure SC-CO2 extraction, conventional chemical solvents, and other methods for phenolic extraction as it gives a higher combination of phenolic content extracted and antioxidants capacity at shorter extraction time [30]. Thus, the usage of this solvent system (70% ethanol–water) was considered for further optimisation studies in this research. Further investigation of the influence of different SC-CO2 operating parameters is significant to recover the final optimum yield and phenolic content with fewer processing steps. Therefore, this study aimed to determine the effects of SFE operating parameters on the extraction yield and individual phenolic contents (gallic acid, methyl gallate, and caffeic acid) in L. pumila leaves and then optimise the extraction conditions by using RSM.

2. Materials and Methods

2.1. Sample Preparation

The L. pumila leaves was procured from Batu Pahat, Johor. A botanist (Dr Shamsul Khamis) from the Department of Biological Sciences and Biotechnology, Faculty of Science and Technology, Universiti Kebangsaan Malaysia (UKM) had verified the plant identity. The voucher specimen (voucher specimen number of L. pumila var. pumila = UKMB 30007/SM s.n.) was deposited at the Herbarium of UKM. Prior to the experiment, the L. pumila leaves were washed under running tap water to eliminate foreign matters adhered to the surface and dried at room temperature until the moisture content was constant (6% w/w). The dried leaves were pulverised and sieved. The particle size was determined in the range from 0.8 mm to 0.5 mm by sieving by using a standard sample sieve and a sieve shaker. The powdered dried sample was stored at 4 °C before use for experiments in an airtight dark container to avoid moisture absorption and then stored in a dry environment prior to the experiments. Most of the solvents and chemicals used were of analytical grade, ethanol (Fisher Scientific, Pittsburgh, PA, USA). The acetonitrile used was of high-performance liquid chromatography (HPLC) grade (Merck, Darmstadt, Germany).

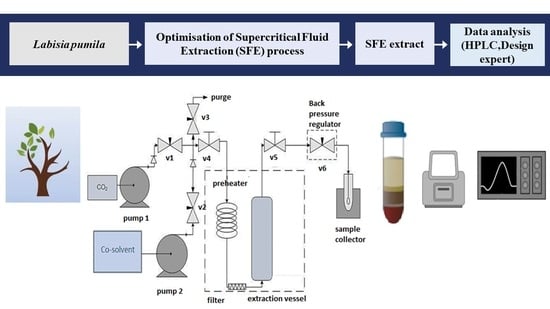
2.2. Supercritical Fluid Extraction (SFE)

The SFE system included a Series III solvent pump (Lab Alliance, PA, USA), PU-2080 model CO2 pump (JASCO Corporation, Tokyo, Japan), an extractor vessel enclosed in a FX2–2 model air-circulating oven (Sheldon Manufacturing, Cornelius, OR, USA), a BP-1580-81 model back-pressure regulator (BPR) (JASCO Corporation, Tokyo, Japan), a sample collector, and a 682-8 model pressure transmitter (Dwyer Instrument, Michigan City, IN, USA). The commercial-grade liquefied CO2 (99.9%) was purchased from Linde, Malaysia. The CO2 was chilled to −2 °C using a chiller (Protech Electronic, Selangor, Malaysia) to maintain its liquid state before it was pumped to the extractor. The extractor consisted of a high-pressure stainless-steel vessel, which was packed with ground L. pumila. In order to retain the system pressure, a back-pressure regulator was used, and the needle valves regulated the flow of the SFE process. Ethanol (99.9% purity) with different concentrations represented the co-solvent to improve the polarity of solvent and enhance the effectiveness of SC-CO2 extraction. L. pumila powder (5.0 g) was extracted in the static mode for 30 min, followed by a dynamic extraction for 240 min (4 h) with a total flow rate of 4 mL/min. For every 30 min, the extract fractions were collected. At the end of the extraction time, the extractor vessel was depressurised at ambient pressure and temperature. Then, the extract was separated and collected in a collector at atmospheric pressure and ambient temperature. Extracts collected at different conditions were analysed for yield and individual phenolic contents. All of the extracts were dried to completion in an oven at 40 °C. Then, prior to further analysis, the collection bottle was kept under refrigeration (4 °C) in the dark.

2.3. Component Analysis

The measurements of the determination and separation of gallic acid, methyl gallate, and caffeic acid were achieved by using the High-Performance Liquid Chromatography (HPLC) technique equipped with an auto sampler and a UV/vis detector (Agilent Technologies, Deutschland GmbH, Waldbronn, Germany). A reversed-phase C18 Intersil ODS-3 column with particle diameter 150 × 4.6 mm i.d. and 5 μm was used for analysis. The separation was performed by a flow rate of 1 mL/min with 0.1% of phosphoric acid in water (solvent A) and acetonitrile (solvent B) with a gradient of solvent B: 8–22% (35 min) and 22–8% (10 min). For a standard preparation, the mobile phase of acetonitrile and phosphoric acid was prepared, degassed in an ultrasonic bath, and injected through the chromatographic column with a 20 μL injection volume. The individual phenolic acids were identified at the maximum absorption wavelength in the mobile phase: gallic acid (270 nm), methyl gallate (280 nm), and caffeic acid (340 nm). The identification of phenolic compounds was confirmed by comparing the retention times with the purchased standards. Each phenolic extract and standard was filtered through a nylon filter of 0.45 μm pore size prior to HPLC injection.

2.4. Experimental Design Using Response Surface Methodology (RSM) and Statistical Analysis

The centre point values and the ranges of the three independent variables were established based on the findings of preliminary studies. The experimental design was designed: (i) to find a relationship between each response and four independent variables, and (ii) to verify the optimum level of the independent variables that was the study’s primary objective. Data were analysed by using analysis of variance (ANOVA) to study the effects of linear, quadratic, and interaction variables on extraction yield, gallic acid content, methyl gallate content, and caffeic acid content and the lack of fit. The RSM and data analysis were performed using Design Expert software (Version 13; Stat-Ease, Inc., Minneapolis, MN, USA). Optimal conditions for phenolic components extraction in L. pumila leaves that were influenced by pressure, temperature, co-solvent concentration, and percentage of ethanol in co-solvent were attained using the predictive equations of RSM. In order to verify the validity of the model, the predicted and experimental values were compared.

3. Results and Discussion

3.1. RSM Statistical Analysis

Table 1 shows the matrix of optimisation through experimental design by the CCD. The tests were conducted in random order. The ranges of the parameter were carefully chosen based during the preliminary study of co-solvent selection. Response surface analysis gave rise to the development of the polynomial regression relationship, whereby each response variable (Yi) was defined as a function of pressure (X1), temperature (X2), percentage of ethanol in co-solvent (X3), and co-solvent concentration (X4). Table 2 shows the estimated regression coefficients of the response models together with the lack-of-fit tests and the corresponding R2 values.
There was a significant (p < 0.05) regression relationship between the independent variables (pressure, temperature, percentage of ethanol in co-solvent, and co-solvent concentration) and the responses (extraction yield, gallic acid content, methyl gallate content, and caffeic acid content). The response surface analysis attained high R2 values ranging from 0.9577 to 0.9651, as shown in Table 2. This revealed that at least 95% of the variation in the response variables could be precisely explained by the regression models relating the responses and the independent variables. This result effectively confirmed a satisfactory fitness of the response surface models applied for describing the response variations as a function of four independent variables (pressure, temperature, percentage of ethanol in co-solvent, and co-solvent concentration) (Table 2). The generated models significantly described the real relationships among the reaction factors and effectively described the data variation.
As presented in Table 3, the main effects of temperature, percentage of ethanol in co-solvent, and co-solvent concentration had significant (p < 0.05) effects on the extraction yield. For gallic acid content, temperature and co-solvent concentration gave the most significant (p < 0.05) effects. According to Table 3, all factors (pressure, temperature, percentage of ethanol in co-solvent, and co-solvent concentration) were very significant in extracting methyl gallate content (Y3) and caffeic acid content (Y3) (p < 0.05). The interaction effects of several independent variables (pressure, temperature, percentage of ethanol in co-solvent, and co-solvent concentration) also significantly (p < 0.05) influenced the response variables (Table 3). This is consistent with other work discussed by Ty’skiewicz et al. [31] about the application of supercritical fluid extraction in phenolic compounds isolation from natural plant materials by using ethanol-modified CO2 conducted at various extraction operating conditions [31].
Table 4 shows the predicted and experimental optimal values for the response variables. To the best of the researchers’ knowledge, existing literature demonstrated that the ranges of gallic acid content in three varieties of L. pumila Benth (Lanceolata, Pumila, and Alata) leaf from Malaysia were between 0.022% g/g and 0.30% g/g [5,30]. In a previous study, Radzali et al. [30] reported that the maximum gallic acid content in L. pumila was observed at 60 °C after 4 hr of the SC-CO2 technique with 70% ethanol–water as the co-solvent with 0.30% g/g gallic acid [30]. Interestingly, in this study, after optimising the SC-CO2 technique with 78% (v/v) of ethanol-water in co-solvent, the gallic acid content was detected to be much higher than reported (1.27% g/g) (Table 4), whereas the methyl gallate amount extracted in this work was also greater (0.44% g/g) (Table 4) than that of our prior study: 0.28 g/g [30]. The researchers postulated that the ranges of caffeic acid content from methanolic extract of the leaf, root, and stem of three L. pumila Benth varieties (Alata, Lanceolata, and Pumila) were found between 0.002% g/g and 1.11% g/g [5,30]. The caffeic acid amount extracted in this work was also significantly higher (1.38% g/g) (Table 4) than previously documented. The differences in the individual phenolic contents reported might be due to different polarities of the various components present, and the method of extraction, a slight variation in the morphological location of the solute in matrix, harvest season, ecological and climate system, as well as collected biomass geographical area could also affect the extract constitution [32] and consequently lead to a wide range of phenolic content.

3.2. Effect of Operating Pressure on Extraction Yield and Phenolic Contents

In this work, the effect of linear terms was not significant for pressure as p > 0.05 for extraction yield (Table 3). Nevertheless, there were significant effects on linear terms and interactions between pressure and temperature for most of the phenolic (gallic acid, methyl gallate, and caffeic acid) content (p < 0.05) (Table 3). Based on Figure 1, Figure 2 and Figure 3, at lower pressure, the phenolic compound yield was less due to the low solubility of phenolics at low-density CO2. Nonetheless, the yield rose significantly at higher pressure. In Figure 1, Figure 2 and Figure 3 (at the bottom surface), the red lines represent the highest magnitude values followed by orange, yellow, green, and blue lines that show the lowest magnitude values affecting the responses. According to Lang and Wai [33], an increase in pressure could reduce the distance among the molecules through the rupturing effect of pressure, thereby improving interactions between the matrix and fluid [33]. During the rupturing process, the chemical components in the plant materials were rapidly released into the surrounding supercritical fluid medium, which improved the solute solubility, diffusion of solvent into the plant matrix, mass transfer rate, and increase in yield of extraction [34,35,36].
Figure 1, Figure 2 and Figure 3 demonstrate the effect of pressure on extraction yield and the targeted phenolic content with respect to temperature, ethanol content, and co-solvent concentration, respectively. In Figure 1, the results demonstrate that the rise in pressure had a positive impact on the extraction yield and most of its individual phenolic content extracted for the increase in pressure from 150 bar to 283 bar (Figure 1). The findings are also in good agreement with those of other findings, which found this positive effect at higher pressure levels [37,38,39,40]. The enhancement in density of CO2 and solvating power with pressure improved the dissolution of phenolic compounds in supercritical fluid medium, which caused the positive effect of the pressure. At the same applied temperature, most of the phenolic compounds increased with the rise in pressure. Usually, the effect of temperature is a function of the extraction pressure in SC-CO2 extraction due to the “cross-over” pressure. Nevertheless, the temperature effect was more complex and cross-over phenomena [41] around 15 MPa were discovered in all targeted phenolic contents (Figure 1). At pressures below the cross-over pressure, the solubility decreased with temperature, whereas at pressures above the cross-over pressure, the solubility increased with the rise in temperature. However, the effect of temperature was more complex and inverse solubility (crossover pressure) behaviour could be observed for gallic acid in the range of pressures investigated in this study (Figure 1b). Other researchers also found the same pattern for ρ coumaric acid and ferulic acid [42].
According to Al-Rawi et al. [43], when the pressure is reduced, the selectivity will be improved and, as the applied pressure increases, the solvent power rises and the extraction selectivity becomes smaller [43]. At high pressure, oils, weakly polar (chlorophylls) impurities, and nonpolar impurities (waxy material) are also easily co-extracted [43,44]. The high pressure is also bound to result in a greater cost for the increase in energy demand and extraction operating system. In consideration of the purity of the extractant, the capacity of the co-solvent pump, and saving energy, an extraction pressure of 283 bar was selected as the highest pressure. Further determination of optimisation studies was carried out after preliminary tests by using eight different co-solvents [30]. As the maximum capacity of the co-solvent pump was 400 bar, the co-solvent pump desired a greater pressure than the CO2 pump. Therefore, if the extraction was conducted at 400 bar, the capacity of the co-solvent pump must be greater than 500 bar. This selection was also made based on global yield and composition of extract, both of which were necessary for the selectivity approach of this study (one of the highest contents of major compounds and the best global yields observed).

3.3. Effect of Operating Temperature on Extraction Yield and Phenolic Contents

Figure 1, Figure 4 and Figure 5 present the temperature effect on extraction yield and the targeted phenolic content. Generally, the results of this work revealed that the extraction yield improved with the increment in temperature. However, the observation also implied that the extraction of most phenolic components rose to a certain level but then started to decline (Figure 1, Figure 4 and Figure 5). Nobre et al. [45] found that the solutes solubility was affected by the trade-off between the two variables: the density of the solvent (favoured by the pressure, at constant temperature) and the vapour pressure of the solutes (favoured by the temperature). The solubility was, thus, manipulated by the exchange between these two parameters.
As demonstrated in Figure 1b–d, raising the temperature from 40 °C to above 50 °C in the range of 100 bar–300 bar reduced most of the phenolic compounds extracted. This could be justified by the fact that the temperature increment would enhance the vapour pressure and improve the solubility of the phenolics in solvent. Consequently, the tendency of these compounds to travel to the fluid phase improved and, finally, some of the phenolics would vaporise. The higher temperature improved the extraction effectiveness by reducing the extractant viscosity, which led to better penetration inside the plant material. However, certain antioxidants could also degrade at higher temperature. These results are consistent with the previous observation in the temperature range of (70 °C–80 °C) [36,39]. Liyana-Pathirana and Shahidi [46] optimised the phenolic extraction from wheat by using the response surface methodology and stated that certain antioxidants might mobilise and decompose at higher temperature. Additionally, from the commercial point of view, extreme temperature may promote solvent loss through vaporisation and raise the extraction cost process [47]. Taking all the results into consideration, a temperature below 40 °C was chosen for further determination and validation of the optimum condition studies. These results parallel those of other recent studies that attributed the effect of optimal conditions at a temperature range from 30 °C to 40 °C on the SC-CO2 extraction of polyphenols using ethanol (20%, 30%, 50%, and 80% (v/v)) as a modifier [48,49,50,51].

3.4. Effect of Ethanol Content in Co-Solvent on Extraction Yield and Phenolic Contents

Figure 2, Figure 4 and Figure 6 indicate the effect of ethanol content in co-solvent on extraction yield and phenolic contents. Carbon dioxide has a low capability for dissolving polar molecules such as phenolics due to its non-polar nature [52]. This observation implied that the non-polar character of carbon dioxide would be manipulated by the presence of a polar co-solvent (Figure 6). There was a significant (p < 0.05) linear effect of ethanol content in water on the yield and most phenolic contents (methyl gallate and caffeic acid) (Table 3). Ethanol percentage also had a quadratic effect on gallic acid, indicating that it was an important factor deserving attention with respect to the phenolic extraction. The variation effects (positive or negative) can be explained by the variation in individual phenolic properties, which were dissolved differently due to different polarities of the combination of ethanol with water (Table 3). The combination of ethanol with water could change the polarity and dielectric constant of a solvent [53]. In turn, the selection of a solvent or co-solvent mixture for phytochemical extraction has to be matched to the polarity of the targeted components.
In addition to the above findings, it was discovered that the phenolic acids extraction yield with 60% (v/v) ethanol was higher (20.004% g/g extract) as compared to 80% (v/v) ethanol (15.768% g/g extract), with the same extraction conditions of 250 bar, 80 °C, and 15.00% (v/v) of co-solvent concentration (Table 1). This observation implied that most components in L. pumila leaves were very polar compounds, which were easier to extract using more polar mixtures of solvents. The polarity of the ethanol-water mixture increased when more water was added. According to Tabaraki and Nateghi [54], a larger amount of polar phenolic acid constituents may be extracted due to the “like dissolves like” principle. The hydroxyl group in ethanol and water could form hydrogen bonding with the solute. The presence of more water molecules in the solvent mixture improved its ability to extract the polar compounds. However, significant losses of the targeted phytochemicals could occur if an unsuitable co-solvent was used. These losses could occur for targeted constituents that were eliminated via undesired reactions facilitated with the solvent by the solvent itself or with the solvent [55].
Usually, most natural compounds are very soluble in solvents of higher pressure [56] or high density [57]. The justification for this is that, under different pressures, concentrations, and solvents, the destruction of membranes and the denaturation of protein are different [58,59]. On the other hand, the components could be fractionated into groups of polarity to obtain extracts with interesting compositions with low undesirable compounds. Based on Figure 7, the polarity of caffeic acid was slightly below those of the methyl gallate and gallic acid. Complex constituents such as methyl gallate (methyl ester) were less polar as compared to polar-free phenolics. This is consistent with other studies that affirmed that the extraction yield of phenolic content is greatly dependent on the solvent polarity [60,61]. It is worth mentioning that co-solvents could modify some characteristics of the supercritical fluid medium, such as the formation of hydrogen bonds, polarity, and specific interactions with the solute, or interaction with the active sites of the solid matrix [62].

3.5. Co-Solvent Concentration Effects on Extraction Yield and Phenolic Contents

Figure 3, Figure 5 and Figure 6 show the effects of co-solvent concentration on extraction yield and the desired phenolic contents. It was clear that the phenolics increased with increasing co-solvent concentration at the same applied extraction condition. When the co-solvent amount was up to a certain value (16% (v/v)) with no further significant improvement, the yield of extraction achieved a maximum point, which was caused by the higher amount of co-solvent (Figure 3a, Figure 5a and Figure 6a). Thus, 16% (v/v) of co-solvent was selected for the subsequent experiments (validation for optimisation). Obviously, the results exhibited a very significant positive and linear effect for the co-solvent concentration on the yield of extraction, and all phenolic contents of interest (gallic acid, methyl gallate, and caffeic acid) as it was proven from very high Fisher’s F-test values (138.83 for extraction yield, 208.01 for gallic acid content, and 176.41 for methyl gallate content) with a very low probability value (p < 0.05) (Table 3). The findings from this study also parallel another study conducted by Li et al. [63] that stated that the solvent concentration had the most prominent effect on all extraction parameters, followed by temperature contributing to the phenolic extraction, rosmarinic acid, and antioxidants from perilla leaves using RSM [63].
Maran et al. [34] also obtained similar results when studying the influence of co-solvent amount on the phenolic compounds from Syzygium cumini fruit pulp at the temperature range of 40 °C–60 °C and pressure range of 100 bar–200 bar with different co-solvent flow rates ranging from 1 g/min to 3 g/min. As it was indicated by other researchers, the solvent concentration played a key role in the extraction of soluble solids from several natural products [34,46]. Likewise, Kwon et al. [64] also postulated that solvent concentration was the most crucial parameter affecting the ginseng components extraction using RSM [64]. Therefore, it could be drawn from these findings that it would be easier to extract the polar compounds in the plant using more polar solvent. The addition of more co-solvent to the supercritical solvent could improve its capability to extract the polar phenolics, due to the polarity increment in the solvent mixture. The structure of the cellular matrix was changed by the polar co-solvents via intra-crystalline, osmotic swelling, and broke the analyte matrix bindings by competing with polar interactions between matrixes, which, in turn, enhanced the solubility of the desired components [65]. Nevertheless, Murga et al. [66] also noticed that ethanol is capable of dipole–dipole interactions with hydrogen-bonding and phenols [66]. Hence, the blend of this solvent would possibly represent a suitable modifier for the SC-CO2 extraction of phenolics.

3.6. Determination and Validation of Optimum Conditions

With the purpose of determining and validating an optimum set level of temperature, pressure, percentage of ethanol in co-solvent, and co-solvent concentration for determining the desirable extraction yield and individual phenolic content, numerical and graphical optimisations were conducted in this work. Numerical optimisation was performed to find the exact value of multiple response optimisation that led to the desired goals. The overall optimum region was attained at a pressure of 283 bar, temperature of 32 °C, 78% (v/v) of ethanol in co-solvent, and 16% (v/v) of co-solvent concentration with a desirability value of 0.883. At this optimum condition, the corresponding predicted response value for extraction yield was 14.34% g/g of extract, whilst the individual phenolic contents detected were 1.34% g/g (gallic acid), 0.42% g/g (methyl gallate), and 1.47% g/g (caffeic acid). The experimental accuracy of extraction yield and the targeted individual phenolic content under the optimum conditions (mean value of triplicate experiments) was observed to be 14.05 ± 0.76% (g/g) of extraction yield, 1.27 ± 0.10% (g/g) of gallic acid, 0.44 ± 0.29% (g/g) of methyl gallate, and 1.38 ± 0.37% (g/g) of caffeic acid, as shown in Table 4. Verification experiments carried out at three different predicted optimal conditions derived from ridge analysis of RSM confirmed that the experimental response values were found to be reasonably close to the predicted values, thus confirming the validity and adequacy of the predicted response surface models.

4. Conclusions

These findings highlighted the potential of SC-CO2 of L. pumila to be further developed for a pilot-scale production. Within the explored experimental region, the best SC-CO2 extraction conditions were at 283 bar, 32 °C, 78% (v/v) of ethanol-water in co-solvent, and 16% (v/v) of co-solvent concentration that allowed the recovery of 14.051 ± 0.76% (g/g) of extraction yield, 1.2650 ± 0.10% (g/g) of gallic acid, 0.441 ± 0.29% (g/g) of methyl gallate, and 1.382 ± 0.37% (g/g) of caffeic acid for 240 min of extraction time. The analysis of variance (ANOVA) proved that almost all of the factors studied had a significant effect on the phenolic extraction, especially the percentage of ethanol in co-solvent, temperature, and co-solvent concentration in the supercritical mixture. Under the optimised conditions, the experimental values agreed well with the values predicted by the ridge analysis. The experimental conditions allowed an effective, quantitative, and maximum extraction of phenolic compounds from the herb. The results and understanding of this study may offer preliminary insight into the preparation of standardised extracts of L. pumila enriched with natural antioxidants prior to commercialisation at the industrial level.

Author Contributions

S.A.R.: experiments, writing, and revising the manuscript; M.M.: methodology, validation, supervision, review, and supported resources; N.M.S.: review, supervision, methodology, and validation. All authors have read and agreed to the published version of the manuscript.

Funding

This research was supported by the Ministry of Agriculture and Agro-based Industry, Malaysia (MOA), grant no. NH1113P008-2; National University of Malaysia, UKM, grant nos. ETP-2013-062 and GUP-2019-009. The authors would like to thank the Department of Chemical and Process Engineering and Built Environment, UKM for the HPLC analysis.

Institutional Review Board Statement

Not applicable.

Informed Consent Statement

Not applicable.

Conflicts of Interest

The authors declare no conflict of interest. The funders had no role in the design of the study; in the collection, analyses, or interpretation of data; in the writing of the manuscript, or in the decision to publish the results.

References

  1. Sunamo, B. Revision of the genus Labisia (myrsinaaceae). Blumea 2005, 50, 579–597. [Google Scholar]
  2. Vijayalakshmi, R.; Ravindhran, R. Comparative fingerprint and extraction yield of Diospyrus ferrea (willd.) Bakh. root with phenol compounds (gallic acid), as determined by uv–vis and ft–ir spectroscopy. Asian Pac. J. Trop. Biomed. 2012, 2, S1367–S1371. [Google Scholar] [CrossRef]
  3. Chua, L.S.; Latiff, N.A.; Lee, S.Y.; Lee, C.T.; Sarmidi, M.R.; Aziz, R.A. Flavonoids and phenolic acids from Labisia pumila (Kacip Fatimah). Food Chem. 2011, 127, 1186–1192. [Google Scholar] [CrossRef] [PubMed]
  4. Abdullah, N.; Chermahini, S.H.; Suan, C.L.; Sarmidi, M.R. Labisia pumila: A review on its traditional, phytochemical and biological uses. World Appl. Sci. J. 2013, 10, 1297–1306. [Google Scholar]
  5. Karimi, E.; Jaafar, H.Z.E.; Ahmad, S. Phytochemical analysis and antimicrobial activities of methanolic extracts of leaf, stem and root from different varieties of Labisa pumila Benth. Molecules 2011, 16, 4438–4450. [Google Scholar] [CrossRef] [PubMed]
  6. Mohd Nazrul Hisham, D.; Mohd Lip, J.; Mohd Noh, J.; Normah, A.; Nurul Nabilah, M.F. Identification and isolation of methyl gallate as a polar chemical marker for Labisia pumila Benth. J. Trop. Agric. 2011, 39, 279–284. [Google Scholar]
  7. Tsao, R.; Deng, Z. Separation procedures for naturally occurring antioxidant phytochemicals. J. Chromatogr. 2004, 812, 85–99. [Google Scholar] [CrossRef]
  8. Spigno, G.; Tramelli, L.; De Faveri, D.M. Effects of extraction time, temperature and solvent on concentration and anti-oxidant activity of grape marc phenolics. J Food Eng. 2007, 81, 200–208. [Google Scholar] [CrossRef]
  9. Mohammad Azmin, S.N.H.; Abdul Manan, Z.; Wan Alwi, S.R.; Chua, L.S.; Mustaffa, A.A.; Yunus, N.A. Herbal Processing and Extraction Technologies. Sep. Purif. Rev. 2016, 45, 305–320. [Google Scholar] [CrossRef]
  10. Glisic, S.B.; Ristic, M.; Skala, D.U. The combined extraction of sage (Salvia officinalis L.) ultrasound followed by supercritical CO2 extraction. Ultrason Sonochem. 2011, 18, 318–326. [Google Scholar] [CrossRef]
  11. Hossain, M.B.; Brunton, N.P.; Patras, A.; Tiwari, B.; O’Donnell, C.P.; Martin-Diana, A.B.; Barry-Ryan, C. Optimization of ultrasound assisted extraction of antioxidant compounds from marjoram (Origanum majorana L.) using response surface methodology. Ultrason Sonochem. 2012, 19, 582–590. [Google Scholar] [CrossRef] [PubMed] [Green Version]
  12. Caxambu, S.; Biondo, E.; Kolchinski, E.M.; Padilha, R.L.; Brandelli, A.; Sant’Anna, V. Evaluation of the antimicrobial ac-tivity of pecan nut [Carya illinoinensis (Wangenh) C. Koch] shell aqueous extract on minimally processed lettuce leaves. Food Sci. Technol. 2016, 36, 42–45. [Google Scholar] [CrossRef] [Green Version]
  13. Markom, M.; Hasan, M.; Daud, W.R.W.; Singh, H.; Jahim, J.M. Extraction of hydrolysable tannins from Phyllanthus niruri Linn.: Effects of solvents and extraction methods. Sep. Purif. Technol. 2007, 52, 487–496. [Google Scholar] [CrossRef]
  14. Kamarudin, N.A.; Markom, M.; Latip, J. Effects of solvents and extraction methods on herbal plants Phyllanthus niruri, Orthosiphon stamineus and Labisa pumila. J. Teknol. (Sci. Eng.) 2015, 72, 1–6. [Google Scholar]
  15. Hassim, N.; Markom, M.; Rosli, M.I.; Harun, S. Scale-up criteria and economic analysis for supercritical fluid extraction of Phyllanthus niruri. Chem. Eng. Process. Process Intensif. 2019, 139, 14–22. [Google Scholar] [CrossRef]
  16. Hassim, N.; Markom, M.; Rosli, M.I.; Harun, S. Effect of static extraction time on supercritical fluid extraction of bioactive compounds from Phyllanthus niruri. J. Comput. Theor. Nanosci. 2020, 17, 918–924. [Google Scholar] [CrossRef]
  17. Da Porto, C.; Natolino, A. Supercritical fluids extraction of polyphenols from grape seed (Vitis vinifera): Study on process variables and kinetics. J. Supercrit. Fluids 2017, 130, 239–245. [Google Scholar] [CrossRef]
  18. Panja, P. Green extraction methods of food polyphenols from vegetable materials. Curr. Opin. Food Sci. 2017, 23, 173–182. [Google Scholar] [CrossRef]
  19. Al Jitan, S.; Alkhoori, S.A.; Yousef, L.F. Studies in Natural Products Chemistry. Phenolic Acids from Plants: Extraction and Application to Human Health; Atta-ur-Rahman, Ed.; Elsevier: Amsterdam, The Netherlands, 2018; Volume 58, pp. 389–417. [Google Scholar]
  20. Radzali, S.A.; Markom, M.; Baharin, B.S.; Othman, R.; Rahman, R.A. Co-solvent Selection for Supercritical Fluid Extraction of Astaxanthin and Other Carotenoids from Penaeus monodon Waste. J. Oleo Sci. 2014, 63, 763–777. [Google Scholar] [CrossRef] [Green Version]
  21. Mohd Sarmin, N.; Radzali, S.A.; Markom, M. Optimisation of Microencapsulation of Citrus Hystrix, L. Oil Sub and Super-critical Co2 Using Response Surface Methodology. J. Teknol. 2017, 79, 29–40. [Google Scholar]
  22. Markom, M.; Hassim, N.; Anuar, N.; Baharum, S.N. Co-solvent Selection for Supercritical Fluid Extraction of Essential Oil and Bioactive Compounds from Polygonum minus. ASEAN J. Chem. Eng. 2012, 12, 19–26. [Google Scholar] [CrossRef] [Green Version]
  23. Reverchon, E.; Donsi, G.; Osseo, L.S. Modeling of supercritical fluid extraction from herbaceous matrices. Ind. Eng. Chem. Res. 1993, 32, 2721–2726. [Google Scholar] [CrossRef]
  24. Liza, M.S.; Abdul Rahman, R.; Mandana, B.; Jinap, S.; Rahmat, A.; Zaidul, I.S.M. Supercritical carbon dioxide extraction of bioactive flavonoid from Strobilanthes crispus (Pecah Kaca). Food Bioprod. Process. 2009, 88, 319–326. [Google Scholar] [CrossRef]
  25. Cacace, J.E.; Mazza, G. Mass transfer process during extraction of phenolic compounds from milled berries. Int. J. Food Eng. 2003, 59, 379–389. [Google Scholar] [CrossRef]
  26. Ng, L.Y.; Ang, Y.K.; Khoo, H.E.; Yim, H.S. Influence of different extraction parameters on antioxidant properties of Carica papaya peel and seed. Res. J. Phytochem. 2012, 6, 61–74. [Google Scholar]
  27. Zarena, A.S. Characterization of Bioactive Compounds from Garcinia mangostana L. Obtained by Supercritical Fluid Carbon Dioxide Process. Ph.D. Thesis, University of Mysore, Karnataka, India, 2011. [Google Scholar]
  28. Manohar, B.; Udaya Sankar, K. Enrichment of bakuchiol in supercritical carbon dioxide extracts of chiba seed (Psoralea corylifolia L.) using molecular distillation-Response surface methodology. Biotechnol. Bioproc. E 2009, 14, 112–117. [Google Scholar] [CrossRef]
  29. Bezerra, M.A.; Santelli, R.E.; Oliveira, E.P.; Villar, L.S.; Escaleira, L.A. Response surface methodology (RSM) as a tool for optimization in analytical chemistry. Talanta 2008, 76, 965–977. [Google Scholar] [CrossRef]
  30. Radzali, S.A.; Markom, M.; Saleh, N.M. Co-Solvent Selection for Supercritical Fluid Extraction (SFE) of Phenolic Compounds from Labisia pumila. Molecules 2020, 25, 5859. [Google Scholar] [CrossRef]
  31. Tyśkiewicz, K.; Konkol, M.; Rój, E. The Application of Supercritical Fluid Extraction in Phenolic Compounds Isolation from Natural Plant Materials. Molecules 2018, 23, 2625. [Google Scholar] [CrossRef] [Green Version]
  32. Colegate, S.M.; Molyneux, R.J. An introduction and overview. In Bioactive Natural Products: Detection Isolation and Structural Determination, 2nd ed.; Colegate, S.M., Molyneux, R.J., Eds.; CRC Press: Boca Raton, FL, USA, 2011; pp. 1–9. [Google Scholar]
  33. Lang, Q.; Wai, C.M. Supercritical fluid extraction in herbal and natural product studies—A practical review. Talanta 2001, 53, 771–782. [Google Scholar] [CrossRef]
  34. Maran, J.P.; Priya, B.; Manikandan, S. Modeling and optimization of supercritical fluids extraction of anthocyanin and phenolic compounds from Syzygium cumini fruit pulp. J. Food Sci. Technol. 2014, 51, 1938–1946. [Google Scholar] [CrossRef] [Green Version]
  35. Prasad, K.N.; Yang, B.; Shi, J.; Yu, C.; Zhao, M.; Xue, S. Enhanced antioxidant and antityrosinase activities of longan fruit pericarp by ultrahigh pressure assisted extraction. J. Pharm. Biomed. 2010, 51, 471–477. [Google Scholar] [CrossRef]
  36. Sonsuzer, S.; Sahin, S.; Yilmar, L. Optimization of supercritical CO2 extraction of Thymbra spicata oil. J. Supercrit. Fluids 2004, 30, 189–199. [Google Scholar] [CrossRef]
  37. Radzali, S.A.; Baharin, B.S.; Othman, R.; Markom, M.; Abdul Rahman, R. Optimisation of supercritical fluid extraction of astaxanthin from Penaeus Monodon waste using ethanol-modified carbon dioxide. J. Eng. Sci. Technol. 2016, 11, 722–736. [Google Scholar]
  38. Kryževičiute, N.; Kraujalis, P.; Venskutonis, P.R. Optimization of high pressure extraction processes for the separation of raspberry pomace into lipophilic and hydrophilic fractions. J. Supercrit. Fluids 2016, 108, 61–68. [Google Scholar] [CrossRef]
  39. Krichnavaruk, S.; Shotipruk, A.; Goto, M.; Pavasant, P. Supercritical carbon dioxide extraction of astaxanthin from Haem-atococcus pluvialis with vegetable oils as co-solvent. Bioresour. Technol. 2008, 99, 5556–5560. [Google Scholar] [CrossRef]
  40. Macías-Sánchez, M.D.; Mantell, C.; Rodríquez, M.; Martínez de la Ossa, E.; Lubián, L.M.; Montero, O. Supercritical fluid extraction of carotenoids and chlorophyll a from Sunechococcus sp. J. Supercrit. Fluids 2007, 39, 323–329. [Google Scholar] [CrossRef]
  41. Brunner, G. Gas Extraction; Springer: New York, NY, USA, 1994; p. 69. [Google Scholar]
  42. Murga, R.; Sanz, M.T.; Beltrán, S.; Cabezas, J.L. Solubility of three hydroxycinnamic acids in supercritical carbon dioxide. J. Supercrit. Fluids 2003, 27, 239–245. [Google Scholar] [CrossRef]
  43. Al-Rawi, S.; Ibrahim, A.; Rahman, N.; Nama, M.; Majid, A.; Kadir, M. the effect of supercritical fluid extraction parameters on the nutmeg oil extraction and its cytotoxic and antiangiogenic properties. Procedia Food Sci. 2012, 1, 1946–1952. [Google Scholar] [CrossRef] [Green Version]
  44. Hawthorne, S.B.; Riekkola, M.; Serenius, K.; Holm, Y.; Hiltunen, R.; Hartonen, K. Comparison of hydrodistillation and supercritical fluid extraction for the determination of essential oils in aromatic plants. J. Chromatogr. A 1993, 634, 297–308. [Google Scholar] [CrossRef]
  45. Nobre, B.; Marcelo, F.; Passos, R.; Beirao, L.; Palavra, A.; Gouveia, L.; Mendes, R. Supercritical carbon dioxide extraction of astaxanthin and other carotenoids from the microalga Haematococcus pluvialis. Eur. Food Res. Technol. 2006, 223, 787–790. [Google Scholar] [CrossRef]
  46. Liyana-Pathirana, C.; Shahidi, F. Optimization of extraction of phenolic compounds from wheat using response surface methodology. Food Chem. 2005, 93, 47–56. [Google Scholar] [CrossRef]
  47. Hismath, I.; Wan Aida, W.M.; Ho, C.W. Optimization of extraction conditions for phenolic compounds from neem (Azadirachtaindica) leaves. Int. Food Res. J. 2011, 18, 931–939. [Google Scholar]
  48. Liu, C.M.; Zhao, J.M.; Li, H.M.; Song, F.R. Supercritical fluids extraction of total flavonoids from leaves of Acanthopanax Senticosus harms. Chem. Res. Chin. Univ. 2007, 23, 233–236. [Google Scholar] [CrossRef]
  49. Bleve, M.; Ciurlia, L.; Erroi, E.; Lionetto, G.; Longo, L.; Rescio, L.; Schettino, T.; Vasapollo, G. An innovative method for the purification of anthocyanins from grape skin extracts by using liquid and sub-critical carbon dioxide. Sep. Purific. Technol. 2008, 64, 192–197. [Google Scholar] [CrossRef]
  50. Woźniak, Ł.; Marszałek, K.; Skąpska, S.; Jędrzejczak, R. The application of supercritical carbon dioxide and ethanol for the extraction of phenolic compounds from choke pomace. Appl. Sci. 2017, 7, 322. [Google Scholar] [CrossRef] [Green Version]
  51. Alvarez, M.V.; Cabred, S.; Ramirez, C.L.; Fanovich, M.A. Valorization on an Agricoindustrial soybean residue by supercritical fluids extraction of phytochemical compounds. J. Supercrit. Fluids. 2019, 143, 90–96. [Google Scholar] [CrossRef]
  52. Farias-Campomanes, A.M.; Rostagno, M.A.; Meireles, M.A.A. Production of polyphenol extracts from grape bagasse using supercritical fluid: Yield, extract composition and economic evaluation. J. Supercrit. Fluids 2013, 77, 70–78. [Google Scholar] [CrossRef]
  53. Yulianthi, N.N.S.; Suhendra, l.; Wrasiati, L.P. Pengaruh perbandingan jenis pelarut terhadap kandungan senyawa total fenol, α-tokoferol, dan total karotenoid ekstrak Sargassum polycystum. J. Rekayasa Dan Manaj. Agroindustri 2017, 5, 1–10. [Google Scholar]
  54. Tabaraki, R.; Nateghi, A. Optimization of ultrasonic-assisted extraction of natural antioxidants from rice bran using response surface methodology. Ultrason. Sonochem. 2011, 18, 1279–1286. [Google Scholar] [CrossRef]
  55. Marsili, R.; Callahan, D. Comparison of a liquid solvent extraction technique and supercritical fluid extraction for the determination of α-and β-carotene in vegetables. J. Chromatogr. Sci. 1993, 31, 422–428. [Google Scholar] [CrossRef] [PubMed]
  56. Von Rohr, P.R. High Pressure Chemistry Engineering; Elsevier: Amsterdam, The Netherlands, 1996. [Google Scholar]
  57. Ziqiang, Z. Supercritical Fluid Technology; Chemical Industry Press: Beijing, China, 2000. [Google Scholar]
  58. Kinetics of Microbial Inactivation for Alternative Food Processing Technologies, High Pressure Processing. A report of the Institute of Food Technologist for the Food and Drug Administration of the U.S. Department of Health and Human Services. Available online: https://www.fda.gov/files/food/published/Evaluation-and-Definition-of-Potentially-Hazardous-Foods.pdf (accessed on 7 January 2022).
  59. Bennett, P.B. High Pressure Biology and Medicine; University of Rochester Press: New York, NY, USA, 1998. [Google Scholar]
  60. Turkmen, N.; Sari, F.; Velioglu, Y.S. Effect of extraction solvents on concentration and antioxidant activity of black and black mate polyphenols determined by ferrous tartrate and Folin-Ciocalteu methods. Food Chem. 2006, 99, 838–841. [Google Scholar] [CrossRef]
  61. Lapornik, B.; Prosek, M.; Wondra, A.G. Comparison of extracts prepared from plant by-products using different solvents and extraction time. J. Food Eng. 2005, 71, 214–222. [Google Scholar] [CrossRef]
  62. Dalmolin, I.; Mazutti, M.A.; Batista, E.A.C.; Meireles, M.A.A.; Oliveira, J.V. Chemical characterization and phase behaviour of grape seed oil in compressed carbon dioxide and ethanol as co-solvent. J. Chem. Thermodyn. 2010, 42, 797–801. [Google Scholar] [CrossRef]
  63. Li, H.-Z.; Zhang, Z.-J.; Xue, J.; Cui, L.-X.; Hou, T.-Y.; Li, X.-J.; Chen, T. Optimization of ultrasound-assisted extraction of phenolic compounds, antioxidants and rosmarinic acid from perilla leaves using response surface methodology. Food Sci. Technol. 2016, 36, 686–693. [Google Scholar] [CrossRef] [Green Version]
  64. Kwon, J.H.; Belanger, J.M.R.; Pare, J.R.J. Optimization of microwave-assisted extraction (MAP) for ginseng components by response surface methodology. J. Agric. Food Chem. 2003, 51, 1807–1810. [Google Scholar] [CrossRef]
  65. Bjorklund, E.; Jaremo, M.; Mathiasson, L.; Jonsson, J.A. Karlsson, L. Illustration of important mechanisms controlling mass transfer in supercritical fluid extraction. Anal. Chim. Acta 1998, 368, 117–128. [Google Scholar] [CrossRef]
  66. Murga, R.; Ruiz, R.; Beltran, S.; Cabezas, J.L. Extraction of natural complex phenols and tannins from grape seeds by using supercritical mixtures of carbon dioxide and alcohol. J. Agric. Food Chem. 2000, 48, 3408–3412. [Google Scholar] [CrossRef]
Figure 1. Effect of pressure and temperature on (a) extraction yield, (b) gallic acid content, (c) methyl gallate content, and (d) caffeic acid content.
Separations 09 00385 g001
Figure 2. Effect of pressure and percentage of ethanol in co-solvent on (a) extraction yield, (b) gallic acid content, (c) methyl gallate content, and (d) caffeic acid content.
Separations 09 00385 g002
Figure 3. Effect of pressure and concentration of co-solvent on (a) extraction yield, (b) gallic acid content, (c) methyl gallate content, and (d) caffeic acid content.
Separations 09 00385 g003
Figure 4. Effect of temperature and percentage of ethanol in co-solvent on (a) extraction yield, (b) gallic acid content, (c) methyl gallate content, and (d) caffeic acid content.
Separations 09 00385 g004
Figure 5. Effect of temperature and concentration of co-solvent on (a) extraction yield, (b) gallic acid content, (c) methyl gallate content, and (d) caffeic acid content.
Separations 09 00385 g005
Figure 6. Effect of percentage of ethanol in co-solvent and co-solvent concentration on (a) extraction yield, (b) gallic acid content, (c) methyl gallate content, and (d) caffeic acid content.
Separations 09 00385 g006
Figure 7. HPLC analysis of phenolic compounds extracted using SC-CO2 with 80% (v/v) ethanol-water as a co-solvent, at 40 °C and 250 bar from leaves of L. pumila: (1) gallic acid, (2) methyl gallate, and (3) caffeic acid.
Separations 09 00385 g007
Table 1. CCD matrix of four variables with their observed responses using SC-CO2 extraction ( α = 1.65).
Run
Order
Pressure
(Bar)
Temperature (°C)Percentage of Ethanol in Co-Solvent (% (v/v))Concentration of Co-Solvent (% (v/v))Extraction Yield (% g/g)Gallic Acid Content (% g/g)Methyl Gallate Content (% g/g)Caffeic Acid Content (% g/g)
1200.027.070.010.013.010.780.301.00
2200.060.070.018.312.771.040.280.47
3250.040.060.05.08.030.630.140.32
4250.080.080.015.015.770.510.190.67
5250.080.060.05.09.150.390.160.51
6250.040.080.015.012.301.040.301.47
7150.040.080.015.010.461.090.190.65
8200.060.070.01.82.590.280.120.46
9150.080.080.015.013.320.950.090.32
10200.060.086.510.07.210.710.191.07
11 *200.060.070.010.012.930.400.210.92
12 *200.060.070.010.015.800.510.200.81
13150.040.080.05.06.170.510.200.50
14250.040.080.05.05.930.600.181.40
15150.040.060.05.014.040.400.170.06
16282.560.070.010.017.850.600.270.75
17 *200.060.070.010.014.050.550.210.79
18250.080.080.05.03.970.090.140.63
19117.560.070.010.013.770.480.160.42
20250.040.060.015.014.961.010.470.53
21250.080.060.015.020.000.710.410.48
22150.040.060.015.013.500.930.310.47
23 *200.060.070.010.014.020.580.240.82
24150.080.080.05.05.460.510.150.25
25150.080.060.05.013.200.410.180.48
26 *200.060.070.010.014.680.420.200.84
27 *200.060.070.010.014.580.510.250.91
28200.093.070.010.017.000.450.190.43
29150.080.060.015.016.100.680.250.55
30200.060.0 53.510.016.600.590.290.68
* Centre point for central composite design (CCD).
Table 2. Regression coefficients, R2, adjusted R2, probability values, and lack of fit for two dependent variables a.
Regression CoefficientsExtraction Yield (Y1)Gallic Acid Content (Y2)Methyl Gallate Content (Y3)Caffeic Acid Content (Y4)
b014.420+0.500+0.221+0.8470
b1+0.214−0.010+0.030+0.1529
b2+0.847−0.121−0.027−0.1146
b3−2.380+0.011−0.038+0.1457
b4+3.140+0.220+0.054+0.0463
b12+0.234−0.080−0.0008−0.0855
b13+0.454−0.080−0.0062+0.1364
b14+1.340−0.010+0.0377−0.0263
b23−0.267−0.018−0.0122−0.1743
b24+1.020−0.037−0.0183−0.0438
b12+0.637+0.020-−0.0217
b21+0.438+0.013-−0.0939
b32+0.143+0.040-−0.0463
b42−0.995+0.053-+0.0114
R20.95850.95840.95840.9577
R2 (adj)0.91970.91960.91960.9181
Regression (p value)<0.0001 b<0.0001 b<0.0001 b<0.0001 b
lack of fit (p value)0.2224 c0.5666 c0.5666 c0.0721 c
a Key: bi, the estimated regression coefficient for the main effects; bii, the estimated regression coefficient for the quadratic effects; bij, the estimated regression coefficient for the interaction effects; 1, pressure; 2, temperature; 3, percentage of ethanol in co-solvent; 4, co-solvent concentration. b Significant (p < 0.05). c Not significant (p > 0.05).
Table 3. F ratio and p value for each independent variable effect in the polynomial response surface models a.
VariablesExtraction Yield (Y1)Gallic Acid Content (Y2)Methyl Gallate Content (Y3)Caffeic Acid Content (Y4)
F Ratiop ValueF Ratiop ValueF Ratiop ValueF Ratiop Value
Main effectsX10.640.43490.430.524052.51<0.000162.20<0.0001
X210.110.006263.48<0.000142.32<0.000134.97<0.0001
X380.08<0.00010.560.466884.86<0.000156.51<0.0001
X4138.83<0.0001208.01<0.0001176.41<0.00015.710.0305
Quadratic effectsX121.950.18340.550.4683--16.860.0009
X220.210.65454.850.0438--4.100.0610
X3210.040.00648.750.0098--0.250.6250
X4265.81<0.00019.770.0070--37.00<0.0001
Interaction effectsX1X20.580.459020.530.00040.0250.875714.520.0017
X1X32.160.161918.970.00061.720.205136.95<0.0001
X1X418.910.00060.300.593863.42<0.00011.380.2591
X2X30.750.39961.060.31866.660.0183 60.32<0.0001
X2X410.990.00474.440.052314.930.0010 3.810.0700
X3X44.270.05661.180.295281.95<0.00010.930.3491
a Key: X1, X2, X3, and X4: the main effects of pressure, temperature, percentage of ethanol in co-solvent, and co-solvent concentration, respectively. X12, X22, X32, and X42: the quadratic effects of pressure, temperature, percentage of ethanol in co-solvent, and co-solvent concentration, respectively. X1X2, X1X3, X1X4, X2X3, X2X4, and X3X4: the interaction effects of pressure, temperature, percentage of ethanol in co-solvent, and co-solvent concentration.
Table 4. Comparison of predicted and experimental optimal values for the response variables.
RunOptimum Extraction Condition PredictedExtraction Yield % (g/g)Gallic Acid Content (% g/g)Methyl Gallate Content (% g/g)Caffeic Acid Content (% g/g)
YoYiYoYiYoYiYoYi
1283 bar, 32 °C, 78% (v/v), 16% (v/v)14.05 ± 0.7614.341.27 ± 0.101.340.44 ± 0.290.421.38 ± 0.371.47
2283 bar, 32 °C, 79% (v/v), 17% (v/v)12.74 ± 0.0513.921.32 ± 0.921.400.30 ± 0.510.421.50 ± 0.051.47
3240 bar, 32 °C, 75% (v/v), 18% (v/v)11.89 ± 0.4911.481.40 ± 0.361.380.37 ± 0.180.4031.08 ± 0.181.14
Yo, experimental value; Yi, predicted value.
Publisher’s Note: MDPI stays neutral with regard to jurisdictional claims in published maps and institutional affiliations.

