Article

Rapid Determination of Metribuzin and Three Major Transformation Products in Soil and Plant by Gas Chromatography–Tandem Mass Spectrometry

by
Beatriz Albero
*,
María Dolores Fernández
,
Concepción García-Gómez
and
Rosa Ana Pérez
*
Department of Environment and Agronomy, National Institute for Agricultural and Food Research and Technology (INIA), Spanish National Research Council (CSIC), Carretera de La Coruña Km 7.5, 28040 Madrid, Spain
*
Authors to whom correspondence should be addressed.
Separations 2022, 9(12), 386; https://doi.org/10.3390/separations9120386
Submission received: 25 October 2022 / Revised: 17 November 2022 / Accepted: 21 November 2022 / Published: 23 November 2022
(This article belongs to the Special Issue Chromatography-Mass Spectrometry Technology Research)

Abstract

:
Metribuzin is a pre- and post-emergence triazinone herbicide used in a variety of crops. This herbicide is degraded in the environment into three major metabolites that have high water solubility, high to very high soil mobility, and low to moderate persistence in soil. This paper describes the development of an analytical method based on ultrasound-assisted extraction and GC-MS/MS determination for the determination metribuzin and its main metabolites in soil and plants. The developed method provided good recoveries for all compounds in soil and plants (from 73 to 121%). The quantitation limits obtained from plants (2.6 to 18 µg/kg) allow determining the presence of these compounds at trace levels. To evaluate the applicability of the developed methods, bean plants were grown in plastic pots with soil treated with metribuzin and collected after 23 days. At the end of the assay, only 11% of the initial concentration of metribuzin remained in soil. Metribuzin and its three metabolites were detected in plants, desamino-diketo-metribuzin is the most abundant metabolite. It is expected that the application of these methods can provide more data to monitor metribuzin residues due to herbicide treatments.

Graphical Abstract

1. Introduction

According to estimates compiled by FAO, a 70% increase in food production will be required by 2050 to feed a world population of almost 10 billion [1]. One way of increasing agricultural production sufficiently is to apply pesticides to control pests and weeds that affect crop productivity. Nevertheless, excessive use and mishandling of these products cause environmental pollution and reach both water and the food chain. There is great social and political concern on the consequences of an excessive use of chemical pesticides, and among consumers there is a latent fear regarding the safety of the food they eat. Due to the possible toxic effects of pesticides on human health and the environment, there are strict regulations for their registration and use worldwide, especially in developed countries. Thus, the European Union (EU) has developed different work programs to systematically review new active substances and evaluate the renewal of authorized active substances. As more information on their environmental behavior and effects become available, the number of authorized compounds has significantly reduced. Considering the consequences of an excessive use of pesticides, research efforts are being made to reduce their use without adverse effects on productivity and profitability of farms [2]. New insights on the fate and behavior of pesticides and their transformation products in the different environmental compartments are necessary to provide the assessment of risk potential. Among the 476 active substances approved in the EU, only 18 are considered of low risk, and 20 are active substances that are not predominantly used as plant protection products, but which may be of value for plant protection [3]. Metribuzin is a pre- and post-emergence triazinone herbicide used to control annual grass and broad-leaved weeds in a variety of crops, such as potato, tomato, soybeans, sugar cane, maize, and cereals [4]. If the availability or the persistence of the herbicide increases, it can affect the current and subsequent crops. In addition, environmental conditions and the type of soil play an important role in pesticide leaching. In a review on the effect of metribuzin on environmental and human health, it was noted that this pesticide has toxicity even at low doses [5]. In Directive 540/2011 [6], metribuzin was noted as a candidate for substitution but recently the EU Commission extended the approval period for this active substance [7].
The three main metabolites of metribuzin in the environment are diketo-metribuzin (M-DK), desamino-metribuzin (M-DA), and desamino-diketo-metribuzin (M-DADK) [4]. These metabolites have high water solubility, high to very high soil mobility and low to moderate persistence in soil [8]. As metribuzin has been in use for many years, different methods have been reported for the multiresidue analysis of metribuzin together with other pesticides [9,10,11,12]. However, the analysis of metribuzin metabolites were not included. For soil samples, different extraction techniques such as ultrasound-assisted extraction (UAE) [13], microwave-assisted extraction (MAE) [8], or pressurized liquid extraction (PLE) [14] have been applied for monitoring metribuzin together with its metabolites. In these studies, the analysis has been carried out by HPLC with UV and DAD detection, by micellar electrokinetic chromatography [4] or, more recently, by LC-MS/MS [8,14]. In contrast, due to the complex composition of plants, the diversity of species, and other factors, analytical methods for metribuzin and its metabolites in plants are scarce [15]. Although within the frame of the inclusion of metribuzin in Annex I of Directive 91/414/EEC, it was recommended that only metribuzin residues in crops were determined for monitoring purposes, in the assessment report for its renewal it was agreed to include the monitoring of metribuzin metabolites in plant matrices. Therefore, a reduced number of analytical methods were developed for the analysis of these compounds in sugar cane shoots, potatoes, asparagus, tomatoes, oranges, and seeds (dry bean and soybean) by LC-MS/MS [16].
So far, the analysis of metribuzin and its metabolites has been mainly accomplished by liquid chromatography employing mass spectrometric or UV detection. On the other hand, gas chromatography has been usually applied in the determination of metribuzin together with other pesticides but rarely used in the determination of metribuzin metabolites. Thus, in the scientific literature available, GC-MS/MS has not been applied for the determination of metribuzin and its transformation products to plants; however, it was applied in tomato fruit slurry [17]. The main advantage of the MS detection versus UV detection is that a MS detector allows the simultaneous quantification and confirmation of the identity of the compounds detected. UAE is an efficient environmentally friendly technique because it allows to reduce the volume of solvent required in the extraction step and shorten extraction time employed in classical extraction procedures. In addition, an advantage of UAE over other modern extraction techniques is the lower cost of the equipment and ease of use [18].
Knowledge of the environmental behavior of herbicides is useful to have effective and environmentally safe crop treatments; thus, it is necessary to have adequate methods for the evaluation of the target compounds and their transformation products in treated soil and the resultant crops. In this context, the main objective of our study was to develop fast and sensitive methods for the analysis of metribuzin and three of its main metabolites in soil and plants by UAE and GC-MS/MS. Finally, the methods were applied to the analysis of these compounds in soil and plants grown in it after applying metribuzin.

2. Materials and Methods

2.1. Chemicals and Reagents

Standards of metribuzin (M), desamino metribuzin (M-DA), diketo-metribuzin (M-DK), and desamino-diketo-metribuzin (M-DADK), all purity ≥99%, were purchased from Dr. Ehrenstorfer (Augsburg, Germany). Ethyl acetate (EtAc), for GC residue analysis, was supplied by Aldrich (Steinheim, Germany). Primary secondary amine (PSA) bulk adsorbent and silica Bondesil-C18 (40 µm particle diameter) were purchased from Scharlab (Barcelona, Spain). Graphitized carbon black (GCB) (Supelclean ENVI-Carb 120/400) was purchased from Supelco (Madrid, Spain). Florisil (magnesium silicate adsorbent, 60–100 mesh for chromatography) was acquired from Acros Organics (Geel, Belgium). Bayer Sencor 600 SC, an herbicide formulation containing 600 g/L of metribuzin, was obtained from J.V. Montalvo SL (Madrid, Spain) and was used for the treatment of soil with metribuzin.
Individual stock solutions (500 µg/mL) of each compound were prepared in methanol. A working mixture solution at 1 µg/mL of metribuzin and 0.5 µg/mL of each metabolite was prepared in ethyl acetate for soil analysis, whereas a mixture of 0.5 µg/mL of each compound was used as a working mixture solution for plant analysis. All the standard solutions were stored in amber vials at −20 °C prior to use.

2.2. Analysis of Metribuzin and Metabolites in Soil and Plant Leaves

Soil (2 g) was placed in a 20 mL glass column with a cellulose paper filter circle at the bottom and 1 g of sodium sulfate anhydrous. Two 15 min UAE cycles were carried out with EtAc (2 × 5 mL) in an ultrasonic water bath at 30 °C. Extracts were collected by vacuum using a manifold in conical tubes and adjusted to 10 mL with EtAc before GC-MS/MS analysis.
Ground lyophilized bean (Phaseolus vulgaris L.) leaves (0.2 g) were placed in a 20 mL glass column (10 cm × 20 mm i.d.) containing a cellulose paper filter at the bottom. The luer tips of the columns were closed with 1-way stopcocks. Then EtAc (5 mL) was added to the column, which was placed in a tube rack and sonicated for 15 min in an ultrasonic water bath with the water level higher than the extraction solvent level inside the columns. After the extraction, the columns were placed on a multiport vacuum manifold where the extracts were collected under vacuum in 15 mL Falcon tubes. Then, a second extraction with 5 mL of EtAc was performed. Extracts were concentrated to 2 mL before cleanup by dispersive solid-phase extraction (dSPE) with PSA (25 mg) and GCB (50 mg). The tubes were shaken for 3 min and centrifuged at 5000 rpm for 10 min. Then, the supernatant was filtered through 0.2 µm nylon filter before the chromatographic analysis to remove the remaining GCB.
In the recovery assays, samples were spiked and stored at 4 °C for 24 h before carrying out the extraction procedure.

2.3. Chromatographic Analysis

GC-MS/MS analysis was performed on an Agilent 7890A (Waldbronn, Germany) gas chromatograph coupled to an Agilent 7000 triple quadrupole mass spectrometer equipped with an automatic injector model HP 7683. Separations were carried out using an Agilent HP-5MS ultra inert capillary column, (30 m × 0.25 mm i.d. and 0.25 µm film thickness), from Agilent (Santa Clara, CA, USA). Helium (purity 99.995%) was used as a carrier gas at a flow rate of 1 mL/min.
Firstly, retention times and mass spectra of all analytes were acquired in the full scan mode (mass range from 50 to 220 m/z, scan time of 150 ms and ion source temperature of 280 °C). The mass spectrometer was operated in electron impact ionization mode at 70 eV. Precursor ions were chosen considering a high ion m/z and abundance. The product ion spectra were obtained by the dissociation of the precursor ions at collision energies ranging from 5 to 50 eV. Multiple reaction monitoring (MRM) was employed for quantitative analysis, using one quantifier and one qualifier transitions to identify each target analyte. Table 1 lists the analytes studied along with their retention times and mass spectrometric parameters. For positive confirmation, quantifier–qualifier ratios must range within 20% uncertainty and retention time must be within ±0.2 min of the expected time. The quantification of the studied compounds in soil was based on external standard calibration. For the quantification of the studied compounds in plant, matrix-matched calibration was selected spiking blank plant extracts due to the matrix effects observed.
The injection of 1 µL was carried out in pulsed splitless mode (pulsed pressure 25 psi for 0.5 min and flow rate of 60 mL/min with the purge valve activated 1.5 min after sample injection) with the injector port at 280 °C, into an ultra-inert single tapered liner with glass wool. The column temperature was initially set at 120 °C (kept for 1 min) and increased at 20 °C/min to 300 °C (held 5 min). The total analysis time was 15 min and a solvent delay of 3 min was selected.

2.4. Soil Treatment with Metribuzin

Soil was collected from the surface layer of a field located near Madrid (Spain) and was air-dried and sieved (2-mm mesh) prior to characterization and use in a plant growth experiment. The main physico-chemical characteristics of soil were: 7.8% clay, 18.8% silt, 73.4% sand, pH 7.4, and organic matter 1.9%. Soil was spiked directly with Sencor 600 SC to gain a metribuzin concentration of 2 mg/kg. After 24 h of the metribuzin treatment, soil (600 g) was placed in pots and four bean (Phaseolus vulgaris L. cv. Contender) seeds were sown. Three replicates of this treatment and three replicates of unspiked soil were used. The concentration in soil was measured at the beginning (1-day post-metribuzin treatment) to establish the initial concentration in soil. The pots were cultivated in a climate-controlled room (20 ± 2 °C) and were illuminated with a photoperiod of 16:8 h (light:darkness). After 23 days, the plants were harvested, rinsed, and the leaves were separated, lyophilized, ground, and kept at −20 °C until analysis. Residue levels of metribuzin and its metabolites in soil and bean leaves were evaluated as described above.

2.5. Quality Assurance/Quality Control

Quality assurance and quality control criteria used for the methods included the analysis of reagent and sample blanks. No analytes were detected in both blanks. To avoid memory effects, the glass liner in the injection port was changed frequently.

3. Results and Discussion

3.1. Extraction Procedure

The extraction of analytes from complex environmental matrices is a very complicated task due to the coextraction of matrix components that may hinder their analysis. Sonication-assisted extraction in small columns (SAESC) was selected, based on our experience with this technique in the analysis of different pollutants.

3.1.1. Soil Samples

The extraction solvent is usually one of the main parameters to optimize in UAE methods. Thus, EtAc was selected to evaluate the extraction of metribuzin and these three main metabolites due to the good results obtained with this solvent in the extraction of pesticides from soil [9]. In the first assay, extraction without any cleanup step was carried out 1 h after spiking soil with a mixture containing metribuzin and its three metabolites. Clean extracts and recoveries from 90 to 104% were obtained, suggesting that a cleanup step was not necessary for the soil samples.
The performance of the method was evaluated in terms of linearity, repeatability, accuracy, and limits of quantification (LOQ) and detection (LOD). The linearity of the method was evaluated injecting six calibration solutions from 10 ng/mL to 600 ng/mL for metribuzin and from 20 to 300 ng/mL for the metabolites. A good linearity was obtained in the range of the concentrations studied with R2 ≥ 0.996. The repeatability of the chromatographic analysis was determined by injecting seven times within a given day a blank extract spiked at 50 µg/kg. Repeatability expressed as RSD was <7% for all compounds. The accuracy of the method was evaluated performing the recovery at two concentration levels from three sample replicates. Concentration level assays and recoveries of the compounds are shown in Table 2. The recoveries of the metabolites were evaluated at lower concentrations than the parent compounds because the presence of these compounds in soil should be the result of metribuzin degradation. High recoveries were obtained for all the compounds (from 73 to 121%). These values are similar or higher than those reported by other authors for soil samples using other extraction methods, such as thin layer chromatography plates, UAE followed by SPE, PLE or microwave-assisted water extraction (see Table 3).
Henriksen et al. [14], using PLE extraction, reported recoveries around 75% except for M-DK that was 50%. The extraction procedure developed for soil samples used less extraction solvent in comparison with other reported methods. Thus, the PLE method developed by Henriksen et al. [14] used 35–40 g of moist soil and more than 40 mL of solvent (methanol:water, 75:25 v/v). Whereas the MAE method developed by Papadakis et al. [8] used 10 g of soil and 40 mL of phosphate buffer (pH 7) followed by preconcentration of the extract by SPE. The extraction method developed by Huerta-Perez et al. [4] used 10 g of soil, and the extraction by UAE was performed with 45mL of solvent, being necessary additional steps to filter and concentrate the extract, previously to be purified by SPE. Finally, in the method developed by Haskis et al. [13], 5 g of sample was extracted with a total volume of 45 mL of methanol.
LODs and LOQs were calculated after the analysis of eight replicates of soil extract spiked at the lowest recovery level. These values were obtained following the approach developed by EPA [20]. The equation to calculate the LOD was the following: LOD = t99 × SD, where t99 is Students’ t distribution value for a 99% confidence level and n-1 degrees of freedom and SD is the standard deviation of the replicate analysis. The LOQ was calculated as 10 times the SD of the results of the replicate analysis. LOD values obtained ranged from 5 to 11 µg/kg and the LOQ values ranged from 16 to 37 µg/kg (Table 2), which are similar those previously reported (Table 3).

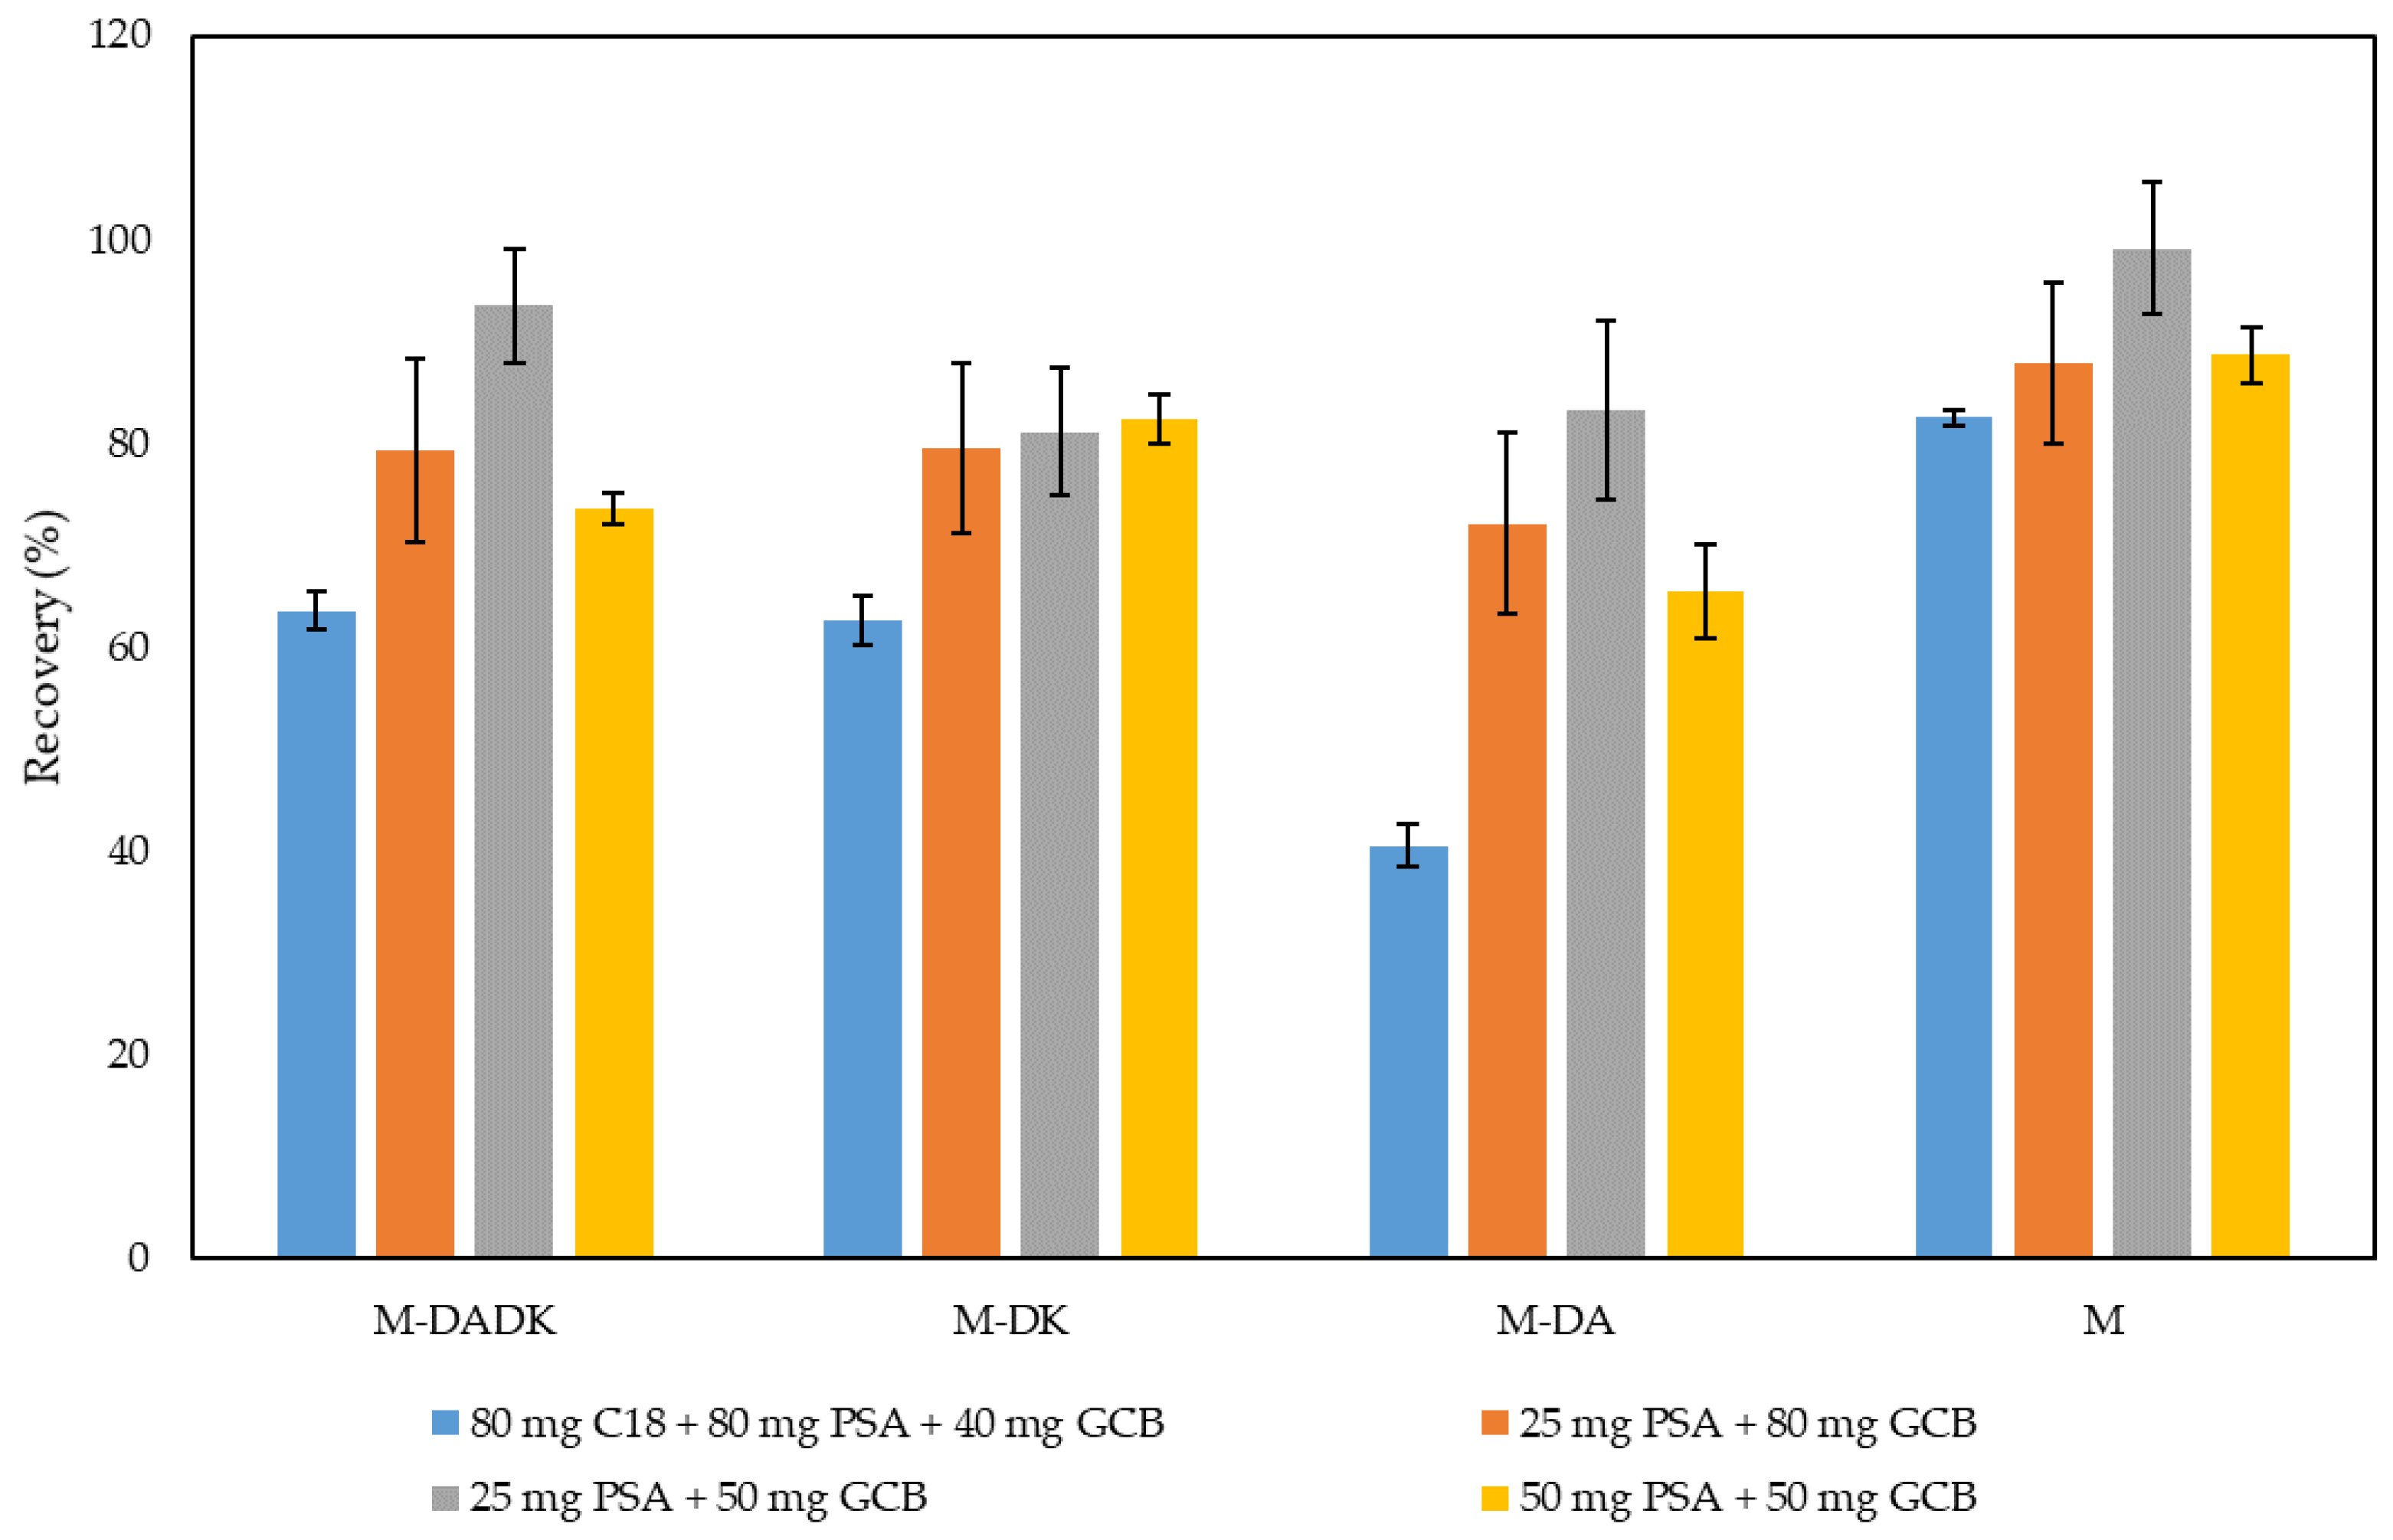
3.1.2. Plant Samples

A method based on the sonication of the sample placed in small columns (SAESC) was developed in our group for the analysis of other contaminants in cereals [18]. The simplicity, low solvent consumption, and the facts that they do not require special equipment are the main advantages for the small columns in the extraction process. Therefore, considering the good results obtained for the extraction of metribuzin and its metabolites from the soil reported above, the extraction of bean plant leaves using UAE and small columns was evaluated. Since the extracts obtained with EtAc were highly colored, a clean-up step before the chromatographic analysis was considered. Dispersive solid-phase extraction (dSPE) as a clean-up procedure was selected and different sorbents were tested. Thus, GCB, PSA, and C18, alone or in mixtures, were evaluated in the cleaning step of the highly colored extract. Results showed that GCB was necessary to have clear color extracts, but additional sorbents were needed to reduce the interferences. Different amounts and sorbent mixtures were evaluated to obtain good recoveries of the compounds. Similar results were obtained for dSPE with the mixture of C18, PSA, and GCB (80, 80, and 40 mg, respectively) than with PSA and GCB (50 and 50 mg, respectively). To minimize the use of sorbents, C18 was discarded in the cleanup step and other amounts of PSA and GCB were evaluated. Higher recoveries were obtained after dSPE with 25 mg of PSA and 50 mg of GCB (see Figure 1). This sorbent proportion provided the best results with the lowest amount of sorbent; therefore, they were selected for further assays. The results shown were similar or higher than those reported by Xie et al. [17] for the analysis of metribuzin and its metabolites from tomato fruit slurry (with recoveries from 72 to 96%) taking into account that this matrix is less colored and complex than bean plant leaves.
Therefore, the column method proposed allows an easy handling of the sample (0.2 g) in addition to the use of less organic solvent (10 mL) and sorbents in the extraction and purification steps (70 mg of sorbents). Likewise, the method described by Kulsherestha et al. [21] for the extraction of metribuzin and its metabolites from plants used high amounts of the sample (100 g) which were blended with the organic solvent (200 mL) and the macerates were filtered and concentrated. Then, the residue obtained was extracted by liquid–liquid extraction and purified by SPE before the chromatographic analysis. In the method for the determination of metribuzin and its metabolites in samples of sugar cane shoots, included in the Renewal assessment report [16], the compounds were extracted from the samples by refluxing in acetonitrile/water (3:1, v/v) followed by filtration, concentration, and dilution with acetonitrile. Whereas, for potato tuber, asparagus stick, and tomato fruit, the samples were also extracted with acetonitrile/water (3:1, v/v) but using microwaves, and after filtration the extract was concentrated to the aqueous reminder and an aliquot was loaded on Superclean Envi-Carb SPE cartridge for purification of the extracts.
A good linearity was obtained when blank plant extracts were spiked at the range of 0.5 ng/mL to 500 ng/mL for all the compounds with R2 equal or higher than 0.995 for matrix-matched calibration. The repeatability of the chromatographic analysis of the plant extracts was determined by injecting eight times within a given day a blank extract spiked at 25 µg/kg. Repeatability expressed as RSD was <8% for all compounds. The accuracy of the developed column method was evaluated, performing the recovery of metribuzin and its three metabolites at two concentration levels. High recoveries were obtained for all the compounds (from 81 to 106%) with LODs from 0.8 to 5 µg/kg, and LOQs between 2.6 and 18 µg/kg (see Table 4). These limits were similar or lower than those for the analysis of these compounds from tomato fruit using a QuEChERS-based method (Table 3).
The method developed by Shen et al. [19] for potato tuber using MAE and liquid-liquid extraction followed by LC-MS/MS analysis concluded that internal standards can improve the recoveries and accuracies of the method resulting in recoveries values from 73 to 97% using matrix-matched standard curve with an internal standard, whereas recoveries from 45 to 122% were obtained by matrix-matched calibration without internal standard. Nevertheless, they did not report data for real samples.

3.2. Application to Real Samples

To evaluate the applicability of the developed methods for the determination of metribuzin and its metabolites, bean plants were grown in plastic pots with soil (600 g) treated with metribuzin (2.1 mg/kg) and collected after 23 days. Soil was sampled 1 and 23 days after the metribuzin treatment. Previous studies have reported that in aerobic soil, metribuzin is degraded to M-DA and M-DK, which are further degraded to M-DADK. The results of our study showed that after 24 h of the treatment, metabolites M-DA and M-DK (13.9% and 1.5% of the initial metribuzin concentration, respectively) were detected in soil. After 23 days, a fast dissipation of metribuzin was observed leaving only 11.4% of the metribuzin initially applied in soil as metribuzin or its metabolites. Thus, 0.20, 0.03, and 0.14 mg/kg of metribuzin, M-DK, and M-DADK were found in the soil samples; representing 10.7%, 1.4%, and 6.7% of the initial concentration, respectively. Interestingly, M-DA was not detected in soil samples. An explanation can be that M-DA was further degraded into M-DADK. These results agree with those described by Kaur et al. [22] in their study on the persistence of metribuzin in aridisols. The authors reported that the physico-chemical properties of soil had a significant effect on which metabolites are formed and the dissipation of metribuzin with half-lives ranging from 15 to 47 days. They described that in two soils (sandy loam and loamy sand) metribuzin undergoes reductive deamination to form M-DA, which was first detected 3 days after treatment and persisted up to 7 days after treatment when secondary metabolite M-DADK started appearing. In clay loam soil, metribuzin undergoes oxidative desulfuration to form M-DK which was detected 3 days after treatment and persisted up to 15 days when M-DADK started forming. Thus, M-DADK persists up to 30 or 45 days after treatment depending on the type of soil. In EFSA renewal assessment report [16], the predicted environmental concentrations for metribuzin and its degradation products in soil after 28 days were 22%, 13.3%, 4.7%, and 10% of metribuzin, M-DA, M-DK, and M-DADK, respectively, in relation to the initial concentration of metribuzin in soil.
None of the target compounds were detected in plants grown in control soil (Figure 2A) whereas plants cultivated in treated soil presented mean values of 6.9 mg/kg dry weight of metribuzin, 1.6 mg/kg dry weight of M-DA, 0.1 mg/kg dry weight of M-DK, and 1.9 mg/kg dry weight of M-DADK. Figure 2 shows the chromatograms of a plant extract and a soil extract of a sample collected 23 days after the application of metribuzin to the soil. The higher presence of metribuzin and M-DADK found in plants after 23 d was in accordance with the results reported by EFSA [16] in the residue trials conducted in soybean after spraying with metribuzin.

4. Conclusions

Two methods based on UAE and GC-MS/MS were successfully developed for the determination of metribuzin and its metabolites in soil and bean plants. The extraction procedures were fast, easy, and needed a low input of organic solvent and sorbents. The methods showed similar or higher recoveries and similar or lower LOQs values than other reported methods. After validation of the methods, the procedures were applied to the analysis of soil and bean plants harvested after 23 days of the treatment with metribuzin. At the end of the assay, only 11% of the initial concentration of metribuzin remained in soil and M-DA was not found. On the other hand, the four compounds were detected in plants, with metribuzin as the most abundant and M-DK as the less abundant. The results show that these methods can be suitable to evaluate the persistence and behavior of metribuzin and its metabolites, in soil and soil–plant systems. Therefore, the application of this method is expected to provide more data to monitor metribuzin residues due to herbicide treatments.

Author Contributions

Conceptualization, R.A.P. and M.D.F.; methodology, B.A. and R.A.P.; validation, B.A. and R.A.P.; formal analysis, B.A. and R.A.P.; investigation, B.A., R.A.P., M.D.F. and C.G.-G.; writing—original draft preparation, B.A. and R.A.P.; writing—review and editing, B.A., R.A.P., M.D.F. and C.G.-G.; visualization, B.A.; supervision, B.A., R.A.P., M.D.F. and C.G.-G. All authors have read and agreed to the published version of the manuscript.

Funding

This research was funded by the Community of Madrid (project S2018/BAA-4330) and by the Madrid Institute for Rural, Agriculture and Food Research and Development (IMIDRA) (project FP22 HERBI-RES).

Data Availability Statement

Not applicable.

Conflicts of Interest

The authors declare no conflict of interest. The funders had no role in the design of the study; in the collection, analyses, or interpretation of data; in the writing of the manuscript; or in the decision to publish the results.

References

  1. van Dijk, M.; Morley, T.; Rau, M.L.; Saghai, Y. A meta-analysis of projected global food demand and population at risk of hunger for the period 2010–2050. Nat. Food 2021, 2, 494–501. [Google Scholar] [CrossRef]
  2. Lechenet, M.; Dessaint, F.; Py, G.; Makowski, D.; Munier-Jolain, N. Reducing pesticide use while preserving crop productivity and profitability on arable farms. Nat. Plants 2017, 3, 17008. [Google Scholar] [CrossRef] [PubMed]
  3. Buckwell, A.; De Wachter, E.; Nadeu, E.; Williams, A. Crop Protection & the EU Food System. Where Are They Going? 2020. Available online: https://croplifeeurope.eu/wp-content/uploads/2021/03/RISE_CP_EU_final.pdf (accessed on 3 October 2022).
  4. Huertas-Pérez, J.F.; Del Olmo Iruela, M.; García-Campaña, A.M.; González-Casado, A.; Sánchez-Navarro, A. Determination of the herbicide metribuzin and its major conversion products in soil by micellar electrokinetic chromatography. J. Chromatogr. A 2006, 1102, 280–286. [Google Scholar] [CrossRef]
  5. Samir, D.; Mohcem Om Selma, R.; Asma, S. The effect of herbicide metribuzin on environment and human: A Systematic Review. Pharm. Biosci. J. 2020, 8, 10–15. [Google Scholar] [CrossRef]
  6. European Commission. Commission Implementing Regulation (EU) No 540/2011 of 25 May 2011 Implementing Regulation (EC) No 1107/2009 of the European Parliament and of the Council as Regards the List of Approved Active Substances. 2011. Available online: http://data.europa.eu/eli/reg_impl/2011/540/oj (accessed on 3 October 2022).
  7. European Commission. Commission Implementing Regulation (EU) 2022/708 of 5 May 2022. 2022. Available online: http://data.europa.eu/eli/reg_impl/2022/708/oj (accessed on 3 October 2022).
  8. Papadakis, E.N.; Papadopoulou-Mourkidou, E. Determination of metribuzin and major conversion products in soils by microwave-assisted water extraction followed by liquid chromatographic analysis of extracts. J. Chromatogr. A 2002, 962, 9–20. [Google Scholar] [CrossRef]
  9. Sanchez-Brunete, C.; Albero, B.; Tadeo, J.L. Multiresidue determination of pesticides in soil by gas chromatography—Mass spectrometry detection. J. Agric. Food Chem. 2004, 52, 1445–1451. [Google Scholar] [CrossRef]
  10. Lehotay, S.J.; Mastovska, K.; Lightfield, A.R.; Gates, R.A. Multi-analyst, multi-matrix performance of the QuEChERS approach for pesticide residues in foods and feeds using HPLC/MS/MS analysis with different calibration techniques. J. AOAC Int. 2010, 93, 355–367. [Google Scholar] [CrossRef] [Green Version]
  11. Łozowicka, B.; Jankowska, M.; Rutkowska, E.; Hrynko, I.; Kaczyński, P.; Miciński, J. The evaluation of a fast and simple pesticide multiresidue method in various herbs by gas chromatography. J. Nat. Med. 2014, 68, 95–111. [Google Scholar] [CrossRef] [Green Version]
  12. Łozowicka, B.; Jankowska, M.; Rutkowska, E.; Kaczyński, P.; Hrynko, I. Comparison of extraction techniques by matrix solid phase dispersion and liquid-liquid for screening 150 pesticides from soil, and determination by gas chromatography. Polish J. Environ. Stud. 2012, 21, 973–992. [Google Scholar]
  13. Haskis, P.; Mantzos, N.; Hela, D.; Patakioutas, G.; Konstantinou, I. Effect of biochar on the mobility and photodegradation of metribuzin and metabolites in soil-biochar thin-layer chromatography plates. Int. J. Environ. Anal. Chem. 2019, 99, 310–327. [Google Scholar] [CrossRef]
  14. Henriksen, T.; Svensmark, B.; Juhler, R.K. Analysis of metribuzin and transformation products in soil by pressurized liquid extraction and liquid chromatographic-tandem mass spectrometry. J. Chromatogr. A 2002, 957, 79–87. [Google Scholar] [CrossRef]
  15. Parker, C.E.; Degen, G.H.; Abusteit, E.O.; Corbin, F.T. The determination of metribuzin and its metabolites by high pressure liquid chromatography. J. Liq. Chromatogr. 1983, 6, 725–742. [Google Scholar] [CrossRef]
  16. EFSA. Public Consultation on the Active Substance Metribuzin. Available online: https://www.efsa.europa.eu/en/consultations/call/public-consultation-active-substance-metribuzin-1 (accessed on 3 October 2022).
  17. Xie, Y.L.; Zhao, Z.D.; Zhang, X.L.; Tang, L.; Zhang, Y.; Zhang, C.H. Simultaneous analysis of herbicide metribuzin and its transformation products in tomato using QuEChERS-based gas chromatography coupled to a triple quadrupole mass analyzer. Microchem. J. 2017, 133, 468–473. [Google Scholar] [CrossRef]
  18. Albero, B.; Tadeo, J.L.; Miguel, E.; Pérez, R.A. Rapid determination of antibiotic residues in cereals by liquid chromatography triple mass spectrometry. Anal. Bioanal. Chem. 2019, 411, 6129–6139. [Google Scholar] [CrossRef]
  19. Shen, Y.; Gao, M.; Liang, Y.; Li, Y.; Zhong, J.; Lu, L.; Zhang, Z. Role of isotope internal standards and matrix-matched curves in the analysis of metribuzin and its metabolite residues in potato tuber. Food Anal. Methods 2022, 15, 1581–1590. [Google Scholar] [CrossRef]
  20. Bernal, E. Limit of Detection and Limit of Quantification Determination in Gas Chromatography. In Advances in Gas Chromatography; Guo, X., Ed.; IntechOpen: London, UK, 2014; pp. 57–81. ISBN 978-953-51-1227-3. [Google Scholar]
  21. Kulshrestha, G.; Singh, S.B. Residual fate of metribuzin on carrot (Daucus carota) crop. Bull. Environ. Contam. Toxicol. 2001, 66, 660–663. [Google Scholar] [CrossRef]
  22. Kaur, P.; Rani, G.; Bhullar, M.S. Persistence of metribuzin in aridisols as affected by various abiotic factors and its effect on soil enzymes. Int. J. Environ. Anal. Chem. 2022, 1–20. [Google Scholar] [CrossRef]
Figure 1. Effect of the cleanup by dSPE employing different sorbents (C18, PSA, and GCB) in different proportions on the recovery of metribuzin and its metabolites from lyophilized bean plant leaves spiked at 0.250 mg/kg.
Separations 09 00386 g001
Figure 2. TIC chromatograms of (A) a blank plant extract; (B) a blank plant extract spiked at 500 ng/L with metribuzin and its metabolites; (C) bean plant sample grown in soil treated with metribuzin (2 mg/kg) and (D) soil sample collected 23 days after treatment with metribuzin.
Separations 09 00386 g002
Table 1. Retention time (tR), chemical structure, and target (T), and qualifier transitions (Q1 and Q2) of metribuzin (M) and its three metabolites.
CompoundStructuretR (min)T (CE 1)Q1 (CE)Q2 (CE)
M-DADKSeparations 09 00386 i0015.2127 > 110.1 (5)127 > 81.9 (15)154 > 83 (10)
M-DKSeparations 09 00386 i0026.1168 > 55 (20)168 > 83 (15)168 > 126 (5)
M-DASeparations 09 00386 i0037.0199 > 184.2 (10)184 > 89 (5)184 > 68 (20)
MSeparations 09 00386 i0047.2198 > 82 (20)198 > 110.1 (10)198 > 89 (20)
1 CE: collision energy (eV).
Table 2. Calibration equations, R2 values, recoveries and relative standard deviation (RSD, n = 3), quantification limits (LOQs), and detection limits (LODs) of metribuzin and its metabolites in soil.
CompoundEquationR2Spiking Level (mg/kg)Recovery (%)RSD (%)LOD (µg/kg)LOQ (µg/kg)
M-DADKy = 34.6x + 180.60.99820.2593.56.7826
1121.45.3
M-DKy = 16.5x + 27.80.99960.2574.43.41032
172.610.6
M-DAy = 5.4x + 27.60.99980.2582.78.31137
187.79.1
My = 132.3x + 29860.99700.584.310.7516
381.26.9
Table 3. Reported methods for the determination of metribuzin and their metabolites in soil and plants.
MethodSampleSolvent
(Total Volume)
Sorbent (mg)AnalysisLOD
(µg/kg)
Recovery (%)Ref.
UAE + SPESoil (10 g)MeOH (50 mL)200MEKC19–2378–99[4]
MAWE + SPESoil (10 g)Buffer pH7, MeOH + EtAc
(67 mL)
200LC-DAD1.25–12.580–92[8]
PLESoil
(35–40 g)
MeOH:water
(35–40 mL)
LC-MS/MS0.6–5.550–75[14]
SAESCSoil (2 g)EtAc (10 mL) GC-MS/MS5–1173–121present work
QuEChERSTomato slurry
(5 g)
ACN (20 mL)480 GC-MS/MS2–871–96[17]
RefluxingSugar cane shoot (n.s.)ACN/water (3:1, v/v) (n.s.)n.s.LC-MS/MS1070–110[16]
Refluxing or MAE + SPEPotato (tuber), asparagus (stick), tomato (n.s.)ACN/water (3:1, v/v) (n.s.)n.s.LC-MS/MS1070–110[16]
MAE + LLEPotato tuber
(2 g)
ACN/water (3:1, v/v) (12 mL) + DCM (6 mL) LC-MS/MS2.5–3.866–109[19]
SAESC + dSPEBean plant
(0.2 g)
EtAc (10 mL)75GC-MS/MS0.8–581–106present work
DAD: diode array detection; DCM: dichloromethane; ECD: electron capture detector; LLE: liquid-liquid extraction; MAWE: microwave-assisted water extraction, MEKC: micellar electrokinetic chromatography; n.s.: not specified; PLE: pressurized liquid extraction; SPE: solid-phase extraction.
Table 4. Calibration equations, R2 values, recoveries, and relative standard deviation (%, n = 3), quantification limits (LOQs), and detection limits (LODs) of metribuzin and its metabolites in bean plant leaf.
CompoundEquationR2Spiking LevelLOD (µg/kg)LOQ (µg/kg)
0.025 mg/kg0.250 mg/kg1 mg/kg
M-DADKy = 64.5x + 359.90.998388.4 (4.1)93.5 (5.5)88.7 (5.3)518
M-DKy = 42.9x + 43.20.999985.2 (6.5)81.2 (6.3)90.6 (4.7)517
M-DAy = 20.3 x + 210.40.999888.3 (2.7)83.3 (8.8)86.6 (8.9)518
My = 226.4 x + 13,768.10.999396.0 (4.6)99.2 (6.5)105.9 (4.1)0.82.6
Publisher’s Note: MDPI stays neutral with regard to jurisdictional claims in published maps and institutional affiliations.

