Abstract
The role of nitrite (NO2−) and nitrate (NO3−) is essential in the global nitrogen cycle. Monitoring their concentration in environmental and industrial aqueous samples, surface water, soil, food and agricultural products are of high importance. Especially, the effect of anthropogenic emission, i.e., intensified agriculture is essential due to the overuse of nitrogen, phosphorus and potassium fertilizers. The most widely utilized methods for nitrate and nitrite determination are colorimetry, potentiometry, UV absorption and liquid chromatography. Among them, UV spectroscopy is the most frequently used technique due to the fact of its versatility and simplicity. However, there are industrial and academic needs to develop new methods to overcome some drawbacks of the currently used techniques such as an inadequate limit of detection and potential interferences with organic compounds in the sample. In this paper, we report on the development of a new analytical method based on capillary electrophoresis separation with high-sensitivity UV detection, capable of measuring trace concentrations of nitrite and nitrate well below the current limits of UV spectroscopy methods. During the development process special attention was paid to practical aspects, i.e., the method was tested to quantify nitrate and nitrite in various surface water samples.
1. Introduction
The role of nitrite (NO2−) and nitrate (NO3−) is essential in the global nitrogen cycle. Monitoring their concentrations in aqueous environmental and industrial samples, surface water, soil, food and agricultural products is of high importance. Especially, the effect of anthropogenic emissions (i.e., intensified agriculture) is essential due to the overuse of nitrogen, phosphorus and potassium fertilizers [1,2]. Moorcroft et al. reviewed the available strategies to facilitate the detection, determination and monitoring of aqueous nitrate and nitrite and assessed the advantages, disadvantages and limitations of the techniques [3]. The most widely utilized methods for nitrate and nitrite determination are classified into three types based on their underlying analytical approach: (1) direct determination (colorimetry, potentiometry, UV absorption and chromatography); (2) reduction of nitrate to ammonium or nitric oxide followed by the detection of the product’s concentration (colorimetry, potentiometry, fluorimetry and coulometry); (3) color changing complexation reaction of nitrate [4]. Among these classifications, UV spectroscopy is the most frequently used technique for the determination of nitrate in aqueous samples due to the fact of its versatility and simplicity. UV spectroscopy is based on the absorbance measurement of nitrate ions at 210 nm. However, chlorine, nitrite, iron (III) and organics may interfere due to the fact of their similar absorption range [5,6,7]. Next to the direct absorption methods, nitrate catalytic conversion and derivatization techniques can overcome such limitation with few possible interferences, but the required additional reaction steps make them complicated and labor intensive techniques [3,8,9,10]. Utilizing derivatization methods, the available lower limit of detection (LOD) for nitrite is approximately 0.006 mg/L NO2−-N, and for nitrate it is approximately 0.23 mg/L for NO3−-N, where “-N” denotes the nitrogen equivalent.
Capillary electrophoresis (CE) is a versatile liquid phase separation technique used for the analysis of a wide variety of samples including nucleic acids [11], peptides, carbohydrates [12], chiral compounds [13], food additives [14,15] and inorganic substances [16]. In the nineties, Marshall et al. developed a capillary electrophoresis method for the analysis of nitrite and nitrate in food samples using hydrodynamic injection, but achieved poor detection limit [17]. Later, CE, solely or combined with field-amplified sample stacking, was utilized for the determination of nitrite and nitrate [18,19,20,21,22,23]. Electrokinetic injection methods, however, cannot be used for quantification due to the biased entry of the different electrophoretic mobility analyte molecules and matrix effects.
In this study, we report on the development of a new method for aqueous nitrite and nitrate concentration determination utilizing capillary electrophoresis separation coupled with hydrodynamic injection and UV/VIS detection. The developed method was successfully applied to quantify even trace amounts of nitrate and nitrite in various surface water samples.
2. Materials and Methods
2.1. Chemicals
High-purity sodium nitrite (99.7%) and sodium nitrate (99.5%) were purchased from Scharlab (Barcelona, Spain) and Riedel-deHaen (Seelze, Germany), respectively, for the preparation of the calibration standard series using HLPC grade water. TRIS–tris(hydroxymethyl)aminomethane (biochemistry grade), isopropyl alcohol and sodium hydroxide pellets were purchased from VWR Chemicals (Radnor, PE). Ammonium acetate was from Applichem (Darmstadt, Germany). Reagent grade acetic acid and hydrochloric acid were purchased from Molar Chemicals (Halasztelek, Hungary).
2.2. Capillary Electrophoresis
The automated MDQ capillary electrophoresis system was from Beckman Coulter (Brea, CA, USA) equipped with UV/VIS detector. The 50 µm I.D., 375 µm O.D., 60 cm total and 50 cm effective length bare fused silica (BFS) capillary was from Molex (Lisle, IL, USA), and 75 mM TRIS-HCl buffer (pH 7.25) was applied as background electrolyte (BGE). The separation conditions were as follows: hydrodynamic injection (8 psi/8 s), 30 °C capillary temperature, and 200 nm detection wavelength; −30 kV (reverse polarity, cathode at the injection side) separation voltage with 1 min ramp time. These injection parameters resulted in an unusually long (~7 cm) injection plug, which was approximately 10% of the total capillary length. However, the EOF and the conductivity difference between the BGE and the sample matrix supported large volume sample stacking [24]. Separation capillaries were conditioned each day by the following rinse sequence: water (90 psi/2 min), 50 v/v% isopropanol–50 v/v% 0.5 N hydrochloric acid (HCl) (90 psi/10 min), water (90 psi/2 min), 1 N NaOH (90 psi/2 min), 1 N HCl (90 psi/2 min) and water (90 psi/2 min) followed by air stream drying (90 psi/4 min). Capillaries were conditioned between subsequent runs using the following sequence by rinsing with 50 v/v% isopropanol–50 v/v% 0.5 N hydrochloric acid (HCl) (90 psi/1 min) and water (90 psi/3 min). All acquired data were integrated and further analyzed using Karat32 software, version 10.1 (Beckman Coulter).
2.3. Sample Handling and Calibration Series
To maintain a constant concentration of the target compounds (i.e., to avoid evaporation), 10 µL of mineral oil from Bioptics (New Taipei City, Taiwan) was added to each sample vial. The apolar oil monolayer blocked the evaporation and did not represent a problem during the sample injection.
Calibration series of nitrite and nitrate were prepared for quantification purposes. The solutions containing both targets were diluted in each step (two-fold method), covering a wide range from 200 to 0.00610 mg/L nitrogen equivalent, resulting in a 14 point calibration plot.
3. Results
In this work, a new analytical technique was developed that was capable of quantitatively analyzing aqueous nitrate and nitrite samples in a wide concentration range well below the detection limit of standard photometric methods. Capillary electrophoresis separation was not sensitive to sample matrix heterogeneity in this analysis, thus helping to avoid any potential interference with other compounds.
3.1. Separation Optimization
The separation temperature was in the range of 15–30 °C with 5 °C increments, and the detector wavelengths, set at 200, 214, 254 and 280 nm, were pre-optimized during development (see Supplementary Material Figures S1 and S2). The capillary internal diameter buffer composition, separation voltage and injection parameters were kept as constants. Furthermore, a design of experiments (DoE) approach was utilized to optimize multiple separation parameters, such as the TRIS concentration and pH of the BGE, where 1-1 mg/L nitrogen equivalent nitrate and nitrite samples were used as a probe.
Varying the TRIS concentration and pH (design of experiment, DoE), as shown in Figure 1, allowed for the achievement of short separation times (i.e., higher throughput), assuming the appropriateness of all other parameters. Further results of the DoE exercise are summarized in Supplementary Material Figures S3 and S4. Evaluating the DoE results, one can conclude that the 75 mM TRIS-HCl (pH 7.25) buffer combination is optimal for high resolution–excellent peak symmetry nitrate and nitrite separation. The optimized BGE composition allowed for the generation of a countercurrent electroosmotic flow (EOF), or towards the cathode (i.e., against the electromigration direction of the analytes), virtually lengthening the capillary thus improving the resolution.
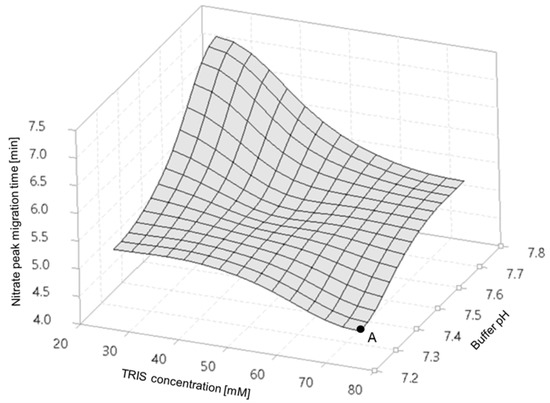
Figure 1.
Migration times of the nitrate anion as a function of the TRIS concentration and pH of the separation buffer. Point A denotes the fastest separation.
3.2. Calibration
To set up the calibration function, the integrated peak areas of both sample components of interest (i.e., nitrite and nitrate) were plotted against the corresponding concentration values covering five orders of magnitude, as shown in Figure 2. Due to the wide concentration range, instead of the conventional least squares regression approach, 1/x2 weighting was used to achieve sufficient fitting. In this way, the resulting calibration ensured an appropriate accuracy even at a low concentration range. The limit of quantification (LoQ) was defined as the peak high of analytes was 10 times higher than that of the average amplitude of the background noise (i.e., “signal-to-noise” ratio). Separate CE runs were used for the setup of the calibration, and the plots are shown in Supplementary Material Figure S5.
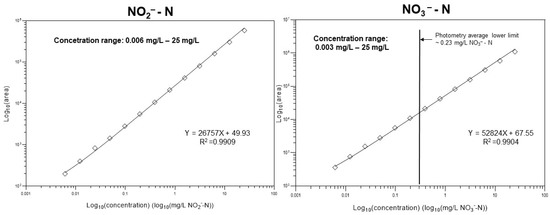
Figure 2.
Quantification of the nitrite and nitrate anion concentrations in the aqueous samples. In the case of nitrate, the suggested method is suitable for the analysis of very dilute solutions well below the detection limit of standard photometric methods.
Both linear regression lines fit the data well and covered five orders of magnitude, and the resulting squared correlation coefficients were appropriate: R2 = 0.9909 (nitrite) and R2 = 0.9904 (nitrate). The lower limit of quantification for NO2−-N using the suggested method was ~0.006 mg/L, apparently the same as standard photometric methods. However, for NO3−-N, the lower limit of quantification with this method was ~0.003 mg/L, approximately three orders of magnitude better than conventional methods.
3.3. Determination of Nitrate and Nitrite in Surface Water Samples
The developed method was tested on actual freshwater samples. Three different sampling sites were chosen to demonstrate the applicability and versatility of the approach: (1) Lake Balaton (Hungary), (2) Séd creek (Hungary) and (3) Dubrovita River (Romania). Since the temporal and spatial variability of these surface waters were high, no earlier measurement data were used during the evaluation. Water samples were measured as collected, i.e., without filtering. In order to identify the peaks of interest, unknown samples were spiked with nitrate and nitrite.
Figure 3 panel A shows the obtained electropherograms from the capillary electrophoresis analysis of the Lake Balaton sample. As clearly visible, both measured components were found to be below the limit of quantitation. To validate the method, 50 μL of sample was spiked with 20 μL 0.2 mg/L NO3−-N and 20 μL 0.01 mg/L NO2−-N to explore any potential interference with the components of the surface water sample, e.g., organics and floating solid particles. The spiked peaks appeared in the resulting electropherogram with the expected peak areas; thus, the method was considered suitable for its intended use. However, an extra peak, denoted with “*”, appeared, which remained unidentified as it did not affect the nitrate and nitrite concentration determination.
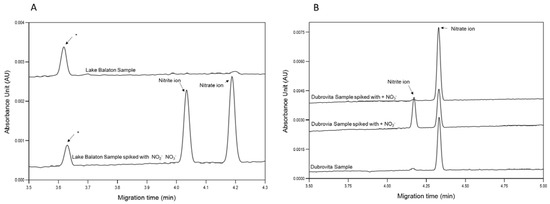
Figure 3.
Determination of aqueous nitrate and nitrite in surface water samples of (A) Lake Balaton and (B) Dubrovita River by capillary electrophoresis. “*” unidentified peak. Separation conditions: 50 µm I.D., 375 µm O.D., 60 cm total and 50 cm effective length BFS capillary; 75 mM TRIS-HCl BGE; hydrodynamic injection (8 psi/8 s); 30 °C capillary temperature; 200 nm detection wavelength; −30 kV (reverse polarity, anode at the injection side) separation voltage with a 1 min ramp-up time.
Additionally, samples (Figure 3 panel B) from the Dubrovita River were also analyzed, where high nitrate contamination was expected due to the intensive agricultural activity in the area. For the identification of nitrate and nitrite peaks in the resulting traces, the unknown sample was spiked again corresponding to the intact sample, sample + nitrite and sample + nitrate electropherograms.
The nitrate and nitrite concentration values obtained with the suggested methodology were compared against the standard photometric determination results. Neither the suggested CE nor the photometric method were capable to measure the nitrate concentration of the Lake Balaton sample. The nitrate concentration of the Séd creek sample (data are not shown, as the trace comprised a single nitrate peak) was found to be 2.01 mg/L NO3−-N, while the standard photometric method resulted in 1.8 mg/L NO3−-N. In the case of the Dubrovita River sample, the CE and photometric methods resulted in 1.6 and 1.46 mg/L NO3−-N, respectively.
Finally, the reproducibility of the CE method was tested on the Dubrovita River samples. The resulting peak area %RSD values were 1.58 and 1.24 for nitrate and nitrate, respectively, thus better than that of the generally acceptable level. The electropherograms of the repeated measurements (n = 6) and the corresponding data table is given in Supplementary Material Figure S6 and Table S1.
4. Conclusions
A new capillary electrophoresis-based method was developed for aqueous nitrite and nitrate concentration determination using high-sensitivity UV/VIS detection and hydrodynamic injection. The method benefits from unique capillary electrophoresis features such as a high separation efficiency and increased sensitivity. The applied large volume sample stacking further enhanced the detection sensitivity utilizing the increased injected sample volume, which is essential for very low concentration samples. The developed CE method was successfully applied to quantify low concentration nitrate and nitrite in various surface water samples.
Supplementary Materials
The following supporting information can be downloaded at: https://www.mdpi.com/article/10.3390/separations9110333/s1. Figure S1: The effect of separation temperature on the peak resolution and migration time. Figure S2: Detection of nitrite and nitrate at different wavelengths. Figure S3: Nitrate peak asymmetry in the function of TRIS concentration and pH of the separation buffer. Figure S4: Nitrate and nitrite peak resolution in the function of TRIS concentration and pH of the separation buffer. Figure S5: Separate nitrate and nitrite CE runs used for the setup of the calibration functions. Figure S6: Electropherograms of the repeated separations for the reproducibility test. Table S1: Statistical evaluation of the repeated (n = 6) separations for the reproducibility test.
Author Contributions
Conceptualization, A.G., R.F. and G.J.; methodology, R.F.; validation, R.F. and Z.K.; formal analysis, R.F.; investigation, R.F.; writing—original draft preparation, G.J.; writing—review and editing, A.G.; supervision, Z.K. and A.G. All authors have read and agreed to the published version of the manuscript.
Funding
The research presented in the article was carried out within the framework of the Széchenyi Plan Plus program with the support of the RRF 2.3.1-21-2022-00008 project.
Data Availability Statement
Data available upon request from the authors.
Acknowledgments
This is contribution #199 of the Horváth Csaba Memorial Laboratory of Bioseparation Sciences.
Conflicts of Interest
The authors declare no conflict of interest.
References
- Vitousek, P.M.; Aber, J.D.; Howarth, R.W.; Likens, G.E.; Matson, D.W.S.; Schlesinger, W.H.; Tilman, D.G. Human alteration of the global nitrogen cycle: Sources and consequences. Ecol. Appl. 1997, 7, 737–750. [Google Scholar] [CrossRef]
- Camargo, J.A.; Alonso, A.; Salamanca, A. Nitrate toxicity to aquatic animals: A review with new data for freshwater invertebrates. Chemosphere 2005, 58, 1255–1267. [Google Scholar] [CrossRef] [PubMed]
- Moorcroft, M.J.; Davis, J.; Compton, R.G. Detection and determination of nitrate and nitrite: A review. Talanta 2001, 54, 785–803. [Google Scholar] [CrossRef]
- Sah, R.N. Nitrate-nitrogen determination—A critical review. Commun. Soil Sci. Plant Anal. 1994, 25, 2841–2869. [Google Scholar] [CrossRef]
- American Public Health Association (APHA), A.W.W.A. and a.W.E.F.W. (AWWA). Standard Methods for the Examination of Water and Wastewater, 18th ed.; American Public Health Association: Washington DC, USA, 1992. [Google Scholar]
- Goldman, E.; Jacobs, R. Determination of Nitrates by Ultraviolet Absorption. J. Am. Water Work. Assoc. 1961, 53, 187–191. [Google Scholar] [CrossRef]
- Norman, R.J.; Edberg, J.C.; Stucki, J.W. Determination of Nitrate in Soil Extracts by Dual-wavelength Ultraviolet Spectrophotometry. Soil Sci. Soc. Am. J. 1985, 49, 1182–1185. [Google Scholar] [CrossRef]
- Norman, R.J.; Stucki, J.W. The Determination of Nitrate and Nitrite in Soil Extracts by Ultraviolet Spectrophotometry. Soil Sci. Soc. Am. J. 1981, 45, 347–353. [Google Scholar] [CrossRef]
- Mubarak, A.T.; Mohamed, A.A.; Fawy, K.F.; Al-Shihry, A.S. A novel kinetic determination of nitrite based on the perphenazine-bromate redox reaction. Mikrochim. Acta 2006, 157, 99–105. [Google Scholar] [CrossRef]
- Tomiyasu, T.; Konagayoshi, Y.; Anazawa, K.; Sakamoto, H. A Kinetic Method for the Determination of Nitrite by Its Catalytic Effect on the Oxidation of Chlorpromazine with Nitric Acid. Anal. Sci. 2001, 17, 1437–1440. [Google Scholar] [CrossRef][Green Version]
- Guttman, A.; Hajba, L. Chapter five-Applications. In Capillary Gel Electrophoresis; Guttman, A., Hajba, L., Eds.; Elsevier: Boston, MA, USA, 2022; pp. 199–349. [Google Scholar]
- Guttman, A. High-resolution carbohydrate profiling by capillary gel electrophoresis. Nature 1996, 380, 461–462. [Google Scholar] [CrossRef]
- Schuur, B.; Haan, A.B.; Kaspereit, M.; Leeman, M. 2.52-Chiral Separations. In Comprehensive Biotechnology, 2nd ed.; Moo-Young, M., Ed.; Academic Press: Burlington, NJ, USA, 2011; pp. 737–751. [Google Scholar]
- Le, T.H.H.; Nguyen, T.Q.H.; Tran, S.C.; Vu, T.T.; Nguyen, T.L.; Cao, V.H.; Ta, T.T.; Pham, T.N.M.P.; Nguyen, T.A.H.N.; Mai, T.D. Screening determination of food additives using capillary electrophoresis coupled with contactless conductivity detection: A case study in Vietnam. Food Control 2017, 77, 281–289. [Google Scholar] [CrossRef]
- Boyce, M.C. Determination of additives in food by capillary electrophoresis. Electrophoresis 2001, 22, 1447–1459. [Google Scholar] [CrossRef]
- Kaniansky, D.; Marak, J.; Masar, M.; Bodor, R. Capillary electrophoresis of inorganic anions1 Dedicated to the memory of Professor Samo Stankoviansky on the occasion of his 90th birthday.1. J. Chromatogr. A 1999, 834, 133–178. [Google Scholar] [CrossRef]
- Marshall, P.A.; Trenerry, V. The determination of nitrite and nitrate in foods by capillary ion electrophoresis. Food Chem. 1996, 57, 339–345. [Google Scholar] [CrossRef]
- Martínková, E.; Křížek, T.; Coufal, P. Determination of nitrites and nitrates in drinking water using capillary electrophoresis. Chem. Pap. 2014, 68, 1008–1014. [Google Scholar] [CrossRef]
- Guan, F.; Wu, H.; Luo, Y. Sensitive and selective method for direct determination of nitrite and nitrate by high-performance capillary electrophoresis. J. Chromatogr. A 1996, 719, 427–433. [Google Scholar] [CrossRef]
- Jimidar, M.; Hartmann, C.; Cousement, N.; Massart, D. Determination of nitrate and nitrite in vegetables by capillary electrophoresis with indirect detection. J. Chromatogr. A 1995, 706, 479–492. [Google Scholar] [CrossRef]
- Morcos, E.; Wiklund, N.P. Nitrite and nitrate measurement in human urine by capillary electrophoresis. Electrophoresis 2001, 22, 2763–2768. [Google Scholar] [CrossRef]
- Melanson, J.E.; A Lucy, C. Ultra-rapid analysis of nitrate and nitrite by capillary electrophoresis. J. Chromatogr. A 2000, 884, 311–316. [Google Scholar] [CrossRef]
- Leone, A.M.; Francis, P.L.; Rhodes, P.; Moncada, S. A Rapid and Simple Method for the Measurement of Nitrite and Nitrate in Plasma by High Performance Capillary Electrophoresis. Biochem. Biophys. Res. Commun. 1994, 200, 951–957. [Google Scholar] [CrossRef]
- Chun, M.-S.; Kang, D.; Kim, Y.; Chung, D. Protein analysis with large volume sample stacking with an electroosmotic flow pump: A potential approach for proteomics. Microchem. J. 2001, 70, 247–253. [Google Scholar] [CrossRef]


Publisher’s Note: MDPI stays neutral with regard to jurisdictional claims in published maps and institutional affiliations. |
© 2022 by the authors. Licensee MDPI, Basel, Switzerland. This article is an open access article distributed under the terms and conditions of the Creative Commons Attribution (CC BY) license (https://creativecommons.org/licenses/by/4.0/).