Abstract
Microplastic pollution in the ocean has a major impact on marine organisms, including digestive system damage and reduced growth and fertility. This study investigated the amount, size, color, type, and presence of heads and intestines of microplastics by size in Litopenaeus vannamei, a type of marine organism. Microplastic analysis was performed using FTIR and digital microscopy. The number of microplastics by the size of the shrimp ranged from 1.73 to 3.8 MPs per 10 g, and the microplastic size of less than 100 μm was 77–92%, with blue showing the highest ratio. As for the type of plastic, PE and PP showed the highest ratio, and PET, PS, nylon, and PVC were found. Microplastics were found to be 11.83 MPs/10 g for heads and intestines and 3.16 MPs/10 g for samples without heads and intestines. This study adds to evidence for the presence of high levels of microplastics in the intestines and heads of shrimp. It also enhances our understanding of the need for efficient plastic waste management in the ocean and the impact of microplastics on marine biota.
1. Introduction
Microplastics are defined as plastic particles smaller than 5 mm, and plastics smaller than 1μm are defined as nanoplastics [1,2,3]. Microplastics are divided into primary microplastics and secondary microplastics. Primary microplastics refer to plastics made less than 5 mm in diameter at the time of manufacture [4]. Secondary microplastics refer to plastics that were large size plastics at the time of manufacture but were smaller than 5 mm due to physical and chemical reactions [5].
Global plastic use has increased steadily since the 1960s, reaching 367 million tons in 2020 and is expected to continually increase [6]. The increase in the use of plastics is accelerating the rapid increase in microplastics. In particular, it can lead to an increase in marine microplastics, which is the final stage.
An increase in marine microplastics could lead to an increase in the microplastic level of seafood [7]. Currently, many researchers have studied the microplastic pollution of marine organisms. Wootton et al. (2021) identified microplastics in the gastrointestinal tract of Fiji and Australian fish. They found microplastics in 61.6% of fish in Australia and 35.3% of fish in Fiji. It was found that 49% of fish sampled worldwide contained an average of 3.5 microplastics [8]. Hossain et al. (2019) investigated brown shrimp and tiger shrimp inhabiting the Bay of Bengal, northern Bangladesh, and found average microplastic values of 3.40 ± 1.23/g and 3.87 ± 1.05/g. The types of MPs were PA-6 and rayon polymer, and the forms of microplastics were as filament (57–58%) and fiber (32–57%) [9]. Gurjar et al. (2021), identified microplastics in three shrimp species (Metapenaeus monoceros, Parapeneopsis stylifera, and Penaeus indicus) on fishing grounds in the northeastern part of the Arabian Sea [10]. Microplastics of the gastrointestinal tract were discovered with average amounts of 70.32 ± 34.67 MPs/g and six types of plastic polymers were identified [10]. Reunura and Prommi (2022) investigated the microplastic contamination levels of male freshwater shrimp and vannamei and confirmed that microplastics of 32.66 ± 5.10, 32.14 ± 4.85, and 10.28 ± 1.19 MP/g were contained in the gastrointestinal tracts [11]. The types of microplastics were identified as polyethylene, polycaprolactone, polyvinyl alcohol, and acrylonitrile butadiene styrene [11]. Devriese et al. (2015) investigated microplastic levels in the southern North Sea habitat area and channel area. Microplastics were detected in 63% of shrimp, and it was confirmed that the average amounts of microplastics were 1.23 ± 0.99 MPs/g [12]. Sutthacheep et al. (2021) researched microplastics in shrimp off the coast of Thailand and Andaman, and the microplastics were found to be 6–10 MPs/10 g [13]. The types of microplastics were identified as polyethylene terephthalate, polyurethane, rayon, polystyrene, and polyvinyl alcohol [13]. As such, various studies on the effect of microplastics on shrimp have been researched.
This study was conducted to determine the microplastic contamination level of shrimp, which is consumed the most in Korea. First, unlike several papers that only checked the microplastic level of shrimp, this study confirmed the microplastic content by the size of the shrimp. Second, the level of microplastics according to the presence or absence of the head and intestines of shrimp, which can confirm microplastic before and after trimming, was investigated. Therefore, this study can be used as data to see in detail the degree of microplastic contamination according to the size of the shrimp and the presence or absence of intestines, beyond simply identifying the number of microplastics in the shrimp.
2. Materials and Methods
2.1. Sample Preparation
The microplastic level of shrimp was investigated through two experiments: the number of microplastics by the size of the shrimp and the number of microplastics in the intestines and heads of the shrimp. About 150 shrimps were purchased from a Korean supermarket and microplastic analysis was performed. The first experiment confirmed the microplastic level by the size of the shrimp. Korean shrimp (Litopenaeus vannamei) was divided into large (11 ± 2.25 cm), medium (8 ± 2.17 cm), and small (6 ± 2.28 cm) sizes to determine the quantities, size, color, and types of microplastics. The number of shrimps used in the experiment was large (30 ea), medium (30 ea), and small (30 ea), a total of 90 shrimps. In this experiment, shrimps without intestines were used to check the microplastics in the tissues. The second experiment confirmed the microplastic level (quantity, size, color, type) of shrimp intestines and heads. The test subjects were 60 white-legged shrimps (Litopenaeus vannamei). Among the 60 shrimps, 30 shrimp confirmed their microplastic levels in the whole shrimp with intestines and heads. The remaining 30 shrimps had their intestines and heads removed to check the microplastic level. In this experiment, the size of the purchased shrimp was confirmed to be 11 ± 2.30 cm. All purchased shrimps were stored frozen at −20 °C before the experiment and thawed at room temperature (25 ± 3 °C) during the experiment. Figure 1 shows the picture of the shrimp used in the experiment.
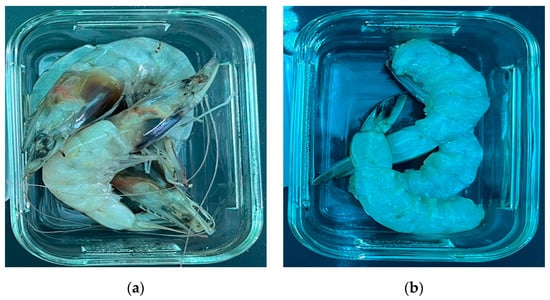
Figure 1.
Shrimp picture used in the experiment: (a) With shrimp intestines and heads; (b) Without shrimp intestines and heads.
2.2. Sample Pretreatment
Shrimp stored frozen at −20 °C was thawed at room temperature to determine the weight and length of the thawed shrimp. All experimental instruments used for pretreatment were washed with tertiary distilled water and then stored and dried in a closed space to ensure that other contaminants did not intervene. The order of pretreatment is to wash the shrimp in tertiary distilled water. After immersing the shrimp in a 30% hydrogen peroxide solution, grind the shrimp finely using a stainless steel mixer washed with distilled water. Decomposition of organic matter was carried out for 3 days in a 30% hydrogen peroxide solution (H2O2: CAS No. 7722-84-1) in a heating stirrer set at 40 °C and 150 rpm [14,15]. After the decomposition of organic matter, foreign substances were separated by using a 300 μm size sieve. Prume et al., 2021 confirmed the sample reproducibility and high recovery rate for >300 μm in the microplastic quantification step [16]. The sample after completing the foreign matter separation was filtered under reduced pressure using a stainless-steel mesh filter to filter out microplastics. After the material separation was completed, microplastics were filtered through a stainless filter using a vacuum filtration device. The microplastic filter used was made of stainless steel with a pore size of 20 μm and a diameter of 25 mm. The filtered filter was dried in a dry oven at 40 °C for more than 4 h, and then placed in a desiccator for 1 day and analyzed. Figure 2 shows the pre-treatment photos of shrimp in 4 stages.
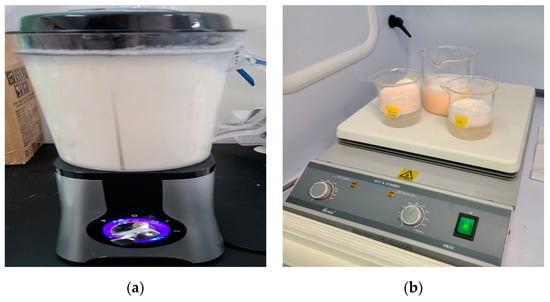
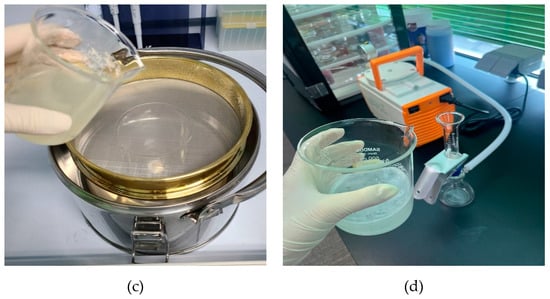
Figure 2.
Process of shrimp test pretreatment: (a) Finely crush the shrimp using a blender; (b) Decompose the broken shrimp for organic matter; (c) Sieve after decomposition of organic matter; (d) Filtration and drying through a mesh filter.
2.3. Microplastic Analysis
Microplastic analysis was performed using a Fourier-transform infrared spectroscopy (FTIR) microscope (IN10MX, Thermo Fisher, Scientific Inc, Waltham, Massachuetts, USA), and through a digital microscope (DSZM-7045T, Dongwon Industry, Seoul, Korea). The microplastic analysis settings in the FTIR microscope are shown in Table 1. Figure 3 shows the results of analyzing microplastics using the FTIR microscope.

Table 1.
FT-IR settings for microplastic analysis.
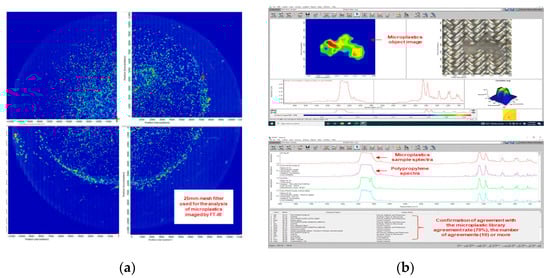
Figure 3.
Microplastic mesh filter image and microplastic identification process: (a) A 25 mm mesh filter used for the analysis of microplastics imaged by FTIR microscope; (b) Determination of microplastics using software.
Figure 4 illustrates the micro FTIR microscope analysis sequence. The used FTIR microscope analyzes 1/4 of a 25mm meth filter at one time, and the entire filter is analyzed through four processes. For the analyzed filter, the number, material, and length of microplastics were checked using FTIR microscope software. The color of the microplastic was confirmed through a digital microscope (DSZM-7045T, Dongwon Industry, Korea). Figure 5 shows the color analysis of microplastics using a digital microscope. The type of microplastic was determined based on FTIR Spectra data provided by FTIR software. The plastic type criterion was determined as a specific plastic type if the matching rate was 70% or more and the same plastic was found in more than 10 cases. The size of the microplastic was measured by the longest length (maximum Feret’s diameter) [17].
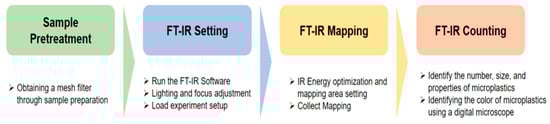
Figure 4.
Process of microplastic analysis process using FTIR microscope.
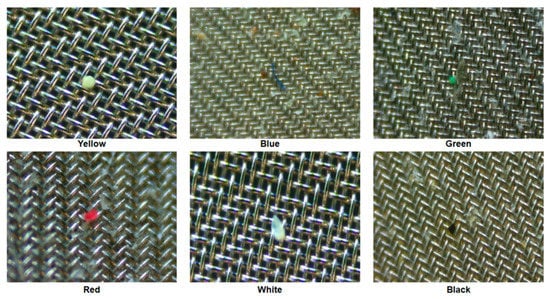
Figure 5.
Color confirmation of microplastics using a digital microscope.
3. Results
3.1. Microplastic Level by Shrimp Size
This experiment identified the number of microplastics in 30 shrimps by the size of Litopenaeus vannanmei from Korea. Figure 6 shows the amount of microplastics by the size of the shrimp. In small size (6 ± 2.28 cm), microplastics were found in all shrimp except two shrimps, and the average value of microplastics was 1.63 MPs/10 g. In medium size (8 ± 2.17 cm), microplastics were discovered in all shrimp except five shrimps, and it was confirmed to be 1.86 MPs/10 g. At a large size of 11 ± 2.25 cm, we obtained microplastics in all except one shrimp. The average number of microplastics found was 3.8 MPs/10 g. The used shrimp was a shrimp without intestines and heads and all microplastics were found in the flesh of shrimp.
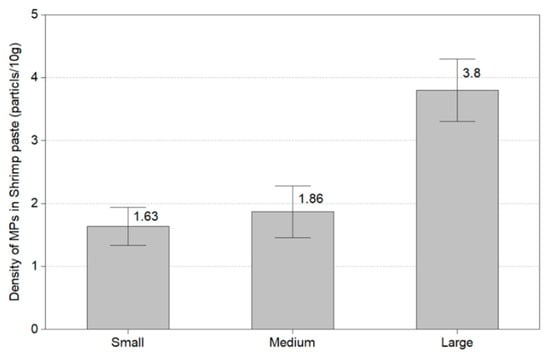
Figure 6.
Amount of microplastics by size of shrimp.
Figure 7 shows the size of microplastics by the size of the shrimp. The microplastic ratio by the size of small shrimp was found to be 53% under 50 μm, 39% between 50 μm and 100 μm, and 8% between 100 μm and 150 μm. The microplastic size ratio of medium-sized shrimp was 46% under 50 μm, 39% between 50 μm and 100 μm, and 14% between 100 μm and 150 μm. The microplastic size ratio of large shrimp was found to be 46% under 50 μm, 31% between 50 μm and 100 μm, and 3% between 100 μm and 150 μm. In most shrimp, the proportion of microplastics less than 100 μm was high from 77% to 92%.
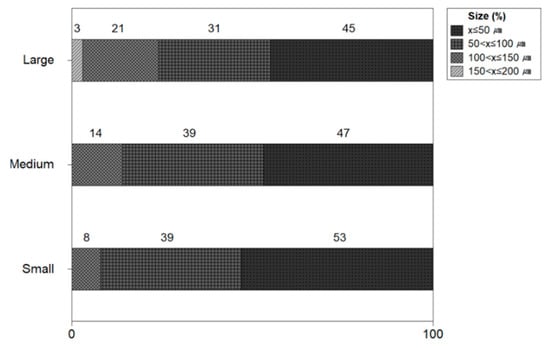
Figure 7.
Size of microplastics by size of shrimp.
Figure 8 expresses the color of microplastics by the size of the shrimp. The microplastic color of small-size shrimp resulted in the order of blue 61%, white 18%, black 6%, red 6%, green 2%, yellow 4%, and gray 2%. The microplastic color in medium size shrimp was reported in order of blue 63%, white 14%, red 7%, green 4%, yellow 2%, and gray 2%. The color of microplastics in large-size shrimp was confirmed to be blue 44%, white 18%, red 14%, green 11%, black 10% and yellow 4%. In all three sizes of shrimp, blue was identified with the highest ratio.
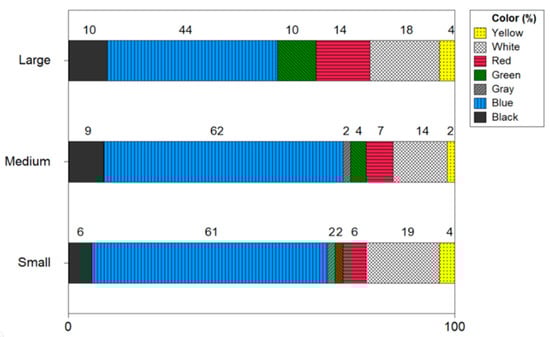
Figure 8.
Color of microplastics by size of shrimp.
The microplastic types of shrimp were analyzed using an FTIR Microscope. Figure 9 shows the types of microplastics by the size of the shrimp. The microplastic types of small shrimp were identified as polyethylene (PE:55%), polypropylene (PP:31%), polyethylene terephthalate (PET:4%), polystyrene (PS:4%), nylon (4%), and polyvinyl chloride (PVC:2%). In medium-sized shrimp, the types of microplastics were conformed PE (63%), PP (21%), nylon (7%), PS (4%), PVC (4%), and PET (4%), with a high proportion of PE and PP. The microplastic type in large size shrimp was resulted as PE (45%), PP(28%), PET(11%), PS(8%), nylon(7%), and PVC(2%). As for the types of microplastics, PE and PP were identified with a high ratio, and PET, PS, nylon, and PVC were found.
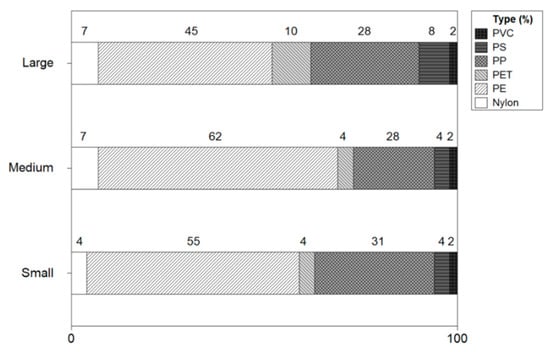
Figure 9.
Types of microplastics by size of shrimp.
3.2. Microplastic Contamination Level by Presence or Absence of Shrimp Intestines
This experiment confirmed the microplastic level of thirty shrimps according to the presence or absence of the head and intestines of the white shrimp (Litopenaeus vannanmei) from Korea. Figure 10 displays the amount of microplastics with and without the intestines and the head of shrimp. In the shrimp with intestines and head, microplastics resulted in all shrimp, with an average abundance of 11.83 MPs/10 g. Microplastics without intestines and head were found in all except one shrimp and the average amount of microplastics was 3.16 MPs/10 g. About four times more microplastics were discovered in shrimp with intestines and heads than in shrimp without intestines and heads.
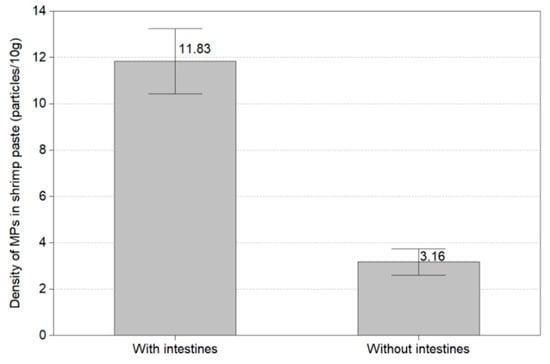
Figure 10.
Amount of microplastics with and without the intestines and the head of shrimp.
Figure 11 shows the size of microplastics with and without the intestines and heads of shrimps. The ratio of the number of microplastics in shrimps with the intestines and head resulted to be 50 μm 25%, <50 to 100 μm 20%, <100 μm to 150 μm 24%, <150 μm to 200 μm 20%, and >200 μm 11%. The microplastic size ratio of shrimp without intestines and heads was 50 μm 37%, <50 to 100 μm 40%, and <100 μm to 150 μm 23%. The microplastic size of shrimp without the intestines and head was 150 μm or less, whereas 11% of microplastics of 200 μm or more were confirmed in shrimp with the intestines and head. It was confirmed that microplastics with a size of 200 μm or larger were included in the intestine and head of the shrimp.
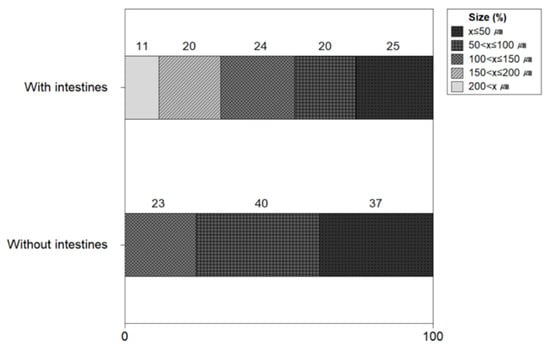
Figure 11.
Size of microplastics with and without intestines and heads of shrimps.
Figure 12 shows the color of microplastics with and without shrimp intestines and heads. The microplastic color of the shrimp with intestines and heads was confirmed in the following order: blue (60%), white (12%), black (8%), green (8%), red (3%), yellow (3%), and gray (1%). In shrimp without intestines and heads, microplastics were identified in the following order: blue (62%), white (17%), green (9%), black (7%), red (3%), and yellow (1%). Blue was the main color of microplastics in shrimp with intestines and heads and shrimp without intestines and heads, and there was no significant difference in other colors.
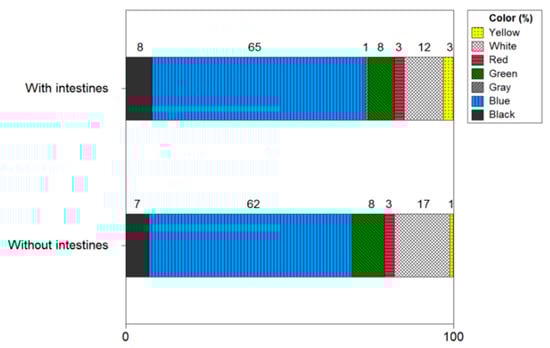
Figure 12.
Color of microplastics with and without shrimp intestines and heads.
Figure 13 shows the types of microplastics with and without intestines and heads of shrimp. The microplastic types of shrimp with intestines and heads were identified as polyethylene (51%), polypropylene (28%), polyethylene terephthalate (10%), nylon (8%), polyvinyl chloride (2%), polystyrene (2%). In shrimp without intestines and heads, polyethylene (59%), polypropylene (25%), polyethylene terephthalate (8%), nylon (4%), polystyrene (2%) and polyvinyl chloride (1%) were identified. There was no significant difference in the types of microplastics in shrimp with or without intestines and heads, and PE and PP were identified as major microplastics.
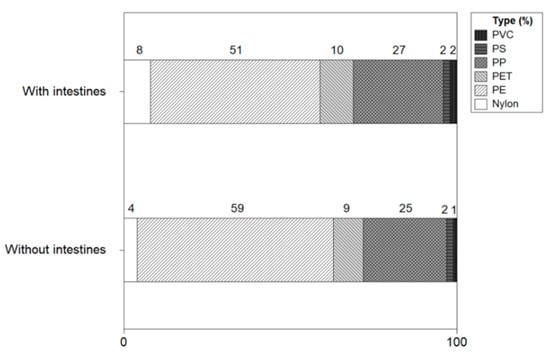
Figure 13.
Types of microplastics with and without intestines and heads of shrimp.
4. Discussion
4.1. Microplastic Level by Shrimp Size
In this study, microplastics by the size of shrimp from Litopenaeus vannanmei from Korea were identified, and microplastics were found in most shrimp. As for the amount of microplastic on average, small-size shrimp (1.73 MPs/10 g), medium-size shrimp (1.86 MPs/10 g), and large-size shrimp (3.8 MPs/10 g) confirmed high levels of microplastic contamination. It is concluded that the microplastic level varies according to the size of the shrimp. There was no significant difference in the amount of microplastics between small and medium-sized shrimp, and the large-sized shrimp had about twice the microplastic level than that of small and medium-sized shrimp. Li et al. (2021) confirmed that microplastics were contained in marine plankton, which could affect many marine organisms such as shrimp and whales that feed on plankton [17]. Moreover, Alfaro-Núñez et al. (2021) investigated seawater and 240 marine organisms from the 4000 km of the Tropical Easten Pacific Coast and found microplastics in all water and marine organisms [18]. This suggests that many oceans and marine organisms in the world are contaminated with microplastics [17,18,19]. The size of microplastics was in the order of 50 μm, <50 to 100 μm, <100 μm to 150 μm, <150 μm to 200 μm, >200 μm. It also resulted that 50 μm and<50 to 100 μm or less accounted for 77 to 92%. This confirmed that the smaller microplastics were more likely to accumulate in the shredded shrimp. This refers that the large microplastics are removed when the shrimp are shredded, but the small size microplastics attached to the shrimp fresh still remain. It has been found that when shrimp consume microplastics, their digestive system is damaged, and their growth and fertility are reduced [20].
As for the color of microplastics, blue showed the highest ratio from 44 to 63% and it was found that white 14 to 18%, black 6 to 10%, red 6 to 14%, green 2 to 13%, yellow 2 to 4% and gray 0 to 2%. It was confirmed that the microplastic color of the shrimp had a high percentage of blue. Ugwu et al. (2021) reviewed 132 microplastic-related papers, and as a result of the review, the color distribution in fish was blue (28.12%), black (23.44%), transparent (21.88%), white (18.75%), green (4.69%) and red (3.12%) [21]. Nan et al. (2020) reported that 90% of blue microplastics were high in shrimp in the Australian Sea [22]. In addition, many studies have identified black, blue, transparent, white, and yellow as microplastics mainly found in the sea [23,24].
The type of plastic was analyzed based on FTIR microscope and PE (45 to 55%), PP (21 to 31%), PET (4 to 11%), PS (4 to 8%), PVC (2%), and nylon (4 to 7%) were identified in the order. Additionally, Ugwu et al. (2021) estimated that the major polymers found in vertebrates were polyethylene 27.3%, polypropylene 14.3%, rayon 11.7%, and polyester 10.4% [21]. These polymers are widely used as materials for food packaging, clothing, fishing gear, etc. [25,26].
4.2. Microplastic Level by Presence or Absence of Shrimp Head and Intestines
In this study, the accumulation pathway of microplastics in shrimp was confirmed through the presence or absence of the head and intestines of shrimp from Litopenaeus vannanmei from Korea. The amount of microplastics in the shrimp with intestines and heads was 11.83 MPs/10 g, which resulted in a higher microplastic level compared to 3.16 MPs/10 g for shrimp without intestines and heads. Li et al. (2021) investigated the effect of microplastics on the growth of shrimp and confirmed that PE and PS remained in the intestines [20]. Curren et al. (2020) studied microplastics in three types of shrimp and confirmed that the microplastics in the intestines of shrimp varied from 13.4 MPs/g to 7050 MPs/g [27]. These experiments confirmed that the amount of microplastic in the intestines and heads of the shrimp was higher than that of the shredded shrimp.
The size of microplastics for shrimp with intestines and heads was 50 μm (25%), <50 to 100 μm (20%), <100 μm to 150 μm (24%), <150 μm to 200 μm (20%), >200 μm (11%), and it was found that microplastics were uniformly present for each size relatively. On the other hand, shrimp without the intestines and head were 50 μm (37%), %), <50 to 100 μm (40%), and <100 μm to 150 μm (23%), and it was confirmed that relatively small size microplastics were present. This indicates that when eating shrimp, removing the head and intestines is a way to lower your microplastic exposure because there is a relatively large amount of microplastic in the intestines and heads of shrimp. Gurjar et al. (2021) reported that microplastics of 100 to 250 μm were the most abundant form of microplastics in the shrimp [10].
The colors of microplastics are similar to the previous pattern: blue (62 to 65%), white (12 to 17%), green (8 to 9%), black (8 to 7%), red (3%), yellow (1 to 3%) and gray (0 to 1%), it was confirmed that blue color was the most dominant color. Carreras-Colom et al. (2018) documented that five fiber colors (transparent, blue, black, red, and green) were observed in Aristeus antennatus and that no particular color was dominant [28]. Hossain et al. (2019) investigated brown shrimp inhabiting the Bay of Bengal in northern Bangladesh, and as a result, black (48%), white (33%), green (11%), blue (6%), and red (2%) of microplastics were observed [9].
Types of plastic were confirmed as PE (51 to 59%), PP (25 to 28%), PET (8 to 10%), nylon (4 to 8%), PS (2%), PVC (1~2%) and there was no significant difference from the first experiment. This indicates that food packaging and laundry, fishing equipment, and fishing gear can be the main sources of microplastic contamination [29,30].
5. Conclusions
The result of this study was to investigate the microplastic contamination level of Litopenaeus vannanmei from the Korea sea. In Litopenaeus vannanmei from the Korea sea, it was confirmed that many types, sizes, and colors of microplastics existed in the Korea sea. In the experiment of microplastic level by shrimp size, the amount of microplastics for each shrimp size was confirmed to be 1.73 to 3.8 MPs/10 g. The size of microplastics less than 100 μm was 77 to 92%. There was no significant difference in the level of microplastic between small shrimp and medium-sized shrimp, but it was confirmed that the level of microplastic level increased in large shrimp. In the experiment of microplastic level by presence or absence of shrimp head and intestines, microplastics were found at an average value of 3.16 MPs/10 g without the head and intestines and an average value of 11.83 MPs/10 g with the head and intestines. This indicates that about four times more microplastics were detected in shrimp with intestines and heads than without intestines and heads. It was confirmed that the level of microplastic in the intestines and head of the shrimp was higher than the flesh of the shrimp. In terms of microplastic size, shrimp with intestines and heads had larger microplastics than shrimp without intestines and heads. This refers that larger microplastics were deposited on the intestines and heads. In both experiments, the blue color was highest in microplastics, and as the types of plastics, PE and PP showed the highest ratio, and PET, PS, nylon, and PVC were found. This can be used as evidence that confirms the seas of Korea are contaminated with microplastics. In addition, since shrimp are mainly used for food, removing the intestines and heads before cooking and eating can weaken the microplastic contamination level of shrimp. Nevertheless, in order to more accurately confirm the microplastic level of shrimp, additional research is necessary to investigate various shrimp species with many samples of shrimp. In this study, as the microplastic contamination level of shrimp is clearly identified, it is considered that it is necessary to investigate a potential method to protect aquatic organisms from microplastic contamination.
Author Contributions
Conceptualization, H.P.; methodology, H.Y.; microplastic experiment, H.Y., B.P. and J.R.; microplastic analysis, H.Y., B.P. and H.P.; data collection, B.P. and J.R.; writing, review and editing, H.Y., H.P. and B.P.; supervision, H.P. All authors have read and agreed to the published version of the manuscript.
Funding
This research received no external funding.
Data Availability Statement
Data is contained within the article.
Conflicts of Interest
The authors declare no conflict of interest.
References
- Barnes, D.K.A.; Galgani, F.; Thompson, R.C.; Barlaz, M. Accumulation and fragmentation of plastic debris in global environments. Phil. Trans. R. Soc. 2009, 364, 1985–1998. [Google Scholar] [CrossRef] [PubMed]
- Rocha-Santos, T.; Duarte, A.C. A critical overview of the analytical approaches to the occurrence, the fate and the behavior of microplastics in the environment. Trends Anal. Chem. 2015, 65, 47–53. [Google Scholar] [CrossRef]
- Ng, E.L.; Huerta-Lwanga, E.; Eldridge, S.M.; Johnston, P.; Hu, H.-W.; Geissen, V.; Chen, D. An overview of microplastic and nanoplastic pollution in agroecosystems. Sci. Total Env. 2018, 627, 1377–1388. [Google Scholar] [CrossRef] [PubMed]
- Boucher, J.; Friot, D. Primary Microplastics in the Oceans: A Global Evaluation of Sources; IUCN: Gland, Switzerland, 2018; p. 43. Available online: https://portals.iucn.org/library/sites/library/files/documents/2017-002-En.pdf (accessed on 18 August 2022).
- Efimova, I.; Bagaeva, M.; Bagaev, A.; Kileso, A.; Chubarenko, I.P. Secondary Microplastics Generation in the Sea Swash Zone With Coarse Bottom Sediments: Laboratory Experiments. Front. Mar. Sci. 2018, 5, 313. [Google Scholar] [CrossRef]
- Tiseo, I. Global Plastic Production 1950–2020, 27 July 2022. Available online: https://www.statista.com/statistics/282732/global-production-of-plastics-since-1950/ (accessed on 12 August 2022).
- Smith, M.; Love, D.C.; Rochman, C.M.; Neff, R.A. Microplastics in Seafood and the Implications for Human Health. Curr. Env. Health Rep. 2018, 5, 375–386. [Google Scholar] [CrossRef]
- Wootton, N.; Ferreira, M.; Reis-Santos, P.; Gillanders, B.M. A Comparison of Microplastic in Fish From Australia and Fiji. Front. Mar. Sci. 2018, 8, 690991. [Google Scholar] [CrossRef]
- Hossain, M.S.; Rahman, M.S.; Uddin, M.N.; Sharifuzzaman, S.M.; Chowdhury, S.R.; Sarker, S.; Chowdhury, M.S.N. Microplastic contamination in Penaeid shrimp from the Northern Bay of Bengal. Chemosphere 2020, 238, 124688. [Google Scholar] [CrossRef]
- Gurjar, U.R.; Xavier, M.; Nayak, B.B.; Ramteke, K.; Deshmukhe, G.; Jaiswar, A.K.; Shukla, S.P. Microplastics in shrimps: A study from the trawling grounds of north eastern part of Arabian Sea. Env. Sci. Pollut. Res. 2021, 28, 48494–48504. [Google Scholar] [CrossRef]
- Reunura, T.; Prommi, T.O. Detection of microplastics in Litopenaeus vannamei (Penaeidae) and Macrobrachium rosenbergii (Palaemonidae) in cultured pond. PeerJ 2022, 10, e12916. [Google Scholar] [CrossRef]
- Devriese, L.I.; van der Meulen, M.D.; Maes, T.; Bekaert, K.; Paul-Pont, I.; Frère, L.; Robbens, J.; Vethaak, A.D. Microplastic contamination in brown shrimp (Crangon crangon, Linnaeus 1758) from coastal waters of the Southern North Sea and Channel area. Mar. Pollut. Bull. 2015, 98, 179–187. [Google Scholar] [CrossRef]
- Sutthacheep, M.; Phoaduang, S.; Chamchoy, C.; Klingthong, W.; Salakphet, C.; Silparasarn, A.; Sangiamdee, D.; Yeemin, T. The particles of microplastics in shrimp paste from the Gulf of Thailand and the Andaman Sea. Ramkhamhaeng Int. J. Sci. Technol. 2021, 4, 27–34. Available online: https://ph02.tci-thaijo.org/index.php/RIST/article/download/243888/165515/850874 (accessed on 1 January 2020.).
- Kazour, M. Active and Passive Biomonitoring Tools for Microplastics Assessment in Two Highly Polluted Aquatic Environments: Case Study of the Seine Estuary and the Lebanese Coast; Earth Sciences, Université du Littoral Côte d’Opale: Dunkerque, France, 2019; NNT: 2019DUNK0544; Available online: https://tel.archives-ouvertes.fr/tel-02484873v2/document (accessed on 20 August 2022).
- Beijer, N.R.M.; Dehaut, A.; Carlier, M.P.; Wolter, H.; Versteegen, R.M.; Pennings, J.L.A.; de la Fonteyne, L.; Niemann, H.; Janssen, H.M.; Timmermans, B.G.; et al. Relationship Between Particle Properties and Immunotoxicological Effects of Environmentally-Sourced Microplastics. Front. Water 2022, 4, 866732. [Google Scholar] [CrossRef]
- Prume, J.A.; Gorka, F.; Löder, M.G.J. From sieve to microscope: An efficient technique for sample transfer in the process of microplastics’ quantification. MethodsX 2021, 8, 101341. [Google Scholar] [CrossRef] [PubMed]
- Li, Y.; Sun, Y.; Li, J.; Tang, R.; Miu, Y.; Ma, X. Research on the Influence of Microplastics on Marine Life. IOP Conf. Ser. Earth Env. Sci. 2021, 631, 012006. [Google Scholar] [CrossRef]
- Alfaro-Núñez, A.; Astorga, D.; Cáceres-Farías, L.; Bastidas, L.; Villegas, C.S.; Macay, K.C.; Christensen, J.H. Microplastic pollution in seawater and marine organisms across the Tropical Eastern Pacific and Galápagos. Sci. Rep. 2021, 11, 6424. [Google Scholar] [CrossRef] [PubMed]
- Chatterjee, S.; Sharma, S. Microplastics in our oceans and marine health. Field Actions Sci. Rep. 2019, 19, 54–61. Available online: http://journals.openedition.org/factsreports/5257 (accessed on 20 August 2022).
- Li, H.; Chen, H.; Wang, J.; Li, J.; Liu, S.; Tu, J.; Chen, Y.; Zong, Y.; Zhang, P.; Wang, Z.; et al. Influence of Microplastics on the Growth and the Intestinal Microbiota Composition of Brine Shrimp. Front. Microbiol. 2021, 12, 717272. [Google Scholar] [CrossRef]
- Ugwu, K.; Herrera, A.; Gómez, M. Microplastics in marine biota: A review. Mar. Pollut. Bull. 2021, 169, 112540. [Google Scholar] [CrossRef]
- Nan, B.; Su, L.; Kellar, C.; Craig, N.J.; Keough, M.J.; Pettigrove, V. Identification of microplastics in surface water and Australian freshwater shrimp Paratya australiensis in Victoria, Australia. Environ. Pollut. 2020, 259, 113865. [Google Scholar] [CrossRef]
- Martí, E.; Martin, C.; Galli, M.; Echevarría, F.; Duarte, C.M.; Cózar, A. The Colors of the Ocean Plastics. Environ. Sci. Technol. 2020, 54, 6594–6601. [Google Scholar] [CrossRef]
- Galli, M.; Tepsich, P.; Baini, M.; Panti, C.; Rosso, M.; Vafeiadou, A.; Pantelidou, M.; Moulins, A.; Fossi, M.C. Microplastic abundance and biodiversity richness overlap: Identification of sensitive areas in the Western Ionian Sea. Mar. Pollut. Bull. 2022, 177, 113550. [Google Scholar] [CrossRef] [PubMed]
- Dhaka, V.; Singh, S.; Anil, A.G.; Naik, T.S.S.K.; Garg, S.; Samuel, J.; Kumar, M.; Ramamurthy, P.C.; Singh, J. Occurrence, toxicity and remediation of polyethylene terephthalate plastics. A review. Env. Chem. Lett. 2022, 20, 1777–1800. [Google Scholar] [CrossRef] [PubMed]
- Worm, B.; Lotze, H.K.; Jubinville, I.; Wilcox, C.; Jambeck, J. Plastic as a Persistent Marine Pollutant. Annu. Rev. Environ. Resour. 2017, 42, 1–26. [Google Scholar] [CrossRef]
- Curren, E.; Leaw, C.P.; Lim, P.T.; Leong, S.C.Y. Evidence of Marine Microplastics in Commercially Harvested Seafood. Front. Bioeng. Biotechnol. 2020, 8, 562860. [Google Scholar] [CrossRef]
- Carreras-Colom, E.; Constenla, M.; Soler-Membrives, A.; Cartes, J.E.; Baeza, M.; Padrós, F.; Carrassón, M. Spatial occurrence and effects of microplastic ingestion on the deep-water shrimp Aristeus antennatus. Mar. Pollut. Bull. 2018, 133, 44–52. [Google Scholar] [CrossRef]
- Bergmann, M.; Collard, F.; Fabres, J.; Gabrielsen, G.W.; Provencher, J.F.; Rochman, C.M.; van Sebille, E.; Tekman, M.B. Plastic pollution in the Arctic. Nat. Rev. Earth Env. 2022, 3, 323–337. [Google Scholar] [CrossRef]
- Amelia, T.S.M.; Khalik, W.M.A.W.M.; Ong, M.C.; Shao, Y.T.; Pan, H.-J.; Bhubalan, K. Marine microplastics as vectors of major ocean pollutants and its hazards to the marine ecosystem and humans. Prog. Earth Planet Sci. 2021, 8, 12. [Google Scholar] [CrossRef]


Publisher’s Note: MDPI stays neutral with regard to jurisdictional claims in published maps and institutional affiliations. |
© 2022 by the authors. Licensee MDPI, Basel, Switzerland. This article is an open access article distributed under the terms and conditions of the Creative Commons Attribution (CC BY) license (https://creativecommons.org/licenses/by/4.0/).