Abstract
The need to get uranium out of leaching liquid is pushing scientists to come up with new sorbents. This study uses the wet technique to improve the U(VI) sorption properties of ZrO2/chitosan composite sorbent. To validate the synthesis of ZrO2/CS composite with Zirconyl-OH, -NH, and -NH2 for U(VI) binding, XRD, FTIR, SEM, EDX, and BET are used to describe the ZrO2/chitosan wholly formed. To get El Sela leaching liquid, it used 150 g/L H2SO4, 1:4 S:L ratio, 200 rpm agitation speed, four hours of leaching period, and particle size 149–100 µm. In a batch study, the sorption parameters are evaluated at pH 3.5, 50 min of sorbing time, 50 mL of leaching liquid (200 mg/L U(VI)), and 25 °C. The sorption capability is 175 mg/g. Reusing ZrO2/CS for seven cycles with a slight drop in performance is highly efficient, with U(VI) desorption using 0.8 M acid and 75 min of desorption time. The selective U(VI) recovery from El Sela leachate was made possible using ZrO2/CS. Sodium diuranate was precipitated and yielded a yellow cake with a purity level of 94.88%.
1. Introduction
Nuclear energy using uranium is regarded as a low-carbon emission and a potential option to address the rising need for global energy [1]. However, nuclear energy’s high radiologic and chemical toxicity has drawn increased attention to the environmental safety issue of uranium contamination in water [2,3,4]. In Egypt, resources of radioactive raw materials include certain conventional and nonconventional types discovered at some places in the Eastern Desert, Sinai, and the Western Desert. The Egyptian Nuclear Materials Authority has conducted extensive uranium mineral exploration projects for the past few decades. These programs identified some uranium mineralization connected to the so-called younger granites in the Eastern Desert. Gabal El Sela, a new uranium mineralization discovery in Egypt’s far southeast, is located in the Halaib environment [5,6,7].
The uranium in the ore is dissolved by a process known as leaching. The leaching process used to dissolve uranium minerals depends partly on the ore’s physical features, such as mineralization type, ease of liberation, and the other minerals that make up the ore [8]. Different types of uranium ore processing and leaching techniques based on acid and alkaline leaching approaches have been developed in the last few decades [9]. Inshas Pilot Plant Unit’s leaching process may lose valuable uranium due to the clay minerals in El Sella ore materials, which are present in relatively high concentrations in El Sela ore materials [10,11,12]. The most frequent way of obtaining uranium from rocks is leaching with sulfuric acid. U(VI) recovery from H2SO4 leaching is typically between 85 and 95 percent [13].
On the other hand, carbonate materials are not suited because of their high acid consumption. For uranium ore processing, sulfuric acid was the most common method of uranium leaching [14,15]. However, because of the high acid use, this method is not cost-effective for uranium carbonate rocks. In recent years, various alkaline leaching agents, such as hydroxide or carbonates and bicarbonates, have explored the techniques for uranium and vanadium alkaline leaching [16,17]. The selectivity of uranium (VI) leaching in alkaline carbonate was higher than that of the most precipitated contaminants. Sodium carbonate, hydrogen peroxide, and sodium hydroxide were used to selectively deplete uranium from hydroxy Egyptian monazite. The quality of the uranium produced by this method was less than 99% [18].
A liquid and a solid (sorbent) phase are separated via solid-phase separation. Sorption on solid materials allows for the concentration and purification of analytes in the solution. The liquid sample is passed over a cartridge, a column, a tube, or a disc that contains a sorbent that recollects the analytes. The samples are eluted with appropriate solvents after passing through the sorbent to recover the analytes [19,20,21,22]. All adsorbents can be utilized in a solid-phase separation. They can be hydrophobic or polar, depending on the material. Retention of ionic metal species on hydrophobic supports necessitates the creation of hydrophobic complexes. The reagent is added to the sample, or the hydrophobic solid sorbent is impregnated with the reagent. Because the reaction on the cartridge may not change the metal equilibrium in the sample, the impregnation may be a significant development in trace analysis [23,24,25,26].
The magnetic amine resins were synthesized by suspending polymerization of glycidyl methacrylate through N, N-methylene bisacrylamide in the attendance of micro magnetite particles and anchored with various amine ligands, which were then characterized by their magnetic properties. It was discovered that the produced resins could bind uranium ions. Three granite samples from Egypt’s Gabal Gattar pluton in the northeastern desert were successfully processed for uranium extraction [27]. Phosphine oxide ligands would harmonize with uranium in radioactive acidic liquid rubbish with elevated selectivity and affinity. A design and formation of phosphine oxide broadcaster architecture structurally systematized in the specified mesopores of m Zr-MOFs for uranium sorption [28]. Moreover, vastly porous thiophene-comprising DUT-68 globules were prepared for sorption of iodine vapor and CO2 [29]; also, the coconut fibers were modified with Saccharomyces cerevisiae yeast cells to remove Pb(II) ions by sorption process [30].
Furthermore, it was necessary to separate and extract uranyl ions from real samples using nanostructured mesoporous sodium zirconium phosphate (NaZrP-CEX). It was possible to regenerate mesoporous NaZrP-CEX in a seven-cycle experiment with either 0.05 M HNO3 or 1 M HCl [31]. To remove U(VI) from the nitrate solution, zirconium phosphate was developed as an inorganic ion exchanger by synthesizing it from zircon crystal [32]. To remove cadmium (Cd) and cobalt (Co) ions from aqueous solutions, three distinct Chitosan/ZrO2 composites were synthesized via the sol-gel system and tested. For Cs(I) at pH9 and Co(II) at pH6, adsorption capacity is 124.6 mg/g and 111.1 mg/g, respectively [33]. For U(VI) sorption, polydopamine and zirconium oxide were mixed to create polydopamine/hydrous zirconium oxide. It had a uranium(VI) adsorption capability of 100.56 mg/g [34]. Zirconium silicate and zirconium oxide were also used to investigate the uranyl ion sorption mechanism [35].
Egypt’s most significant uranium and other economic element deposits can be found in the southern area of the Eastern Desert at El Sela, where H2SO4 was employed to dissolve the ions in the ore. The best conditions for leaching, such as acid concentration, solid/liquid ratio, sorbing time, and temperature, are identified. Recovering and adsorbing U(VI) from acidic solutions was achieved by preparing nano-zirconium oxide/chitosan ((ZrO2/CS)). The ideal uranium adsorption conditions from their standard solutions and acidic leach liquor are also obtained.
2. Materials and Methods
2.1. Materials and Instrumentation
In all areas of this work, all chemicals and reagents employed were analytical grades; they were not purified in the laboratory. Poole, England, was the source of nitric acid (69 percent), hydrochloric acid (36.5 percent), and sulfuric acid (98 percent). Chitosan and zirconyl chloride octahydrate (98 percent ZrOCl2.8H2O) were obtained from Sigma Aldrich (2-amino-2-deoxy-(1→4)—D-glucopyranan-poly-1, 4-gluco-pyranose-amine, 90.5 percent).
Mineral composition analysis was carried out using the XRD technique (XRD) utilizing Bruker company type D8. FTIR (Shimadzu I.R. Prestige21) was used to analyze the prepared samples and examined adsorbents. To avoid the effects of signal-to-noise ratio noise, it was necessary to calculate each spectrum as an average of 50 subsequent scans. An environmental scanning electron microscope (SEM), the Philips XL 30, was used to identify the precipitated uranium (the yellow cake) and the composites that were formed. Because of this, it was used to investigate the mineral composition of the sorbent composite. NOVA for Windows®® Version 1.12 was used to measure the surface area and pore volume of nano metal oxide and the generated sorbent using the conventional volumetric nitrogen adsorption method at 77 K (USA, Nova 2000 series, Quantachrone Corporation). The uranium concentration was measured using a JANEWAY UV/Vis 6405 spectrophotometer with quartz cells of 1 cm in diameter and a wavelength of 655.0 nm, casing the UV/visible wavelength display of 200–1100 nm.
2.2. Production of Nanoparticles of ZrO2
The zirconyl chloride (ZrOCl2.8H2O) precursors were used in a solid-state process to produce the nanocrystalline zirconia [36,37]. A fine powdered (700 °C) ZrOCl2.8H2O and NaOH were ground and blended at room temperature first. It was then placed in an autoclave, where the temperature was controlled for a certain time. The mixture was rinsed twice with ethanol and deionized H2O to eliminate the solid water and any remaining chloride ions. Afterward, the samples were dehydrated at (110 °C) for some time. At 550 °C for 20 h, the dried samples were subjected to calcination.
2.3. Preparation of Zirconium Oxide/Chitosan
Zirconium oxychloride and chitosan matrix coordination were followed by cross-linking with glutaraldehyde to form a ZrO2/chitosan composite [38,39]. As described above, a homogenous gel was generated by dissolving 30.0 g of chitosan powder in 500 mL of a 2 percent (v/v) acetic acid aqueous solution. An amount of 1 M ZrOCl2.8H2O was added gradually and agitated at 150 rpm for an hour under room temperature. To precipitate the ZrO2/chitosan compound, 2.0 M sodium hydroxide was added drop-wise. Glutaraldehyde aqueous solution was added and agitated briskly for an additional 150 min after the first 50 mL. For 36 h, the suspension was kept at 2 °C in a refrigerator to finish the cross-linking reaction. After six days of drying at 30 °C, the composite was rinsed with distilled water to restore the pH level. For U(VI) adsorption investigations, the dry composite was employed.
2.4. Sorption Data
ZrO2/CS sorbent was utilized to remove uranium from leaching liquid in the current study. The adsorption process was carried out utilizing the batch approach. Some trials were conducted to inspect U(VI) adsorption to ascertain the optimum circumstances for the applicable factors governing the sorption process. These factors include pH, temperature, sorbing time, ZrO2/CS dose, and uranium concentration. Additionally, the initial uranium concentration was measured. All the trials were repeated, and the values that were obtained from each set were averaged. Sorption tests were passed by combining 50 mL sample solutions of varying uranium concentrations with doses ranging from 10 to 100 mg of ZrO2/CS in 100 mL conical flasks, which were then shaken at a speed of 200 rpm by a mechanical shaker. The contact times ranged from 5 to 120 min, and the temperatures ranged from 22 to 100 °C. The pH varied from 1 to 6, and either 0.3 M NaOH or 0.3 M H2SO4 solutions were used to make adjustments as necessary. The difference between the equilibrium concentration and the beginning concentration was utilized to compute uranium ions taken up after the filtration.
On the other hand, the related experiments designed to regulate the sorption kinetics, equilibrium isotherms, and thermodynamic characteristics of the uranium ions were successfully carried out. The resulting equations were used to determine the distribution coefficient (Kd), sorption capacity (qe, in mg/g), and adsorption (E, in %) for the uranium ions that were adsorbed on ZrO2/CS during each adsorption experiment [40,41,42]:
where C0 and Ce represent the initial and equilibrium U(VI) concentrations (mg/L), V and v represent the volumes of the solution (L and mL, respectively), and m is the weight of the ZrO2/CS (g).
2.5. Desorption Data
The uranium-loaded ZrO2/CS obtained from the previously revealed set of the examined processes was therefore put through the rigors of the study of the desorption operations. Throughout this procedure, a variety of desorbing chemicals were utilized as eluants. In each experiment, 1.0 g of loaded ZrO2/CS was agitated at room temperature with 50 mL of various concentrations of individual desorbing agents for a contact time of 75 min. The experiments were carried out in duplicate. After that, the solution was filtered and the desorbing solution was used to remove the uranium ions that the filter had retained. Arsenazo III was utilized to carry out spectrophotometric analysis to calculate the uranium concentration. In this work, the factors known to influence uranium desorption were explored. These factors included the concentration of the desorbing agent, the amount of time spent in contact, and the temperature.
2.6. Precipitation of Yellow Cake
Uranium in the eluting solution created after desorption from the uranium-loaded ZrO2/CS was normally precipitated before the final purification step. This was done by adding 25% sodium hydroxide to a pH7 solution. Uranium ions were precipitated as sodium diuranate, chemically represented by the formula Na2U2O7. Drying the final uranium precipitate, also known as yellowcake, was the last step. The finished product was implemented to characterize and improve the processes.
3. Results and Discussion
3.1. ZrO2/CS Depiction
3.1.1. XRD Investigation
Figure 1 demonstrates the XRD patterns of nano-zirconium oxide (ZrO2), chitosan (CS), and ZrO2/CS both before and after the adsorption. These patterns were taken from nano-zirconium oxide and chitosan, respectively. The distinctive peaks of nano-ZrO2 exhibit prominent broad peaks at 2θ = 24°, 28°, 30°, 32°, 34°, 35°, 38°, 49°, 51°, 54°, 56°, 60°, and 65°, which corresponded to the database of Bruker software COD 2300203 and 9007485. These peaks can be seen at 24°, 28°, 30°, 32°, 34°, 35°, 38°, and 49°. According to these findings, most of the nano-ZrO2 was made up of ZrO2 Baddeleyite.
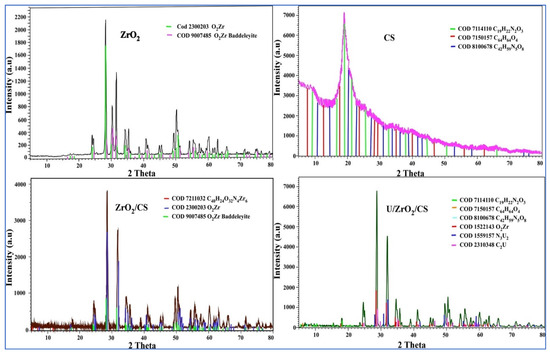
Figure 1.
XRD patterns of nano-ZrO2, CS, ZrO2/CS, and U/ZrO2/CS.
Figure 1 reveals that the distinctive peaks of chitosan (CS) had a major broad peak at 2θ = 19°. This peak was in accordance with the database of the Bruker program COD 7114110, 7150157, and 8100678. Figure 1 displays the results of the XRD performed on ZrO2/CS and U/ZrO2/CS. It was found that the peak position and peak form of CS with high intensity at 2θ = 19° overlapped with the peaks of ZrO2. According to the respective databases of the Bruker software COD 7211032, 2300203, and 9007485, the production of new peaks caused by the surface electrostatic interaction between ZrO2 and CS resulted in the formation of a novel composite called ZrO2/CS; the formation of new peaks caused this. According to the database of Bruker software COD 1559157 and 2310148, some new peaks were found in the XRD pattern of U/ZrO2/CS as a result of uranium ions adsorbing onto ZrO2/CS.
3.1.2. SEM Analysis
SEM is the most reliable and practical technique for analyzing resin beads’ physical structure treated with inorganic material. SEM is a scanning electron microscope. It was also useful to examine ZrO2, CS, ZrO2/CS, and U/ZrO2/CS surface and physical formations in Figure 2. Shapes and compositions of ZrO2 were visible in the SEM images of the materials. It is impossible to connect the ZrO2 skeletons since they were made from little, uneven parts with tiny diameters. As seen in Figure 2, the CS surface has been smoothed out by several holes. Due to ZrO2 molecule collection and impregnation on the surface of SiO2/CS, SEM images show rough surfaces with many holes. To make matters worse, the composites used in the pictures had larger interstitial holes because of the way they were assembled.
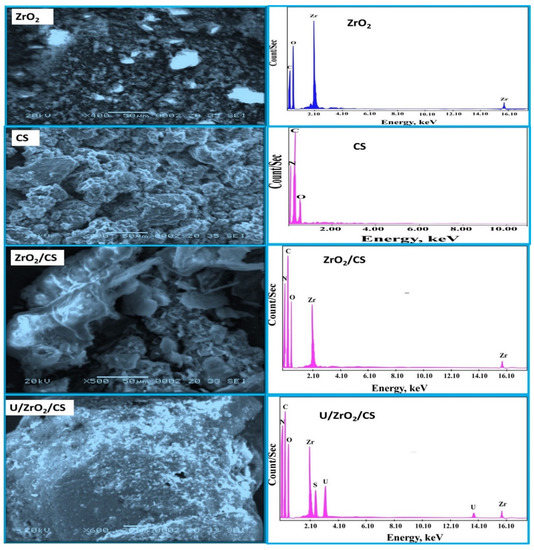
Figure 2.
ZrO2, CS, ZrO2/CS, U/ZrO2/CS of SEM photographs, besides ZrO2, CS, ZrO2/CS, U/ZrO2/CS of EDX spectra.
Following U(VI) adsorption on ZrO2/CS, SEM images revealed that pores were filled with U(VI). These composites had erratic surfaces and were agglomerated with U(VI). More surface area was available for U(VI) adsorption in these composite structures, as shown by SEM. ZrO2, CS, ZrO2/CS, and U/ZrO2/CS were also analyzed using EDX spectrums (Figure 2). N, C, and O peaks can be found in the CS spectrum, whereas zirconium and oxygen peaks were in the ZrO2 spectrum. C, O, Zr, and N peaks appeared in the ZrO2/CS. According to these results, the Zr, N, C, and O peaks were found to have been caused by the ZrO2/CS composite. Adsorption of uranium ions on ZrO2/CS led to the discovery of unique uranium ions peaks. The uranium peak appearance confirmed U(VI) adsorption on ZrO2/CS.
3.1.3. BET Surface Analysis
The Brunner–Emmett–Teller (BET) theory was used to calculate the surface area of solid and porous materials. The physical structure of a solid can be inferred from the size of its surface, which affects how it interacts with its environment. The surface area of a substance can be altered during its production and processing. When a particle is milled into smaller pieces, its surface area increases because additional surfaces are created. Another physical or chemical process leading to increased particle surface area is breakdown, dissolution, or other processes. The nitrogen adsorption–desorption analyzer determines the adsorbent’s pore size and specific surface area. There are isotherm curves in Figure 3 showing the materials studied for nitrogen adsorption–desorption behavior.
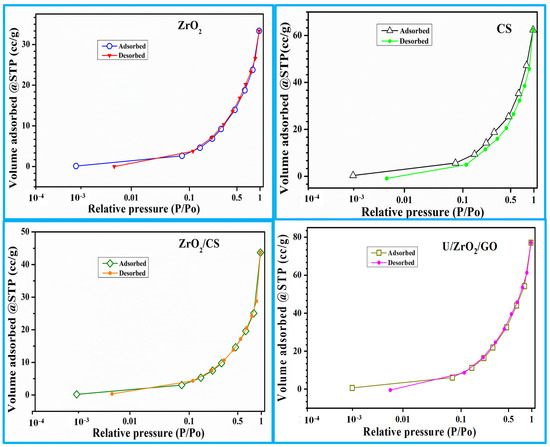
Figure 3.
ZrO2, CS, ZrO2/CS, and U/ZrO2/CS N2 adsorption/desorption isotherm.
ZrO2 had a BET surface area of 27.65 m2/g, according to Table 1. The isotherms of CS were altered once ZrO2 was added. Because the specific surface area, pore volume, and pore size differences between ZrO2 and CS were so large, it is reasonable to believe that ZrO2 coated CS pores. ZrO2 improved the CS’s ability to adsorb uranium ions by increasing its pore size and surface area. A decrease in the surface area, pore size, and pore volume of the adsorbents evaluated after adsorption was seen as a result of uranium ion blockage.

Table 1.
Specific surface area, pore size, and pore volume nano-ZrO2, CS, ZrO2/CS, and U/ZrO2/CS.
3.1.4. FTIR Analysis
Fourier Transform Infrared (FTIR) spectroscopy is a necessary analysis technique that categorizes various distinct functional groups at the surface of the investigated sorbent. The chemical bond will change shape when infrared light interacts with solid objects, either expanding, contracting, or bending. Therefore, regardless of the support structure of the molecules, each functional group inclines to absorb infrared light with a particular wavenumber range.
The nano-ZrO2, CS, ZrO2/CS, and U/ZrO2/CS in Figure 4 were identified using FTIR spectroscopy. The stretching mode of the large peak confirmed the OH group of H2O extracted on the nano-ZrO2 surface at 3482 cm−1 in Figure 4 of nano-ZrO2. A peak indicated the OH group of H2O at 1656 cm−1 [43,44,45,46]. The peak identified the hydroxyl zirconium stretching mode (Zr-OH) group at 2370 cm−1 [47]. Two peaks that matched the Zr-O group [48,49,50,51,52] were at 551 cm−1 and 499 cm−1.
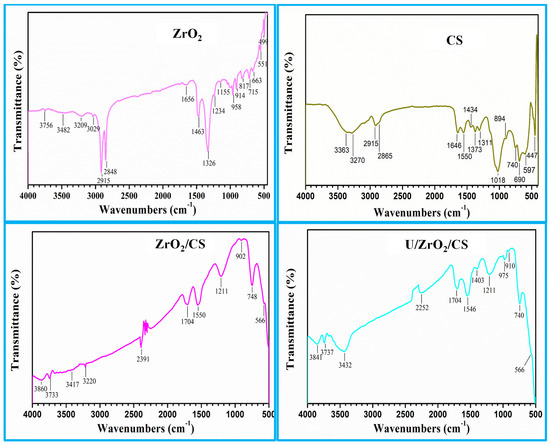
Figure 4.
ZrO2, CS, ZrO2/CS, and U/ZrO2/CS FTIR spectra.
Due to the -OH and -NH groups’ overlap, the FTIR spectrum of CS (Figure 4) showed two peaks at 3363 and 3270 cm−1 [53]. Peaks at 2915 cm−1 and 2865 cm−1 belonged to -CH2 groups. The unique peak at 1646 cm−1 was associated with the -NH2, while the deformation peak of the -NH was located at 1434 cm−1 [54,55,56,57,58]. Peaks at 1164 cm−1 and 1018 cm−1 fit C-N, while the peak at 1550 cm−1 matched the C=N [59]. The stretching of C-O and C-O-C is also responsible for the peaks at 1373 and 1311 cm−1. The distinctive absorption of the -d-glucose unit was located in the absorption band at 894 cm−1 [60]. Furthermore, the ZrO2/CS spectrum (Figure 4) showed a high peak at 3417 and 3220 cm−1, which explains the -OH and -NH of ZrO2 and CS. The Zr-O group, however, is comparable to the peaks at 566 cm−1. As a result, ZrO2/CS formation was ready.
The results from the data acquired demonstrated the primary discrepancies between the data, as mentioned earlier, after and before uranium ion adsorption on the ZrO2/CS adsorbent. The reduction and redshifting of the -OH, -NH, stretching vibration bands for the investigated adsorbents after U(VI) adsorption may be caused by the uptake of U(VI) to the surface adsorbents, as demonstrated in the spectra of U/ZrO2/CS. Additionally, additional (O=U=O) peaks emerged between 975 and 740 cm−1 [61,62,63]. This indicates that -NH2, -NH, and -OH are reactants with the uranyl cations. Therefore, the CS-modified ZrO2 was more amenable to U(VI) adsorption.
3.2. Leaching Application
Physical upgrading, leaching, and extraction of uranium ions from El Sela ore materials are all involved in the extraction of U(VI) from the leaching liquid. Appropriate reagents dissolve valuable minerals from insoluble solids for the hydrometallurgical leaching technique.
About 30 km south of Abu-Ramad city, in Egypt’s southern, Eastern Desert, in an area known as El Sela where latitudes range from 22°17′50′′ to 22°18′6′′, and longitudes range from 36°13′36′′ to 36°14′22′′ east, was used to collect the rock sample for the study. Muscovites, plagioclases, potash-biotites, and feldspar were found in low-grade uranium ores from the El Sela area [64,65,66]. There are three types of secondary minerals: kaolinite, chlorite, and sericite. Opaque and garnet are two more minerals that can be found. The primary uranium minerals in the El Sela sample are uranophane and beta-uranophane. The mineral autunite (uranium phosphate) was found [67].
X-ray fluorescence (XRF) is used to identify El Sela ore’s primary oxides and some minor elements. Table 2 lists the El Sela ore material’s primary and minor components. The investigation findings confirmed the host rock’s composition and defined the parent rock’s average element content. Approximately 67.78 percent of the El Sela sample was SiO2, while P2O5 was 0.11 percent. Na2O and K2O were found to be 2.29 and 2.14 percent in the sample. The concentrations of U, Ba, rare earth elements (REEs), Ga, and Pb were found to be 0.085 percent, 0.27 percent, 0.13 percent, 533 mg/kg, and 665 mg/kg, respectively.
Table 2.
Chemical constituents of El Sela ore material.
Uranium was extracted from its deposits through leaching, one of the most critical extraction processes. Uranium ions and certain related elements, such as iron, were found in the El Sela sample during the chemical and mineralogical examinations. The El Sela rock sample’s uranium leaching was first crushed and processed to precise particle size. Leaching was completed next.
3.2.1. Leaching Agent Types
Eluting type was studied concerning leaching efficiency using a variety of leaching agents such as H2SO4, HNO3, and HCl. The leaching trials were worked with 10 g of powdered sample (150 mg/L individual leaching agent, 1:3, S/L ratio) and 30 milliliters of 150 mg/L individual leaching agent, with 150 rpm stirring speed. After that, the resulting rock sludge was filtered and the precipitate was repeatedly washed with water to remove any remaining contaminants. To determine U(VI), the obtained filtrate was diluted to a specific volume to represent the leach liquor. Furthermore, the leach liquor’s total iron content was assessed. Uranium’s extreme leaching efficiency was 58.65 percent, according to Figure 5a, but iron’s total leaching efficiency was only 5.43 percent using 150 mg/L H2SO4. The acid leaching of uranium ions was therefore carried out using sulfuric acid.
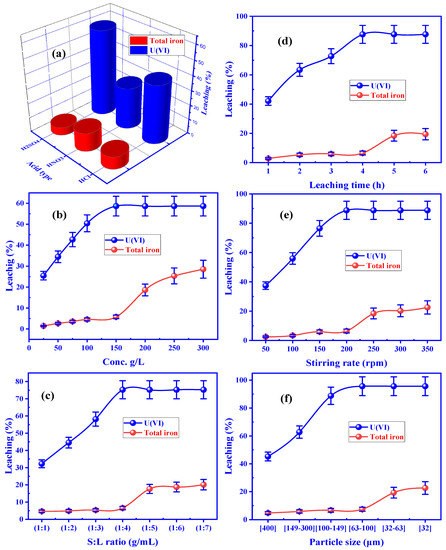
Figure 5.
Influence of (a) leaching types, (b) sulfuric acid concentration, (c) solid-to-liquid ratio, (d) leaching time, (e) stirring speed, and (f) particle size on leaching efficiency of U(VI) and total iron from El Sela mineralization.
3.2.2. H2SO4 Concentration Influence
Uranium leaching from the El Sela granitic rock materials was explored using H2SO4 concentrations ranging from 25 to 300 g/L (0.25 to 3 M). A 1:3 S/L ratio, 150 rpm stirring speed, and 100–149 µm particle size were the additional experimental parameters that remained constant over the 3 h of contact duration at room temperature (Figure 5b). When H2SO4 concentration was increased to 150 g/L (1.5 M), the leaching efficiency of U(VI) reached 58.66 percent; however, the leaching efficiency did not improve when 150 g/L (1.5 M) H2SO4 was used. When uranium was extracted, the total iron in the leaching liquid was an unwanted impurity. According to the results, the iron concentrations were measured and found to be quite low. Another finding revealed that H2SO4 in concentrations of 150 g/L (1.5 M) had the best efficiency in dissolving El Sela mineralization’s most abundant uranium ions.
3.2.3. Solid: Liquid Ratio Influence
S:L ratios of 1:1 to 1:7 were used to test the effect on the leaching efficiency of 150 g of H2SO4 per liter, 149 to 100 micrometers in particle size, and 150 rpm stirring speed for three hours at room temperature. Figure 5c shows that as the (S:L) ratio fell from 1:1 to 1:4, uranium leaching efficiency steadily climbed to 75.24 percent. It was still possible to maintain a consistent uranium leaching efficiency by altering the S:L ratio from 1:4 to 1:7. The leaching efficiency of total iron is 6.54 percent, even though the finest solid: liquid phase ratio was chosen as 1:4.
3.2.4. Leaching Time Influence
It was found that leaching time significantly impacted uranium leaching efficiency by altering the contact period from 1 to 8 h. Figure 5d shows the improvement in uranium leaching from 42.11 to 87.63 percent when the contact time was increased from 1 to 4 h. After increasing the leaching time to more than four hours, there was no change in leaching efficiency. With increasing time, however, the leaching efficiency of total iron rose from 6.55 to 18.43 percent. For this reason, the leaching time for U(VI) was fixed at four hours to minimize total iron leaching.
3.2.5. Stirring Speed Influence
The stirring speed was utilized to examine the effect of stirring speed on uranium leaching. Temperature and acid concentration was held constant at 150 g/L for 4 h, along with a 1:4 S:L phase ratio and particle size range of 149–100 µm, although stirring speed ranged from 50 to 350 rpm. According to Figure 5e, the leaching efficiency was 88.77 % when the stirring speed was 200 rounds per minute. A stirring speed of 200 rpm increased total iron leaching efficiency by 6.45 percent, while overall iron leaching efficiency was 6.45 percent. Consequently, the 200 rpm stirring speed proved advantageous in future tests.
3.2.6. Particle Size Influence
It was found that particle size significantly impacted the efficiency of the uranium leaching process, and the other experimental variables remained constant. Figure 5f showed that the leaching efficiency of uranium was 95.65% at the particle size of 100–63 µm, and it remained constant after that. Total iron leaching efficiency remained consistent at 7.43 percent throughout the experiment. Consequently, particles of 100–63 µm in diameter worked best in uranium leaching.
3.3. Adsorption Application
Zirconium oxide-modified chitosan (ZrO2/CS) was employed to eliminate U(VI) from the leaching liquid. The analytical methods used to identify optimal conditions are pH, sorbing time, amount of U(VI), and initial concentration.
3.3.1. Impact of pH
The pH of the solution governs the adsorption process. Figure 6a displays the effect of pH on the adsorption effectiveness of U(VI) from the leaching liquid (200 mg/L U(VI)). An extensive range of pH values, from 1 to 6, was tested in numerous experiments. A 50 mL solution leaching liquid was held at room temperature while the other conditions were kept constant at 0.05 g ZrO2/CS sorbent dose and 30 min of sorbing time. The adsorption efficiency of U(VI) increased from 16.0% to 61.7% when the pH was raised from 1.0 to 3.5, according to the collected data. Increasing the pH from 3.5 to 6.0, on the other hand, reduced U(VI) adsorption efficiency to 18.0%.
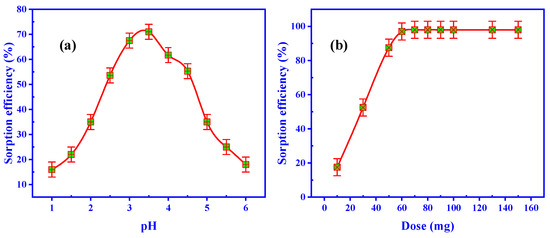
Figure 6.
Influence of (a) pH and (b) ZrO2/CS dose on the U(VI) adsorption efficiency from leaching liquid.
An acidic solution was used for the condensed adsorption of the ZrO2/CS sorbent since it could adsorb so many bisulfate (HSO4−) ions to its active sites. On the other hand, bisulfate ions competed with uranium anion complexes for adsorption surfaces. As the pH was increased, the concentration of bisulfate ions was lowered. It was accomplished, and the adsorption effectiveness was improved until the maximum adsorption at pH 3.5. U(VI) sorption was found to be reduced at pH > 3.5, which suggests that some U(VI) ions precipitated as sodium diuranate was produced. A pH of 3.5 has been chosen as the optimal pH for administering the following investigations.
3.3.2. Impact of ZrO2/CS Dose
At a pH of 3.5 and a leaching liquid concentration (200 mg/L U(VI)) of 50 mL, a series of tests were applied via ZrO2/CS as a sorbent dose, ranging from 10 to 150 mg. The adsorbent dose was studied for 50 min at room temperature (Figure 6b). According to the findings, the ZrO2/CS accumulative adsorbent dosage improved the U(VI) adsorption efficiency. Up to 60 mg of ZrO2/CS, the adsorption efficiency of U(VI) steadily rose with growing adsorbent dosages before remaining constant. As a result, 60 mg of ZrO2/CS was shown to be the optimal adsorbent dosage. As an alternative, the subsequent studies utilized the 50 mg adsorbent dose to change the results.
3.3.3. Impact of Adsorbing Time
The ZrO2/CS adsorption effectiveness of U(VI) was examined during a timescale of 5 to 120 min. On the other hand, the other adsorption parameters were set to pH 3.5, 50 mg adsorbent dosage, and 50 mL leaching liquid. At 50 min, the effectiveness of U(VI) adsorption had achieved equilibrium; however, as shown in Figure 7a, it increased as adsorbing time increased. The equilibrium adsorption period was 50 min to accommodate the extra effort.
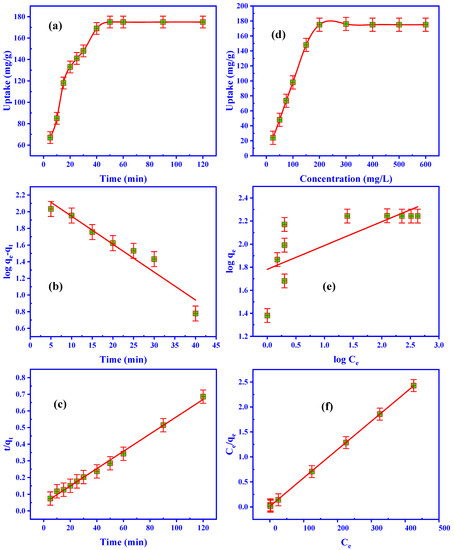
Figure 7.
Influence of (a) adsorbing time, (b) 1st-order kinetic, (c) 2nd-order kinetic, (d) U(VI) concentration, (e) Freundlich isotherm, (f) Langmuir isotherm on the adsorption efficiency of U(VI) using ZrO2/CS.
3.3.4. Kinetic Evaluation
Kinetic models were investigated to evaluate the mechanism of the adsorption process and the rate-controlling phases. Pseudo-1st-order and pesudo-2nd-order kinetic models were employed to assume the kinetic adsorption mechanism of U(VI) adsorption on ZrO2/CS composite. The 1st-order model is expressed in the linear form as the following equation [68,69,70]:
k1 (min–1) is the 1st-order rate constant, while qe and qt (mg/g) are the U(VI) uptake at equilibrium and time t (min). It is possible to determine k1 and the qe from the slope and intercept of log(qe–qt) vs. time. Figure 7b and Table 3 reveal that the adsorption scheme’s correlation coefficient R2 and qe values do not fit a 1st-order kinetic model, respectively. According to the objective results, the 1st-order reaction cannot be carried out using U(VI) adsorption on ZrO2/CS adsorbent.
Table 3.
ZrO2/CS adsorbent kinetic adsorption parameters.
The 2nd-order kinetic model, conversely, is executed and built up in the equation below [71,72,73]:
There is a 2nd-order equation, k2 (g/mg·min), which is the rate constant of the 2nd-order equation, and qt (mg/g) is the quantity of U(VI) adsorbed at the moment of time t (min). The rate-dominant stage, chemical adsorption, can be predicted kinetically using this approach. When the 2nd-order reaction was genuine, a straight line represented the relationship between t/qt and t. qe and k2 were calculated by intercepting the slope. The correlation coefficient (R2) was similar to one. However, the calculated value of the adsorbed quantity at equilibrium was closer to the practical capability (Figure 7c and Table 3). ZrO2/CS adsorbed U(VI) well according to the 2nd-order model, as demonstrated by these data.
3.3.5. U(VI) Concentration Impact
The U(VI) concentration is a vital adsorption technique parameter that can impact ZrO2/CS adsorption performance. The adsorption effectiveness of 50 mg of ZrO2/CS sorbent was tested in batch tests to see how the U(VI) concentration affected the results. At room temperature (25 °C), 50 mL of standard uranium ions solution (25 to 600 mg/L) at pH3.5 was shaken for 50 min. Figure 7d shows that the uranium ions concentration rose, and the adsorption uptake peaked at 200 mg/L. As of 200 mg/L (U(VI)), 175.0 mg/g of the adsorption capacity is utilized. Hence, the maximal loading capacity of 175.0 mg/g was also accurate. After the adsorption reached 200 mg/L, the adsorbent was said to have attained its maximum loading capacity, and the uptake remained steady (saturation capacity). All the ZrO2/CS active sites were occupied and blocked by uranium ions due to the high mobility of uranium ions in the solutions.
3.3.6. Isotherm Studies
Adsorption isotherms are useful for transferring ions to the adsorbents during the adsorption reaction. To detail any adsorption process, the adsorption isotherm is also essential. It was necessary to study the adsorption isotherms to determine significant data for adsorption when the adsorbed ions were dispersed across the solid and aqueous phases at equilibrium [74,75]. Characterization of the adsorption approach was done using Freundlich and Langmuir models. The adsorption of U(VI) on the ZrO2/CS surface is described by the Freundlich isotherm. Surface energies and heterogeneity are frequently studied using this method [76,77,78,79]. Here is a convenient formula for determining Freundlich isotherm:
where qe (mg/g) is the quantity of U(VI) adsorbed at equilibrium, Ce is the concentration of U(VI) in a solution at equilibrium, Kf (mg/g) is the constant connection to maximal adsorption capacity, n is the constant correlated to surface heterogeneity, and to get the n and Kf values, a regression line was drawn using the logqe vs. logCe curve (Figure 7e) as the intercept and slope for ZrO2/CS (Table 4). The U(VI) experimental capacity was higher than the Kf (mg/g) value. The information demonstrated how the Freundlich isotherm did not correspond to the adsorption system.
Table 4.
Characteristics of ZrO2/CS adsorption isotherm with U(VI).
Saturated monolayer adsorption on the Langmuir isotherm model occurs on the homogenous surface at constant energy [80,81,82,83]. It can be quantified using the following equation:
In this equation, qe (mg/g) is the equilibrium amount of adsorbent adsorption, qmax (mg/g) is the maximum amount of adsorption, b is a constant associated with the affinity of the binding sites and the adsorption energy (L/mg) of each adsorbent unit mass. This way, the relation between Ce/qe and Ce is publicized in Figure 7f and Table 4. The adsorption capacity (175.44 mg/g) was close to the experimental uptake capacity (175.0 mg/g), and the correlation coefficient (R2) was closer to unity for ZrO2/CS. The data show that the Langmuir isotherm model was followed in U(VI) adsorption.
3.3.7. Temperature Impact
At 25 to 55 °C, U(VI) adsorption temperature was studied. For 50 min of sorbing time, the experimentations were performed using 50 mL of leaching liquid (200 mg/L U(VI)), pH 3.5, and 0.05 g of ZrO2/CS (Figure 8a). The adsorption effectiveness decreased from 175.0 to 168.0 mg/g when the temperature was raised to 55° C. Since the Van der Waals bonds break down with increased temperature, the active sites are reduced. Because of this, uranium ions can be better adsorbent at room temperature (25 °C) than at any other temperature.
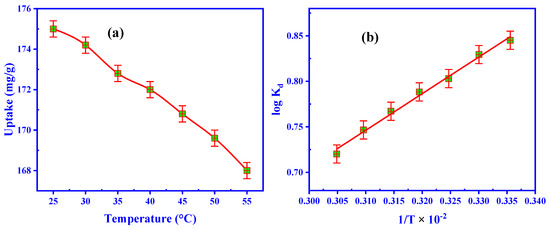
Figure 8.
(a) Outcome of temperature, and (b) relation of log Kd vs. 1/T of adsorption efficiency.
3.3.8. Thermodynamic Features
The thermodynamic settings of the adsorption method were obtained by examining the adsorption procedure’s practicality and nature through temperature. Some adsorption trails at various temperatures were used to assess the thermodynamic conditions, such as a change in Gibbs free energy (ΔG°), enthalpy (ΔH°), and entropy (ΔS°).
The Van’t Hoff equations were utilized to evaluate the thermodynamic conditions for U(VI) adsorption by ZrO2/CS [84,85,86,87,88]:
where Kd is the equilibrium constant for adsorption (L/g), R is the universal gas constant (8.314 J/mol.K), and T is the absolute temperature (K). Figure 8b depicts the thermodynamic conditions of ZrO2/CS. The slope and intercept yielded the values for ΔH° and ΔS° (Table 5). The negative ΔG° values designated that the spontaneous adsorption of U(VI) on ZrO2/CS was observed. Adsorption methods were favorable because of the electrostatic attraction among U(VI) and the investigated ZrO2/CS, as confirmed by the ΔG° of the contacts. Exothermic adsorption may be recommended if ΔH° is negative. Furthermore, the negative ΔS° established the feasibility and unpredictability of adsorption at the ZrO2/CS/solution interface.
Table 5.
The thermodynamic U(VI) sorption settings.
3.4. U(VI) Desorption
The desorption of uranium from the loaded ZrO2/CS is completed. An important factor in minimizing the cost of adsorbent purification is desorption methods that can reuse and regenerate the adsorbent material. In batch procedures, desorbing concentrations, S:L phase ratio, and desorbing time affect desorption efficiency.
3.4.1. Desorbing Type Impact
The effect of different eluting types, such as NaCl, HNO3, H2SO4, (NH4)2CO3, HCl, and Na2CO3, on the U(VI) desorption from U/ZrO2/CS was studied by shaking the loaded ZrO2/CS at 1:30 S:L phase ratio. The additional desorption parameters were held constant at 1 M (eluting concentration) and 60 min of desorbing time at room temperature. As publicized in Figure 9a, the desorption efficiency of U(VI) from U/ZrO2/CS to 1 M H2SO4 has reached a high of 83.0 percent. As a result, sulfuric acid was shown to be the best method for removing U(VI) from the surface of U/ZrO2/CS.
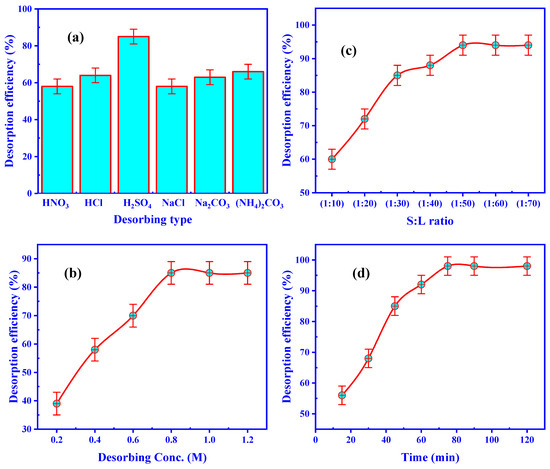
Figure 9.
Impact of (a) desorbing agent, (b) H2SO4 concentration, (c) S:L ratio, and (d) desorbing time upon the U(VI) desorption efficiency for U/ZrO2/CS.
3.4.2. H2SO4 Concentration Influence
The desorbing agent concentration strongly influences the metal ions’ desorption from the loaded sorbent. To remove U(VI) from ZrO2/CS, H2SO4 concentrations ranging from 0.2 to 1.2 M were used in the desorption processes. At 1 g loaded ZrO2/CS and 1:30 S:L phase ratio, the associated parameters were constant for 60 min of desorbing time. Figure 9b displays that the desorption efficiency of U(VI) for ZrO2/CS rose to 85.0 percent by growing the H2SO4 concentration from 0.2 to 0.8 M. To sum up: 0.8 M H2SO4 was deemed appropriate for the ensuing desorption procedure.
3.4.3. S:L Ratio Influence
To remove the U(VI) ions from the loaded-ZrO2/CS, it is critical to determine the smallest possible eluent volume. U/ZrO2/CS desorption of U(VI) was investigated by varying quantities of 0.8 M sulfuric acid from 10 to 70 mL in combination with 1 g of uranium-loaded adsorbent (S:L phase ratio alternating from 1:10 to 1:70), whilst maintaining consistent contact time and temperature of 60 min with 0.8 M H2SO4 (Figure 9c). The desorption efficiency of uranium ions rose by decreasing the S:L phase ratio to a 1:50 ratio; after that, the U(VI) desorption efficiency remained practically constant at 94.0 percent for the ZrO2/CS. U/ZrO2/CS was used in the subsequent trials with a 1:50 S:L ratio.
3.4.4. Desorbing Time Influence
For various desorption times ranging from 10 to 120 min, 1 g of U(VI)-loaded ZrO2/CS was stirred in 50 mL of 0.8 M H2SO4. The observed maximum U(VI) desorption efficiency (98.0 percent) in U/ZrO2/CS after 75 min of contact time is shown in Figure 9d, which shows that the system has reached equilibrium for U/ZrO2/CS. Thus, 75 min was the optimal desorbing time.
3.5. Regeneration and Reused
The reusable uranium-loaded ZrO2/CS has undergone regeneration many times. The ZrO2/CS examined was regenerated using 0.8 M H2SO4 and a 1:50 S:L phase ratio for 75 min at room temperature to reuse and recycle. When the desorption efficiency dropped from 98.0 percent to 82% after seven consecutive series of adsorption–desorption procedures, the ZrO2/CS for uranium recovery showed a good adsorption constancy.
3.6. Sorption Mechanism
U(VI) adsorption mechanism was supported by the results obtained from XRD, SEM, EDX, surface, and FTIR scrutiny before and after U(VI) adsorption. Figure 1 shows the obtained XRD patterns. High-intensity CS peak locations and shapes overlapped with ZrO2 peak positions and shapes. Because of the surface electrostatic interaction of ZrO2 with CS, novel composites were generated. Some novel peaks were found in the XRD pattern of U/ZrO2/CS due to uranium ions adsorption on the investigated adsorbent. Figure 2 expresses the SEM images of ZrO2/CS and U/ZrO2/CS, which reveal that the pores of these composites were filled with U(VI), while the surfaces were uneven and agglomerated with U(VI). The EDX spectra corresponding to the adsorption of uranium ions on ZrO2/CS revealed their presence (Figure 2). The presence of uranium peaks confirmed the adsorbed uranium ions on the ZrO2/CS surfaces. Figure 3 shows that uranium ions adsorption, the surface area, pore size, and pore volume of ZrO2/CS decreased due to pore blocking by uranium ions, as expected. The ZrO2/CS was a strong adsorbent for U(VI) ions. ZrO2/CS pre- and after-U(VI) adsorption FTIR spectra are shown in Figure 4, confirming the appearance of new (O=U=O) peaks at 975 and 740 cm−1. Adsorption of U(VI) on ZrO2/CS relocated the peaks of the investigated adsorbents to redshift by 5–10 cm−1.
U(VI) binding to ZrO2/CS may be mediated by the deprotonation of functional groups, as indicated by the pH-dependent nature of the binding process. For optimal U(VI) concentrations, the pH should be 3.5 (UO22+, dimmer [(UO2)2(OH)2]2+, trimmer [(UO2)3(OH)5]+. Hydroxyl, zirconyl (Zr-OH), -NH, and -NH2 groups were the active sites on ZrO2/CS surfaces that reacted with uranyl ions. Due to electrostatic attraction and complexation systems, the deprotonation of active sites and the production of different uranium hydrolysis products were highly adsorbable. The kinetic results suggested that the 2nd-order kinetic was suited more to U(VI) adsorption. Adsorption was found to be controlled by chemisorption, according to the results. The experimental data from the isotherm study suited the Langmuir model perfectly. The ZrO2/CS surfaces’ active sites had a uniform U(VI) distribution, ensuing in a single layer of adsorption for this element. Besides, thermodynamics documents express that the adsorption progression was exothermic and spontaneous. The active functional groups of ZrO2/CS produced complexes with U(VI) ions from the discussion beyond analysis. U(VI) reactions could be adsorbed onto ZrO2/Cs surfaces, as Figure 10 shows one potential pathway.
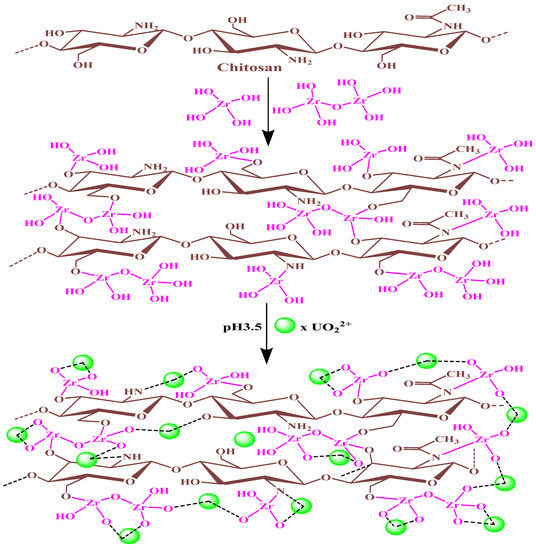
Figure 10.
Depicts the theoretical ZrO2/CS and uranium cation interactions.
3.7. Uranium Separation
The best conditions for leaching, adsorption, desorption, and precipitation of uranium ions from the El Sela ore materials sample were used. At room temperature, 5 kg of the El Sela sample (100–63 µm particle size) was mixed with 20 L of 150 mg/L (1.5 M) H2SO4 and 200 rpm of stirring speed for 4 h leaching time. A typical leaching efficiency of 95.65% was achieved by filtering the gangue to produce a leach liquor with 200 mg/L of uranium ions. The metal ions in the leaching fluid were identified through ICP-OES (Table 6). A masking agent of citric acid can be added to the 20 L leach solution to mask any trace amounts of metal ions (such as Fe). The adsorption was performed on 20 L of leaching liquid containing 200 mg/L U(VI) using 25 g of ZrO2/CS at a pH of 3.5 for a sorbing time of 50 min, and the U(VI) adsorption uptake was 175.0 mg/g. On 25 g of ZrO2/CS, U(VI) was finally trapped (4000 mg U(VI)/25 g ZrO2/CS) from the leaching liquid.
Table 6.
Chemical constituents of El Sela leach liquor.
The desorption of uranium ions from its loaded ZrO2/CS was carried out under these supreme conditions. After the uranium ions were sited onto 25 g ZrO2/CS, 0.8M H2SO4 was used to agitate the mixture for 75 min to desorb the U(VI). There were 3.16 g of uranium ions per liter of aqueous phase U(VI).
After desorption procedures, the uranium ions were precipitated as sodium diuranate using sodium hydroxide. The sodium diuranate (yellowcake) was made from a 1.25 L evaporated to 300 mL. A 25 percent NaOH solution was used to modify the pH to 7, resulting in the precipitous uranium ions as Na2U2O7.6H2O, desiccated at 110 °C. Finally, the result was Na2U2O7, which weighed 5.78 g.
The scanning electron microscope (SEM) and sodium diuranate’s equivalent EDX spectrum were used to examine the sodium diuranate (Figure 11a). In addition, its chemical components were discovered using ICP-OES (Table 7). According to the gathered information, sodium diuranate had a purity level of 94.88 percent. According to Figure 11b, the XRF spectrum showed that sodium diuranate and certainly accompanying metal ions were present in the sample.
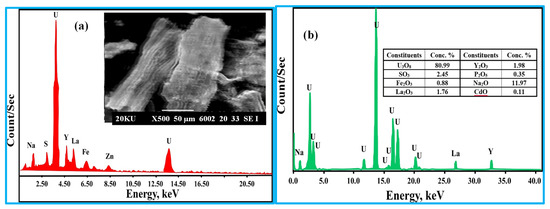
Figure 11.
(a) The scanning electron microscope, EDX, and (b) XRF of sodium diuranate analysis.
Table 7.
Chemical analysis of sodium diuranate.
4. Conclusions
An inorganic/organic sorbent polymer (ZrO2/chitosan) has been developed in the current work for uranium sorption and recovery. It has high adsorption capacity, fast kinetics, strong selectivity, outstanding reusability, and suitability to arrange in batch systems. Zirconium oxychloride and chitosan are polymerized with glutaraldehyde and then combined to form ZrO2/chitosan. The prepared sorbent can increase U(VI) binding to Zr-OH, -NH2, and NH at the ZrO2/CS interface. SEM, EDX, and BET validate the ZrO2/CS composite’s formation. The optimal leaching conditions, including 150 g/L H2SO4, a 1:4 S:L ratio, a 200 rpm stirring speed, a leaching time of four hours, and a particle size of 149–100 µm, were used to produce the El Sela leaching liquid. According to pH3.5, 50 min of the sorbing time and 50 mL of leaching liquid (200 mg/L U(VI)), the U(VI) sorption from the leaching liquid was studied. Uptake capacity was assessed at 175 mg/g. The 2nd-order kinetic model better explained the kinetic data. Using the Langmuir model rather than the Freundlich model is preferable for describing equilibrium sorption data. Thus, the ZrO2/CS adsorbed uranium in a monolayer form. There was also a look at thermodynamic constants as well. Exothermic and spontaneous uranium sorption by ZrO2/CS was shown by the values of ΔG°, ΔH°, and ΔS°. A 0.8 M acid was used to desorb U(VI) for 75 min with excellent efficiency. Seven cycles of ZrO2/CS yielded a slightly decreased performance. For selective U(VI) recovery, ZrO2/CS was distributed over the El Sela leachate. After precipitation as sodium diuranate, a yellow cake was obtained with a purity level of 94.88 percent.
Author Contributions
Methodology, K.A.A.E.-R., S.H.N. and W.M.E.M.; software, M.F.C.; M.N.R. and S.M.A.E.D.; validation, M.A.T., M.F.C. and K.A.A.E.-R.; formal analysis, M.M.A.A., M.O.A.E.-M., M.N.R. and M.F.C.; investigation, S.H.N., W.M.E.M. and S.M.A.E.D.; resources, M.M.A.A., M.N.R. and M.F.C.; data curation, M.O.A.E.-M., M.N.R. and M.F.C.; writing—original draft preparation, W.M.E.M., K.A.A.E.-R., M.N.R. and M.F.C.; writing—review and editing, M.A.T., M.F.C., M.N.R. and S.M.A.E.D.; visualization, S.H.N., M.N.R. and M.M.A.A.; supervision, M.O.A.E.-M., M.A.T. and M.F.C.; project administration, S.H.N., K.A.A.E.-R., M.N.R. and M.F.C. All authors have read and agreed to the published version of the manuscript.
Funding
This research received no external funding.
Institutional Review Board Statement
Not applicable.
Informed Consent Statement
Not applicable.
Data Availability Statement
Not applicable.
Acknowledgments
The authors express their gratitude to Nuclear Materials Authority for support of this research.
Conflicts of Interest
The authors declare no conflict of interest.
References
- Su, Y.; Wenzel, M.; Paasch, S.; Seifert, M.; Doert, T.; Brunner, E.; Weigand, J.J. One-pot synthesis of brewer’s spent grain-supported superabsorbent polymer for highly efficient uranium adsorption from wastewater. Environ. Res. 2022, 212, 113333. [Google Scholar] [CrossRef]
- Xie, Y.; Chen, C.; Ren, X.; Wang, X.; Wang, H.; Wang, X. Emerging natural and tailored materials for uranium-contaminated water treatment and environmental remediation. Prog. Mater. Sci. 2019, 103, 180–234. [Google Scholar] [CrossRef]
- Cheira, M.F.; Mira, H.I.; Sakr, A.K.; Mohamed, S.A. Adsorption of U (VI) from acid solution on a low-cost sorbent: Equilibrium, kinetic, and thermodynamic assessments. Nucl. Sci. Tech. 2019, 30, 156. [Google Scholar] [CrossRef]
- Zidan, I.H.; Cheira, M.F.; Bakry, A.R.; Atia, B.M. Potentiality of uranium recovery from G. Gattar leach liquor using Duolite ES-467 chelating resin: Kinetic, thermodynamic and isotherm features. Int. J. Environ. Anal. Chem. 2022, 102, 2102–2124. [Google Scholar] [CrossRef]
- Ibrahim, M.E.; Zalata, A.A.; Assaf, H.S.; Hassan, I.; Rashed, M.A. EL Sella shear zone, southeastern desert, Egypt an example of vein-type uranium deposit. In Proceedings of the 9th MPM Conference, Faculty of Engineering, Cairo University, Egypt, the 9th International Mining, Petroleum, and Metalargical Engineering Conference, Faculty of Engineering, Cairo University, Giza, Egypt, 21–24 February 2005; pp. 1–17. [Google Scholar]
- Shahin, H.A.A.; Emad, B.M.; Masoud, M.S. Uranium and rare metal mineralization in the El Sela and Qash Amir granitic intrusions, south Eastern Desert, Egypt. J. Asian Earth Sci. X 2021, 6, 100066. [Google Scholar] [CrossRef]
- Heikal, M.T.S.; Khedr, M.Z.; Abd El Monsef, M.; Gomaa, S.R. Petrogenesis and geodynamic evolution of Neoproterozoic Abu Dabbab Albite Granite, Central Eastern Desert of Egypt: Petrological and geochemical constraints. J. Afr. Earth Sci. 2019, 158, 103518. [Google Scholar] [CrossRef]
- Cheira, M.F. Characteristics of uranium recovery from phosphoric acid by an aminophosphonic resin and application to wet process phosphoric acid. Eur. J. Chem. 2015, 6, 48–56. [Google Scholar] [CrossRef]
- Gupta, C.; Mukherjee, T. Hydrometallurgy in Extraction Processes, 1st ed.; CRC Press: Boca Raton, FL, USA, 2019; p. 280. [Google Scholar]
- Khawassek, Y.M.; Taha, M.H. Kinetics of leaching process of sella uranium ore material, south eastern desert, Egypt. Nucl. Sci. Sci. J. 2013, 2, 175–182. [Google Scholar] [CrossRef]
- Khawassek, Y.; Taha, M.; Eliwa, A.A. Kinetics of leaching process using sulfuric acid for sella uranium ore material, south eastern desert, Egypt. Int. J. Nucl. Energy Sci. Eng. 2016, 6, 62. [Google Scholar] [CrossRef]
- Khawassek, Y.M.; Masoud, A.M.; Taha, M.H.; Hussein, A.E.M. Kinetics and thermodynamics of uranium ion adsorption from waste solution using Amberjet 1200 H as cation exchanger. J. Radioanal. Nucl. Chem. 2018, 315, 493–502. [Google Scholar] [CrossRef]
- Atia, B.M.; Gado, M.A.; Cheira, M.F. Kinetics of uranium and iron dissolution by sulfuric acid from Abu Zeneima ferruginous siltstone, Southwestern Sinai, Egypt. Euro Mediterr. J. Environ. Integr. 2018, 3, 39. [Google Scholar] [CrossRef]
- Sakr, A.; Mohamed, S.; Mira, H.; Cheira, M. Successive leaching of uranium and rare earth elements from El Sela mineralization. J. Sci. Eng. Res. 2018, 5, 95–111. [Google Scholar]
- Reiller, P.E.; Marang, L.; Jouvin, D.; Benedetti, M.F. Uranium (VI) binding to humic substances: Speciation, estimation of competition, and application to independent data. In The New Uranium Mining Boom; Springer: Berlin/Heidelberg, Germany, 2011; pp. 565–572. [Google Scholar]
- Cheira, M.F. Solvent extraction of uranium and vanadium from carbonate leach solutions of ferruginous siltstone using cetylpyridinium carbonate in kerosene. Chem. Pap. 2020, 74, 2247–2266. [Google Scholar] [CrossRef]
- Gajda, D.; Kiegiel, K.; Zakrzewska-Koltuniewicz, G.; Chajduk, E.; Bartosiewicz, I.; Wolkowicz, S. Mineralogy and uranium leaching of ores from Triassic Peribaltic sandstones. J. Radioanal. Nucl. Chem. 2015, 303, 521–529. [Google Scholar] [CrossRef] [PubMed]
- El-Nadi, Y.A.; Daoud, J.A.; Aly, H.F. Modified leaching and extraction of uranium from hydrous oxide cake of Egyptian monazite. Int. J. Miner. Process. 2005, 76, 101–110. [Google Scholar] [CrossRef]
- Moldoveanu, S.; David, V. Chapter 7—Solid-phase extraction. In Modern Sample Preparation for Chromatography, 2nd ed.; Moldoveanu, S., David, V., Eds.; Elsevier: Amsterdam, The Netherlands, 2021; pp. 281–421. [Google Scholar]
- Moghimi, A.; Yari, M. Review of procedures involving separation and Solid Phase Extraction for the determination of cadmium using spectrometric techniques. J. Chem. Rev. 2019, 1, 1–18. [Google Scholar] [CrossRef]
- Hagarová, I. Magnetic solid phase extraction as a promising technique for fast separation of metallic nanoparticles and their ionic species: A review of recent advances. J. Anal. Methods Chem. 2020, 2020, 8847565. [Google Scholar] [CrossRef] [PubMed]
- Cheira, M.F.; El-Didamony, A.M.; Mahmoud, K.F.; Atia, B.M. Equilibrium and kinetic characteristics of uranium recovery by the strong base Ambersep 920U Cl resin. IOSR J. Appl. Chem. 2014, 7, 32–40. [Google Scholar] [CrossRef]
- Diehl, D.M. Extraction|Sorptive Extraction Methods. In Encyclopedia of Separation Science; Wilson, I.D., Ed.; Academic Press: Oxford, UK, 2007; pp. 1–7. [Google Scholar]
- Gao, L.; Wei, Y. Fabrication of a novel hydrophobic/ion-exchange mixed-mode adsorbent for the dispersive solid-phase extraction of chlorophenols from environmental water samples. J. Sep. Sci. 2016, 39, 3186–3194. [Google Scholar] [CrossRef]
- Tavakkoli, N.; Habibollahi, S.; Tehrani, S.A. Modified activated carbon as solid phase extraction adsorbent for the preconcentration and determination of trace as (III) in environmental samples by graphite furnace atomic absorption spectrometry. Chin. J. Chem. 2012, 30, 665–669. [Google Scholar] [CrossRef]
- Mavumengwana-Khanyile, B.; Katima, Z.; Songa, E.A.; Okonkwo, J.O. Recent advances in sorbents applications and techniques used for solid-phase extraction of atrazine and its metabolites deisopropylatrazine and deethylatrazine: A review. Int. J. Environ. Anal. Chem. 2019, 99, 1017–1068. [Google Scholar] [CrossRef]
- El-Magied, M.O.A. Sorption of uranium ions from their aqueous solution by resins containing nanomagnetite particles. J. Eng. 2016, 2016, 7214348. [Google Scholar] [CrossRef]
- Zhang, W.; Dong, X.; Mu, Y.; Wang, Y.; Chen, J. Constructing adjacent phosphine oxide ligands confined in mesoporous Zr-MOFs for uranium capture from acidic medium. J. Mater. Chem. A 2021, 9, 16685–16691. [Google Scholar] [CrossRef]
- Xiao, S.; Li, M.; Cong, H.; Wang, L.; Li, X.; Zhang, W. Preparation of highly porous thiophene-containing DUT-68 beads for adsorption of CO2 and iodine vapor. Polymers 2021, 13, 4075. [Google Scholar] [CrossRef]
- Chwastowski, J.; Staroń, P. Influence of Saccharomyces cerevisiae yeast cells immobilized on Cocos nucifera fibers for the adsorption of Pb (II) ions. Coll. Surf. A Physicochem. Eng. Asp. 2022, 632, 127735. [Google Scholar] [CrossRef]
- Alhindawy, I.G.; Elshehy, E.A.; El-Khouly, M.E.; Abdel-Monem, Y.K.; Atrees, M.S. Fabrication of mesoporous NaZrP cation-exchanger for U (VI) ions separation from uranyl leach liquors. Coll. Interfaces 2019, 3, 61. [Google Scholar] [CrossRef]
- Ali, A.H. Potentiality of zirconium phosphate synthesized from zircon mineral for uptaking uranium. Sep. Sci. Technol. 2018, 53, 2284–2296. [Google Scholar] [CrossRef]
- Dakroury, G.A.; Ali, S.M.; Hassan, H.S. Assessment of adsorption performance of chitosan/ZrO2 biosorbent composite towards Cs (I) and Co (II) metal ions from aqueous solution. J. Polym. Res. 2021, 28, 385. [Google Scholar] [CrossRef]
- Rahman, N.; Varshney, P.; Nasir, M. Synthesis and characterization of polydopamine/hydrous zirconium oxide composite and its efficiency for the removal of uranium (VI) from water. Environ. Nanotechnol. Monit. Manag. 2021, 15, 100458. [Google Scholar] [CrossRef]
- Lomenech, C.; Drot, R.; Simoni, E. Speciation of uranium (VI) at the solid/solution interface: Sorption modeling on zirconium silicate and zirconium oxide. Radiochim. Acta 2003, 91, 453–462. [Google Scholar] [CrossRef]
- Xinmei, L.; Gaoqing, L.; Zifeng, Y. Preliminary synthesis and characterization of mesoporous nanocrystalline zirconia. J. Energy Chem. 2003, 12, 161–166. [Google Scholar]
- Rezaei, M.; Alavi, S.M.; Sahebdelfar, S.; Xinmei, L.; Yan, Z.-F. Synthesis of mesoporous nanocrystalline zirconia with tetragonal crystallite phase by using ethylene diamine as precipitation agent. J. Mater. Sci. 2007, 42, 7086–7092. [Google Scholar] [CrossRef]
- Zhang, L.; Liu, X.; Xia, W.; Zhang, W. Preparation and characterization of chitosan-zirconium (IV) composite for adsorption of vanadium (V). Int. J. Biol. Macromol. 2014, 64, 155–161. [Google Scholar] [CrossRef] [PubMed]
- Cho, D.-W.; Jeon, B.-H.; Jeong, Y.; Nam, I.-H.; Choi, U.-K.; Kumar, R.; Song, H. Synthesis of hydrous zirconium oxide-impregnated chitosan beads and their application for removal of fluoride and lead. Appl. Surf. Sci. 2016, 372, 13–19. [Google Scholar] [CrossRef]
- Zhang, F.; Liu, Y.; Ma, K.-Q.; Yan, H.; Luo, Y.; Wu, F.-C.; Yang, C.-T.; Hu, S.; Peng, S.-M. Highly selective extraction of uranium from wastewater using amine-bridged diacetamide-functionalized silica. J. Hazard. Mater. 2022, 435, 129022. [Google Scholar] [CrossRef]
- Chen, Q.; Xue, X.; Liu, Y.; Guo, A.; Chen, K.; Yin, J.; Yu, F.; Zhu, H.; Guo, X. Shear-induced fabrication of SiO2 nano-meshes for efficient uranium capture. J. Hazard. Mater. 2022, 438, 129524. [Google Scholar] [CrossRef]
- Chen, Y.; Zhang, P.; Jiao, L.; Chen, G.; Yang, Y.; Chong, H.; Lin, M. High efficient and selective removal of U (VI) from lanthanides by phenanthroline diamide functionalized carbon doped boron nitride. Chem. Eng. J. 2022, 446, 137337. [Google Scholar] [CrossRef]
- Guo, G.-Y.; Chen, Y.-L.; Ying, W.-J. Thermal, spectroscopic and X-ray diffractional analyses of zirconium hydroxides precipitated at low pH values. Mater. Chem. Phys. 2004, 84, 308–314. [Google Scholar] [CrossRef]
- Wang, F.; Liao, Q.; Chen, K.; Pan, S.; Lu, M. The crystallization and FTIR spectra of ZrO2-doped 36Fe2O3-10B2O3-54P2O5 glasses and crystalline compounds. J. Alloy. Compd. 2014, 611, 278–283. [Google Scholar] [CrossRef]
- Han, J.-P.; Zhang, B.; Bai, X.; Wang, L.-Y.; Qi, Y.-X.; Lun, N.; Bai, Y.-J. Li4Ti5O12 composited with Li2ZrO3 revealing simultaneously meliorated ionic and electronic conductivities as high performance anode materials for Li-ion batteries. J. Power Sour. 2017, 354, 16–25. [Google Scholar] [CrossRef]
- Madhi, A.; Hadavand, B.S.; Amoozadeh, A. UV-curable urethane acrylate zirconium oxide nanocomposites: Synthesis, study on viscoelastic properties and thermal behavior. J. Compos. Mater. 2018, 52, 2973–2982. [Google Scholar] [CrossRef]
- Horti, N.C.; Kamatagi, M.; Sanna Kotrappanavar, N.; Wari, M.N.; Inamdar, S. Structural and optical properties of zirconium oxide (ZrO2) nanoparticles: Effect of calcination temperature. Nano Express 2020, 1, 10022. [Google Scholar] [CrossRef]
- Fang, D.; Luo, Z.; Liu, S.; Zeng, T.; Liu, L.; Xu, J.; Bai, Z.; Xu, W. Photoluminescence properties and photocatalytic activities of zirconia nanotube arrays fabricated by anodization. Opt. Mater. 2013, 35, 1461–1466. [Google Scholar] [CrossRef]
- Venugopal, N.; Mitra, A. Optical transparency of ZnO thin film using localized surface plasmons of Ag nanoislands. Opt. Mater. 2013, 35, 1467–1476. [Google Scholar] [CrossRef]
- Kumar, S.; Bhunia, S.; Ojha, A.K. Effect of calcination temperature on phase transformation, structural and optical properties of sol-gel derived ZrO2 nanostructures. Phys. E Low Dimens. Syst. Nanostruct. 2015, 66, 74–80. [Google Scholar] [CrossRef]
- Vidya, Y.S.; Anantharaju, K.S.; Nagabhushana, H.; Sharma, S.C.; Nagaswarupa, H.P.; Prashantha, S.C.; Shivakumara, C.; Danithkumar. Combustion synthesized tetragonal ZrO2: Eu3+ nanophosphors: Structural and photoluminescence studies. Spectrochim. Acta Part A Mol. Biomol. Spectrosc. 2015, 135, 241–251. [Google Scholar] [CrossRef]
- Rashad, M.M.; Baioumy, H.M. Effect of thermal treatment on the crystal structure and morphology of zirconia nanopowders produced by three different routes. J. Mater. Process. Technol. 2008, 195, 178–185. [Google Scholar] [CrossRef]
- Liu, L.; Yang, W.; Gu, D.; Zhao, X.; Pan, Q. In situ preparation of chitosan/ZIF-8 composite beads for highly efficient removal of U (VI). Front. Chem. 2019, 7, 607. [Google Scholar] [CrossRef]
- Jeon, C.; Höll, W.H. Chemical modification of chitosan and equilibrium study for mercury ion removal. Water Res. 2003, 37, 4770–4780. [Google Scholar] [CrossRef]
- Zhang, L.; Zeng, Y.; Cheng, Z. Removal of heavy metal ions using chitosan and modified chitosan: A review. J. Mol. Liq. 2016, 214, 175–191. [Google Scholar] [CrossRef]
- Shukla, S.K.; Mishra, A.K.; Arotiba, O.A.; Mamba, B.B. Chitosan-based nanomaterials: A state-of-the-art review. Int. J. Biol. Macromol. 2013, 59, 46–58. [Google Scholar] [CrossRef] [PubMed]
- Reddy, D.H.K.; Lee, S.-M. Application of magnetic chitosan composites for the removal of toxic metal and dyes from aqueous solutions. Adv. Coll. Interface Sci. 2013, 201–202, 68–93. [Google Scholar] [CrossRef] [PubMed]
- Ahmad, M.; Manzoor, K.; Ikram, S. Versatile nature of hetero-chitosan based derivatives as biodegradable adsorbent for heavy metal ions: A review. Int. J. Biol. Macromol. 2017, 105, 190–203. [Google Scholar] [CrossRef] [PubMed]
- Monier, M.; Elsayed, N.H. Selective extraction of uranyl ions using ion-imprinted chelating microspheres. J. Coll. Interface Sci. 2014, 423, 113–122. [Google Scholar] [CrossRef] [PubMed]
- Sun, Z.; Chen, D.; Chen, B.; Kong, L.; Su, M. Enhanced uranium (VI) adsorption by chitosan modified phosphate rock. Coll. Surf. A Physicochem. Eng. Asp. 2018, 547, 141–147. [Google Scholar] [CrossRef]
- Sureshkumar, M.K.; Das, D.; Mallia, M.B.; Gupta, P.C. Adsorption of uranium from aqueous solution using chitosan-tripolyphosphate (CTPP) beads. J. Hazard. Mater. 2010, 184, 65–72. [Google Scholar] [CrossRef]
- Cheira, M.F. Synthesis of pyridylazo resorcinol—functionalized Amberlite XAD-16 and its characteristics for uranium recovery. J. Environ. Chem. Eng. 2015, 3, 642–652. [Google Scholar] [CrossRef]
- Atia, B.M.; Khawassek, Y.M.; Hussein, G.M.; Gado, M.A.; El-Sheify, M.A.; Cheira, M.F. One-pot synthesis of pyridine dicarboxamide derivative and its application for uranium separation from acidic medium. J. Environ. Chem. Eng. 2021, 9, 105726. [Google Scholar] [CrossRef]
- Gaafar, I.; Ghazala, H.; Ibrahim, T.; Ammar, S. Gamma ray spectrometry studies for a promising vein type uranium mineralization, south eastern desert, Egypt. In Proceedings of the 4th International Symposium on Geophysics, Tanta, Egypt, November 2006; pp. 445–456. [Google Scholar]
- Ramadan, T.M.; Ibrahim, T.M.; Said, A.D.; Baiumi, M. Application of remote sensing in exploration for uranium mineralization in Gabal El Sela area, South Eastern Desert, Egypt. Egypt. J. Remote Sens. Space Sci. 2013, 16, 199–210. [Google Scholar] [CrossRef]
- Ali, K.G. Structural control of El Sela granites and associated uranium deposits, Southern Eastern Desert, Egypt. Arab. J. Geosci. 2013, 6, 1753–1767. [Google Scholar] [CrossRef]
- Deer, W.A.F.; Howie, R.A.; Zussman, J. An Introduction to the Rock-Forming Minerals; Mineralogical Society of Great Britain and Ireland: McLean, VA, USA, 2013; p. 498. [Google Scholar] [CrossRef]
- Hassanin, M.A.; El-Gendy, H.S.; Cheira, M.F.; Atia, B.M. Uranium ions extraction from the waste solution by thiosemicarbazide anchored cellulose acetate. Int. J. Environ. Anal. Chem. 2021, 101, 351–369. [Google Scholar] [CrossRef]
- Wang, J.; He, B.; Wei, X.; Li, P.; Liang, J.; Qiang, S.; Fan, Q.; Wu, W. Sorption of uranyl ions on TiO2: Effects of pH, contact time, ionic strength, temperature and HA. J. Environ. Sci. 2019, 75, 115–123. [Google Scholar] [CrossRef] [PubMed]
- Thapa, R.; Rahmani, A.; Turhanen, P.; Taskinen, A.; Nissinen, T.; Neitola, R.; Vepsäläinen, J.; Lehto, V.-P.; Riikonen, J. Recovery of uranium with bisphosphonate modified mesoporous silicon. Sep. Purif. Technol. 2021, 272, 118913. [Google Scholar] [CrossRef]
- Cheira, M.F.; Rashed, M.N.; Mohamed, A.E.; Zidan, I.H.; Awadallah, M.A. The performance of Alizarin impregnated bentonite for the displacement of some heavy metals ions from the wet phosphoric acid. Sep. Sci. Technol. 2020, 55, 3072–3088. [Google Scholar] [CrossRef]
- Kong, L.; Ruan, Y.; Zheng, Q.; Su, M.; Diao, Z.; Chen, D.; Hou, L.A.; Chang, X.; Shih, K. Uranium extraction using hydroxyapatite recovered from phosphorus containing wastewater. J. Hazard. Mater. 2020, 382, 120784. [Google Scholar] [CrossRef]
- Li, J.; Zhang, L.; Peng, J.; Hu, J.; Yang, L.; Ma, A.; Xia, H.; Guo, W.; Yu, X. Removal of uranium from uranium plant wastewater using zero-valent iron in an ultrasonic field. Nucl. Eng. Technol. 2016, 48, 744–750. [Google Scholar] [CrossRef]
- Cheira, M.F. Performance of poly sulfonamide/nano-silica composite for adsorption of thorium ions from sulfate solution. SN Appl. Sci. 2020, 2, 398. [Google Scholar] [CrossRef]
- Ibrahium, H.A.; Abdel Aal, M.M.; Awwad, N.S.; Atia, B.M.; Ali, H.E.; Gado, M.A.; Hakami, R.A.; Cheira, M.F. Solid–liquid separation of V (V) from aqueous medium by 3-(2-hydroxy phenyl)-imino-1-phenyl butan-1-one Schiff base immobilized XAD-2 resin. Int. J. Environ. Sci. Technol. 2022. [Google Scholar] [CrossRef]
- Zhang, S.; Shu, X.; Zhou, Y.; Huang, L.; Hua, D. Highly efficient removal of uranium (VI) from aqueous solutions using poly (acrylic acid)-functionalized microspheres. Chem. Eng. J. 2014, 253, 55–62. [Google Scholar] [CrossRef]
- Gomaa, H.; Shenashen, M.A.; Elbaz, A.; Kawada, S.; El-Nasr, T.A.S.; Cheira, M.F.; Eid, A.I.; El-Safty, S.A. Inorganic-organic mesoporous hybrid segregators for selective and sensitive extraction of precious elements from urban mining. J. Coll. Interface Sci. 2021, 604, 61–79. [Google Scholar] [CrossRef]
- Yuan, D.; Chen, L.; Xiong, X.; Yuan, L.; Liao, S.; Wang, Y. Removal of uranium (VI) from aqueous solution by amidoxime functionalized superparamagnetic polymer microspheres prepared by a controlled radical polymerization in the presence of DPE. Chem. Eng. J. 2016, 285, 358–367. [Google Scholar] [CrossRef]
- Tan, L.; Wang, J.; Liu, Q.; Sun, Y.; Zhang, H.; Wang, Y.; Jing, X.; Liu, J.; Song, D. Facile preparation of oxine functionalized magnetic Fe3O4 particles for enhanced uranium (VI) adsorption. Coll. Surf. A Physicochem. Eng. Asp. 2015, 466, 85–91. [Google Scholar] [CrossRef]
- Wang, Y.; Gu, Z.; Yang, J.; Liao, J.; Yang, Y.; Liu, N.; Tang, J. Amidoxime-grafted multiwalled carbon nanotubes by plasma techniques for efficient removal of uranium (VI). Appl. Surf. Sci. 2014, 320, 10–20. [Google Scholar] [CrossRef]
- Allam, E.M.; Lashen, T.A.; El-Enein, S.A.A.; Hassanin, M.A.; Sakr, A.K.; Cheira, M.F.; Almuqrin, A.; Hanfi, M.Y.; Sayyed, M.I. Rare earth group separation after extraction using sodium diethyldithiocarbamate/polyvinyl chloride from lamprophyre dykes leachate. Materials 2022, 15, 1211. [Google Scholar] [CrossRef] [PubMed]
- Das, S.; Brown, S.; Mayes, R.T.; Janke, C.J.; Tsouris, C.; Kuo, L.J.; Gill, G.; Dai, S. Novel poly (imide dioxime) sorbents: Development and testing for enhanced extraction of uranium from natural seawater. Chem. Eng. J. 2016, 298, 125–135. [Google Scholar] [CrossRef]
- Sakr, A.K.; Cheira, M.F.; Hassanin, M.A.; Mira, H.I.; Mohamed, S.A.; Khandaker, M.U.; Osman, H.; Eed, E.M.; Sayyed, M.I.; Hanfi, M.Y. Adsorption of Yttrium Ions on 3-Amino-5-Hydroxypyrazole Impregnated Bleaching Clay, a Novel Sorbent Material. Appl. Sci. 2021, 11, 10320. [Google Scholar] [CrossRef]
- Mahalakshmi, R.; Kirupha, S.; Rathina, K.; Ravikumar, L. Removal and recovery of thorium from aqueous solution using new polyurethane bearing azomethine and urethane chelators: Kinetics, thermodynamics, and isotherm analysis. Desalination Water Treat. 2018, 121, 92–103. [Google Scholar] [CrossRef]
- Heshmati, H.; Torab-Mostaedi, M.; Gilani, H.G.; Heydari, A. Kinetic, isotherm, and thermodynamic investigations of uranium (VI) adsorption on synthesized ion-exchange chelating resin and prediction with an artificial neural network. Desalination Water Treat. 2015, 55, 1076–1087. [Google Scholar] [CrossRef]
- Pahan, S.; Panja, S.; Banerjee, D.; Dhami, P.; Yadav, J.; Kaushik, C. Preparation of chitosan functionalized polyamidoamine for the separation of trivalent lanthanides from acidic waste solution. Radiochim. Acta 2019, 107, 415–422. [Google Scholar] [CrossRef]
- Allam, E.M.; Lashen, T.A.; El-Enein, S.A.A.; Hassanin, M.A.; Sakr, A.K.; Hanfi, M.Y.; Sayyed, M.I.; Al-Otaibi, J.S.; Cheira, M.F. Cetylpyridinium Bromide/Polyvinyl Chloride for Substantially Efficient Capture of Rare Earth Elements from Chloride Solution. Polymers 2022, 14, 954. [Google Scholar] [CrossRef]
- Gomaa, H.; Hussein, M.A.T.; Motawea, M.M.; Aboraia, A.M.; Cheira, M.F.; Alotaibi, M.T.; El-Bahy, S.M.; Ali, H.M. A hybrid mesoporous CuO@barley straw-derived SiO2 nanocomposite for adsorption and photocatalytic degradation of methylene blue from real wastewater. Coll. Surf. A Physicochem. Eng. Asp. 2022, 644, 128811. [Google Scholar] [CrossRef]


Publisher’s Note: MDPI stays neutral with regard to jurisdictional claims in published maps and institutional affiliations. |
© 2022 by the authors. Licensee MDPI, Basel, Switzerland. This article is an open access article distributed under the terms and conditions of the Creative Commons Attribution (CC BY) license (https://creativecommons.org/licenses/by/4.0/).