Article

Effects of Ecological Restoration on the Distribution of Soil Particles and Organic Carbon in Alpine Regions

1
School of Geographical Sciences, Qinghai Normal University, Xining 810008, China
2
Qinghai Provincial Key Lab of Physical Geography and Environment Process, Xining 810008, China
3
Key Lab of Ministry of Education of Earth Surface Process and Ecosystem Conservation in Qinghai-Tibet Plateau, Xining 810008, China
4
Academy of Plateau Science and Sustainability (APSS), People’s Government of Qinghai Province & Beijing Normal University, Xining 810008, China
*
Author to whom correspondence should be addressed.
Separations 2022, 9(10), 279; https://doi.org/10.3390/separations9100279
Submission received: 6 September 2022 / Revised: 20 September 2022 / Accepted: 29 September 2022 / Published: 1 October 2022
(This article belongs to the Section Environmental Separations)

Abstract

:
This study discusses the impact of two different ecological restoration approaches on the distribution of soil particle size and organic carbon, expecting to provide references for research on the effects of ecological restoration on the soil carbon pool in alpine regions. By replacing the method of time sampling with spatial sampling, grasslands enclosed only in the growing season and woodlands enclosed all year round were respectively selected as the research objects. Through centrifugation, the soil samples were classified by grain size into sand (50–2000 μm), silt (2–50 μm), and clay (<2 μm) to analyze the distribution of organic carbon in soil particles of different sizes. The major findings were as follows. First, sand accounted for the largest proportion of all the soil components in the grasslands and woodlands that had been restored for different years, followed by silt and clay. Second, most of the organic carbon in the grasslands and woodlands was from sand and silt. As the restoration years increased, the proportion of organic carbon in clay grew in fluctuation. In short, both ecological restoration approaches have improved the soil structure and raised the content of soil organic carbon (SOC). Specifically, the restoration scheme of the woodlands exerted a more significant influence on the soil components and the distribution of organic carbon than that of the grasslands.

1. Introduction

Soil carbon pools are the largest in terrestrial ecosystems and play a crucial role in C recycling [1,2]. Studies revealed that the terrestrial ecosystem can serve as both a carbon source and carbon sink, dependent on changes in the soil carbon pool [3]. In the long term, soil carbon pools are primarily affected by climate, geology, and soil formation; in the short term, they are mainly subjected to the disturbance and succession of vegetation and land utilization type [4]. However, domestic studies on the influence of varied ecological restoration approaches on the soil carbon pool mostly focus on the Loess Plateau [5,6,7] and seldom on the Qilian Mountain in the climate-sensitive zone.
The carbon sink effect resulting from ecological restoration measures has been widely recognized [8,9,10,11]. Reasonable ecological restoration measures can significantly increase the rate of carbon sequestration in soil [12,13], but the change in its total rate is difficult to reveal the response mechanism of the soil carbon pool to ecological restoration measures, as the soil carbon pool consists of components with diverse functions [14], and soil particles with varied particle sizes have different capacities for storing carbon and nitrogen and different responses to environmental changes [15,16,17]. Therefore, in recent years, the study of soil carbon pool dynamics via the organic carbon in soil particles of different sizes has attracted much attention [18,19,20,21].
The Qilian Mountain, located southeast of the Qinghai-Tibet Plateau, is a crucial ecological functional zone in the Northwest, featuring the highest density of organic carbon in the Qinghai-Tibet Plateau [22,23]. In recent years, multiple ecological restoration projects have been launched in the zone. Currently, the Qilian Mountain is shifting from ecological management to ecological restoration [24]. Although there have been a large number of research on the characteristics of soil carbon pool in the Qilian Mountains, most of them focus on the empirical and simulation studies on the carbon pool size of different vegetation types [18,25,26,27,28,29]. By contrast, research on the effects of different ecological restoration methods on soil carbon pool remain few, thus, the effects are still unclear.
Therefore, this paper selected two types of restored lands on the southern slope of the Qilian Mountain as its research objects and utilized centrifugation to classify the soil into soil particles with different sizes to analyze the influence of the two restoration approaches on soil components and the content and distribution of organic carbon in these particles. The paper aims to offer references to the study on the influence of different ecological restoration approaches on the organic carbon pool in the alpine region.

2. Materials and Methods

2.1. Selection of Sample Plots

The research area is located in the middle hinterland on the southern slope of the Qilian Mountain, with the geographic coordinates of 98°08′13″–102°38′16″ E, 37°03′17″–39°05′56″ N. The region is mainly mountain terrain with a big relative height difference and an alpine sub-humid continental climate. The average annual temperature is −5.9 °C, and the highest and lowest temperatures in a year are 30.5 °C and −37.1 °C, respectively. The research was carried out in the Sanshe Collective Rangeland, Wariga Village, Mole Town, Qilian County, in August 2020, and grasslands that were restored for 4a, 5a, 6a, 7a, 8a, and 9a years were selected as the experimental plots (Figure 1a). Before restoration, the experimental plots were black soil land—secondary barren formed by the extreme degradation of alpine grasslands. The soil type was alpine meadow soil. Since 2012, manual restoration measures have been adopted, such as plowing, sowing (Poa pratensis cv. Qinghai), harrowing, and leveling. The plowing depth is approximately 20 cm. Manual intervention in the first three years covered insect and rodent control and fence protection. Grazing in the experimental plots is allowed around January each year and prohibited during the growing season. The restored woodlands are located on the northern slope of the Niuxin Mountain, Babao Town, and Qilian County. The woodlands that were restored for 5a, 8a, 15a, and 20a years, years, respectively, were selected. Prior (Picea carassifolia) to the restoration, they were grasslands in severe degeneration due to overgrazing. Spruces have been planted at the density of 2600 per hectare for restoration, and the area has been closed all year round to facilitate afforestation.

2.2. Sample Collection and Indicator Measurement

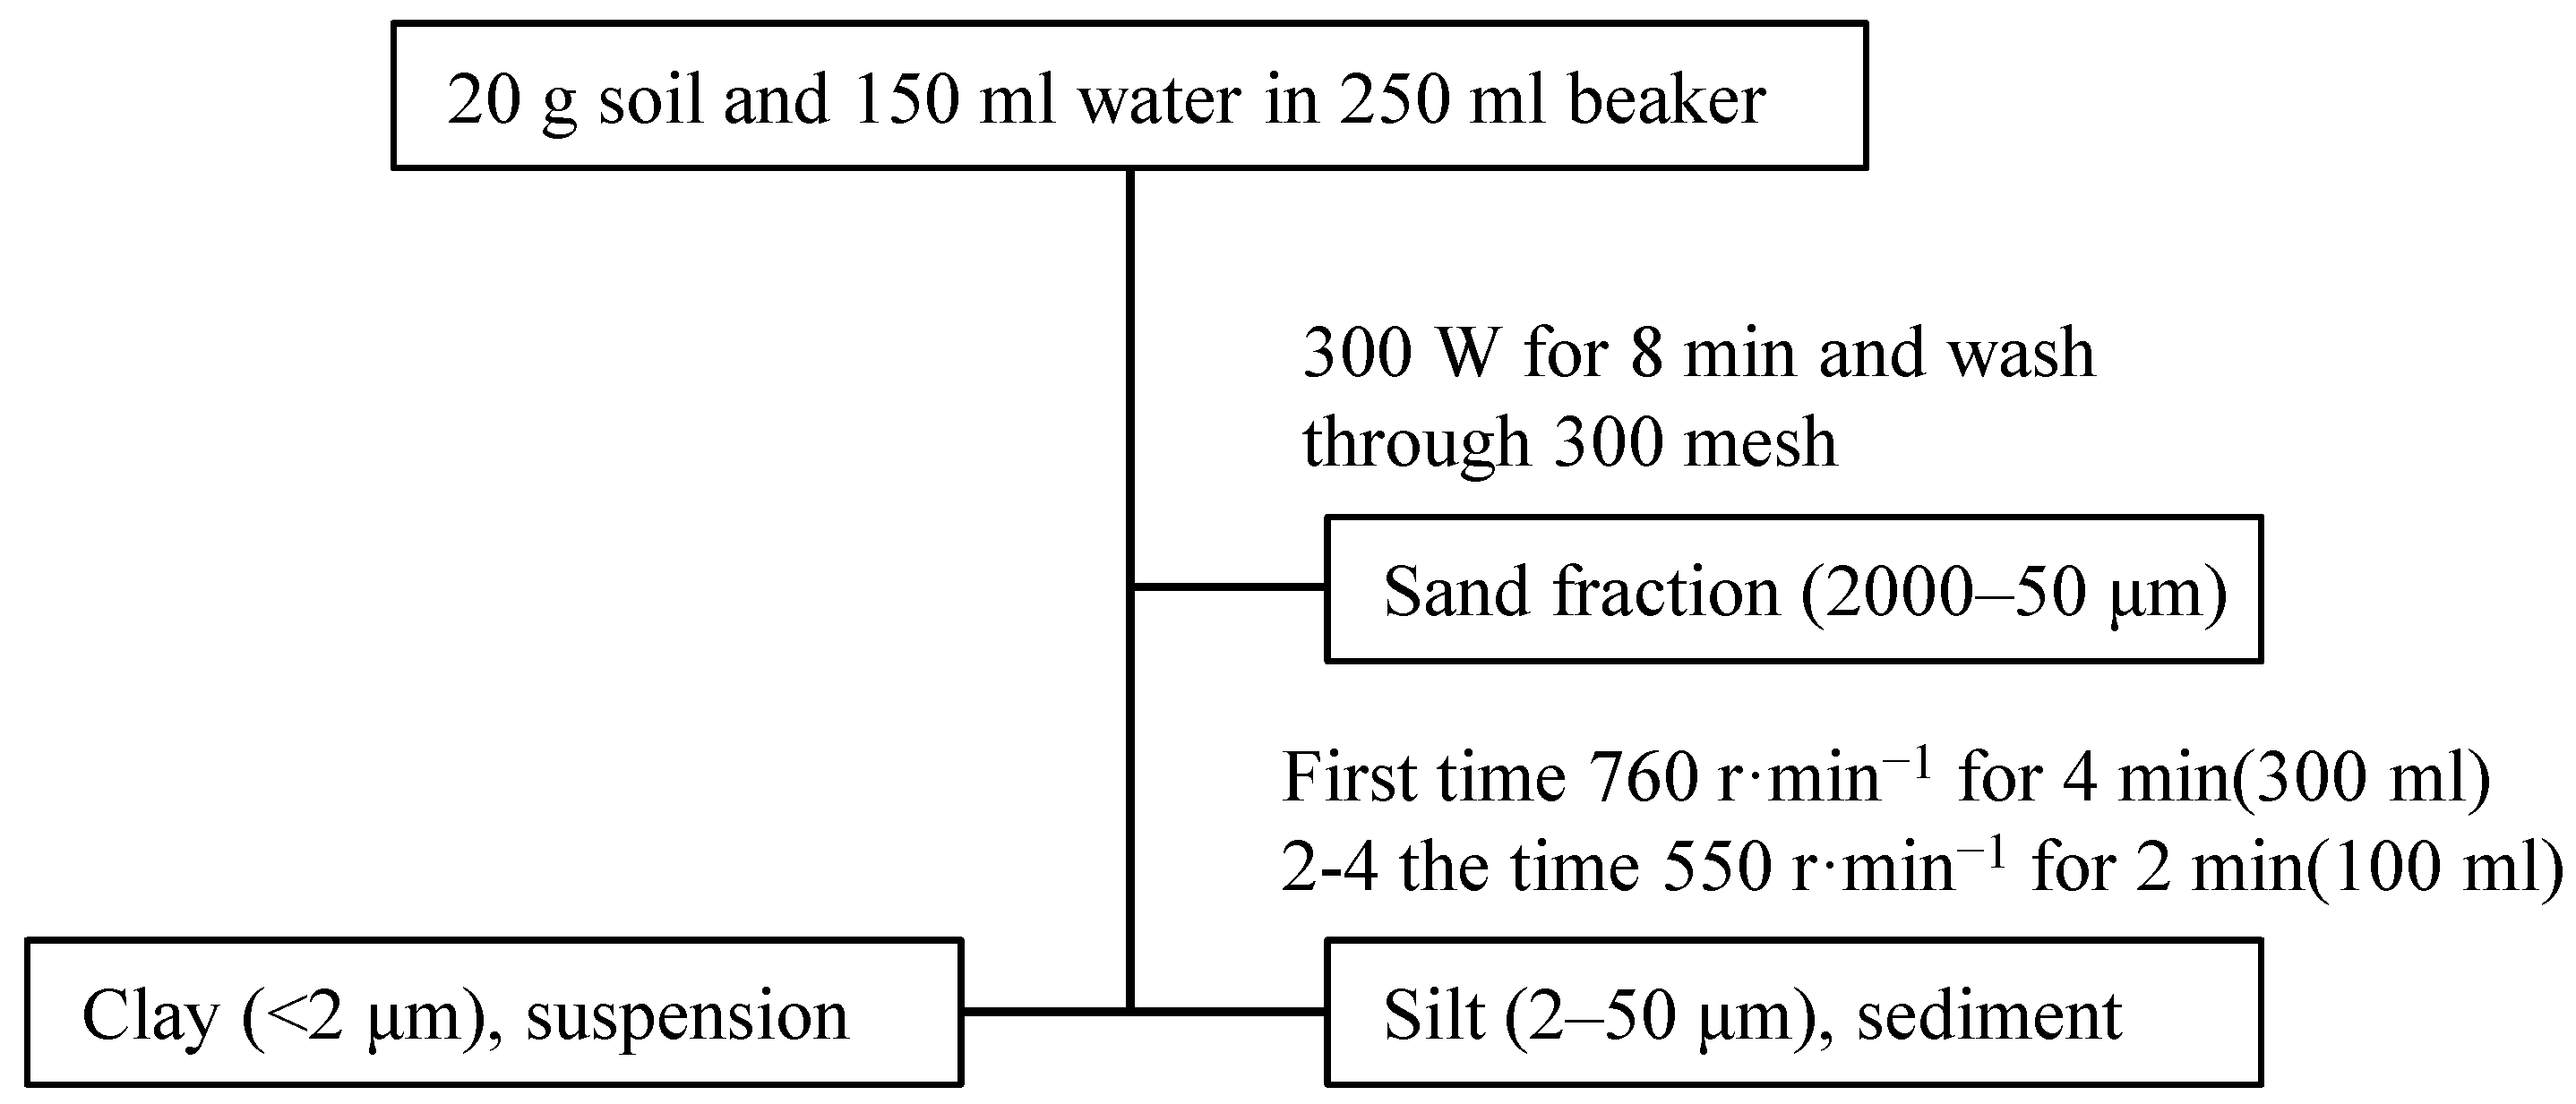
The sample plots in the woodlands and the grasslands were divided into areas of 50 m × 50 m. In each sample plot, three sample squares of 1 m × 1 m were selected along the diagonal lines. In each sample square, an auger boring was used to extract soil at the depths of 0–5 cm, 5–10 cm, and over 20 cm at an interval of 10 cm, each with three replicas. After all the samples were naturally dried, the centrifugation approach modified by Wu Yuntian et al. was leveraged to classify soil particles into sand(50–2000 μm), silt(2–50 μm), and clay(<2 μm) by particle size, as shown in Figure 2 [18]. The components were first dried by distillation in a 55 °C thermostat water bath, then baked in a 55 °C oven for 72 h before being weighed; after that, the samples were crushed using an agate grinding rod, the SOC content was determined with the potassium dichromate oxidative-reductive method, and the total nitrogen content was measured with the element analyzer (Element, Vario isotope cube, Elementar, DEU).

2.3. Data Analysis

This paper utilized SPSS 20.0 (IBM, Armonk, NY, USA) for correlation analysis, DPS17.5 (ADPS, Nanjing, China) and Duncan’s new multiple range test (MRT) (Statforum, Beijing, China) for multiple comparison analysis, and Excel 2010 (Microsoft, Redmond, WA, USA). for charting. The SOC distribution ratio of soil particles of different sizes was measured with the calculation methods of Zhou [29].
P i = X i × C i T × 100 %
where, P i is the SOC distribution ratio of soil at the i particle-size class, %; X i is the SOC content of soil at i the particle-size class, g·kg−1; C i is the mass of soil at i the particle-size class, %; and T is the soil organic matter content, g·kg−1.

3. Results

3.1. Distribution Characteristics of Soil Particles in Different Restoration Years

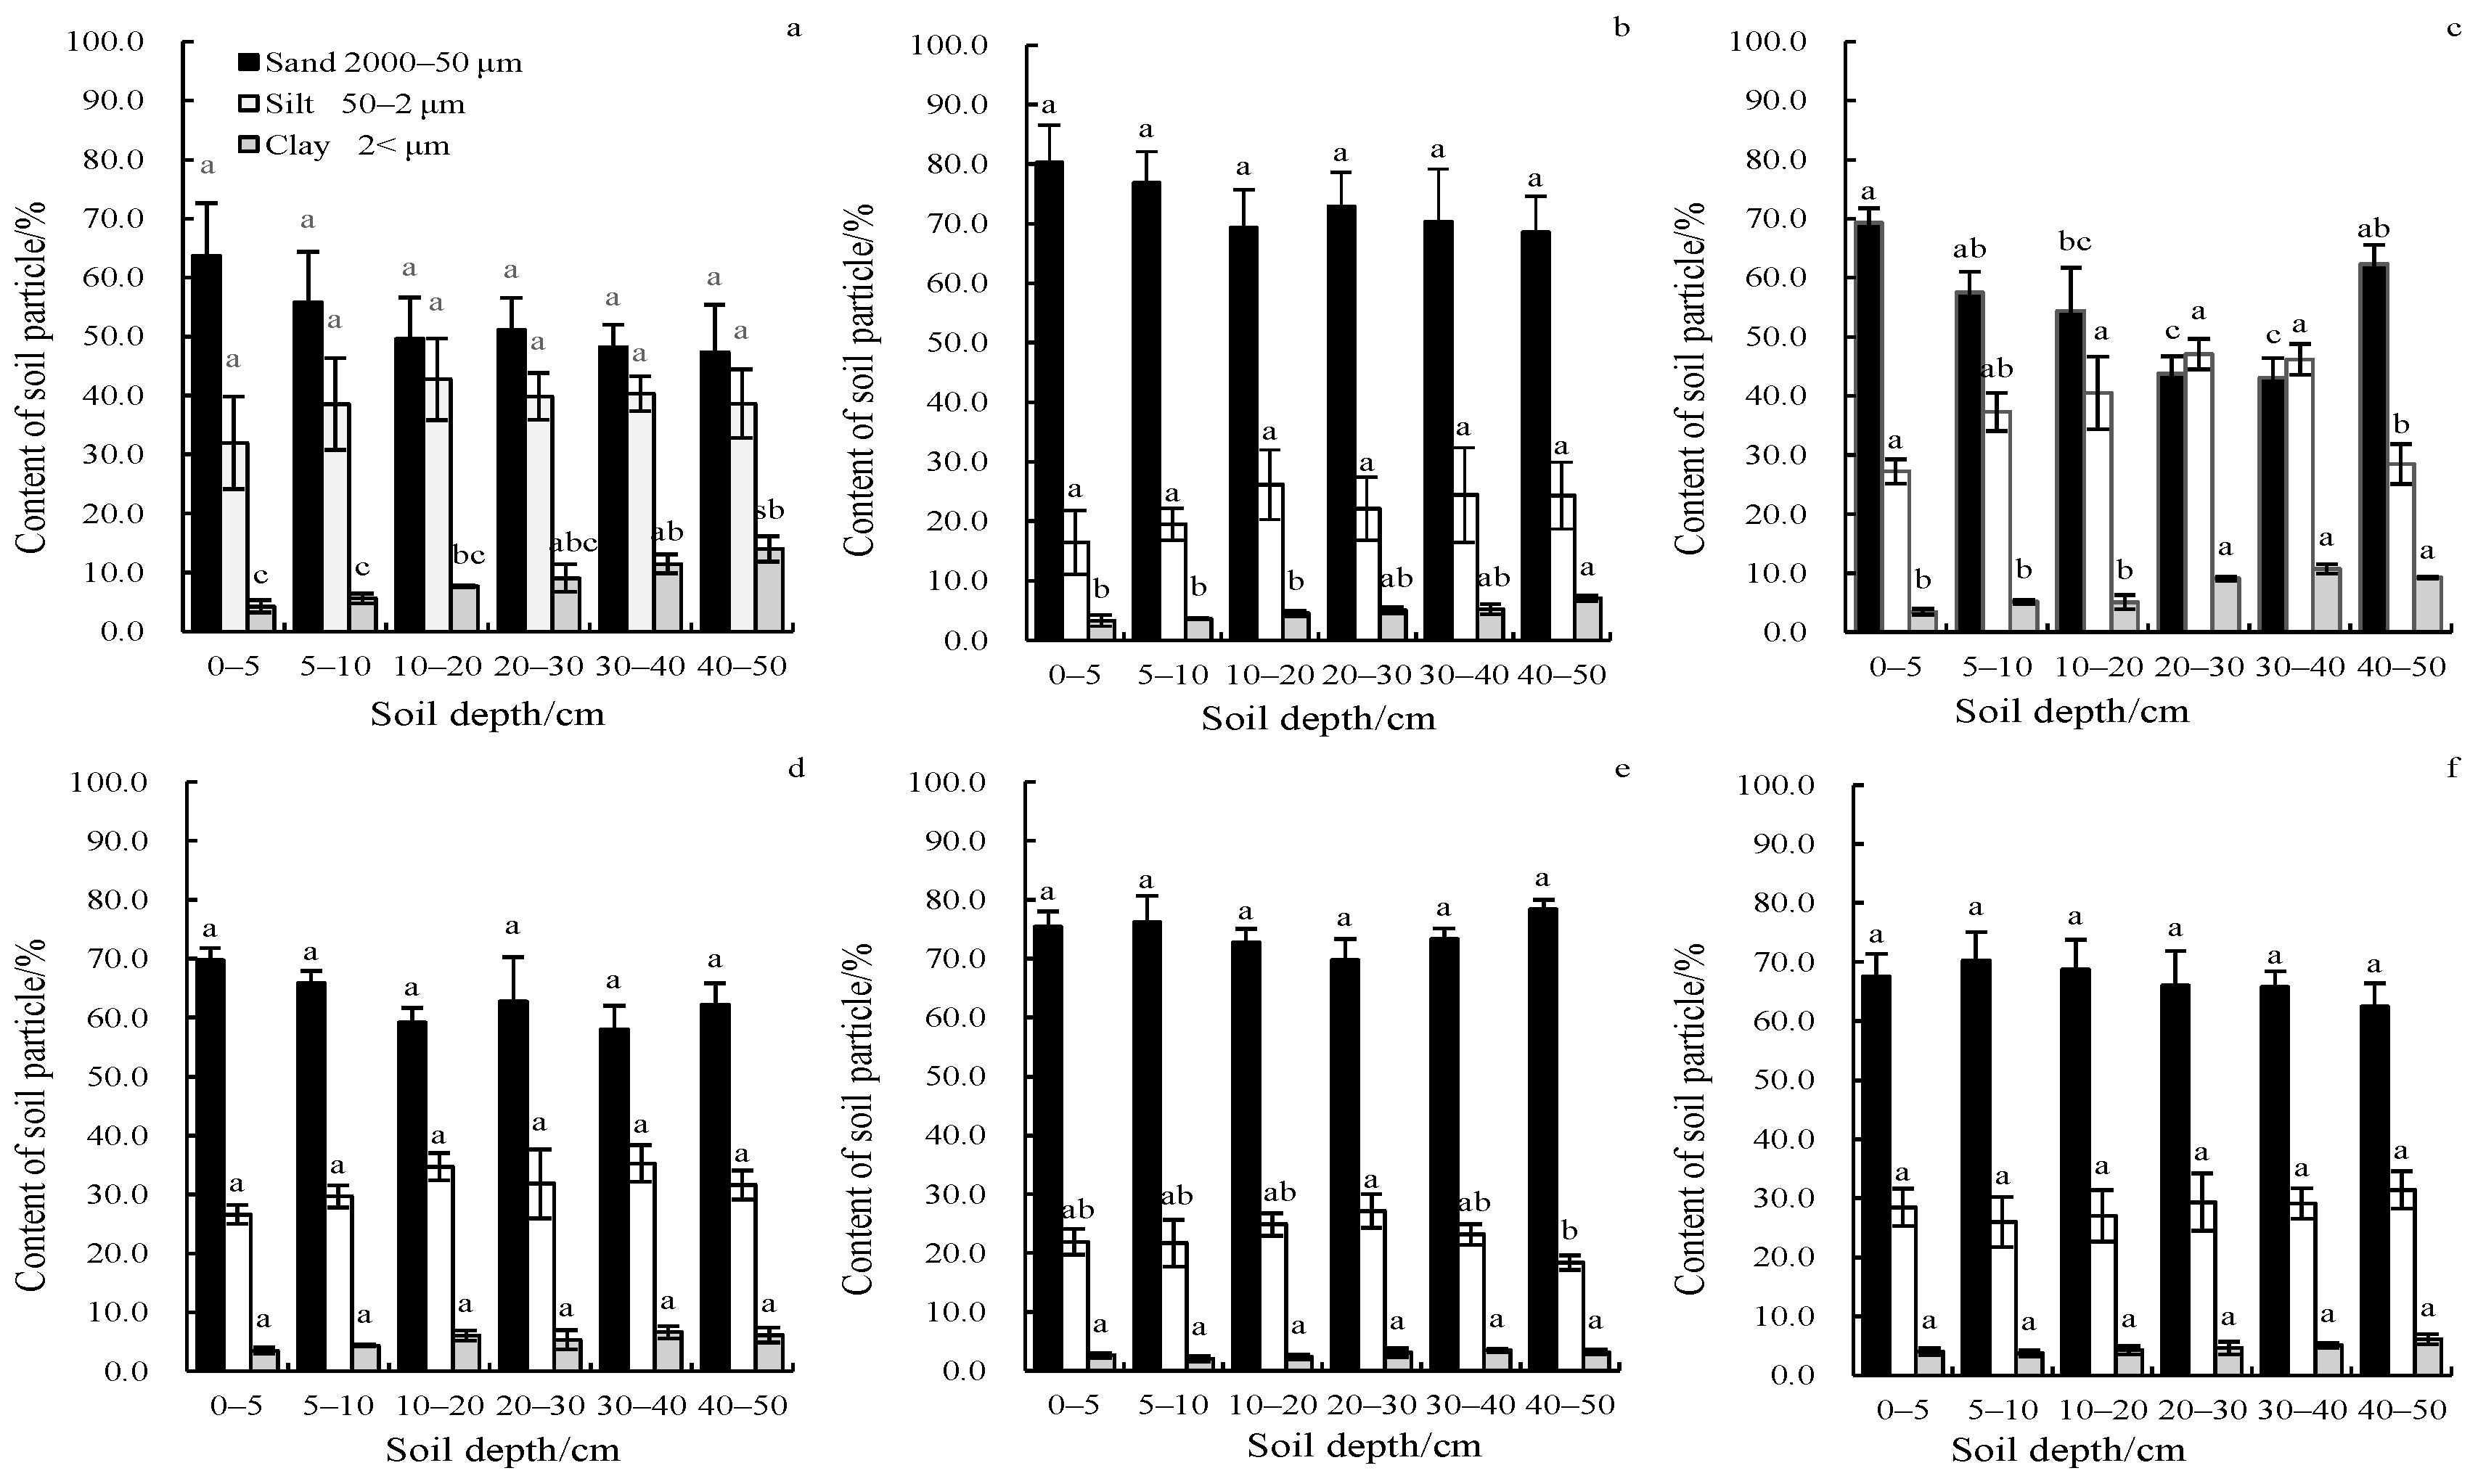
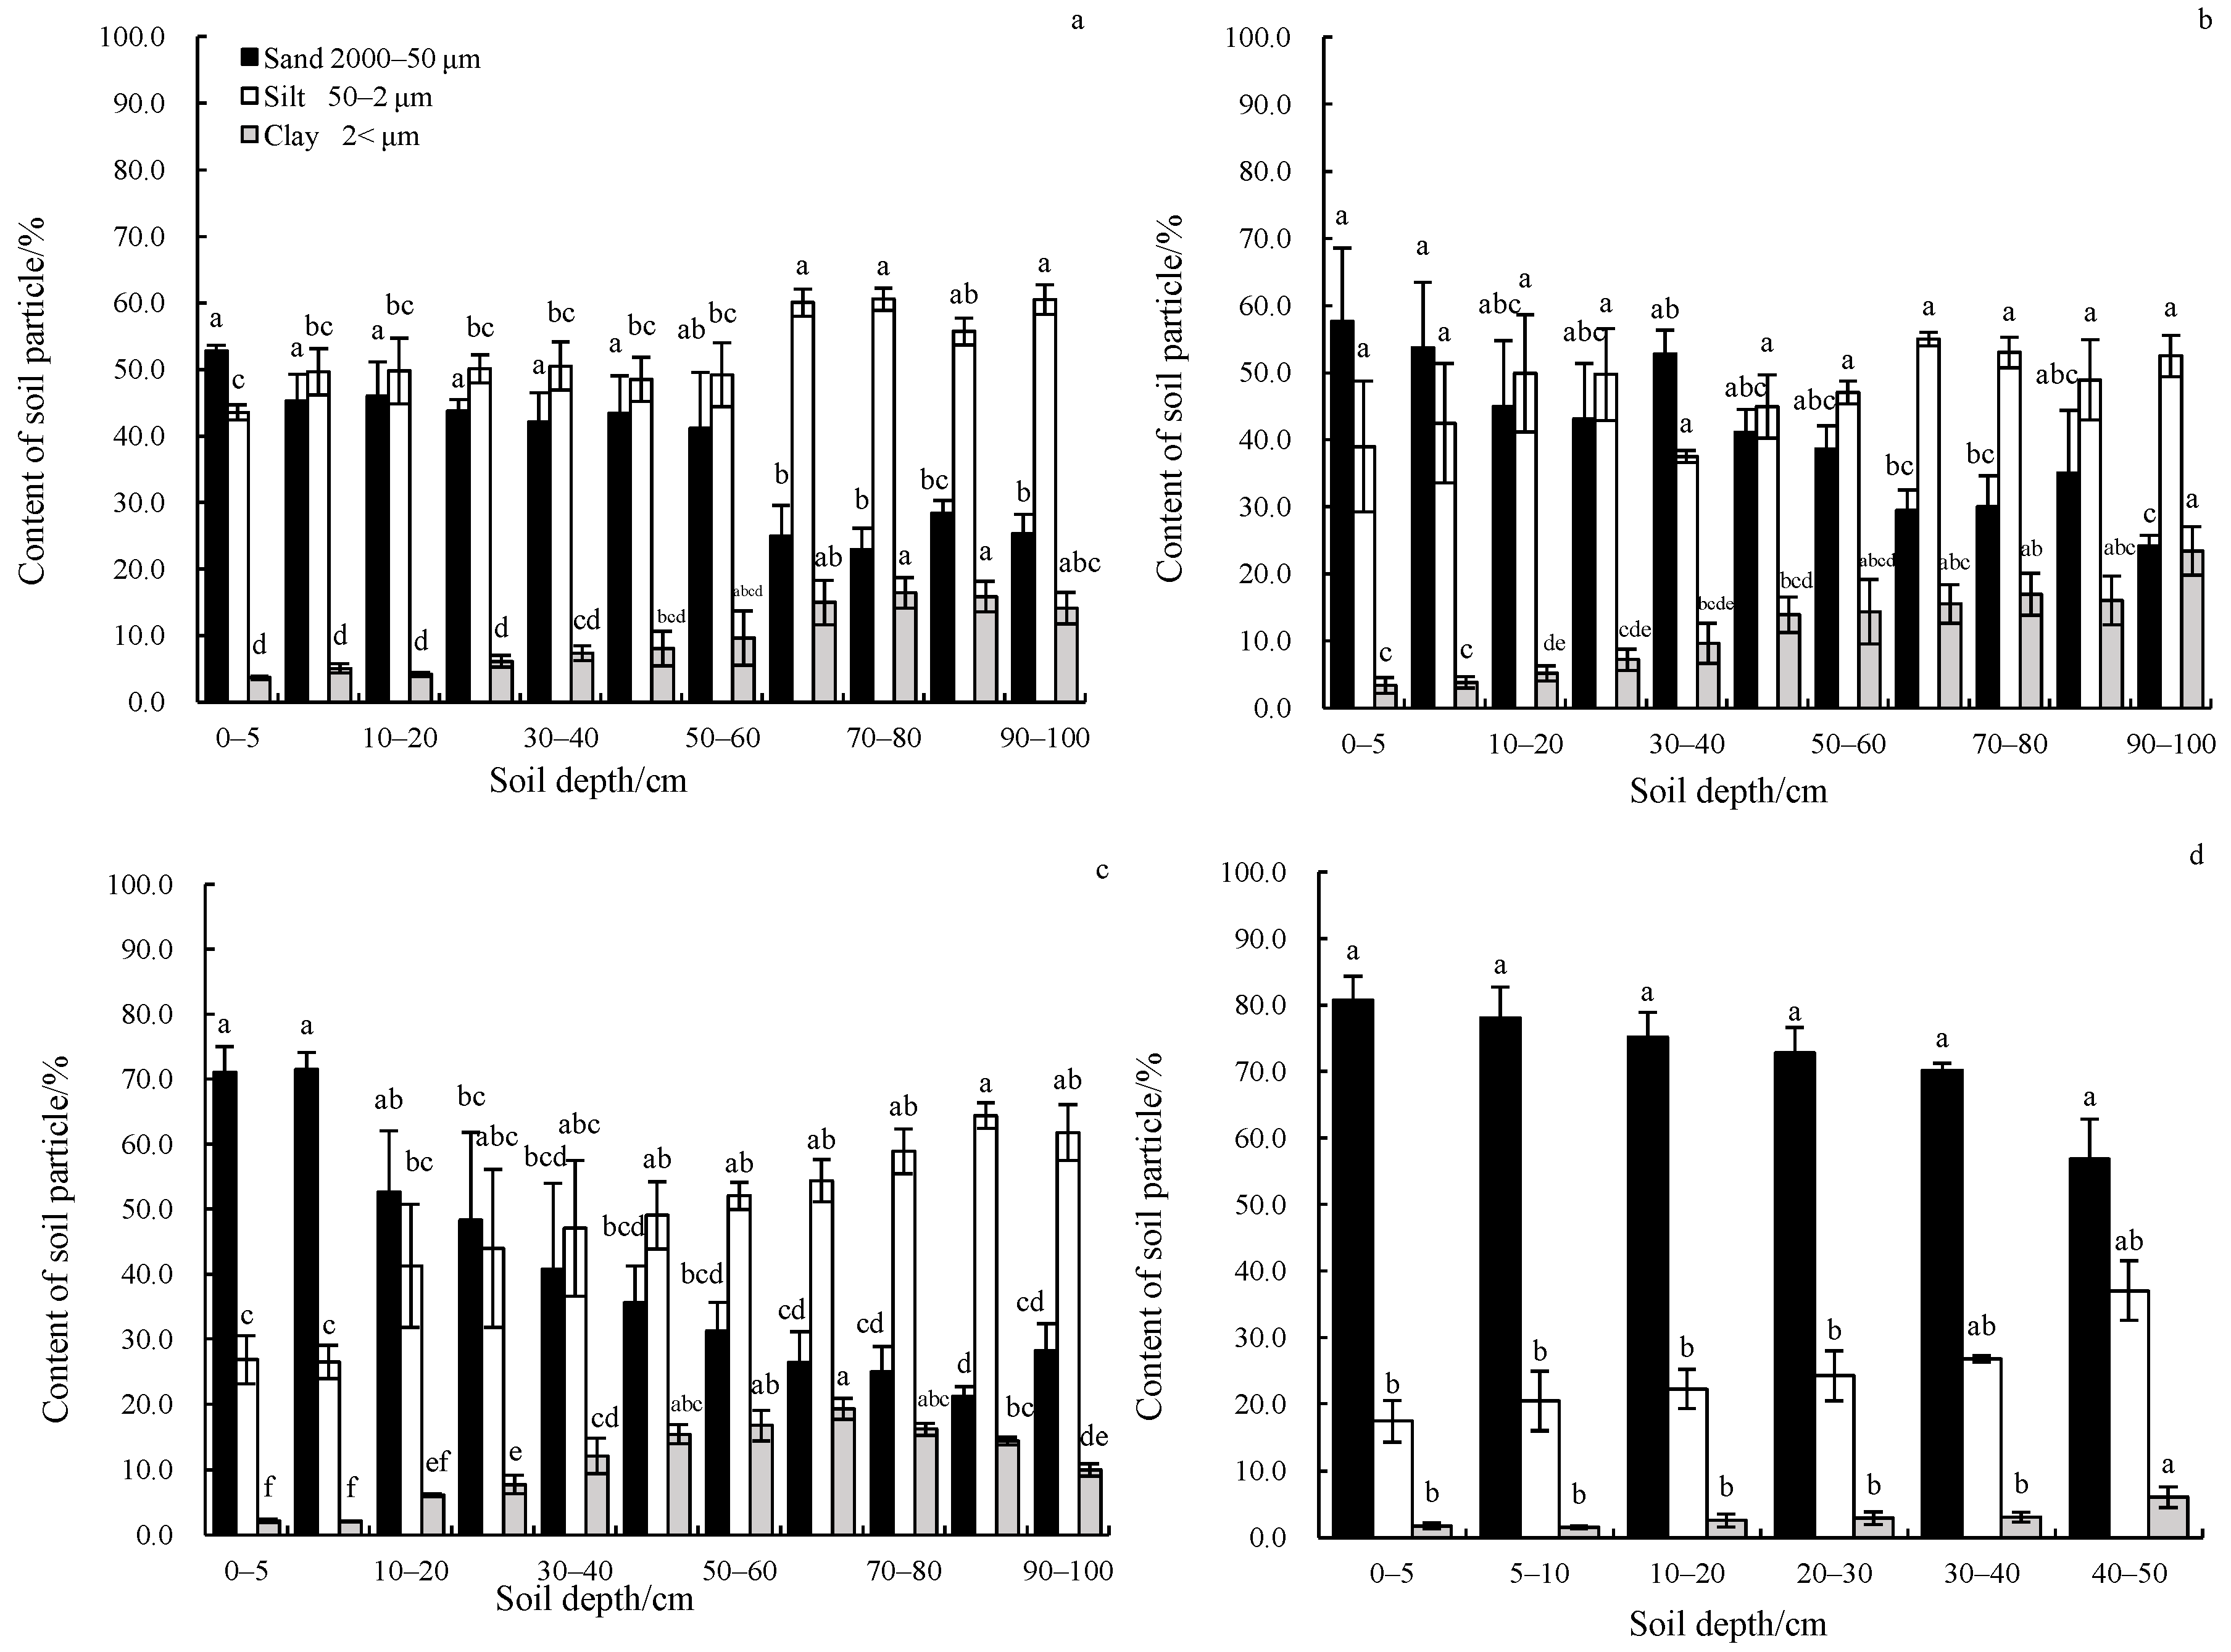
The results indicated that in terms of the grasslands in different restoration years, the content of sand ranged from 43.06% to 84.75% and averaged 64.17%; that of silt ranged from 11.23% to 47.09% and averaged 30.18%; that of clay ranged from 2.05% to 14.00% and averaged 5.65%. For restoration years four, five, and six, the contents of sand and silt at different depths were inversely proportional to each other, whereas the content of clay slowly increased along with the restoration years. For restoration years seven, eight, and nine, the contents of the three components at different depths were stable (Figure 3). With respect to the forest, except for the forest restored for 20 years, generally, the content of clay increased along with the depth, whereas that of sand decreased as the depth increased. The contents of silt and sand were inversely proportional to each other. The content of sand ranged from 37.84% to 72.30% and averaged 47.89%; that of silt ranged from 24.69% to 52.57% and averaged 43.23%; and that of clay ranged from 3.01% to 11.82% and averaged 8.88%. For the restoration years of five, the contents of the three soil particles varied significantly when the depth was below 60 cm (p < 0.05). For restoration year eight, the content of sand generally decreased as the depth increased; that of silt did not show significant differences at different depths (p > 0.05); and that of clay varied significantly when the depth was lower than 10 cm (p < 0.05). For restoration year 15, the contents of sand, silt, and clay were significantly different when the depth was below 20 cm (p < 0.05). For restoration years 20, the contents of sand and silt were not significantly different at various depths (p > 0.05), whereas the content of clay showed a marked difference when the depth was below 40 cm (p < 0.05) (Figure 4).

3.2. Distribution Characteristics of SOC in Different Restoration Years

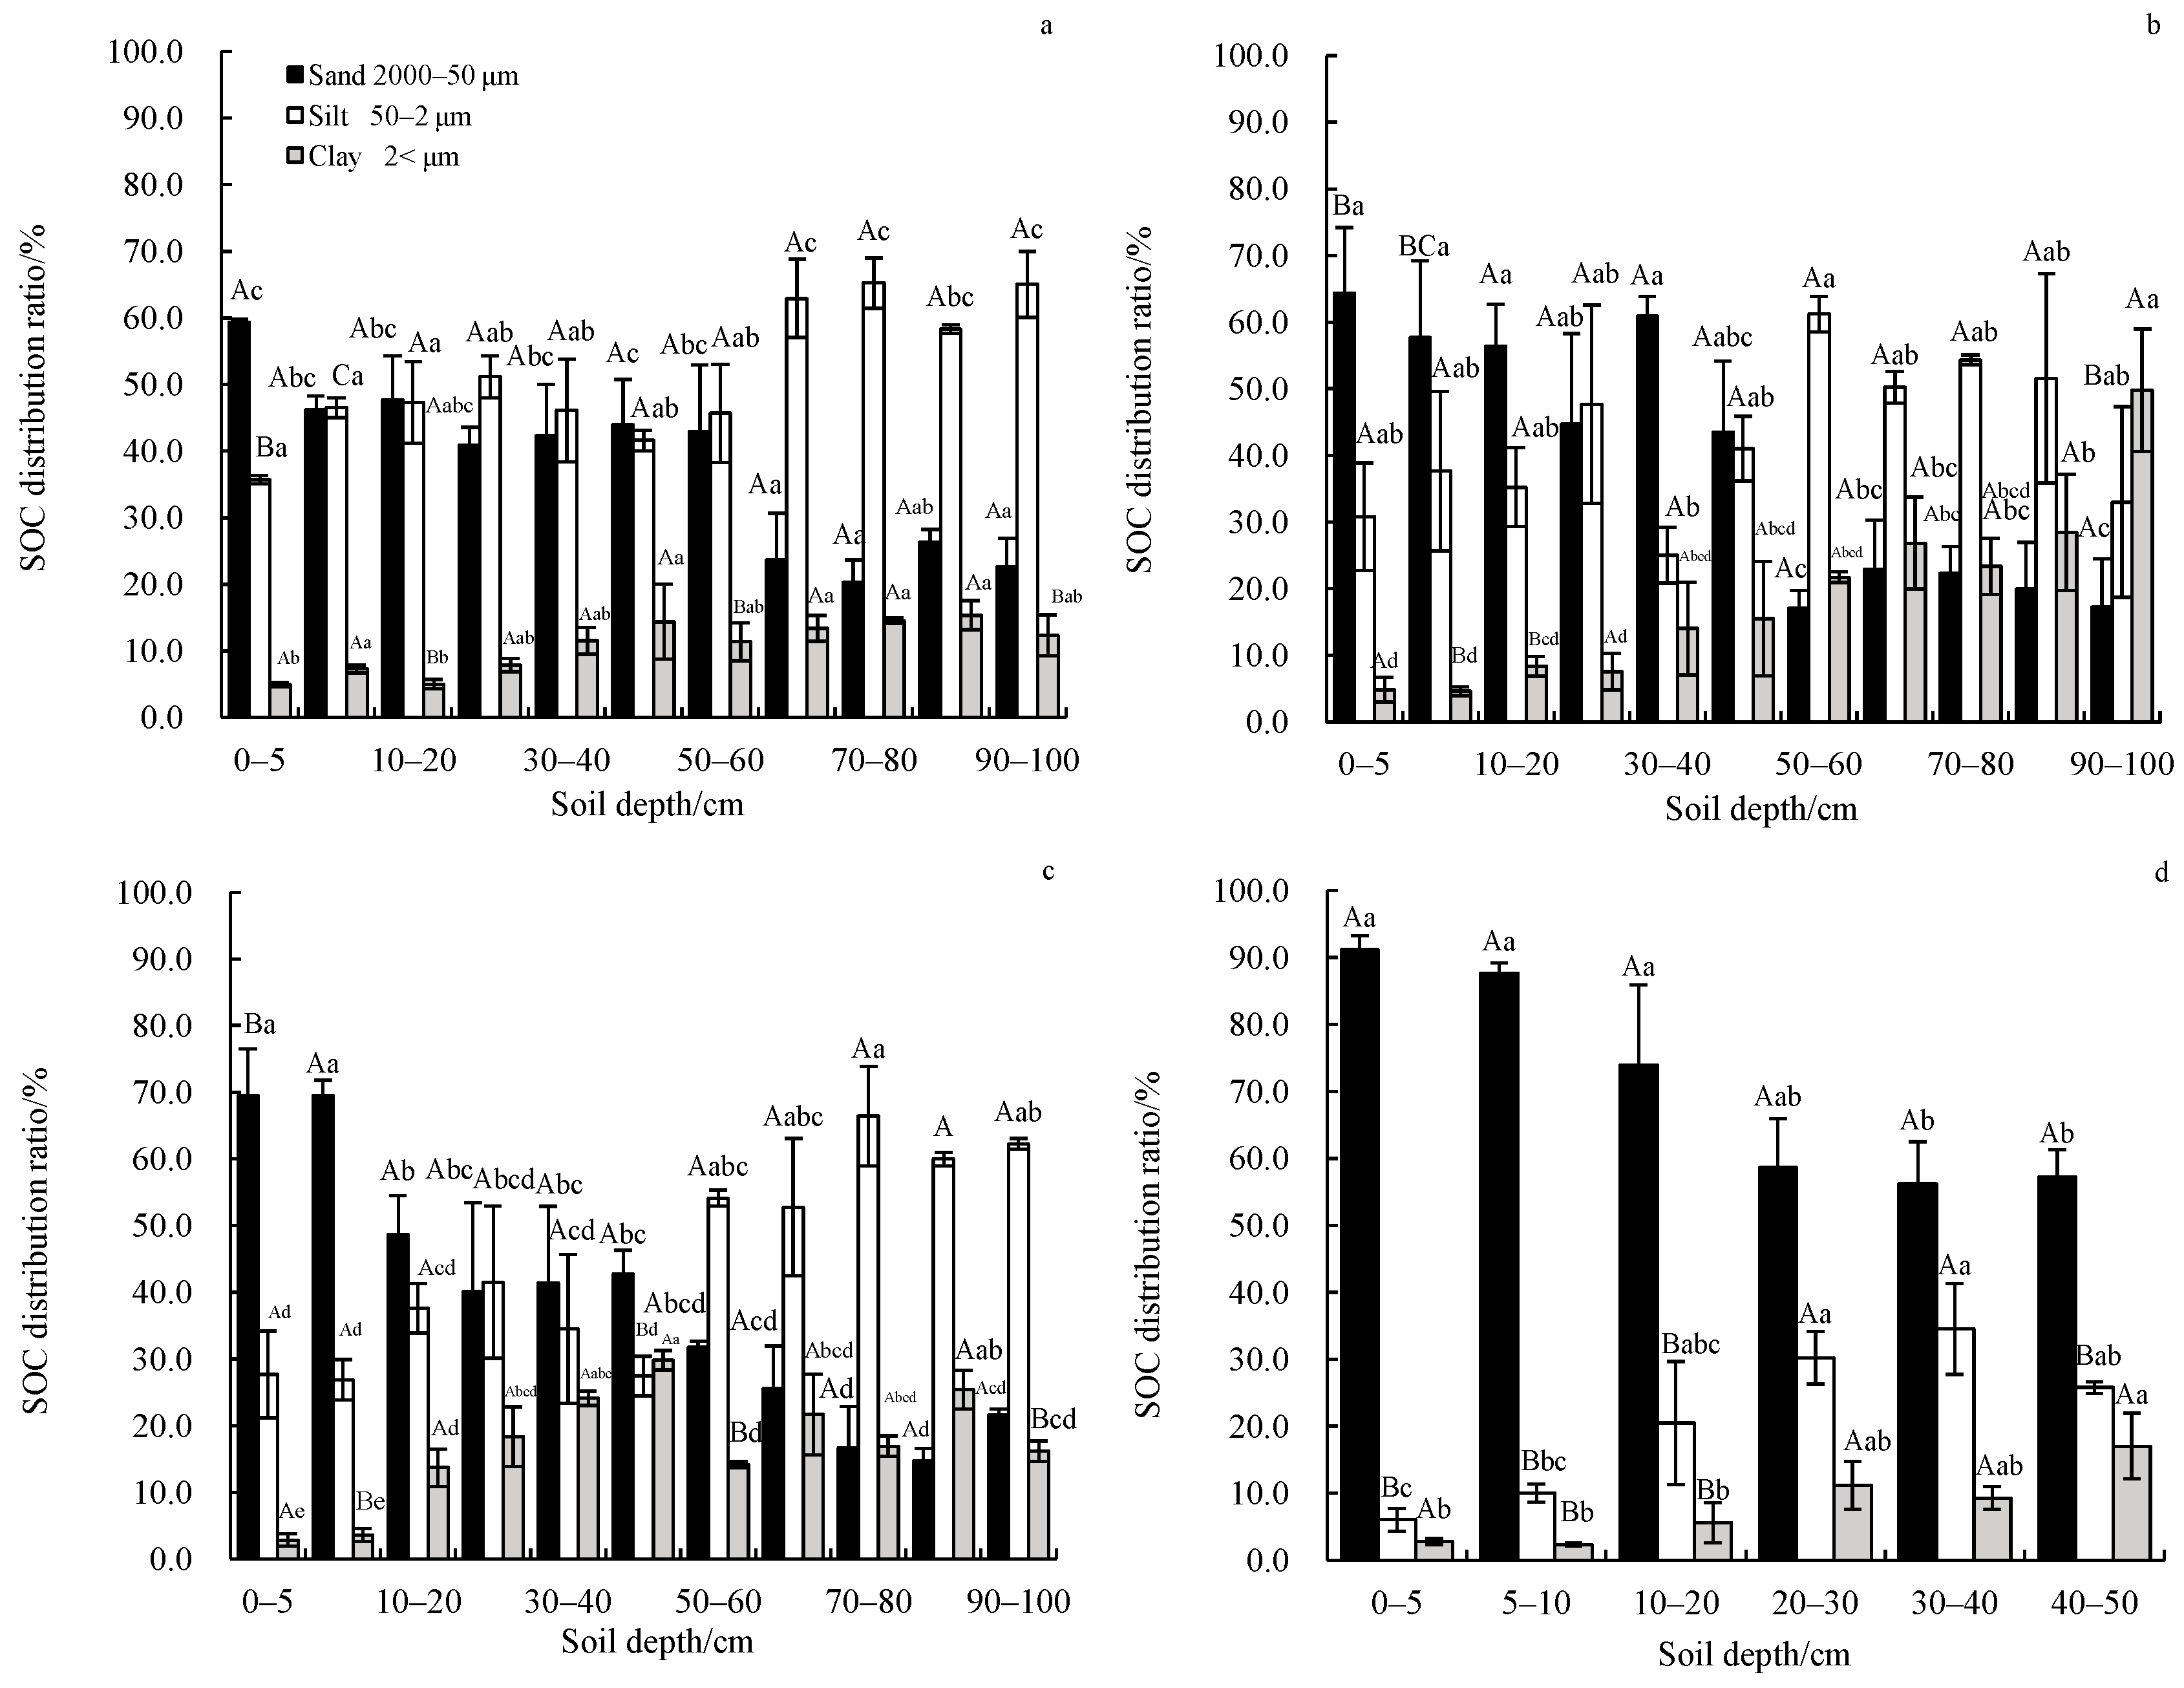
In accordance with the results of the SOC distribution ratio of the grasslands and forest in different restoration years, for the restored grasslands, most of the SOC came from the sand. The SOC distribution ratio of sand ranged from 25.64% to 81.88% and averaged 57.07%; that of silt ranged from 13.17% to 68.20% and averaged 33.37%; and that of clay ranged from 1.14% to 23.67% and averaged 9.55%. For the restoration years from four to six, the SOC distribution ratios of the soil particles with the same particle size at different depths were significantly different (p < 0.05). For restoration years longer than six, the SOC distribution ratio showed no significant differences (p > 0.05). For the soil particles with the same particle size in different restoration years, the SOC distribution ratios of silt and clay generally rose, whereas that of sand first rose and then decreased (Figure 5). For the restored forest, the SOC distribution ratio of sand ranged from 14.68% to 91.19% and averaged 46.46%; that of silt ranged from 6.03% to 66.43% and averaged 39.94%; and that of clay ranged from 2.36% to 49.79% and averaged 13.60%. In general, the SOC distribution ratios of silt and clay increased along with the depth and were not significantly different at different depths (p > 0.05). In contrast, the SOC distribution ratio of sand decreased along with the depth and was significantly different at different depths (p < 0.05). For restoration year five, eight, and fifteen, the SOC distribution ratios of sand and clay grew along with the depth, whereas that of silt was not notably different (p > 0.05). For restoration year 20, the SOC distribution ratio of sand climbed, whereas the SOC distribution ratios of silt and clay fell slightly (Figure 6).
For the restored grasslands, the carbon-nitrogen ratio (C/N ratio) decreased along with the particle size in different restoration years. Moreover, the difference in the C/N ratio in different restoration years narrowed as the particle size decreased. The average C/N ratios of sand, silt, and clay were 29.7, 13.4, and 9.4, respectively. The sequence of the average C/N ratios from big to small was eight years > five years > nine years > six years > four years > seven years (Figure 7a). The C/N ratios of sand and silt in forest were slightly lower than those of the grasslands, whereas the C/N ratio of clay in woodlands was slightly higher than that in grasslands. For the forest, the average C/N ratios of sand, silt, and clay were 15.2, 10.3, and 13.0, respectively. In addition, the difference in the ratio in different restoration years was significant. The sequence of the average C/N ratios from big to small was five years > fifteen years > eight years > twenty years (Figure 7b).

3.3. Comparison between Natural and Restored Lands

The comparison results of the content of SOC, soil components, and the C/N ratio of the restored forest, grasslands, and natural lands are shown in Table 1. As can be seen, the contents of SOC in restored grasslands at different depths were higher than those of natural grasslands. The content of SOC in natural woodlands at the depth of 0–20 cm was higher than that in restored forest, but that at the depth of over 20 cm was 1.91 times lower than in restored forest. According to the results of soil particle distribution, compared with the natural state, the sand content in the restored forest at the depth of 0–20 cm was lower, whereas the content of silt and clay increased. There was little difference between the sand and silt content before and after grassland restoration, but the clay content has seen a considerable increase. At the depth of over 20 cm, the restored forest has witnessed an increase in the sand content, a decrease in the silt content, and an insignificant change in the clay content, whereas the restored grasslands has seen its clay content increased, with no obvious change in the other two particle contents.

4. Discussion

The results of this paper indicated that as the restoration years increased, the content of clay in restored grasslands and forest generally decreased, whereas that of sand increased. As both types of restored lands have adopted enclosure measures to various extents, the interference of livestock and human activities on the soil in the grazing process has been reduced, and the decomposition of soil particles from stable aggregates to discrete bodies has been effectively prevented [24,30]. Under enclosure conditions, plant residues have long been accumulated in the soil surface, which promoted the biological activity of the soil surface and contributed to the formation of large soil particles [31]. The soil in this study area was mainly subjected to wind erosion and freeze-thaw erosion, among which the wind erosion blew away fine particles and left relatively coarse particles, thus forming coarse grained soils with poor fertility. The increase of large soil particles helped strengthen the anti-erosion ability, thereby improving the soil quality. The C/N ratios of soil at different depths of both restored lands were higher than those of natural lands, and the ratio declined with the decrease of particle size. The change of the C/N ratio depended on the properties and compositions of SOC components with different particle sizes. Specifically, large soil particles were mainly undecomposed organic residues with high content of activated organic carbon and poor stability, leading to the easy decomposition and mineralization of organic carbon, whereas small soil particles were mostly highly decomposed organic carbon components that combined with minerals, which had stronger adsorption capacity for storage. Therefore, the C/N ratios of large soil particles were higher than those of small soil particles [32].
Approximately 90% of the organic carbon in the surface soil is stored in soil particles of different sizes that have various organic carbon storage capacities and protective functions [15]. Studies showed that the content of SOC in soil particles with different sizes increased significantly during vegetation restoration. Specifically, the content of SOC in the soil particles with bigger sizes increased first. As the restoration continued, the content of SOC in soil particles with smaller sizes increased as well. Additionally, the content of SOC grew as the particle size decreased [33,34]. In this paper, we show that the recovered silt and clay in the prairie have approximately 376% and 296% as much SOC as the sand; whereas the contents of SOC of silt and clay in the restored forest represented approximately 273% and 220% those of sand, because different soil structures have different organic carbon protective functions. Small soil particles combine with organic carbon to form organic and inorganic compounds to protect organic carbon [16]. In this paper, the SOC was mainly originated from sand and silt, which was mainly due to the difference in soil particle content. As the content of clay was less than that of sand and silt, the ratio of SOC content in clay was far lower than that of silt and sand. The silt and clay organic matter proposed by Six et al. was able to be highly decomposed and played an important role in the long-term turnover of soil carbon pool, whereas the silk and sand organic matter played a significant role in the short-term turnover [35,36]. This implied the fact that the increase of organic carbon in the restored lands mainly came from large soil particles, despite the long-term restoration, and that the proportion of activated organic carbon combining with soil components with a big particle size was high, which means that the area is still under restoration, and the stability of organic carbon can be further improved.

5. Conclusions

The results show that both woodland and grassland restoration methods affect the carbon and nitrogen distribution of soil particles of three sizes. Sand and silt are the dominant carbon and nitrogen partitioning of soil particles, and the ratio of carbon and nitrogen partitioning of clay particles increases with the number of restoration years. The increase in soil organic carbon was dominated by active organic carbon in soil grains with large grain sizes, which also indicates that the region is still in the process of restoration and there is room for further improvement of the organic carbon pool. At the same time, the process of ecological restoration is affected not only by human activities but also by changes in the natural environment. In particular, the study area is located on the eastern edge of the Qinghai-Tibet Plateau, and whether increased temperature and precipitation contribute to ecological restoration requires further discussion.

Author Contributions

Conceptualization, Conceptualization, G.C. (Guangchao Cao) and S.C.; methodology, G.H.; data curation, W.Y.; writing—original draft preparation, G.H. and S.C.; writing—review and editing, G.C. (Guangchao Cao); visualization, G.C. (Guo Cheng). All authors have read and agreed to the published version of the manuscript.

Funding

This paper is funded by National Key R&D Program of China (2017YFC0404304), Natural Science Project of Qinghai Province (2018-ZJ-903) and Qinghai Province Qilian Mountain Nature Reserve Administration (QHTX-2020-043-02).

Data Availability Statement

The date that support the finding of this study are available from the corresponding author upon reasonable request.

Conflicts of Interest

The authors declare no conflict of interest.

References

  1. Tupek, B.; Ortiz, C.A.; Hashimoto, S.; Stendahl, J.; Dahlgren, J.; Karltun, E.; Lehtonen, A. Underestimation of boreal soil carbon stocks by mathematical soil carbon models linked to soil nutrient status. Biogeosciences 2016, 13, 4439–4459. [Google Scholar] [CrossRef] [Green Version]
  2. Olayemi, O.P.; Kallenbach, C.M.; Wallenstein, M.D. Distribution of soil organic matter fractions are altered with soil priming. Soil Biol. Biochem. 2022, 164, 108494. [Google Scholar] [CrossRef]
  3. Lehmann, J.; Hansel, C.M.; Kaiser, C.; Kleber, M.; Maher, K.; Manzoni, S.; Nunan, N.; Reichstein, M.; Schimel, J.P.; Torn, M.S.; et al. Persistence of soil organic carbon caused by functional complexity. Nat. Geosci. 2020, 13, 529–534. [Google Scholar] [CrossRef]
  4. Lan, Z.; Zhao, Y.; Zhang, J.G.; Rui, J.; Khan, M.; Sial, T.A.; Si, B.C. Long-term vegetation restoration Increases deep soil carbon storage in the northern Loess Plateau. Sci. Rep. 2021, 11, 13758. [Google Scholar] [CrossRef]
  5. Fu, X.; Shao, M.; Wei, X.; Horton, R. Soil organic carbon and total nitrogen as affected by vegetation types in Northern Loess Plateau of China. Geoderma 2010, 155, 31–35. [Google Scholar] [CrossRef]
  6. Jia, X.X.; Wei, X.R.; Shao, M.A. Distribution of soil carbon and nitrogen along a revegetational succession on the Loess Plateau of China. Catena 2012, 95, 160–168. [Google Scholar] [CrossRef]
  7. Yang, X.; Zhang, X.; Lv, D.; Yin, S.; Zhang, M.; Zhu, Q.; Yu, Q.; Liu, B. Remote sensing estimation of the soil erosion cover-management factor for China’s Loess Plateau. Land Degrad. Dev. 2020, 31, 1942–1955. [Google Scholar] [CrossRef]
  8. Laganière, J.; Angers, D.A.; Paré, D. Carbon accumulation in agricultural soils after afforestation: A meta-analysis. Glob. Chang. Biol. 2010, 16, 439–453. [Google Scholar] [CrossRef]
  9. Zhang, K.; Dang, H.; Tan, S.; Cheng, X.; Zhang, Q. Change in soil organic carbon following the ‘Grain-for-Green’ programme in China. Land Degrad. Dev. 2010, 21, 13–23. [Google Scholar] [CrossRef]
  10. Bobrovsky, M.; Komarov, A.; Mikhailov, A.; Khanina, L. Modelling dynamics of soil organic matter under different historical land-use management techniques in European Russia. Ecol. Model. 2010, 221, 953–959. [Google Scholar] [CrossRef]
  11. Hunt, J.R.; Celestina, C.; Kirkegaard, J.A. The realities of climate change, conservation agriculture and soil carbon sequestration. Glob. Chang. Biol. 2020, 26, 3188–3189. [Google Scholar] [CrossRef] [Green Version]
  12. Wang, Y.; Fu, B.; Lü, Y.; Chen, L. Effects of vegetation restoration on soil organic carbon sequestration at multiple scales in semi-arid Loess Plateau, China. Catena 2011, 85, 58–66. [Google Scholar] [CrossRef]
  13. Lal, R.; Griffin, M.; Apt, J.; Lave, L.; Morgan, M.G. Ecology. Managing Soil Carbon. Science 2004, 304, 393. [Google Scholar] [CrossRef] [Green Version]
  14. Paul, K.I.; Polglase, P.J.; Richards, G.P. Sensitivity analysis of predicted change in soil carbon following afforestation. Ecol. Model. 2003, 164, 137–152. [Google Scholar] [CrossRef]
  15. von Lützow, M.; Kögel-Knabner, I.; Ekschmitt, K.; Flessa, H.; Guggenberger, G.; Matzner, E.; Marschner, B. SOM fractionation methods: Relevance to functional pools and to stabilization mechanisms. Soil Biol. Biochem. 2007, 39, 2183–2207. [Google Scholar] [CrossRef]
  16. McLauchlan, K.K.; Hobbie, S.E. Comparison of Labile Soil Organic Matter Fractionation Techniques. Soil Sci. Soc. Am. J. 2004, 68, 1616–1625. [Google Scholar] [CrossRef]
  17. Six, J.; Paustian, K. Aggregate-associated soil organic matter as an ecosystem property and a measurement tool. Soil Biol. Biochem. 2014, 68, A4–A9. [Google Scholar] [CrossRef]
  18. Novara, A.; Gristina, L.; Kuzyakov, Y.; Schillaci, C.; Laudicina, V.A.; La Mantia, T. Turnover and availability of soil organic carbon under different Mediterranean land-uses as estimated by13C natural abundance. Eur. J. Soil Sci. 2013, 64, 466–475. [Google Scholar] [CrossRef] [Green Version]
  19. Wu, Y.T.; Jeff, J.S.; Li, F.M.; Qian, P.Y.; Wang, F.; Sukhadev, S.M. Soil particlesize fractionation with centrifugation method. Chin. J. Appl. Ecol. 2004, 15, 477–481. [Google Scholar]
  20. He, N.; Wu, L.; Wang, Y.; Han, X. Changes in carbon and nitrogen in soil particle-size fractions along a grassland restoration chronosequence in northern China. Geoderma 2009, 150, 302–308. [Google Scholar] [CrossRef]
  21. Sun, C.; Liu, G.; Xue, S. Natural succession of grassland on the Loess Plateau of China affects multifractal characteristics of soil particle-size distribution and soil nutrients. Ecol. Res. 2016, 31, 891–902. [Google Scholar] [CrossRef]
  22. Dai, Y.; Dong, Z.; Li, H.; He, Y.; Li, J.; Guo, J. Effects of checkerboard barriers on the distribution of aeolian sandy soil particles and soil organic carbon. Geomorphology 2019, 338, 79–87. [Google Scholar] [CrossRef]
  23. Wang, G.; Ju, Q.; Cheng, G.; Lai, Y. Soil organic carbon pool of grassland soils on the qinghai-tibetan plateau and its global implication. Sci. Total Environ. 2002, 291, 207–217. [Google Scholar] [CrossRef]
  24. Brus, D.; Yang, R.-M.; Zhang, G.-L. Three-dimensional geostatistical modeling of soil organic carbon: A case study in the Qilian Mountains, China. Catena 2016, 141, 46–55. [Google Scholar] [CrossRef]
  25. Li, X.; Gou, X.H.; Wang, N.L.; Sheng, Y.; Jing, H.J.; Qi, Y.; Song, X.Y.; Hou, F.J.; Li, Y.; Zhao, C.M.; et al. Tightening ecological management facilitates green development in the Qilian Mountains. Chin. Sci. Bull. 2019, 64, 2928–2937. [Google Scholar] [CrossRef] [Green Version]
  26. Xu, Z.L.; Zhao, C.Y.; Feng, Z.D.; Hassan, S.; Wang, C.; Peng, H.H.; Wang, Y.; Zhao, Y.; Wang, Y.; Peng, S.Z.; et al. Estimating realized and potential carbon storage benefits from reforestation and afforestation under climate change: A case study of the Qinghai spruce forests in the Qilian mountains, northwestern China. Mitig. Adapt. Strat. Glob. Chang. 2013, 18, 1257–1268. [Google Scholar] [CrossRef]
  27. Yang, R.; Su, Y.; Wang, M.; Wang, T.; Yang, X.; Fan, G.; Wu, T. Spatial pattern of soil organic carbon in desert grasslands of the diluvial-alluvial plains of northern Qilian Mountains. J. Arid Land 2014, 6, 136–144. [Google Scholar] [CrossRef] [Green Version]
  28. Zhu, M.; Feng, Q.; Qin, Y.; Cao, J.; Li, H.; Zhao, Y. Soil organic carbon as functions of slope aspects and soil depths in a semiarid alpine region of Northwest China. Catena 2017, 152, 94–102. [Google Scholar] [CrossRef]
  29. Li, H.; Wu, Y.; Chen, J.; Zhao, F.; Wang, F.; Sun, Y.; Zhang, G.; Qiu, L. Responses of soil organic carbon to climate change in the Qilian Mountains and its future projection. J. Hydrol. 2021, 596, 126110. [Google Scholar] [CrossRef]
  30. Zhou, F.L. Stability of Aggregates and Distribution Characteristics of Organic Carbon under Chinese Milk Vetch and Straw. Master’s Thesis, Huazhong Agricultural University, Wuhan, China, 2019. [Google Scholar]
  31. Baiano, S.; Morra, L. Particulate and mineral-associated organic carbon in aggregates as affected by biowaste compost applications in a mediterranean vegetables cropping system. Commun. Soil Sci. Plant Anal. 2017, 48, 383–394. [Google Scholar] [CrossRef]
  32. Filley, T.R.; Boutton, T.; Liao, J.D.; Jastrow, J.; Gamblin, D.E. Chemical changes to nonaggregated particulate soil organic matter following grassland-to-woodland transition in a subtropical savanna. J. Geophys. Res. Earth Surf. 2008, 113, 10269. [Google Scholar] [CrossRef] [Green Version]
  33. Schaeffer, S.M.; Homyak, P.M.; Boot, C.M.; Roux-Michollet, D.; Schimel, J.P. Soil carbon and nitrogen dynamics throughout the summer drought in a California annual grassland. Soil Biol. Biochem. 2017, 115, 54–62. [Google Scholar] [CrossRef]
  34. Cotrufo, M.F.; Ranalli, M.G.; Haddix, M.L.; Six, J.; Lugato, E. Soil carbon storage informed by particulate and mineral-associated organic matter. Nat. Geosci. 2019, 12, 989–994. [Google Scholar] [CrossRef]
  35. Poeplau, C.; Kätterer, T.; Leblans, N.I.W.; Sigurdsson, B.D. Sensitivity of soil carbon fractions and their specific stabilization mechanisms to extreme soil warming in a subarctic grassland. Glob. Chang. Biol. 2016, 23, 1316–1327. [Google Scholar] [CrossRef]
  36. Six, J.; Conant, R.T.; Paul, E.A.; Paustian, K. Stabilization mechanisms of soil organic matter: Implications for C-saturation of soils. Plant Soil 2002, 241, 155–176. [Google Scholar] [CrossRef]
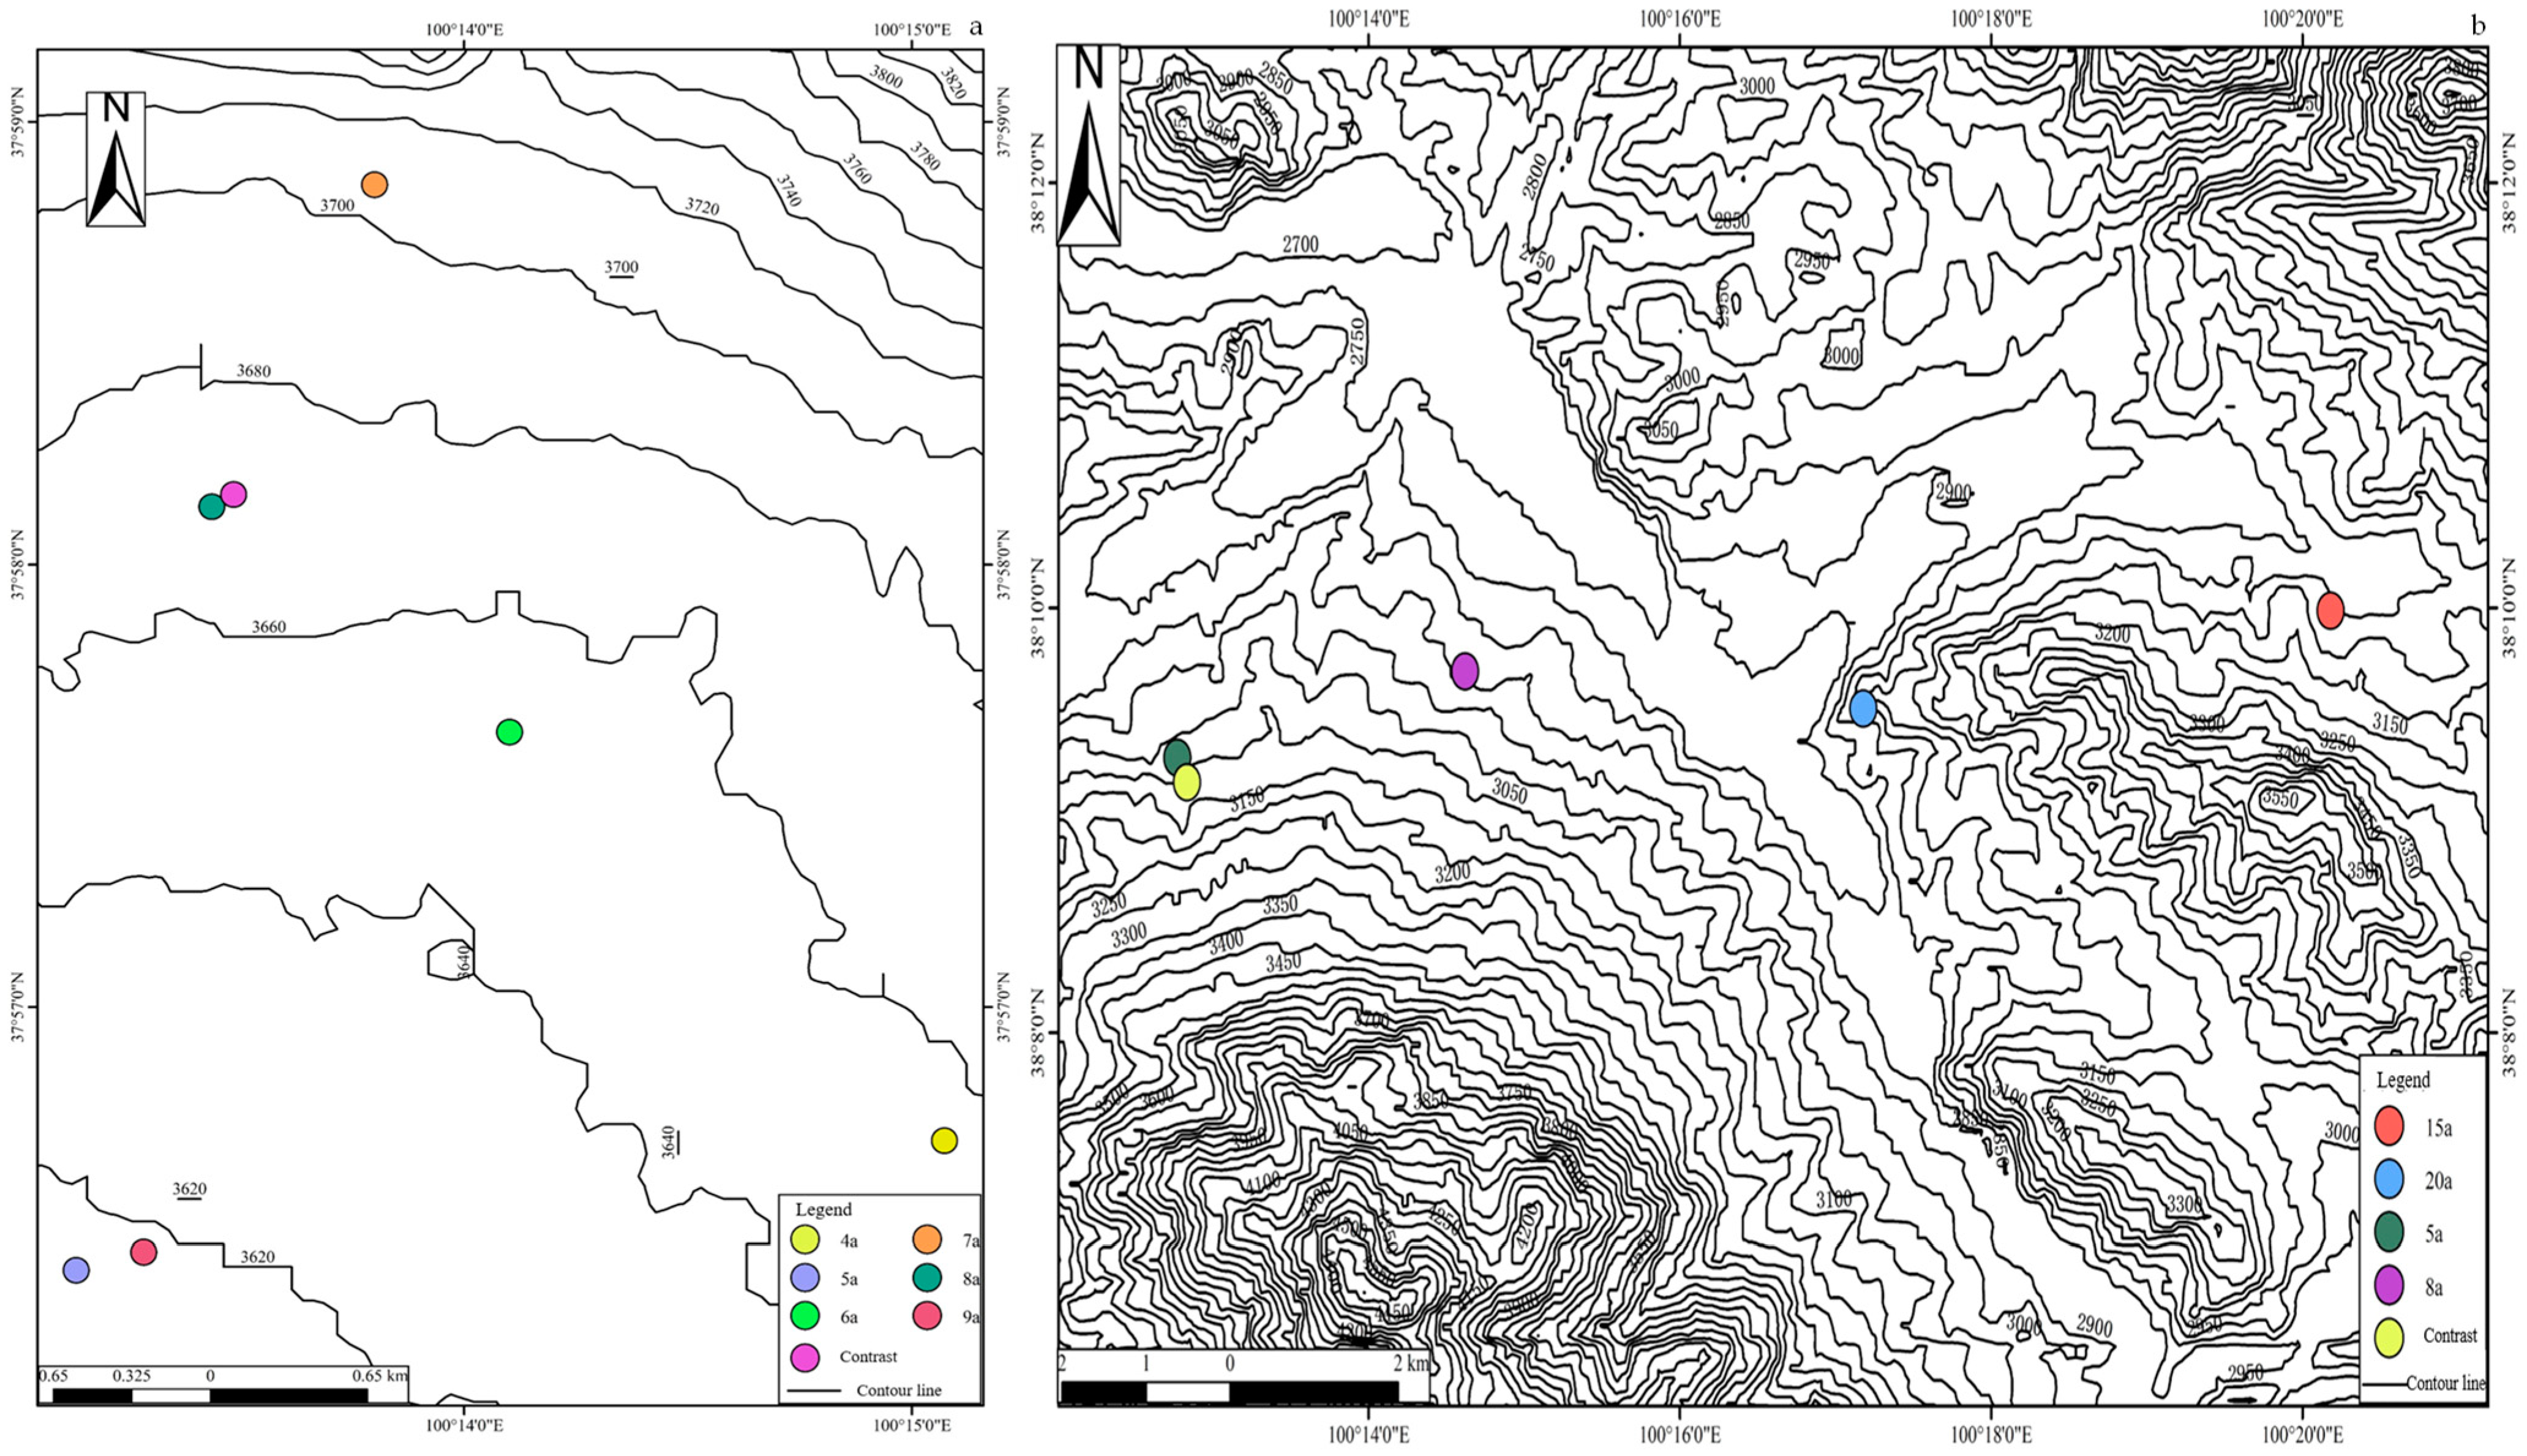
Figure 1. Sampling points for restoration of grasslands (a) and woodlands (b).
Separations 09 00279 g001
Figure 2. Flow chart of soil particle-size fractionation.
Separations 09 00279 g002
Figure 3. Distribution of soil particles in grasslands in different restoration years ((af) in the figure represent restoration 4a, 5a, 6a, 7a, 8a, and 9a, respectively, the same as below). Notes: The lowercase letters in the figures represent significant differences in the same component at different depths (p < 0.05).
Separations 09 00279 g003
Figure 4. Distribution of soil particles in woodlands in different restoration years ((ad) in the figure represent restoration 5a, 8a, 15a, and 20a, respectively, the same as below). Notes: The lowercase letters in the figures represent significant differences in the same component at different depths (p < 0.05).
Separations 09 00279 g004
Figure 5. SOC distribution ratio of grasslands in different restoration years. ((af) in the figure represent restoration 4a, 5a, 6a, 7a, 8a, and 9a, respectively), Notes: The lowercase letters in the figures represent significant differences in the same component at different depths (p < 0.05), and the uppercase letters indicate significant differences in the same component at the same depth in different restoration years (p < 0.05).
Separations 09 00279 g005
Figure 6. SOC distribution ratio of woodlands in different restoration years. ((ad) in the figure represent restoration 5a, 8a, 15a, and 20a, respectively), Notes: The lowercase letters in the figures represent significant differences in the same component at different depths (p < 0.05), and the uppercase letters indicate significant differences in the same component at the same depth in different restoration years (p < 0.05).
Separations 09 00279 g006
Figure 7. Total nitrogen content and C/N ratios of different soil components in grasslands (a) and wood-lands (b).
Separations 09 00279 g007
Table 1. Comparison between restored and natural lands.
CategorySoil Depth/cmTreatmentC/NSOC/g·kg−1Sand/%Silt/%Clay/%
Grasslands0–20 cmRestored9.9925.3267.2628.514.23
Natural3.0410.7272.3524.573.09
>20 cmRestored9.8113.5861.0831.847.08
Natural2.847.8063.0932.224.69
Woodlands0–20 cmRestored13.6940.5348.0447.674.29
Natural10.3563.1671.6026.591.81
>20 cmRestored23.2761.2734.0254.4011.58
Natural22.4431.0427.4660.8411.70
Publisher’s Note: MDPI stays neutral with regard to jurisdictional claims in published maps and institutional affiliations.