Article

Detection of Escherichia coli by Combining an Affinity-Based Method with Contactless Atmospheric Pressure Ionization Mass Spectrometry

by
Juli Novita Sari
1,2,
Karthikeyan Kandasamy
1,2 and
Yu-Chie Chen
1,2,*
1
Department of Applied Chemistry, National Yang Ming Chiao Tung University, Hsinchu 30010, Taiwan
2
Department of Applied Chemistry, National Chiao Tung University, Hsinchu 30010, Taiwan
*
Author to whom correspondence should be addressed.
Separations 2022, 9(1), 13; https://doi.org/10.3390/separations9010013
Submission received: 1 December 2021 / Revised: 5 January 2022 / Accepted: 8 January 2022 / Published: 11 January 2022
(This article belongs to the Section Materials in Separation Science)

Abstract

:
Escherichia coli are common pathogens, whereas E. coli O157:H7 is the most notorious E. coli strain, owing to its high virulence that can cause serious adverse effects and death. E. coli contains abundant peroxidases. Thus, the presence of E. coli can be determined by mixing E. coli with its substrate such as 3,5,3′,5′ tetramethylbenzidines (TMB) for endogenous peroxidase reactions. Under the presence of a high concentration of E. coli, colorless TMB turned to bluish, owing to the generation of the complexity of TMB and its oxidized TMB. To further reduce the detectable cell concentration, we developed an affinity-based method combined with an endogenous peroxidase reaction and mass spectrometric detection to detect E. coli. Affinity probes (diameter: ~20 µm) modified with maltose were generated for the enrichment of E. coli from sample solutions. E. coli trapped by the affinity probes was reacted with TMB in the presence of hydrogen peroxide for endogenous peroxidase reactions. Contactless atmospheric pressure ionization mass spectrometry was used for the detection of the reaction product, oxidized TMB (TMB cationic radical), to indicate the presence of target bacteria. The results showed that the developed method can be used to rapidly determine the presence of E. coli from a sample solution based on the detection of the TMB cationic radicals. The lowest detectable concentration of our method against E. coli O157:H7 in buffers and in complex juice samples was as low as ~100 cfu mL−1.

Graphical Abstract

1. Introduction

Enterohemorrhagic Escherichia coli (EHEC) strains, such as E. coli O157:H7, are bacterial pathogens associated with foodborne diseases [1,2]. EHEC can cause diarrhea and life-threatening complications, such as hemolytic uremic syndromes [3,4,5]. Outbreaks caused by E. coli O157:H7 have highlighted the necessity for rapid pathogen detection [6]. A polymerase chain reaction (PCR) [7,8] and immunoassays [9] are commonly used to detect pathogens including E. coli. Although polymerase chain reaction (PCR) is a sensitive method [10], it has time-consuming steps. False positives are found commonly in immunoassay-based methods [11]. Nevertheless, immunoassays are more accessible for point-of-care tests for bacterial detection than PCR. However, antibodies are expensive and vulnerable to environmental disturbance [12]. Thus, alternative methods that can be used to rapidly screen the presence of E. coli are needed.
Colorimetric methods [13] that can be easily examined by the naked eye and ultraviolet-visible (UV-Vis) absorption spectroscopy have attracted considerable attention. For example, Gram-negative bacteria, such as E. coli, possesses abundant peroxidases [14]. Under catalysis by peroxidases, colorless 3,5,3′,5′ tetramethylbenzidine (TMB) is converted into oxidized TMB with blue color in the presence of hydrogen peroxide [15,16] (Supplementary Materials (SM) Scheme S1). TMB is oxidized by losing one electron and forms a TMB cationic radical, which in turn forms a transfer complex with TMB and results in a blue color under acidic conditions (SM Scheme S1). Thus, bacterial endogenous peroxidase reactions in substrates, such as TMB, can cause a color change from colorless to blue, and this change is useful in detecting pathogenic bacteria, such as E. coli [17,18,19,20]. The limit of detection (LOD) values of the peroxidase-based method against E. coli O157:H7 were ~105 cfu mL−1 (naked eye) [18] and ~750 cfu mL−1 (UV-Vis absorption spectroscopy) [19]. Nevertheless, these approaches had no selectivity against E. coli.
In addition to colorimetric methods, a peroxidase reaction generates products that can be examined through mass spectrometry (MS). The reaction product at m/z of 240, oxidzed TMB (the cationic radical of TMB), can be easily distinguish from protonated TMB at m/z of 241 in the mass spectrum [20]. Given that MS is a sensitive detection tool, the LOD of Gram-negative bacteria can be quite low based on the detection of the ion peak at m/z 240. Nevertheless, detection of oxidized TMB at m/z 240 cannot be used to distinguish different Gram-negative bacteria because most Gram-negative bacteria possess abundant endogenous peroxidases [21,22]. Moreover, employing endogenous peroxidase reactions for the detection of Gram-negative bacteria in complex samples is challenging because non-target species in complex samples may cause false positives. Therefore, affinity-based methods that can be used in selectively enriching target bacteria from complex samples and removing interferences before endogenous peroxidase reactions are necessary for the identification of bacteria.
Multivalent carbohydrate-lectin interactions are involved in bacterial adherence and infection [23], and have thus been used in the development of affinity-based methods for bacterial identification [24] and infection prevention [25]. For example, E. coli O157:H7 possesses fimbria-like FimH [26], which has a high affinity with glycans, such as mannose [27]. In addition to mannose-binding sites, FimH can recognize glycan ligands containing glucose and fructose, owing to the similar chemical structures of these glycans. The dissociation constants (Kd) of FimH against mannose and glucose are ~2.3 µM and ~9.44 mM [28], respectively. Taking advantage of multivalent interactions and the glycan-lectin recognition feature, glycan binding-based affinity probes that can interact with fimbriae on E. coli have been developed [23,29,30]. Dextran is a polymer, made of glucose units. Kang et al. [31] demonstrated that dextran-immobilized probes have high affinity (Kd = ~11 nM) with E. coli O157:H7. The presence of many glucose units on the probes can enhance their affinity with FimH-containing bacteria to a great extent. In this study, we presented a straightforward method by modifying a gold-coated probe with maltosylated-cysteine (MALCY) for trapping E. coli strains, such as E. coli O157:H7, from complex samples, followed by peroxidase reactions by using TMB as the substrate. The reaction product (TMB cationic radical) was used as the report ion to indicate the presence of target bacteria and was characterized through contactless atmospheric pressure ionization (C-API) MS analysis [32,33,34], which only required a short and tapered capillary to direct a microliter-sized sample droplet through the capillary inlet to the outlet through capillary action. The sample eluents from the capillary outlet were readily ionized when the C-API capillary was placed close (~1 mm) to the inlet of the mass spectrometer subjected to a high voltage (e.g., −4.5 kV) and operated at the positive ion mode. The main advantages of using C-API-MS as the detection tool include low sample consumption, simplicity, and its ease of operation. Given that the ionization is operated at ambient conditions, the resultant reaction solution from the endogenous peroxidase reaction can be readily sampled by the short C-API capillary from its inlet to the outlet for CAPI ionization.

2. Experimental Section

The details of reagents, materials, and instrumentation are provided in SM.

2.1. Bacterial Endogenous Peroxidase Reactions

E. coli O157:H7, E. coli J96, E. coli JM109, E. coli HB101, E. coli UTI no.37, E. coli BOS117, Pseudomonas aeruginosa, Klebsiella pneumoniae, Acinetobacter baumannii, Staphylococcus aureus, Enterococcus faecalis, and Bacillus cereus were initially prepared in a phosphate-buffered saline (PBS) buffer (pH 7.5, 10 mM) with an optical density of 1 at a wavelength of 600 nm (OD600). The preparation of PBS buffer and the source of the model bacteria are provided in SI. The bacterial samples were serially diluted with a dilution factor of 10 with ammonium acetate buffer (pH 4.5, 10 mM). Hydrogen peroxide (2 µL, 100 mM) and TMB (1 mg mL−1, 2 µL) were added to the bacterial solution (0.2 mL), which was then left to stand at room temperature for 30 min. The product solution was 100-fold diluted with ethanol and deionized water (2:1, v/v) prior to C-API MS analysis.

2.2. Preparation of Affinity Probes

The details of synthesis purification, confirmation (SM Figure S1) of MALCY, and fabrication of gold-coated silica capillaries are described in SI. In the preparation of MALCY-immobilized probes (MALCY-probes), 10 gold-coated capillary tips were dipped in the MALCY solution (5 mM) prepared in the tris buffer (pH 7) for the generation MALCY-coated probes in a thermal shaker. The solution was shaken at 400 rpm at 30 °C for 12 h. The resultant probes were rinsed thoroughly by deionized water.

2.3. Bacterial Enrichment and Endogenous Peroxidase Reactions

Bacterial samples prepared in PBS buffer at pH 7.5 (OD600 of ~1) were serially diluted to a given concentration with a dilution factor of 10 with PBS buffer. The tip (~3 mm) of the as-prepared MALCY-immobilized probe was placed in individual bacterial samples (3 mL) under stirring at 300 rpm at room temperature for 1.5 h and then rinsed with PBS buffer (50 µL). The rinsed probe was placed in aqueous ammonium acetate (pH 4.5, 8 µL) and shaken at 600 rpm for 15 min for the removal of species trapped on the probe to the solution. The tip was removed, and H2O2 (100 mM, 1 µL) and (TMB 1 mg mL−1, 1 µL) were added to the solution for peroxidase reactions. After standing for 15 min, the resultant solution was 100-fold diluted with ethanol/deionized water solution (2:1, v/v) prior to C-API MS analysis.

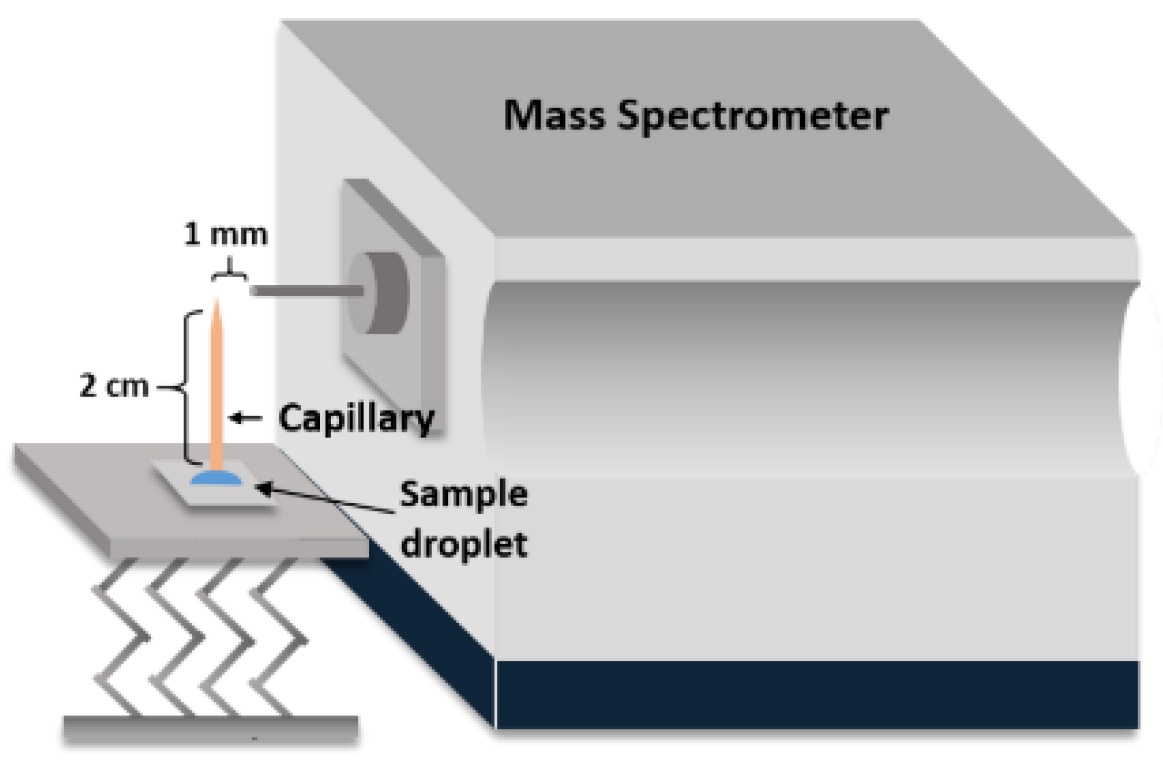
2.4. C-API MS Analysis

In C-API-MS analysis, a metal inlet (length: ~4 cm, inner diameter: ~1 mm, outer diameter: ~1.5 mm) was coupled to the orifice of the mass spectrometer. The voltage applied on the inlet of the mass spectrometer was −4.5 kV. The temperature of the ion transfer capillary was set at 200 °C. An aluminum metal plate (3 cm × 3 cm, thickness: ~2 mm) placed on a screw-driven adjustable stand in front of the mass spectrometer (Scheme 1) was used for the deposition of samples and running solvent for C-API-MS analysis. The tapered capillary (tip diameter: ~22–35 µm) with a length of ~2 cm was placed orthogonally on the metal plate. By adjusting the screw-driven stand placed in the metal plate, the inlet was immersed in a droplet (~5 µL) containing the running solvent deposited on the metal plate. The solvent through the capillary inlet quickly reached the capillary outlet through capillary action. C-API mass spectra were obtained immediately after the mass spectrometer was switched on. After solvent blank mass spectra were obtained, the metal plate was then moved, and the capillary inlet was immersed in the sample droplet (~5 µL). Mass spectra were recorded for 1 min after the mass spectrometer was switched on.

2.5. Analysis of Simulated Real Samples

For the preparation of simulated real samples, orange juice, obtained from a local shop, spiked with E. coli, was prepared. Orange juice was centrifuged at 6000 rpm for 10 min, and the supernatant was collected. The supernatant was centrifuged at 20,000 rpm for 10 min (×3) for the removal of precipitates. The resultant supernatant was 10-fold diluted with PBS buffer and then filtered with a member filter (cutoff: ~0.2 µm). E. coli O157:H7 was prepared in PBS to have an OD600 of 1. The bacterial sample was serially diluted with a dilution factor of 10 with PBS to given concentrations. Different amounts of E. coli O157:H7 (i.e., OD600 = 10−6–10−8, 0.3 mL) were spiked to the as-prepared orange juice samples (2.7 mL). Bacterial enrichment steps, peroxidase reactions, and C-API-MS analysis were similar to those described above. The resultant solution was diluted 100-fold by ethanol/deionized water (2:1) prior to C-API-MS analysis. For comparison, E. coli O157:H7 was prepared in ammonium acetate to have an OD600 of 1. The bacterial sample (10 µL) was serially diluted with different concentrations of E. coli, followed by spiking to the as-prepared orange juice samples (90 µL). In addition, artificial urine samples spiked with E. coli J96 were also prepared and used as the model samples. The details for preparing the simulated urine samples were provided in Additional Experimental Details in SI. The steps for conducting an endogenous peroxidase reaction and C-API-MS analysis were the same as those stated above.

3. Results and Discussion

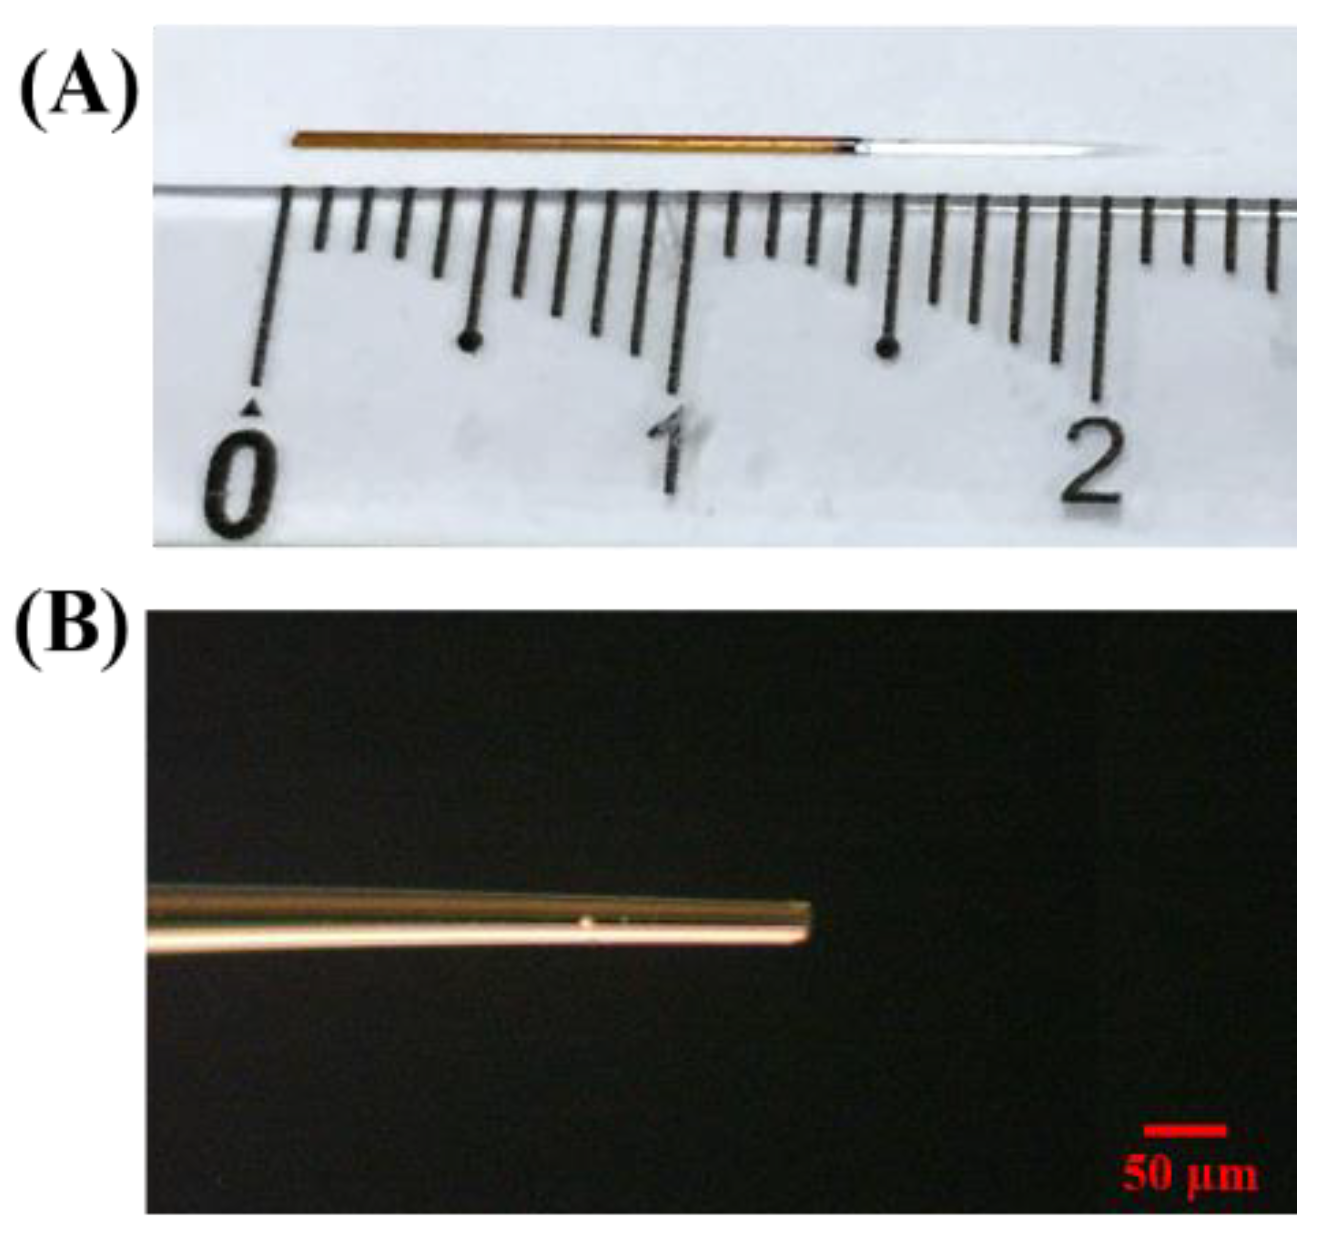
3.1. Characterization of Affinity Probes

A short and tapered capillary used as the ionization emitter in C-API-MS analysis was fabricated first. Figure 1A shows the photograph of the tapered capillary with a length of ~2 cm, in which the polymer coating on the sharp end (~0.5 cm) was removed during the tapering of the capillary with a burner. The diameter of the sharp end was ~20 µm. In the fabrication of the affinity probes, the sharp end of the capillary was further modified using a thin layer of gold and a metal sputter (Figure 1B). The surface of the resultant tip had a golden yellow color, indicating that a thin layer of gold had been successfully modified on the surface of the capillary.
We modified the surface of the gold-coated probe with MALCY through S–Au binding. The surface of the unmodified gold-coated probe was hydrophobic, as evidenced by the contact angle (CA). The CA of the surface of the unmodified probe was ~95°, which was observed after deposition with a droplet of deionized water (~4 µL; SM Figure S2A). As shown in SM Figure S2B, the CA of the gold-coated probe surface increased slightly from 95° to 110°, indicating that the surface remained hydrophobic. After MALCY was immobilized on the surface of the gold-coated probe, the CA was reduced to 65°, indicating that the surface became hydrophilic (SM Figure S2C). Given that MALCY is a polar molecule, the CA results indicated that MALCY had been successfully immobilized on the as-prepared probe. The surface of the probe was examined through IR absorption spectroscopy. SM Figure S2D shows the IR absorption spectra of the purified MALCY powder (blue line) and MALCY-immobilized probe (MALCY-probe; red line). The two spectra appeared similar, except that the bands at ~2548 cm−1 (blue line), which represented the stretching mode of the S–H bond [35], disappeared in the spectrum of the MALCY-probe (red line). The results suggested that MALCY bound to the probe through S–Au bonding.
The binding amount of MALCY on the probe was determined with a colorimetric method based on the use of the phenol–sulfuric acid method [36,37]. In the presence of a strong acid, such as sulfuric acid, carbohydrates form furfuraldehyde or its homologs, which can react with aromatic phenol to form colored products through polymerization or condensation. Given that the structure of MALCY contains one glucose unit, the amount of MALCY on the probe was determined on the basis of the sulfuric acid–phenol reaction. A calibration curve, obtained using glucose as the standard and sulfuric acid–phenol reaction as the method, was obtained first. Figure S3A shows the representative photograph of the sample vials containing glucose at different concentrations after the reaction with sulfuric acid and subsequent addition of phenol. To determine whether the presence of gold-coated probes affects the reaction in the assay, we added three gold-coated probes to each vial. The presence of the gold-coated probes did not apparently affect the results, that is, no apparent color change was found in the sample without glucose (the first one from the left in Figure S3A). Three replicates were conducted. SM Figure S4A,B show the other two replicates of the sample in SM Figure S3A. The color of the solution became darker as the concentration of glucose increased. SM Figure S3B shows the corresponding absorption spectra of the samples in Figure S3A, whereas SM Figure S5A,B show the corresponding UV-Vis absorption spectra of the samples in SM Figure S4A,B, respectively. Figure S3C shows the calibration curve obtained by plotting the absorbance at 485 nm against the concentration of glucose, according to the results obtained in Figure S3B. The linear dynamic range was determined between 5 and 354 µg mL−1 (inset calibration plot (Y = 0.01436X + 0.05106, R2 = 0.9990)). Furthermore, three MALCY-probes were treated using the same sulfuric acid–phenol reaction in the same vial. The tip (length: ~8 mm) was immersed in the reaction solution. Three replicated experiments were conducted. SM Figure S3D shows the resultant UV-Vis absorption spectra, whereas the inset shows the photograph of the resultant samples. According to the results obtained from the three replicates, 88 ± 4 nmol of MALCY was modified on the three probes. That is, ~29 nmol of MALCY was immobilized on one probe. The results showed that MALCY was successfully immobilized on the surface of the probe.

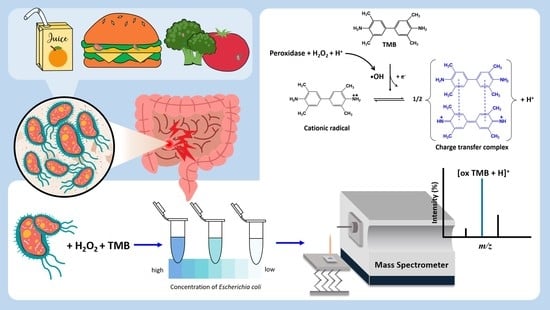
3.2. Direct Analysis of the Products Derived from Horseradish Peroxidase Enzymatic Reaction by C-API-MS

Owing to its simplicity and small sample consumption, C-API-MS was used in the detection of reaction products derived from horseradish peroxidase (HRP)-based peroxidase reactions using TMB as the substrate in the presence of H2O2. SM Figure S6 shows the resultant C-API mass spectrum of the 100-fold diluted reaction product obtained after 15 min of reaction. The mass spectrum was dominated by the ion at m/z of 240, which was derived from the TMB cationic radical. It was not surprising that the senstivity was quite high because TMB cationic radicals are pre-charged ions and can be readily detected by MS through the CAPI processes. The results indicated that the reaction product (TMB cationic radicals) can be detected by C-API-MS and can be used as a marker ion to indicate the occurrence of a peroxidase reaction.

3.3. Direct Analysis of Bacterial Endogenous Peroxidase-Based Reaction Products by C-API-MS

According to the results shown in SM Figure S6, the ion at m/z 240 derived from oxidized TMB, obtained from a peroxidase reaction, can be used to indicate the presence of peroxidases when TMB is used as the substrate. Thus, the oxidized TMB at m/z 240 can be used as a report ion to indicate the presence of a model bacterium (e.g., E. coli) containing abundant endogenous peroxidases. We selected E. coli O157:H7 as the model bacterium to demonstrate the feasibility of using this approach in indicating the presence of the model bacteria. Figure 2A shows the photographs of the samples obtained after the incubation of E. coli O157:H7 at different cell concentrations with H2O2 and TMB for 30 min. Apparently, only the sample with the highest cell concentration at OD600 of ~1 showed a blue color after the reaction. The E. coli O157:H7 suspension with an OD600 of ~1 was ~3.6 × 10⁸ cfu mL−1, according to the plate-counting results. Thus, the detectable concentration of E. coli O157:H7 by the naked eye was ~3.6 × 10⁸ cfu mL−1, based on the bacterial endogenous enzyme reactions. The results indicated that using the endogenous peroxidase reaction with TMB in the examination of results of the naked eye observation was limited. We further used C-API-MS to analyze the reaction product. Figure 2B–H show the corresponding mass spectra of the samples as shown in Figure 2A. The ion at m/z 241 corresponded to the protonated TMB, whereas the ion peak at m/z 240 corresponded to the oxidized TMB. As the E. coli O157:H7 concentration was reduced, the intensity of the ion peak at m/z 240 was reduced relative to that at m/z 241. Moreover, the relative intensities of the ion peaks at m/z 240 to 241 obtained from the blank without containing E. coli O157:H7 (Figure 2I) appeared similar to those shown in Figure 2H. A weak ion peak at m/z of 240 in the blank sample was observed in the spectrum, owing to the slight oxidation of TMB (Figure 2I). Accordingly, the lowest detectable E. coli O157:H7 cell concentration by C-API-MS was OD600 of ~10−5 (Figure 2G), indicating that a detectable cell concentration by C-API-MS was considerably lower than that obtained through the naked eye.

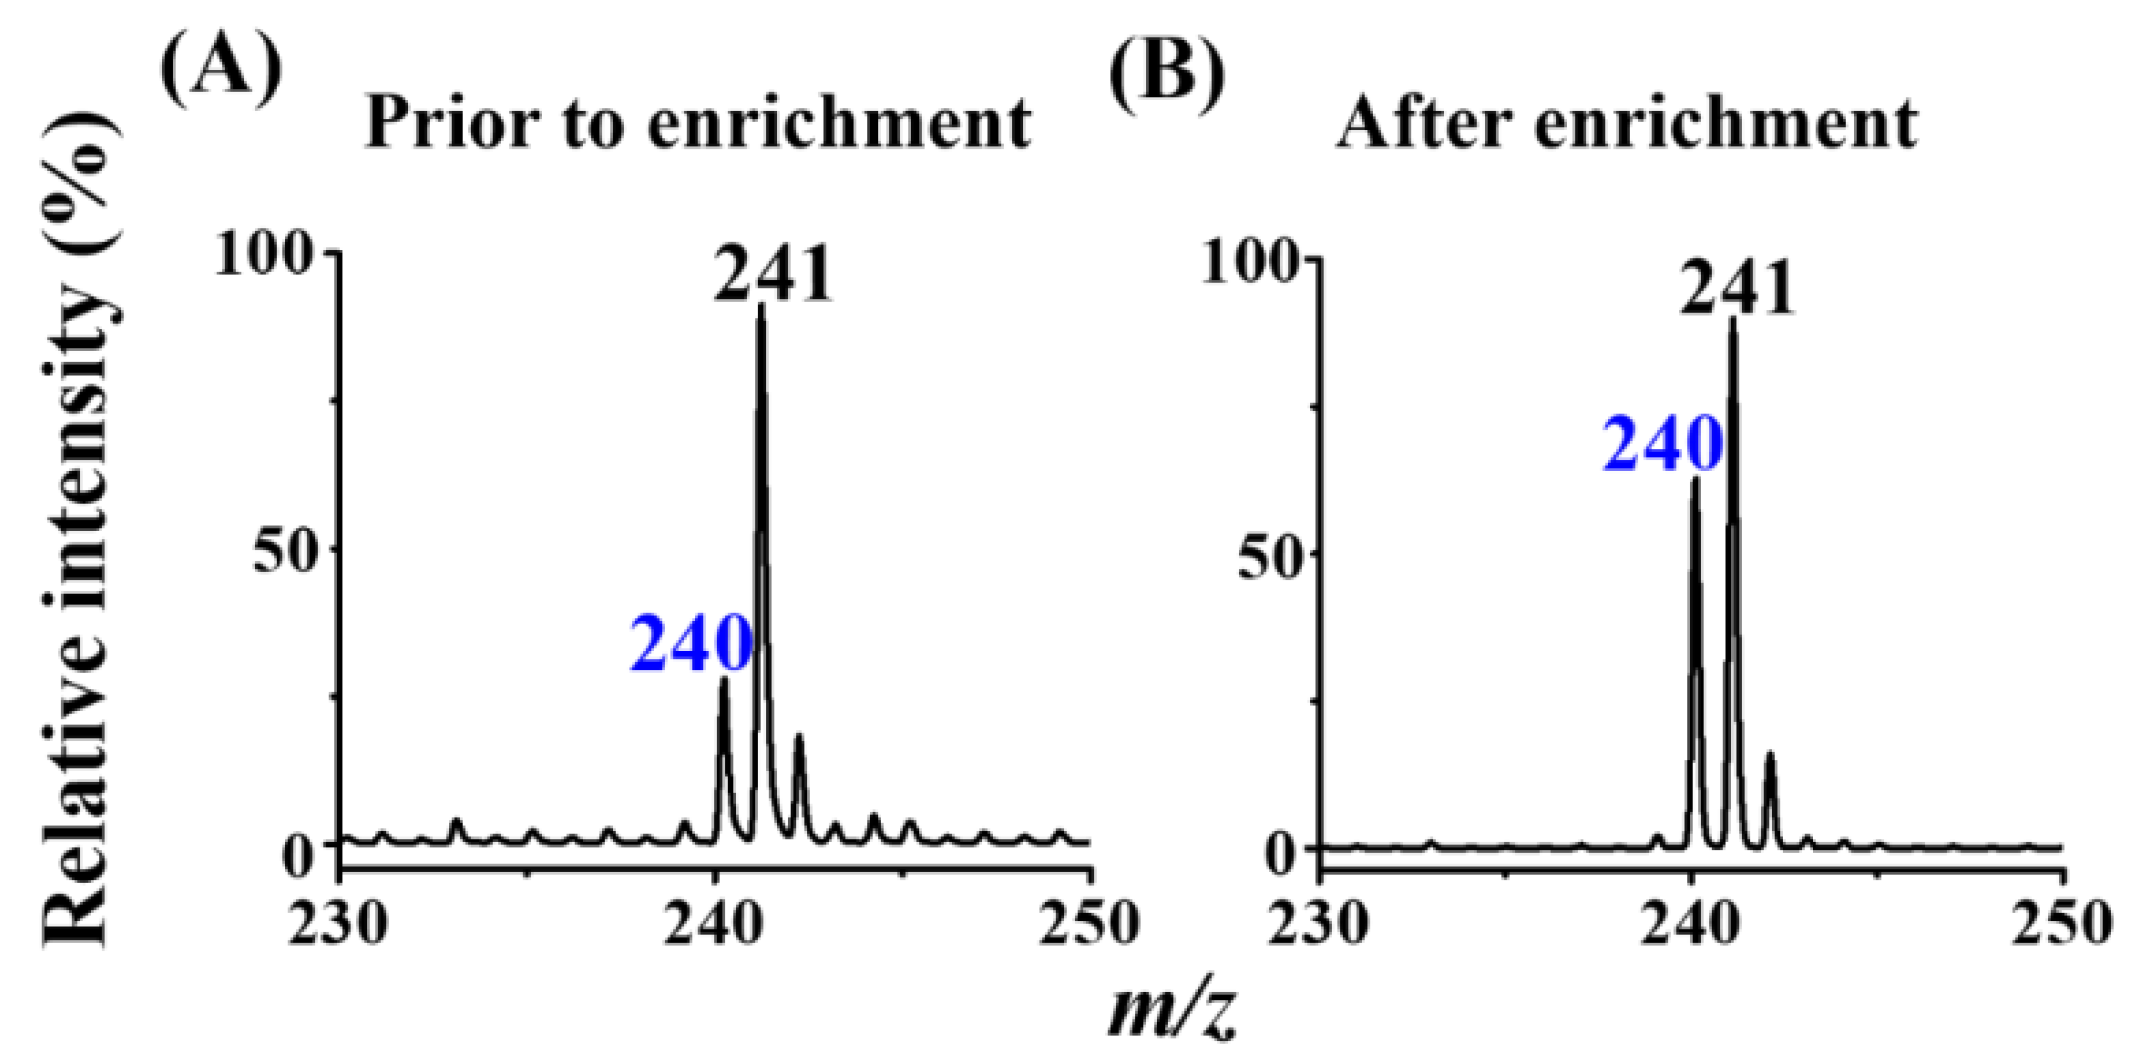
3.4. Enrichment of Target Bacteria by the MALCY-Probe

According to the abovementioned results, using MS as the detecting tool can detect E. coli O157:H7 with the concentration of five orders of magnitude lower than that examined by the naked eye detection. Nevertheless, to further lower the detectable cell concentration and to improve the selectivity of the approach in identifying bacteria, we further explored the MALCY-probe-based affinity method combined with C-API MS analysis. E. coli O157:H7 was still selected as the model bacterium. Figure 3A shows the resultant mass spectrum of the sample containing E. coli O157:H7 (OD600 = ~10−6), obtained after endogenous peroxidase reactions, before enrichment. A low-intensity peak at m/z 240 was derived from oxidized TMB. The intensity was similar to the one we obtained from the blank sample (cf. Figure 2I). Figure 3B shows the mass spectrum of the sample obtained after we used the MALCY-probe to enrich target species from the sample (3 mL) containing E. coli O157:H7 (OD600 = ~10−6), followed by releasing the trapped species from the probe for endogenous peroxidase reactions. The intensity of the ion peak at m/z 240 apparently increased (Figure 3B), relative to that in Figure 3A. SM Figure S7A–D show the other four replicates of the sample in Figure 3B. The results were similar to the result we obtained in Figure 3B. Given that the oxidized TMB interacted with TMB to form charge transfer complexes (SM Scheme S1), the ions at m/z 241 and 240 resulting from the protonated TMB and oxidized TMB, respectively, existed together in the product solution and appeared in the same mass spectrum. Thus, the ion intensity at m/z 241, corresponding to the protonated TMB, still dominated the mass spectrum after enrichment and subsequent peroxidase reactions. In addition, given that bacterial serial dilution may have some operation errors, we conducted plate-counting on the samples used for obtaining SM Figure S7A–D to determine the cell concentrations of the as-prepared bacterial samples (SM Figure S7E–H). Three replicates were cultured from each bacterial sample. Approximately 130 colonies were found on the agar plate after the culturing of the as-prepared bacterial sample (0.1 mL) overnight. That is, the cell concentration in the as-prepared bacterial sample was ~1.3 × 10³ cfu mL−1. The results showed that the MALCY-probe can be used to enrich trace E. coli O157:H7 from the sample solution and further lowered the detectable cell concentration of E. coli O157:H7 to ~1.3 × 10³ cfu mL−1.

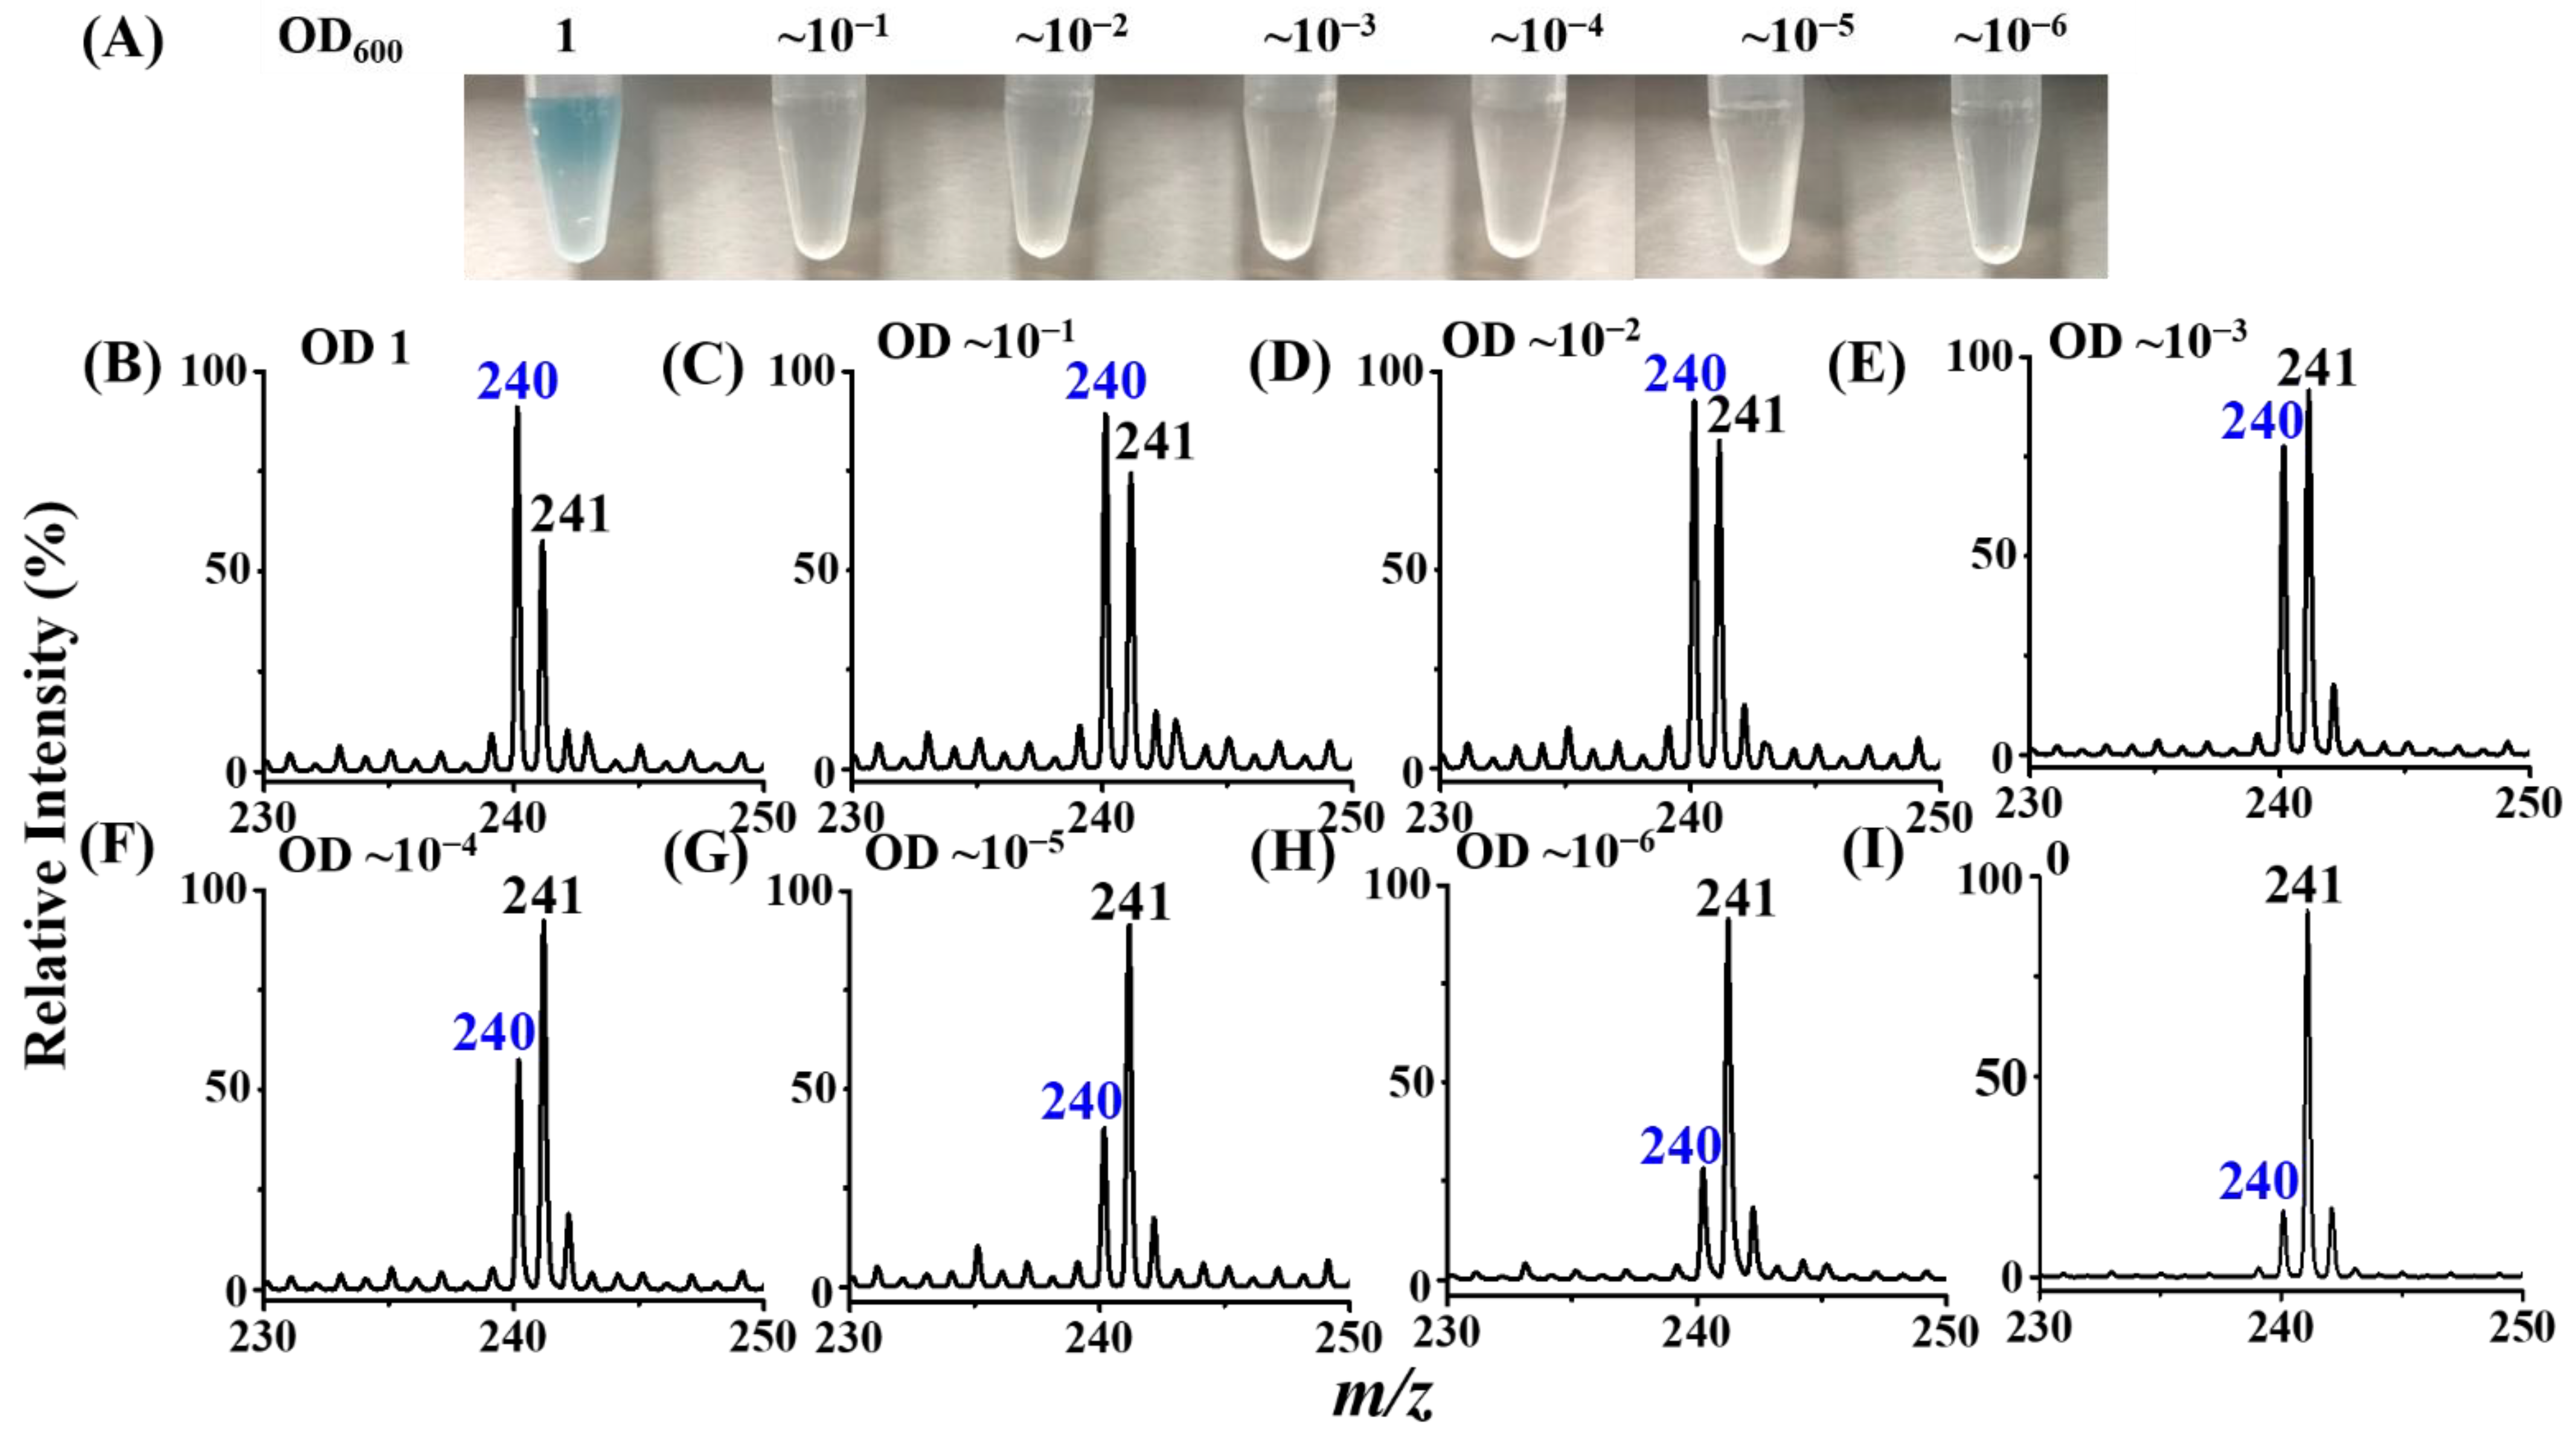
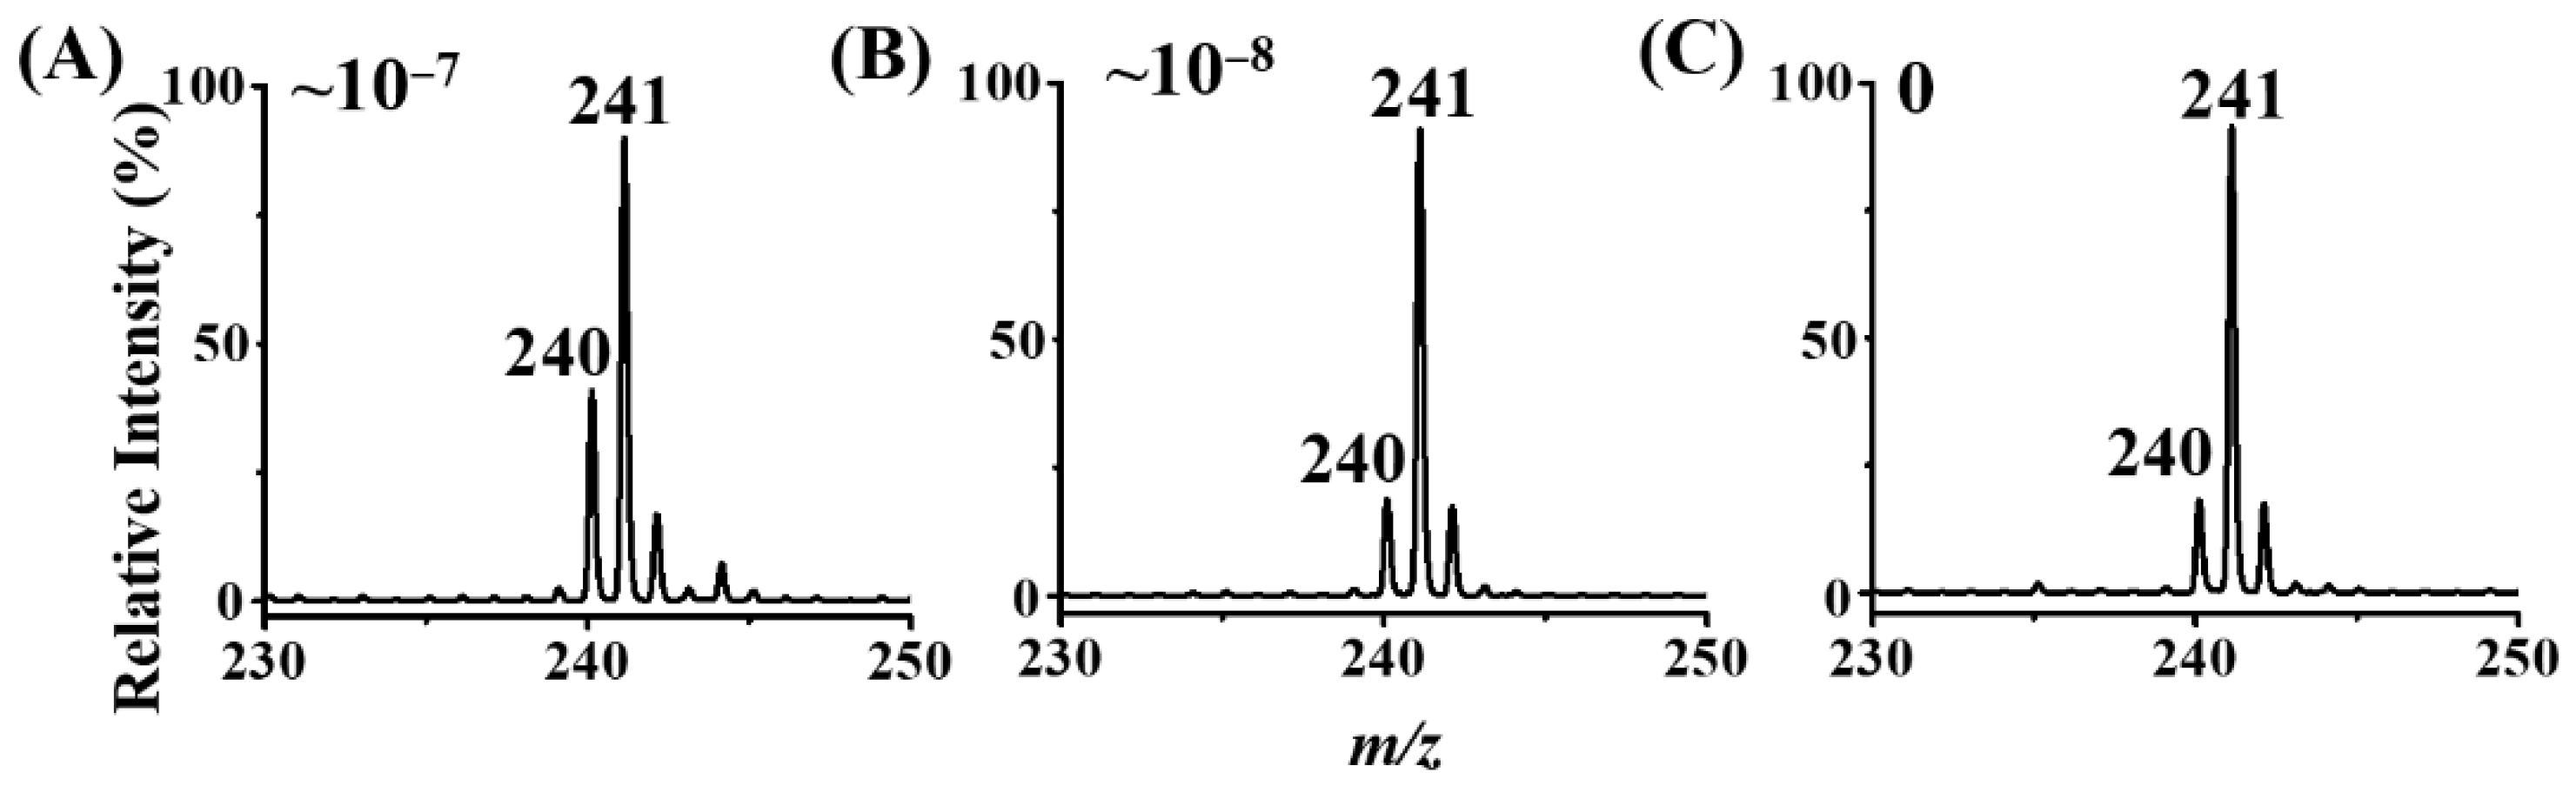
3.5. Examination of LOD

We further examined the LOD of our method against E. coli O157:H7. SM Figure S8A–C show the resultant mass spectra of the samples obtained by using the MALCY-probes to trap the samples (3 mL) containing E. coli O157:H7 with different concentrations of OD600 of ~10−7, ~10−8, and 0, respectively. Then, bacteria trapped on the probes were released for endogenous peroxidase reactions. The ion intensity at m/z 240, derived from oxidized TMB, decreased with the concentration of the target bacteria. The relative ratio of the ion intensity at m/z 240 to 241 in SM Figure S8B was still higher than in the blank sample (SM Figure S8C). SM Figure S9A–D show the four replicates of the experiments shown in SM Figure S8A, whereas SM Figure S10A–D show the four replicates of the experiments shown in SM Figure S8B. The results shown in SM Figures S9A–D and S10A–D were similar those shown in SM Figure S8A,B, respectively. To determine the cell concentration of the samples used in SM Figures S9A–D and S10A–D, plate-counting was performed (SM Figures S9E–H and S10E–H). The average cell counts in SM Figures S9E–H and S10E–H were ~30 and ~11, respectively. Owing to only 0.1 mL of the bacterial sample inoculated on each agar plate for overnight culture, the cell concentration of the samples in SM Figures S9A–D and S10A,B were ~300 and ~110 cfu mL−1, respectively. SM Figure S11 shows the resultant mass spectra of the blank samples from four replicates. SM Figure S12 shows the summarized results obtained by plotting the ratio of the intensity of the ion at m/z 240 against the sum of the ion intensities at m/z 240 and 241, obtained from SM Figures S7 and S9–S11. Given that the ratio of the sample with a concentration of ~110 cfu mL−1 (shown on the Y axis in SM Figure S12) was slightly higher than the data obtained from the blank, the LOD of our method against E. coli O157:H7 was ~110 cfu mL−1. Our method was comparable with sensitive methods, such as ELISA [9] and fluorescence methods [38], and was better than some existing methods [7,8,9,39,40,41] (SM Table S1). Moreover, the sample pretreatment of our method only took ~2 h, which was shorter than the analysis time in most methods (SM Table S1). The enrichment steps took most of the analysis time. MS analysis only required a few seconds. The main advance of the developed affinity method is that target bacteria can be selectively trapped from complex samples by the as-prepared affinity probes and detected by the high sensitivity and speed C-API-MS by using the ion at m/z 240, derived from the TMB cationic radical, as the reporter ion.

3.6. Analysis of Different E. coli Strains

We further examined whether this method is effective in detecting different E. coli strains. Different E. coli strains, including E. coli BOS117, E. coli UTI No 37, E. coli JM109, E. coli HB101, and E. coli J96, were selected as the model bacteria. The experimental steps were similar to those used for obtaining the results in Figure 3. Figure 4A shows the photograph of the results obtained by reacting different E. coli strains (OD600 of ~1) with TMB in the presence of H2O2 for endogenous peroxidase reactions. All the samples showed a blue color. Figure 4B–F show the mass spectra of the samples containing E. coli BOS117, E. coli UTI No 37, E. coli JM109, E. coli HB101, and E. coli J96, respectivly, with OD600 of ~10−6 after endogenous peroxidase reactions. The ion at m/z 241 derived from the protonated TMB dominated the mass spectra, whereas a weak peak at m/z 240 was observed in the same mass spectra. After enrichment, the ion intensity at m/z 240 in all of the mass spectra apparently increased (Figure 4G–K). The results indicated that our approach is suitable for enriching E. coli strains. Presumably, these E. coli strains possess different glycan-binding moieties. Given that glucose structure is similar to other glycans, multivalent interactions between glucose units on the MALCY-probe and these E. coli strains might have been involved in the binding. The results indicated that our method is effective in detecting these E. coli strains. However, our method cannot be used in distinguishing different E. coli strains.

3.7. Examination of Selectivity

Given that most Gram-negative bacteria contain abundant peroxidases [42], we further determined whether our method can be used in detecting other Gram-negative bacteria. Gram-negative bacteria, including P. aeruginosa, K. pneumoniae, and A. baumanii, were selected as the model samples. SM Figure S13A shows the photograph of the sample vials containing P. aeruginosa, K. pneumoniae, and A. baumanii (OD600 of ~1) obtained after endogenous peroxidase reactions. The sample containing P. aeruginosa had the most intensive blue color, indicating that the concentration of peroxidases in P. aeruginosa was the highest. However, the sample containing K. pneumoniae only showed a pale blue color, indicating that the amount of peroxidases in this bacterium was low. SM Figure S13B–D show the C-API mass spectra of the resultant peroxidase reaction solutions derived from P. aeruginosa, K. pneumoniae, and A. baumanii (OD600 of ~10−5), respectively, obtained after the addition of H2O2 and TMB for endogenous peroxidase reactions before enrichment. A weak peak at m/z 240 was observed in the resultant mass spectra. SM Figure S13–G show the C-API mass spectra of the sample containing P. aeruginosa, K. pneumoniae, and A. baumanii (OD600 of ~10−5), respectively, obtained after the samples were enriched and released from the probe for endogenous peroxidase reactions. The mass spectral profiles in Figure S13E–G were similar to those shown in Figure S13B–D. That is, the MALCY-probe was unable to enrich the Gram-negative bacteria. Thus, the ion at m/z 240 did not increase after enrichment, followed by endogenous peroxidase reactions. The results indicated that the MALCY-probe had no trapping capacity for these Gram-negative bacteria. Namely, the MALCY-probe has selectivity towards E. coli and can be used to distinguish E. coli from other Gram-negative bacteria.
Furthermore, we used Gram-positive bacteria, including S. aureus, B. cereus, and E. faecalis, as the model samples to determine whether our method can be used in distinguishing E. coli from these bacteria. Figure S14A shows the photograph of the samples containing S. aureus, B. cereus, and E. faecalis (OD600 of ~1) after the reaction with TMB in the presence of H2O2. Apparently, the samples were colorless, and some bubbles were observed in the sample tube containing S. aureus. S. aureus contained abundant catalases, reacted with H2O2, and generated oxygen and water [43]. Moreover, the Gram-positive bacteria did not contain sufficient peroxidases for catalyzing peroxidase reactions for TMB oxidation. SM Figure S14B–D show the mass spectra of the three bacterial samples obtained without enrichment (OD600 of ~10−5) in the presence of H2O2 and TMB. The ion peak at m/z 241, derived from protonate TMB, dominated the mass spectra, whereas only a very weak ion peak at m/z 240 was observed in the mass spectra obtained after enrichment (SM Figure S14E–G). After enrichment, the mass spectra still appeared similar to those obtained without enrichment. The results suggested that our probe was incapable of enriching the model Gram-positive bacteria. That is, our method can be used to distinguish E. coli from these Gram-positive bacteria.

3.8. Analysis of Bacteria in Simulated Real Samples

To determine whether our method worked well for real-world samples, orange juice samples were prepared for the examination. E. coli O157:H7 was used as the model bacterium and spiked in the as-prepared orange juice samples. Figure 5A–C show the resultant mass spectra of the orange juice containing E. coli at different concentrations in terms of OD600 values of ~10−7, ~10−8, and 0 (blank), respectively, which were obtained after using our enrichment method and subsequent peroxidase reactions. An ion peak at m/z 240 was clearly observed in the mass spectrum in Figure 5A. The ion intensity at m/z 240 in Figure 5B was similar to that shown in Figure 5C. Four more replicates were conducted for the same experiments (SM, Figures S15–S17). SM Figure S18 shows the mass spectra from the four replicates of the blank sample in Figure 5C. SM Figure S19 shows the summarized results by plotting the ratio of the intensity at m/z 240 against the sum of the intensities of the ion peaks at m/z 241 and 240 from SM Figures S15–S18. The ratio, i.e., ~0.2, obtained from the samples containing E. coli O157: H7 with the concentration of ~100 cfu mL−1, was apparently different from that obtained from the blank samples with the ratio of ~0.1. The results indicated that our method can work for complex orange juice samples. Moreover, the lowest detectable concentration, i.e., ~100 cfu mL−1, was similar to that we obtained in the samples prepared in buffers.
In addition, we also prepared artificial urine samples [44] spiked with E. coli J96, which is a pathogen commonly found in urinary tract infections [45], as the simulated real samples to further demonstrate the feasibility of using the developed method for complex samples. SM Figure S20A–C show the resultant mass spectra of the 100-fold diluted urine samples containing E. coli J96 with different concentrations of OD600 of ~10−7, ~10−8, and 0 (blank), respectively, obtained after using our enrichment method, followed by peroxidase reactions. The results showed that the ion peak at m/z 240 was clearly observed in the mass spectrum in SM Figure S20A. The ion intensity at m/z 240 in Figure S20B was very similar to that shown in Figure S20C. The results indicated that our method can be used to detect E. coli J96 with the concentration as low as OD600 of 10−7, similar to the results obtained in Figure 5.
These results indicated that the interference of the complex matrix in the juice and artificial urine samples and the ionization efficiency of oxidized TMB were not affected much on the results when using our method for the analysis of the E. coli spiked complex samples. The main reason was that our method was not used to directly detect molecules derived from the bacterial cells. Oxidized TMB at m/z 240, derived from the bacterial endogenous peroxidase reaction, was alternatively used as the marker ion to indicate the presence of target bacteria, i.e., E. coli.

4. Conclusions

We have sucessfully used an affinity-based approach, combined with endogenous peroxidase reactions and mass spectrometric detection, in identifying trace E. coli (≥~100 cfu mL−1) from sample solutions. The detectable concentration is comparable with the exisiting methods, and the analysis time is shorter than most of the methods (SM Table S1). Given that overnight culture is not required, the analysis time is shortened to ~2 h. Further improvement of the developed method should be focused in accelerating enrichment processes to reduce the analysis time. The current method can be used in distinguishing E. coli from other bacteria, including Gram-negative and Gram-positive bacteria. On the basis of its high sensitivity and short analysis time, the developed method should be potentially useful for rapid screening of the presence of E. coli from contaminated food samples and biological fluids from patients with bacterial infections. Nevertheless, different E. coli strains cannot be distinguished by the current method. Given that the virulence of different E. coli strains varies, identifications of different bacterial strains will be useful in medical treatments. Thus, further efforts should be devoted for the development of analytical methods that can be used in distinguishing different E. coli strains, although it will be quite challenging for a screening method. Nevertheless, the metabolites derived different E. coli strains may be different. Thus, it may be possible to determine different E. coli strains based on specific biomarker ions derived from metabolites appearing in the mass spectra. However, futher studies should be carried out to investigate the possibility.

Supplementary Materials

The following supporting information can be downloaded at: https://www.mdpi.com/article/10.3390/separations9010013/s1, Scheme S1: Peroxidase reaction by using TMB as the substrate in the presence H2O2 [2]; Figure S1: (A) LC chromatogram of the product derived from the Maillard reaction obtained by reacting cysteine and maltose with a mole ratio of 1/3 at 120 oC, monitored the wavelength at 210 nm by a photodiode array detector. ESI mass spectra of the reaction product obtained (B) before and (C) after purification by LC; Figure S2: Photograph of the contact angles (CA) examined on the surfaces of (A) the unmodified capillary probe, (B) the gold-coated probe, and (C) the MALCY immobilized probe by depositing with a droplet of water (~4 μL). The inset photographs show the zoom-in pictures of the droplets on the as-prepared capillaries. (D) Infrared absorption spectra of the MALCY powder (blue line) and the MALCY-probe (red line). The characteristic bands derived from S-H at 2548 cm−1 no longer appeared in the spectrum of the MALCY-probe (red line). The band at 866 cm−1 were contributed by C-S stretching vibration mode. In addition, the characteristic band at 1581 cm−1 corresponded to asymmetric stretching C=O. The sharp peak at 1024 cm−1 was assigned to C–O single bond stretching of the C–O–C group. The band at ~3330 cm−1 corresponded to the stretching mode of OH group, and the band at 2920 cm−1 was assigned to stretching vibrations of C-H group in the glucose unit. The absorption band at 1147 cm−1 was assigned to weak C–O stretching mode from glycosidic bond; Figure S3: (A) Photograph of the sample containing glucose (5–2836 μg mL−1, 0.2 mL) in the presence of 3 gold-coated probes obtained after reaction with sulfuric acid (18.4 M, 0.5 mL) followed by reaction with phenol (5.3 M, 5 μL) in an ice bath for 5 min and cooling down at room temperature for 10 min. (B) The corresponding UV-Vis absorption spectra of the samples shown in Panel A. (C) Calibration curve obtained by plotting the absorbance at 485 nm versus the concentration of glucose (5–2836 μg mL−1) according to the results obtained in Panel B, Figure S5. The inset shows the linear dynamic range for the concentration range of glucose from 5 to 354 μg mL−1. (D) UV-Vis absorption spectra the aqueous solution (0.2 mL) inserting with 3 MALCY-probes and reaction with sulfuric acid (18.4 M, 0.5 mL) and phenol (5.3 M, 5 μL) for 5 min in an ice bath and cooling down at room temperature for 10 min. Three replicates were shown in Panel D. The inset shows the photograph of the resultant sample from three replicates; Figure S4: Two other replicates of the samples in Figure S3A; Figure S5: Corresponding UV-Vis absorption spectra of the samples shown in (A) Figure S4A and (B) Figure S4B; Figure S6: C-API mass spectrum of the sample obtained by using HRP to catalyze the peroxidase reaction of the sample containing TMB in the presence of H2O2. The resultant reaction sample was 100-fold diluted with ethanol/deionized water (2:1, v/v) prior to C-API-MS analysis. The inset image shows the photograph of the resultant sample obtained after reaction; Figure S7: (A, B, C, and D) Four replicated experimental results for the sample in Figure 3B. (E, F, G and H) Photographs of the plate counting results derived from samples used to obtain Panels A, B, C and D. The bacterial samples (0.1 mL) were individually cultured on LB agar plate for overnight. Three replicates of overnight culture of each sample were performed for each sample; Figure S8: C-API mass spectra of the samples obtained by using the MALCY-probes to enrich target species from the samples containing E. coli O157:H7 with the concentrations of (A) OD600 of ~10−7, (B) ~10−8, and (C) 0, followed by releasing the bacteria from the probe for subsequent endogenous peroxidase reactions. The resultant samples were 100-fold diluted with ethanol/deionized water (2:1, v/v) prior to C-API-MS analysis. One droplet (5 μL) of the resultant samples were used for C-API-MS analysis; Figure S9: (A, B, C, and D) Four replicated experimental results of the sample in Figure S8A. (E, F, G, and H) Photographs of the plate counting results derived from samples used to obtain Panels A, B, C and D. The bacterial samples (0.1 mL) were individually cultured on LB agar plate for overnight. Three replicates of overnight culture of each sample were performed for each sample; Figure S10: (A, B, C, and D) Four replicated experimental results of the sample in Figure S8B. (E, F, G and H) Photographs of the plate counting results obtained from overnight culture of the four samples used for obtaining Panels A, B, C, and D. The bacterial samples (0.1 mL) were individually cultured on LB agar plate for overnight. Three replicates of overnight culture of each sample were performed for each sample; Figure S11: (A, B, C, and D) The resultant mass spectra of the blank samples from four replicates; Figure S12: Examination of the variations of the ratio of the intensity of the ion peak at m/z 240 to the sum of the ion intensity at m/z 240 and m/z 241 versus the bacterial concentration. The results were obtained from 4 replicates shown in Figures S7, S9, and S10, and S11; Figure S13: (A) Photograph of the samples (0.2 mL) containing P. aeruginosa (PA), K. pneumonia (KP), and A. baumannii (AB) at the concentrations of OD600 of ~1 obtained after conducting endogenous peroxidase reaction. C-API mass spectra of the bacterial samples containing (B) P. aeruginosa, (C) K. pneumonia, and (D) A. baumannii with the concentration of OD600 of ~10−5 obtained after peroxidase reactions prior to enrichment. C-API mass spectra of the samples obtained by using the MALCY-probes to enrich target species from the samples (3 mL) containing (E) P. aeruginosa, (F) K. pneumonia, and (G) A. baumannii with the concentrations of OD600 of ~10−5 followed by releasing the bacteria from the probe and conduction of endogenous peroxidase reactions. The resultant samples were 100-fold diluted with ethanol/deionized water (2:1, v/v) prior to C-API-MS analysis. One droplet (5 μL) of the resultant samples were used for MS analysis; Figure S14: (A) Photograph of the bacterial samples (0.2 mL) containing S. aureus (SA), B. cereus (BC), and E. faecalis (EF) with the concentration of OD600 of ~1 prepared in ammonium acetate (10 mM, pH 4.5) with the addition of H2O2 (100 mM, 2 μL) and TMB (1 mg mL−1, 2 μL). C-API mass spectra of the bacterial samples (0.2 mL) with the concentration of OD600 of ~10−5 containing (B) S. aureus, (C) B. cereus, and (D) E. faecalis prepared in ammonium acetate (10 mM) at pH 4.5 with the addition of H2O2 (100 mM, 2 μL) and TMB (1 mg mL−1, 2 μL). C-API mass spectra of the bacterial samples (3 mL) containing (E) S. aureus, (F) B. cereus, and (G) E. faecalis with the concentration of OD600 of ~10−5 prepared in the phosphate buffered saline (PBS) buffer (10 mM, pH 7.5) obtained after enriched by MALCY-probe followed by releasing the bacteria from the probe to the ammonium acetate buffer (pH 4.5, 8 μL) followed by the addition of H2O2 (100 mM, 1 μL) and TMB (1 mg mL−1, 1 μL). PBS buffer was prepared by dissolving sodium chloride (1 g), potassium chloride (25 mg), sodium phosphate dibasic heptahydrate (340 mg), and potassium phosphate monobasic (30 mg) in deionized water (100 mL). The samples were incubated for 15 min at room temperature. A droplet of sample (5 μL) was used for MS-analysis. All the resultant samples were 100-fold diluted with ethanol/deionized water (2:1, v/v) prior to the C-API-MS analysis; Figure S15: (A, B, C, and D) C-API mass spectra of the samples obtained by using the MALCY-probe to trap target species from the orange juice samples (3 mL) spiked with E. coli O157:H7 at the concentration OD600 of ~10−6 followed by releasing the trapped bacteria in ammonium acetate (pH 4.5, 8 μL) under shaking for 15 min and subsequent peroxidase reaction with the addition H2O2 (100 mM, 1 μL) and TMB (1 mg mL−1, 1 μL) for another 15 min prior to MS analysis. (E, F, G, and H) Photographs obtained from three replicates of the plate counting results obtained from overnight-culture of the samples used in Panels A, B, C, and D. The bacterial samples (0.1 mL) were individually cultured on LB agar plate for overnight; Figure S16: (A, B, C and D) C-API mass spectra of the samples obtained by using the MALCY-probe to trap target species from the orange juice samples (3 mL) spiked with E. coli O157:H7 at the concentration OD600 of ~10−7 followed by releasing the trapped bacteria in ammonium acetate (pH 4.5, 8 μL) under shaking for 15 min and subsequent peroxidase reaction with the addition H2O2 (100 mM, 1 μL) and TMB (1 mg mL−1, 1 μL) for another 15 min prior to MS analysis. (E, F, G and H) Photographs obtained from three replicates of the plate counting results obtained from overnight-culture of the samples used in Panels A, B, C, and D. The bacterial samples (0.1 mL) were individually cultured on LB agar plate for overnight; Figure S17: (A, B, C, and D) C-API mass spectra of the samples obtained by using the MALCY-probe to trap target species from the orange juice samples (3 mL) spiked with E. coli O157:H7 at the concentration OD600 of ~10−8 followed by releasing the trapped bacteria in the ammonium acetate buffer (pH 4.5, 8 μL) under shaking for 15 min and subsequent peroxidase reaction with the addition H2O2 (100 mM, 1 μL) and TMB (1 mg mL−1, 1 μL) for another 15 min prior to MS analysis. (E, F, G and H) Photographs obtained from three replicates of the plate counting results obtained from overnight-culture of the samples used in Panels A, B, C, and D. The bacterial samples (0.1 mL) were individually cultured on LB agar plate for overnight; Figure S18: (A, B, C, and D) C-API mass spectra of the 4 replicated samples obtained by using the MALCY-probe to trap target species from the orange juice samples (3 mL) without spiked with E. coli O157:H7 followed by peroxidase reaction with the addition H2O2 (100 mM, 1 μL) and TMB (1 mg mL−1, 1 μL) for another 15 min prior to MS analysis; Figure S19: Examination of the variations of the ratio of the ion intensity at m/z 240 to the sum of the ion intensity at m/z 240 and 241 versus the bacterial concentration obtained from the results shown in Figure S15, S16, S17, and S18; Figure S20: C-API mass spectra of the simulated urine samples (3 mL) containing E. coli J96 with the concentrations of OD600 of (A) ~10−7, (B) ~10−8, and 0 prepared in PBS buffer (10 mM, pH 7.5) obtained after enriched by MALCY-probe followed by releasing the bacteria trapped on the probe to ammonium acetate buffer (pH 4.5, 8 μL) under shaking for 15 min, followed by addition H2O2 (100 mM, 1 μL), and TMB (1 mg mL−1, 1 μL) and standing for another 15 min prior to MS analysis. The resultant samples were 100-fold diluted with ethanol/deionized water (2:1, v/v) prior to C-API-MS analysis. One droplet of the resultant samples (5 μL) were used for MS analysis; Table S1: Comparison of the current method with the existing methods for detection of E. coli.

Author Contributions

Conceptualization, Y.-C.C.; Data curation, J.N.S.; Formal analysis, J.N.S.; Funding acquisition, Y.-C.C.; Investigation, J.N.S.; Methodology, J.N.S., K.K. and Y.-C.C.; Project administration, Y.-C.C.; Resources, Y.-C.C.; Supervision, Y.-C.C.; Validation, Y.-C.C.; Writing—original draft, J.N.S.; Writing—review & editing, K.K. and Y.-C.C. All authors have read and agreed to the published version of the manuscript.

Funding

This research was funded by Ministry of Science and Technology of Taiwan (MOST 108-2113-M-009-018-MY3).

Acknowledgments

We thank the Ministry of Science and Technology of Taiwan (MOST 108-2113-M-009-018-MY3) for financial support of this research. JNS and AK thank NYCU for providing them the NYCU International Student Scholarship.

Conflicts of Interest

The authors declare no conflict of interest.

References

  1. Fung, F.; Wang, H.-S.; Menon, S. Food safety in the 21st century. Biomed. J. 2018, 41, 88–95. [Google Scholar]
  2. Motarjemi, Y.; Käferstein, F.; Moy, G.; Quevedo, F. Contaminated weaning food: A major risk factor for diarrhoea and associated malnutrition. Bull. WHO 1993, 71, 79–92. [Google Scholar]
  3. Tarr, P.I.; Neill, M.A. Escherichia coli O157:H7. Gastroenterol. Clin. North Am. 2001, 30, 735–751. [Google Scholar] [CrossRef]
  4. Butler, D. Novel pathogens beat food safety checks. Nature 1996, 384, 397. [Google Scholar] [CrossRef]
  5. Nguyen, Y.; Sperandio, V. Enterohemorrhagic E. coli (EHEC) pathogenesis. Front. Cell. Infect. Microbiol. 2012, 2, 90. [Google Scholar] [CrossRef] [Green Version]
  6. Eum, N.-S.; Yeom, S.-H.; Kwon, D.-H.; Kim, H.-R.; Kang, S.-W. Enhancement of sensitivity using gold nanorods—Antibody conjugator for detection of E. coli O157:H7. Sens. Actuators B 2010, 143, 784–788. [Google Scholar] [CrossRef]
  7. Fu, Z.; Rogelj, S.; Kieft, T.L. Rapid detection of Escherichia coli O157:H7 by immunomagnetic separation and real-time PCR. Int. J. Food Microbiol. 2005, 99, 47–57. [Google Scholar] [CrossRef]
  8. Daly, P.; Collier, T.; Doyle, S. PCR-ELISA detection of Escherichia coli in milk. Lett. Appl. Microbiol. 2002, 34, 222–226. [Google Scholar] [CrossRef] [Green Version]
  9. Zhao, Y.; Zeng, D.; Yan, C.; Chen, W.; Ren, J.; Jiang, Y.; Jiang, L.; Xue, F.; Ji, D.; Tang, F.; et al. Rapid and accurate detection of Escherichia coli O157:H7 in beef using microfluidic wax-printed paper-based ELISA. Analyst 2020, 145, 3106–3115. [Google Scholar] [CrossRef]
  10. Jin, D.; Qi, H.; Chen, S.; Zeng, T.; Liu, Q.; Wang, S. Simultaneous detection of six human diarrheal pathogens by using DNA microarray combined with tyramide signal amplification. J. Microbiol. Methods 2008, 75, 365–368. [Google Scholar] [CrossRef]
  11. Borst, A.; Box, A.T.A.; Fluit, A.C. False-Positive Results and Contamination in Nucleic Acid Amplification Assays: Suggestions for a Prevent and Destroy Strategy. Eur. J. Clin. Microbiol. Infect. Dis. 2004, 23, 289–299. [Google Scholar] [CrossRef]
  12. Wolter, A.; Niessner, R.; Seidel, M. Detection of Escherichia coli O157:H7, Salmonella typhimurium, and Legionella pneumophila in Water Using a Flow-Through Chemiluminescence Microarray Readout System. Anal. Chem. 2008, 80, 5854–5863. [Google Scholar] [CrossRef]
  13. Gupta, R.; Kumar, A.; Kumar, S.; Pinnaka, A.K.; Singhal, N.K. Naked eye colorimetric detection of Escherichia coli using aptamer conjugated graphene oxide enclosed Gold nanoparticles. Sens. Actuators B 2021, 329, 129100. [Google Scholar] [CrossRef]
  14. Ahmad, M.; Roberts, J.N.; Hardiman, E.M.; Singh, R.; Eltis, L.D.; Bugg, T.D.H. Identification of DypB from Rhodococcus jostii RHA1 as a Lignin Peroxidase. Biochemistry 2011, 50, 5096–5107. [Google Scholar] [CrossRef]
  15. Liu, L.; Hao, Y.; Deng, D.; Xia, N. Nanomaterials-Based Colorimetric Immunoassays. Nanomaterials 2019, 9, 316. [Google Scholar] [CrossRef] [Green Version]
  16. Josephy, P.D.; Eling, T.; Mason, R.P. The horseradish peroxidase-catalyzed oxidation of 3, 5, 3′, 5′-tetramethylbenzidine. Free radical and charge-transfer complex intermediates. J. Biol. Chem. 1982, 257, 3669–3675. [Google Scholar] [CrossRef]
  17. Huang, H.; Wu, Z.; Huang, J.; Zhao, G.; Dou, W. Highly sensitive colorimetric immunoassay for Escherichia coli O157:H7 based on probe of pseudo enzyme and dual signal amplification. Anal. Methods. 2018, 10, 4301–4309. [Google Scholar] [CrossRef]
  18. Shim, K.H.; Kang, M.; Kim, M.G.; Chung, B.H.; An, S.S.A. Detection of E. coli O157:H7 using its endogenous active membrane peroxidase. J. Toxicol. Environ. Health Sci. 2011, 3, 80–85. [Google Scholar] [CrossRef]
  19. Su, H.; Zhao, H.; Qiao, F.; Chen, L.; Duan, R.; Ai, S. Colorimetric detection of Escherichia coli O157:H7 using functionalized Au@Pt nanoparticles as peroxidase mimetics. Analyst 2013, 138, 3026–3031. [Google Scholar] [CrossRef]
  20. Zhang, H.; Yu, K.; Li, N.; He, J.; Qiao, L.; Li, M.; Wang, Y.; Zhang, D.; Jiang, J.; Zare, R.N. Real-time mass-spectrometric screening of droplet-scale electrochemical reactions. Analyst 2018, 143, 4247–4250. [Google Scholar] [CrossRef]
  21. Mai-Prochnow, A.; Lucas-Elio, P.; Egan, S.; Thomas, T.; Webb, J.S.; Sanchez-Amat, A.; Kjelleberg, S. Hydrogen Peroxide Linked to Lysine Oxidase Activity Facilitates Biofilm Differentiation and Dispersal in Several Gram-Negative Bacteria. J. Bacteriol. 2008, 190, 5493–5501. [Google Scholar] [CrossRef] [PubMed] [Green Version]
  22. Nóbrega, C.S.; Pauleta, S.R. Reduction of hydrogen peroxide in gram-negative bacteria—Bacterial peroxidases. Adv. Microb. Physiol. 2019, 74, 415–464. [Google Scholar] [CrossRef] [PubMed]
  23. Pieters, R.J. Maximising multivalency effects in protein–carbohydrate interactions. Org. Biomol. Chem. 2009, 7, 2013–2025. [Google Scholar] [CrossRef]
  24. Qiao, Z.; Lei, C.; Fu, Y.; Li, Y. An antimicrobial peptide-based colorimetric bioassay for rapid and sensitive detection of E. coli O157:H7. RSC Adv. 2017, 7, 15769–15775. [Google Scholar] [CrossRef]
  25. Asadi, A.; Razavi, S.; Talebi, M.; Gholami, M. A review on anti-adhesion therapies of bacterial diseases. Infection 2019, 47, 13–23. [Google Scholar] [CrossRef] [PubMed]
  26. Biscola, F.T.; Abe, C.M.; Guth, B.E.C. Determination of adhesin gene sequences in, and biofilm formation by, O157 and non-O157 Shiga toxin-producing Escherichia coli strains isolated from different sources. Appl. Environ. Microbiol. 2011, 77, 2201–2208. [Google Scholar] [CrossRef] [Green Version]
  27. Miller, E.; Garcia, T.; Hultgren, S.; Oberhauser, A.F. The mechanical properties of E. coli type 1 pili measured by atomic force microscopy techniques. Biophys. J. 2006, 91, 3848–3856. [Google Scholar] [CrossRef] [Green Version]
  28. Bouckaert, J.; Berglund, J.; Schembri, M.; De Genst, E.; Cools, L.; Wuhrer, M.; Hung, C.S.; Pinkner, J.; Slattegard, R.; Zavialov, A.; et al. Receptor binding studies disclose a novel class of high-affinity inhibitors of the Escherichia coli FimH adhesin. Mol. Microbiol. 2005, 55, 441–455. [Google Scholar] [CrossRef]
  29. Lundquist, J.J.; Toone, E.J. The Cluster Glycoside Effect. Chem. Rev. 2002, 102, 555–578. [Google Scholar] [CrossRef]
  30. Yan, X.; Sivignon, A.; Yamakawa, N.; Crepet, A.; Travelet, C.; Borsali, R.; Dumych, T.; Li, Z.; Bilyy, R.; Deniaud, D.; et al. Glycopolymers as Antiadhesives of E. coli Strains Inducing Inflammatory Bowel Diseases. Biomacromolecules 2015, 16, 1827–1836. [Google Scholar] [CrossRef]
  31. Kang, T.W.; Han, J.; Lee, S.; Hwang, I.-J.; Jeon, S.-J.; Ju, J.-M.; Kim, M.-J.; Yang, J.-K.; Jun, B.; Lee, C.H.; et al. 2D transition metal dichalcogenides with glucan multivalency for antibody-free pathogen recognition. Nat. Commun. 2018, 9, 2549. [Google Scholar] [CrossRef] [PubMed] [Green Version]
  32. Hsieh, C.H.; Chang, C.H.; Urban, P.L.; Chen, Y.C. Capillary action-supported contactless atmospheric pressure ionization for the combined sampling and mass spectrometric analysis of biomolecules. Anal. Chem. 2011, 83, 2866–2869. [Google Scholar] [CrossRef] [PubMed] [Green Version]
  33. Hsieh, C.-H.; Meher, A.K.; Chen, Y.-C. Automatic sampling and analysis of organics and biomolecules by capillary action-supported contactless atmospheric pressure ionization mass spectrometry. PLoS ONE 2013, 8, e66292. [Google Scholar] [CrossRef] [PubMed] [Green Version]
  34. Chen, Y.-C.; Krishnamurthy, A.; Chen, S.-H.; Chen, Y.-C. A tapered capillary-based contactless atmospheric pressure ionization mass spectrometry for on-line preconcentration and separation of small organics. Separations 2021, 8, 111. [Google Scholar] [CrossRef]
  35. Li, L.; Liao, L.; Ding, Y.; Zeng, H. Dithizone-etched CdTe nanoparticles-based fluorescence sensor for the off–on detection of cadmium ion in aqueous media. RSC Adv. 2017, 7, 10361–10368. [Google Scholar] [CrossRef] [Green Version]
  36. DuBois, M.; Gilles, K.A.; Hamilton, J.K.; Rebers, P.A.; Smith, F. Colorimetric method for determination of sugars and related substances. Anal. Chem. 1956, 28, 350–356. [Google Scholar] [CrossRef]
  37. Masuko, T.; Minami, A.; Iwasaki, N.; Majima, T.; Nishimura, S.-I.; Lee, Y.C. Carbohydrate analysis by a phenol–sulfuric acid method in microplate format. Anal. Biochem. 2005, 339, 69–72. [Google Scholar] [CrossRef]
  38. Goodridge, L.; Chen, J.; Griffiths, M. Development and Characterization of a Fluorescent-Bacteriophage Assay for Detection of Escherichia coli O157:H7. Appl. Environ. Microbiol. 1999, 65, 1397–1404. [Google Scholar] [CrossRef] [Green Version]
  39. Ye, L.; Zhao, G.; Dou, W. An electrochemical immunoassay for Escherichia coli O157:H7 using double functionalized Au@Pt/SiO2 nanocomposites and immune magnetic nanoparticles. Talanta 2018, 182, 354–362. [Google Scholar] [CrossRef]
  40. Ramasamy, M.; Yi, D.K.; An, S.S.A. Enhanced detection sensitivity of Escherichia coli O157:H7 using surface-modified gold nanorods. Int. J. Nanomed. 2015, 10, 179–190. [Google Scholar] [CrossRef] [Green Version]
  41. Zhu, Y.; Qiao, L.; Prudent, M.; Bondarenko, A.; Gasilova, N.; Möller, S.B.; Lion, N.; Pick, H.; Gong, T.; Chen, Z.; et al. Sensitive and fast identification of bacteria in blood samples by immunoaffinity mass spectrometry for quick BSI diagnosis. Chem. Sci. 2016, 7, 2987–2995. [Google Scholar] [CrossRef] [PubMed] [Green Version]
  42. Shi, R.; Cao, Z.; Li, H.; Graw, J.; Zhang, G.; Thannickal, V.J.; Cheng, G. Peroxidasin contributes to lung host defense by direct binding and killing of gram-negative bacteria. PLoS Pathog. 2018, 14, e1007026. [Google Scholar] [CrossRef] [PubMed] [Green Version]
  43. Mustafa, H.S.I. Staphylococcus aureus can produce catalase enzyme when adding to human wbcs as a source of H2O2 productions in human plasma or serum in the laboratory. Open J. Med. Microbiol. 2014, 4, 249. [Google Scholar] [CrossRef] [Green Version]
  44. Shmaefsky, B.R. Artificial urine for laboratory testing. Am. Biol. Teach. 1990, 52, 170–172. [Google Scholar] [CrossRef]
  45. Johnson, J.R.; Russo, T.A.; Scheutz, F.; Brown, J.J.; Zhang, L.; Palin, K.; Rode, C.; Bloch, C.; Marrs, C.F.; Foxman, B. Discovery of disseminated J96-like strains of uropathogenic Escherichia coli O4:H5 containing genes for both PapG(J96) (class I) and PrsG(J96) (class III) Gal(alpha1-4)Gal-binding adhesins. J. Infect. Dis. 1997, 175, 983–988. [Google Scholar] [CrossRef] [PubMed] [Green Version]
Scheme 1. Cartoon illustration of the C-API-MS setup.
Separations 09 00013 sch001
Figure 1. (A) Photograph of the tapered silica capillary. (B) Optical microscopic image of the gold-coated capillary.
Separations 09 00013 g001
Figure 2. (A) Photograph of the samples (0.2 mL) containing E. coli O157:H7 at different concentrations, from a serial dilution of OD600 of 1 with a dilution factor of 10 prepared in ammonium acetate buffer (pH 4.5, 10 mM) and reacted with TMB (1 mg mL−1, 2 µL) in the presence of H2O2 (100 mM, 2 µL) for 30 min. (BH) Corresponding C-API mass spectra of the samples shown in Panel A. All the samples were 100-fold diluted with ethanol/deionized water (2:1, v/v) prior to C-API-MS analysis. A droplet of sample (5 µL) was used for MS-analysis. (I) Mass spectrum of the blank sample without containing bacteria.
Separations 09 00013 g002
Figure 3. C-API mass spectrum of the sample containing (A) E. coli O157:H7 with the concentration of OD600 of ~10−6, obtained after endogenous peroxidase reactions. (B) C-API mass spectrum of the sample, obtained by using the MALCY-probe to trap the sample (3 mL) containing E. coli O157:H7 with the concentration of OD600 of ~10−6, followed by releasing the bacterial to ammonium acetate buffer (pH 4.5) and conducting endogenous peroxidase reactions. The endogenous peroxidase reaction samples in Panels A and B were 100-fold diluted with ethanol/deionized water (2:1, v/v) prior to C-API-MS analysis. One droplet of the resultant sample (5 µL) was used for C-API-MS analysis.
Separations 09 00013 g003
Figure 4. (A) Photograph of the samples (0.2 mL) containing E. coli BOS117, E. coli UTI No 37, E. coli JM109, E. coli HB101, and E. coli J96 with the concentrations of OD600 of ~1 prepared in the ammonium acetate buffer (pH 4.5, 10 mM) obtained after reaction with H2O2 (pH 4.5, 45 µL) and TMB (1 mg mL−1, 5 µL) for 30 min. C-API mass spectra of the samples (0.2 mL) containing (B) E. coli BOS117, (C) E. coli UTI No 37, (D) E. coli JM109, (E) E. coli HB101, and (F) E. coli J96 with the concentrations of OD600 of ~10−6 prepared in the ammonium acetate buffer (pH 4.5, 10 mM) obtained after reaction with H2O2 (pH 4.5, 2 µL) and TMB (1 mg mL−1, 2 µL) for 30 min prior to enrichment. One droplet of the resultant samples (5 µL) were used for MS analysis. C-API mass spectra of the samples (3 mL) containing (G) E. coli BOS117, (H) E. coli UTI No 37, (I) E. coli JM109, (J) E. coli HB101, and (K) E. coli J96 with the concentrations of OD600 of ~10−6 prepared in the PBS buffer (10 mM, pH 7.5) obtained after enriched by the MALCY-probe, followed by releasing the bacteria trapped on the probe to ammonium acetate buffer (pH 4.5, 8 µL) for 15 min shaking, followed by addition of H2O2 (100 mM, 1 µL), and TMB (1 mg mL−1, 1 µL), followed by standing for another 15 min prior to MS analysis. One droplet of the resultant samples (5 µL) were used for MS analysis. All the resultant samples were 100-fold diluted with ethanol/deionized water (2:1, v/v) prior to C-API-MS analysis.
Separations 09 00013 g004
Figure 5. C-API mass spectra of the orange juice (3 mL) containing E. coli O157:H7 with the concentrations of OD600 of (A) ~10−7, (B) ~10−8, and (C) 0, prepared in the PBS buffer (10 mM, pH 7.5) obtained after enriched by MALCY-probe, followed by releasing the bacteria trapped on the probe to ammonium acetate buffer (pH 4.5, 8 µL) and reaction with H2O2 (100 mM, 1 µL) and TMB (1 mg mL−1, 1 µL) for 15 min.
Separations 09 00013 g005
Publisher’s Note: MDPI stays neutral with regard to jurisdictional claims in published maps and institutional affiliations.

