Article

Maximizing Contents of Phytochemicals Obtained from Dried Sour Cherries by Ultrasound-Assisted Extraction

by
Anita Milić
1,
Tatjana Daničić
1,
Aleksandra Tepić Horecki
1,
Zdravko Šumić
1,
Danijela Bursać Kovačević
2,
Predrag Putnik
3,* and
Branimir Pavlić
1,*
1
Faculty of Technology, University of Novi Sad, Blvd. Cara Lazara 1, 21000 Novi Sad, Serbia
2
Faculty of Food Technology and Biotechnology, University of Zagreb, Pierottijeva 6, 10000 Zagreb, Croatia
3
Department of Food Technology, University North, Trg Dr. Žarka Dolinara 1, 48000 Koprivnica, Croatia
*
Authors to whom correspondence should be addressed.
Separations 2021, 8(9), 155; https://doi.org/10.3390/separations8090155
Submission received: 24 August 2021 / Revised: 10 September 2021 / Accepted: 14 September 2021 / Published: 16 September 2021

Abstract

:
Sour cherries were first dried by vacuum drying and then used as material for obtaining extracts rich in bioactive compounds by ultrasound-assisted extraction (UAE). The first step was to apply a factorial design for the preliminary experiments to determine the most influential UAE factors, and thus the three studied parameters were chosen as the most suitable for the design of the main experiment (temperature, liquid–solid ratio and ethanol concentration). In this part, the contents of total phenols and the total content of monomeric anthocyanins were taken for responses. For the further optimization of UAE, experimental design (face-centered) was applied, and the yield, total phenolics, flavonoid content and content of monomeric anthocyanins and antioxidant activity (DPPH, ABTS and FRAP assays) were analyzed. Temperature (40–80 °C), ethanol concentration (40–80%, w/w) and liquid–solid ratio (10–30 mL/g) were investigated as independent variables. The obtained experimental results were fitted to a second-order polynomial model and analysis of variance was used to determine the fit of the model and the optimal conditions for investigated responses. High quality extracts with high concentrations of polyphenols and anthocyanins were also obtained, which could be used as food additives.

1. Introduction

The sour cherry (Prunus cerasus L.) is one of the fruits that originated in areas around the Caspian Sea. Russia, Turkey, Ukraine, USA, Iran and Serbia are the leading producing countries of sour cherries [1]. All good references for the possibility of growing various continental stone fruits Serbia owes to a suitable climate and cultivation possibilities at different altitudes [2]. Sour cherries are considered one of the traditional fruit species, as they are widely grown and highly appreciated in the region [3].
Sour cherries are characterized as an important industrial fruit variety, and they are a valued raw material in the area of food production. Thanks to their high postharvest respiration and susceptible structure, numerous methods must be applied in the fruit processing industry to control and maintain adequate quality of sour cherries [4]. Many different cherry varieties can be processed into different sour cherry products, such as dried or frozen products, jams, juices or jellies [5,6], purees, concentrates and alcoholic beverages [7], and these products can also be a common additional ingredient in the industrial production of chocolate and other sweets [3]. Fruit drying has been successfully applied to reduce their high moisture content and to achieve and maintain microbiological stability of the obtained dried products [5]. Fresh sour cherries can be dried by convective, vacuum and freeze drying. Structural and biochemical changes in the products during drying were significantly reduced in vacuum drying compared to convective drying, with great emphasis on low energy use for economic efficiency [8]. Recently, the results of the comparative analysis of the effects of convective drying, vacuum drying and lyophilization (freeze drying) on the physical, chemical and biological properties of stone fruits in the research of Vakula et al. [9] showed that the highest total phenolic and flavonoid content of all dried stone fruit samples were obtained in the vacuum dried sour cherry samples.
Sour cherries are characterized by excellent sensory and physico-chemical properties as well as high levels of biologically active phytochemicals [1]. The presence of polyphenolic compounds, such as phenolic acids and isoflavonoids, as well as the unique composition of anthocyanins, in sour cherries have beneficial effects on human health and are also associated with their ability to scavenge oxygen free radicals in human cells [6,10,11]. In addition, sour cherries are rich sources of various organic acids, vitamins and minerals [12]. Extraction of the widely present bioactive compounds from the dried plant samples has become a significant area of research due to their priceless bioactive value [13].
Conventional extraction techniques have implied a solvent extraction process using various organic solvents and water. Since the plant raw material contains both extractable and non-extractable bioactive compounds, this technique cannot extract all the valuable antioxidants present. The bound form of these compounds remains unextracted and cannot be analyzed [11]. To this end, several novel extraction techniques, such as ultrasound-assisted extraction (UAE), supercritical fluid extraction (SFE), microwave-assisted extraction (MAE) and pressurized-liquid extraction (PLE) have been successfully used for the extraction of valuable biological components from plant materials with high yield [14]. SFE is a very good alternative to conventional processes because it can prevent chemical changes caused by high temperatures and also by interaction with solvents and/or oxygen. It is also important to consider the right conditions for the extraction, mainly pressure and temperature, e.g., in the case of SFE, where large overall extraction yields can be obtained, but at the same time lower selectivity when higher pressures (up to 500 mbar) are used [15]. One of the crucial facts that enables high efficiency when using ultrasound for extraction is the increased contact between the liquid and solid phases. The facilitated solvent penetration into the sample matrix provides higher extraction yield and quality with reduced process time [16,17,18]. Indeed, the accelerated mass transfer by ultrasonic waves and the resulting cavitation effect during the process are responsible for the release of bioactive compounds from the parenchymal cell wall of the samples [19]. A very important part of the process is the selection of suitable solvents for extraction in accordance with its selectivity and solubility, which will correspond to the targeted extractable compounds. In comparison with methods of extraction that are conventionally used, the application of efficient ultrasound extraction requires less power and solvent consumption, less fossil energy consumption and also excludes the occurrence of wastewater after the end of the extraction process [14]. The importance and advantage of using UAE compared to MAE are presented in the work of Liu et al. [20], where the screening and process optimization of ultrasound-assisted extraction of major antioxidants from sweet tea were studied. On the other hand, a method for the MAE of natural antioxidants from Akebia trifoliate peel was developed in the work of Luo et al. [21].
Nowadays, the emergence of advanced “green” extraction technology increases the competition between large processing companies to be more economical and innovative, as well as to take all necessary precautions to protect the environment as much as possible [22]. The advantages of using UAE can be explained by optimizing important variables that include solvent concentration, solvent–sample ratio, temperature and extraction time [23]. In order to optimize the mentioned variables, response surface methodology (RSM) can be successfully applied. RSM represents a widely known set of statistical and mathematical methods used for the analysis of problems where the influence of multiple input variables on output parameters is observed. The output parameters are referred to as responses of interest or dependent variables. Optimization of the process involves finding an appropriate combination of input factors from given intervals, for which the desired output values are best achieved with the required priority [24]. RSM, as an experimental methodology, has been successfully used for the optimization of ultrasound extraction processes of various raw materials [23,25,26,27].
The application of RSM on UAE of different classes of bioactives is investigated and described in numerous studies. However, among the available and scientific data sources, there are no works dealing with optimization of the extraction process of phytochemicals from sour cherries. Chemical and biological compounds (total phenolic content (TP), total flavonoid content (TF) and anthocyanins content (TMA)) from sour cherries and their antioxidant activity (measured by DPPH, FRAP and ABTS assay) were investigated. The main goal of this research was optimization of the UAE of valuable bioactive compounds and antioxidants from vacuum dried sour cherries using RSM.

2. Materials and Methods

2.1. Sample

Sour cherries were purchased from a local market (Novi Sad, Serbia) and after purchase the pits were carefully removed, and the samples were stored in a freezer (−20 °C) until the drying process. Before the extraction process, the samples were dried in a vacuum dryer. Drying was performed in a prototype vacuum dryer designed and installed at the Faculty of Technology Novi Sad, Serbia. This dryer was described in detail in the work of Šumić et al. [28]. Drying conditions were chosen according to previous studies on stone fruit drying presented by Vakula et al. [9], where it was found that vacuum dried sour cherry samples had the highest total phenolic and flavonoid content of all dried stone fruit samples. In accordance with these results, vacuum drying in this study was carried out at 60 °C, 20 mbar and 11 h. The moisture content of the vacuum dried sour cherry sample was 16.53%.

2.2. Reagents

The following reagents were purchased from Sigma-Aldrich Chem (Steinheim, Germany): Folin–Ciocalteu reagent; (±)-catechin; gallic acid; 2,2-diphenyl-1-picrylhydrazyl (DPPH); 2,4,6-tris (2-pyridil)-s triazine (TPZT); iron (III)-chloride and iron (II)-sulfatheptahydrate and potassium persulfate. Trolox (6-hydroxy-2,5,7,8-tetramethylchroman-2-carboxylic acid) was obtained from Sigma-Aldrich (Milan, Italy). Sodium acetate and hydrochloric acid were purchased from Merck (Darmstadt, Germany). ABTS (2,2′-azino-bis-(-3-ethylbenzothiazoline-6-sulfonic acid) diammonium salt) was purchased from J&K Scientific GmbH (Pforzheim, Germany). All other chemicals and solvents were of analytical reagent grade.

2.3. Preliminary Ultrasound-Assisted Extraction (UAE) and Screening of Variables

In all UAE experimental runs, 5.0 g of vacuum dried sample was mixed with extraction solvent (aqueous ethanol) in 250 mL glass flasks. Extractions were performed in a sonication water bath (EUP540A, Euinstruments, France) at a frequency of 40 kHz. The flasks were always positioned in the position of the ultrasonic bath to ensure constant ultrasonic power, according to the procedure described by Zeković et al. [27].
The first step was to screen the independent variables to define the most influential parameters and their domain on already targeted responses (TP and TMA) using a 25-1 fractional factorial design. The experimental design consisted of 16 runs using 40 and 60 °C temperature, 20 and 40 min extraction time, 40 and 60% ethanol concentration, 30 and 60 W/L ultrasonic power and 10 and 20 mL/g liquid–solid ratio as numerical input parameters. The following linear model presented in Equation (1) was used to define the influence of parameters of UAE on TP and TMA:
Y = β 0 + i = 1 5 β i X i + i = 1 4 j = i + 1 5 β i j X i X j
where Y represents the response variable, β0 the intercept, βi the linear regression coefficient, βij the regression coefficients for cross-product terms and Xi and Xj variables (independent) that affect the response.

2.4. Experimental Design and Statistical Analysis

After the screening, three of the five most influential parameters were selected to be further used in face-centered CCD with RSM. The influence of temperature (40, 60 and 80 °C), extraction time (40, 60 and 80 min) and liquid–solid ratio (10, 20 and 30 mL/g) were used as independent variables. Optimal extraction conditions were determined considering Y and TP, TF, TMA, as well as antioxidant activity parameters obtained by DPPH, ABTS and FRAP assays, while the selection of optimal conditions was based on the desirability function (D). For multiple linear regression analysis, Design-Expert v11 software (Stat-Ease, Minneapolis, MN, USA) was used and the results were fitted to a second-order polynomial model (Equation (2)):
Y = β 0 + i = 1 5 β i X i + i = 1 4 j = i + 1 5 β i j X i X j
where Y represents the response variable, Xi and Xj are the independent variables affecting the response, and β0, βi, βii, and βij are the regression coefficients for intercept, linear, quadratic and cross-product terms. Model adequacy was evaluated by the R2 (coefficient of determination), CV (coefficient of variation) and p values for the model and lack of fit. In order to verify obtained empirical models, validation was performed by using the extracts prepared at optimized UAE conditions.

2.5. Analyses

2.5.1. Yield

The content of yields in the obtained sour cherry extracts was obtained by the process of vacuum vaporization using 10 mL of crude extract. After vaporization, drying was carried out in an oven at 105 °C until a constant mass was obtained. The results are expressed as mass of total extractable solids per 100 g of dry plant material (%; w/w).

2.5.2. Total Phenolic Content

The total phenolic content (TP) of each extract was estimated by the Folin–Ciocalteu method [29] using gallic acid as the standard equivalent. The absorbance of the blue-colored reaction solutions was read at 750 nm wavelength (6300 Spectrophotometer, Jenway, UK). Total phenolic content was calculated as g gallic acid equivalents per 100 g sample (g GAE/100 g) using the prepared gallic acid calibration curve. Each measurement was carried out three times and results were presented as mean values.

2.5.3. Total Flavonoid Content

For determination of total flavonoid content (TF), the colorimetric aluminum chloride assay was used [30]. Absorbance values were observed at 510 nm. Results were expressed as g of catechin equivalents per 100 g of dried sour cherries (g CE/100 g) using the equation obtained from the catechin standard diagram. Each measurement was performed in three replicates and the results were expressed as mean values.

2.5.4. Total Anthocyanin Content

Total monomeric anthocyanins (TMA) content in dried sour cherry extracts was determined according to the pH differential method described by Fuleki and Francis [31]. First, two buffer solutions with pH 1.0 (potassium chloride buffer) and pH 4.5 (sodium acetate buffer) were prepared. Then, 400 µL of each liquid extract was mixed with 3.6 mL of the two buffer solutions separately. The absorbance of the mixture was recorded at wavelengths 510 and 700 nm, using distilled water as a blank. Absorbance (Ad) was calculated according to Equation (3):
A d = ( A 510 A 700 ) p H   1.0 ( A 510 A 700 ) p H   4.5
Total monomeric anthocyanin content in the extracts was calculated according to the following Equation (4):
TMA = A d × M W × D F × 1000 M a
where Ad is difference in absorbance, MW is a molecular weight of cyaniding-3-glucoside (449.2 g/mol), DF is the dilution factor of the samples and Ma is the molar absorptivity of cyaniding-3-glucoside (26.900 M/cm). Finally, the results obtained were expressed as mg of cyanidin-3-glycoside equivalent (CGE) per 100 g of sample (mg C3G/100 g). Each measurement was performed in three replicates and the results were expressed as mean values.

2.5.5. DPPH Assay

To determine the antioxidant activity of methanolic sour cherry extracts, a slightly modified DPPH (2,2-diphenyl-1-picrylhydrazyl) free radical scavenging assay was applied, mainly described in the research conducted by Brand-Williams et al. [32]. The methanolic DPPH solution was freshly prepared to perform the analysis. Methanol was used to adjust the final absorbance of the DPPH reagent to 0.70 (±0.02). A total of 0.1 mL of the liquid extract was added to 2.9 mL of DPPH reagent. For the blank sample, an appropriate volume of solvent (methanol) was added instead of 0.1 mL of the sour cherry extract. After incubation for 60 min at room temperature, the absorbance of each sample was observed at 517 nm by using VIS spectrophotometer (6300 Spectrophotometer, Jenway, UK). Trolox was used as an ethanolic standard solution to obtain a calibration curve, and the calculated results have been presented as µM Trolox equivalents per g of dried sour cherries (µM/g). Each measurement was performed in three replicates and the results were expressed as mean values.

2.5.6. FRAP Assay

The potential of ferric reducing antioxidant (FRAP) assay was conducted with the aim of measuring the reducing power of the sour cherry extracts against positive trivalent ferric ion (Fe3+) [33]. The freshly prepared FRAP reagent contained 10 mM TPTZ (2,4,6-tris(2-pyridil)-s triazine) in 40 mM HCl, 20 mM iron (III) chloride (FeCl3) aqueous solution and 300 mM acetate buffer, pH 3.6. The working FRAP reagent just prior to assay was prepared by mixing these three solutions in a 1:1:10 (v/v/v) ratio. Appropriate volumes of sour cherry extracts (0.1 mL) were mixed with 2.9 mL FRAP reagent in glass cuvettes. The absorbance values of the reaction mixture at 593 nm were determined spectrophotometrically (6300 Spectrophotometer, Jenway, UK) after incubation for 10 min in the dark, at 37 °C. Freshly prepared aqueous Fe2+ (Fe2SO4) solution at different concentrations (0–0.23 mM, R2 = 0.999) was taken to construct the standard calibration curve. The obtained results were presented as µM Fe2+ equivalents per g of dried sour cherries (µM Fe2+/g). Each measurement was performed in three replicates and the results were expressed as mean values.

2.5.7. ABTS Assay

The antioxidant activity assay with 2,2′-azino-bis-(-3-ethylbenzothiazoline- 6-sulfonic acid) diammonium salt) (ABTS) was carried out in accordance with modified methodology described by Re et al. [34]. The first step to obtain the ABTS reagent involved reaction of 7 mM aqueous ABTS solution with 2.45 mM aqueous potassium persulfate solution in the dark for 16 h at room temperature. Before the assay, this solution was diluted with acetate buffer (pH 3.6) and the absorbance of the prepared ABTS reagent was adjusted to 0.70 (±0.02). Then, the reaction mixture obtained by adding 2.9 mL of ABTS reagent into 0.1 mL of diluted extracts was incubated for 300 min at room temperature in the dark. After completion of incubation, absorbance values were recorded at a wavelength of 734 nm. Trolox was used as a reference standard to establish the calibration curve. The ability of the sour cherry extracts to scavenge ABTS radical cation was expressed as mM Trolox equivalents per g of sample dry weight (mM TE/g). Each measurement was performed in three replicates and the results were expressed as mean values.

3. Results and Discussion

3.1. Screening of UAE Factors

The UAE factors’ influence during the extraction process has been thoroughly investigated in different fields and for different types of fruit and vegetables, which is described in detail by Kumar et al. [35] and also the obtained results of the different research have been presented in papers by Zou et al. [36], Medina-Torres et al. [37] and Dumitraşcu et al. [38]. The first goal in this research was to reduce the initial experiments resulting from all combinations of the five most important UAE factors (temperature, extraction time, ethanol concentration, ultrasonic power and liquid–solid ratio). This was carried out by a 25-1 factorial design that was firstly applied for screening the most influential UAE factors (Table 1). Total phenolic content and total monomeric anthocyanin content were selected as the most appropriate quality indicators and investigated responses.
According to Pareto charts, where t values and Bonferroni limits are observed, the influence of the investigated UAE parameters on the contents of total phenolics and monomeric anthocyanins was shown (Figure 1). According to t values that were observed for total phenolic content, it was found that temperature and liquid–solid ratio were above the Bonferroni limit (17.28), while ethanol concentration and extraction time were slightly below this limit. It was also seen that the ultrasonic power was significantly below the Bonferroni limit but also above t value limit (4.30). All five parameters studied were over the t value limit (Figure 1a). According to this, it was concluded that temperature and liquid–solid ratio had a significant effect on the response, while the concentration of ethanol was on the third place, slightly below the limit. In terms of total monomeric anthocyanin content, temperature, extraction time, ultrasonic power and liquid–solid ratio were above the Bonferroni limit and also t value limit, while the concentration of ethanol was under both limits (Figure 1b). Based on these results, the three parameters studied, temperature, liquid–solid ratio and ethanol concentration, have been selected as the most important for further experimental design to optimize the UAE process. Linear terms of all three selected parameters showed a positive influence on the total phenolic content. Accordingly, the following experimental domain of three chosen parameters for RSM study were: temperature (40, 60 and 80 °C), ethanol concentration (40, 60 and 80%) and liquid–solid ratio (10, 20 and 30 mL/g). Similar screening of significant variables was conducted in the research by Chen et al. [39], where ultrasound-assisted extraction of Rubia sylvatica Nakai fruit was performed and the impact of each factor on the yields of total anthocyanins and total phenolics was assessed according to the t value on Pareto charts.

3.2. Defining the Influence of Process Parameters Extraction Process Modeling

After the previous screening of UAE factors, it was found that three investigated parameters (temperature, liquid–solid ratio and ethanol concentration) showed the greatest effect on total phenolics and monomeric anthocyanin content throughout the ultrasound-assisted extraction of vacuum dried sour cherry samples. Accordingly, these parameters were selected as the most suitable for the further main experimental design. The quality indicators, i.e., the investigated responses besides total phenolic and monomeric anthocyanin contents, were also yield content, total flavonoid content and antioxidant activity (DPPH, FRAP and ABTS assays). For the optimization of UAE, experimental design (face-centered) was observed with the main goal of maximization of extraction yield (Y) and the investigated chemical (TP, TF and TMAC) and biological properties (antioxidant activity determined by three assays: DPPH, ABTS and FRAP) of the vacuum dried sour cherry extracts. The parameters of UAE and obtained results of examined responses are shown in Table 2.
Significantly high R2 (coefficients of multiple determination) values were obtained for all investigated responses. The following values of R2: 0.9244, 0.9818, 0.8529, 0.9877, 0.8391, 0.9551 and 0.9288 were observed for Y, TP, TF, TMAC, DPPH, ABTS and FRAP, respectively (Table 3). These results indicated good fit between the values predicted experimentally and by the model that was applied. Regarding the values of CV obtained for all the investigated responses, presented in Table 3, it was noticed that a good fit of the model applied was obtained for all responses due to relatively low CV (1.68, 3.03, 4.80, 6.34, 10.04, 4.46 and 4.61 for Y, TP, TF, TMAC, DPPH, ABTS and FRAP, respectively), since low CV values indicate the good accordance and reliability of experiments and practical works [40]. According to the results of ANOVA presented in Table 3, a good fit between experimental and predicted values was observed. ANOVA was also used to determine the p values for linear, interaction and quadratic terms (Table 4).

3.3. Effects of Investigated Extraction Parameters of Yield, Total Phenolics, Flavonoid and Monomeric Anthocyanins Content and Antioxidant Activity

3.3.1. Total Extraction Yield (Y)

The yield content of the extracts analyzed varied from 64.69 to 75.66% (Table 2). The range of experimental yield of extract of Megalayan cherry fruit by ultrasonically assisted extraction extract obtained in the work of Kashyap et al. [41] was between 29.87 and 43.71%. The lowest yield content was obtained at 80 °C, 80% and 10 mL/g, as was also the case with total phenolic content, and the highest yield content was obtained at 40 °C, 80% and 30 mL/g (Table 2). These results indicate the higher influence of higher liquid-to-solid ratio on the yield in extracts of vacuum dried sour cherries, compared with temperature and ethanol concentration during extraction. Moreover, with respect to the linear and interaction terms, all three independent variables, temperature, ethanol concentration and liquid–solid ratio, showed a significant influence (p ≤ 0.05) on the yield content during the extraction process. Regarding the p values of the quadratic term, it was noticed that only the quadratic term of the temperature was significant (p ≤ 0.05). According to the results of the study by Kashyap et al. [41], in which the optimization of ultrasound-assisted extraction of polyphenols from Meghalayan cherry fruit was investigated, it was found that the extraction yield of extract from Megalayan cherry fruit was highly influenced by solvent concentration, solvent-to-solid ratio and extraction time, as shown by the regression analysis. The effects of interactions between temperature, extraction time and ethanol concentration were studied in the work of Mrkonjić et al. [42], where it was found that the interaction between extraction time and temperature showed a significant effect, while the interaction between ethanol concentration and temperature showed significance (p ≤ 0.01) on yield content in the Thymus serpyllum extracts. The final equation that can predict the behavior of researched UAE of yield content is shown in Table 4. Plots (response surface) of the contents of yield in investigated vacuum dried sour cherries are presented in Figure 2a, where the influence of three investigated parameters can be seen.

3.3.2. Total Phenols Content (TPC)

The total phenolic content in the vacuum dried sour cherry extracts obtained in this research ranged from 1.16 to 1.96 g GAE/100 g (Table 2). To compare with, similar results for total phenolic content in different types of fruit were obtained from the research of Kashyap et al. [41], where the extraction yield of Megalayan cherry fruit extract ranged from 93.20 to 123.91 mg GAE/g. In the study of UAE of total anthocyanins from Rubia sylvatica Nakai fruit [39], the experimental values of extraction yield of total phenolics varied from 28.52 to 35.23 mg GA/g. In this work, the highest total phenolic content was measured in the extract of vacuum dried sour cherries obtained at 80 °C, 40% and 30 mL/g liquid–solid ratio, while the lowest was obtained in extract that is observed at 80 °C, 80% and 10 mL/g liquid–solid ratio. Table 4 shows the p values of the linear, interaction and quadratic terms for the regression coefficients from the second-order polynomial model and predictive model equation with neglected, insignificant coefficients. Based on these results obtained for the total phenolic content, it was found that positive effects on the total phenolic content were observed for all the parameters studied (temperature, ethanol concentration and liquid–solid ratio). Based on the p values of linear term, it was also found that all three investigated parameters had a significant effect (p ≤ 0.05) on the total phenolic content during UAE of vacuum dried sour cherry samples. Moreover, corresponding to p values of the interaction term, it has been noticed that interactions between temperature and ethanol concentration as well as between ethanol concentration and liquid–solid ratio were significant (p ≤ 0.05). Moreover, interaction between temperature and liquid–solid ratio, the quadratic term of liquid–solid ratio as an investigated response, was significant (p ≤ 0.05).
Table 4 also shows the predictive model equation from the second-order polynomial model for the content of TP obtained by UAE. According to the results showed by Kashyaop et al. [41], solvent-to-solid ratio, solvent concentration and amplitude significantly influenced the total phenolic content of the extract from Meghalayan cherries, as shown by the regression analysis. In the work of Chen et al. [39], investigating the UAE of Rubia sylvatica Nakai fruit, after screening significant variables using the Plackett–Burman design, the ethanol concentration, extraction temperature and pH were further optimized, and it was concluded that the coefficients of the linear term of these three variables were significant for the yields of total phenolic content. The linear effects of ultrasonic power, solvent-to-sample ratio and ethanol concentration, as well as the quadratic effects of ultrasonic power and ethanol concentration, showed significant effects on total phenolic content in the study, in which the simultaneous optimization of UAE for phenolic compound content and antioxidant activity of Lycium ruthenicum Murr. fruit was investigated [43]. In the work of Mrkonjić et al. [42], it was noticed that there was a very small difference between the total phenolic values when using 30% and 60% ethanol at the same extraction time and temperature, and regarding the obtained p values, the significance of the linear term of ethanol concentration on the total phenolic content could be neglected. Two other linear terms, temperature and extraction time, exhibited high significant effect on total phenolic content (p ≤ 0.01). Response surface plots were presented to better visualize the multiple influences of all independent variables (Figure 2b). A significant effect (p ≤ 0.05) of temperature, ethanol concentration and liquid–solid ratio was also observed in Figure 2b. A significant interaction between temperature and liquid–solid ratio as well as between ethanol concentration and liquid–solid ratio (p ≤ 0.05) was also observed in Figure 2b. In this figure, the higher TPC on higher values of liquid–solid ratio can also be noticed, which can be explained by the fact that higher liquid–solid ratio leads to an increase of concentration gradient between solid (plant material) and solvent (liquid) phases. This higher concentration difference of the solute increases the dissolution and diffusivity of the solute in the solvent, increasing the extraction process [35].

3.3.3. Total Flavonoids Content (TFC)

The total flavonoid content in the vacuum dried sour cherry extracts ranged from 0.60 and 0.87 g CE/100 g, presented in Table 2. The highest total flavonoid content was obtained in the extract observed at 60 °C, 40% and 20 mL/g, while the lowest content was noticed in the extract observed at 40 °C, 80%, and 10 mL/g. Chen et al. [43] investigated the UAE of Lycium ruthenicum Murr. fruit and they noticed that the range of experimentally obtained total flavonoid values in the obtained extracts were between 15.20 and 26.66 mg RE/g. Just as in the case of total phenolic content, according to the corresponding p values of all terms, the positive influences on total flavonoid content in vacuum dried sour cherry extracts were found.
Two independent variables, ethanol concentration and liquid–solid ratio, had a significant influence (p ≤ 0.05) on total flavonoid content during the extraction process, while temperature had no significant effect on flavonoid content during extraction. According to the p values obtained for the interaction term, it was found that the interaction between ethanol concentration and liquid–solid ratio was significant (p ≤ 0.05). At the same time, the interactions between temperature and ethanol concentration as well as between temperature and liquid–solid ratio were not significant. In contrast to the results for total phenolic content, according to the quadratic term it was found that the influences of none of the three independent variables were significant.
The linear effects of solvent-to-sample ratio, ethanol concentration and the quadratic effects of ultrasonic power exhibited a significant (p ≤ 0.05) positive effect on the total flavonoid content in the obtained extracts, while the quadratic effects of ethanol concentration showed a highly significant (p ≤ 0.01) negative effect on the total flavonoid content in the extracts in the work of Chen et al. [43]. The UAE of polyphenols from garlic was investigated by Ciric et al. [44] and it was concluded that the interactions between extraction time and methanol concentration, extraction temperature and methanol concentration and extraction temperature and solvent–solid ratio showed significant (p ≤ 0.01) effects on total flavonoid content. Table 4 shows the predictive model equation from the second-order polynomial model for the UAE of total flavonoid content. Response surface plots are shown in Figure 2c, where the influences of three investigated parameters on the total flavonoids content have been presented. In this figure can be noticed the similar influence of the liquid–solid ratio, as it was in the case of TPC.

3.3.4. Total Monomeric Anthocyanins Content (TMAC)

The content of total monomeric anthocyanins ranged from 9.80 to 30.17 mg C3G/100 g (Table 2). The total monomeric anthocyanins highest content was noticed in the extract obtained at the highest temperature studied, 80 °C, 40% and 10 mL/g, while the lowest content was observed in the vacuum dried sour cherry extract obtained at 60 °C, 60% and 30 10 mL/g. In the study by Chen et al. [39], the results for extraction yields of total anthocyanins ranged from 17.32 to 22.13 mg Cy3G/g from Rubia sylvatica fruit. The storage stability of blood fruit anthocyanins, contained in conventional extract obtained with methanol and in an ultrasound-assisted extract obtained with methanol in different buffer solutions, was studied over 90 days. It was found that the degradation of anthocyanins was lower in acidic buffers than in near neutral and alkaline buffers [45]. According to the p values of the linear term presented in Table 4, it was observed that only the liquid–solid ratio, as one of the three parameters studied, had a significant influence (p ≤ 0.05) on the total monomeric anthocyanins content of the vacuum dried sour cherry samples.
From the same table it was also noticed that in both the linear and quadratic terms, none of the investigated parameters had an insignificant effect on the total content of monomeric anthocyanin in vacuum dried sour cherry samples, except for the quadratic term of liquid–solid ratio, which showed a significant influence (p ≤ 0.05) on the total content of monomeric anthocyanin in the extracts. Table 4 also shows the equation of the predictive model from second-order polynomial model for the UAE of total monomeric anthocyanin content. In the investigation by Chen et al. [39] on the UAE of total anthocyanins from Rubia sylvatica Nakai fruits, it was found that for the yield of total anthocyanins, the pH showed negative effects, while ultrasonic power, ethanol concentration, liquid–solid ratio, extraction temperature and extraction time showed positive effects. Response surface plots of the levels of total monomeric anthocyanins of the studied vacuum dried sour cherries are shown in Figure 2d, where the influence of three investigated parameters can be seen. In the case of TMAC, it was noticed that the liquid–solid ratio influenced differently from TPC and TFC, in term that the lower the values of liquid–solid ratio that were obtained, the higher the values of TMAC.

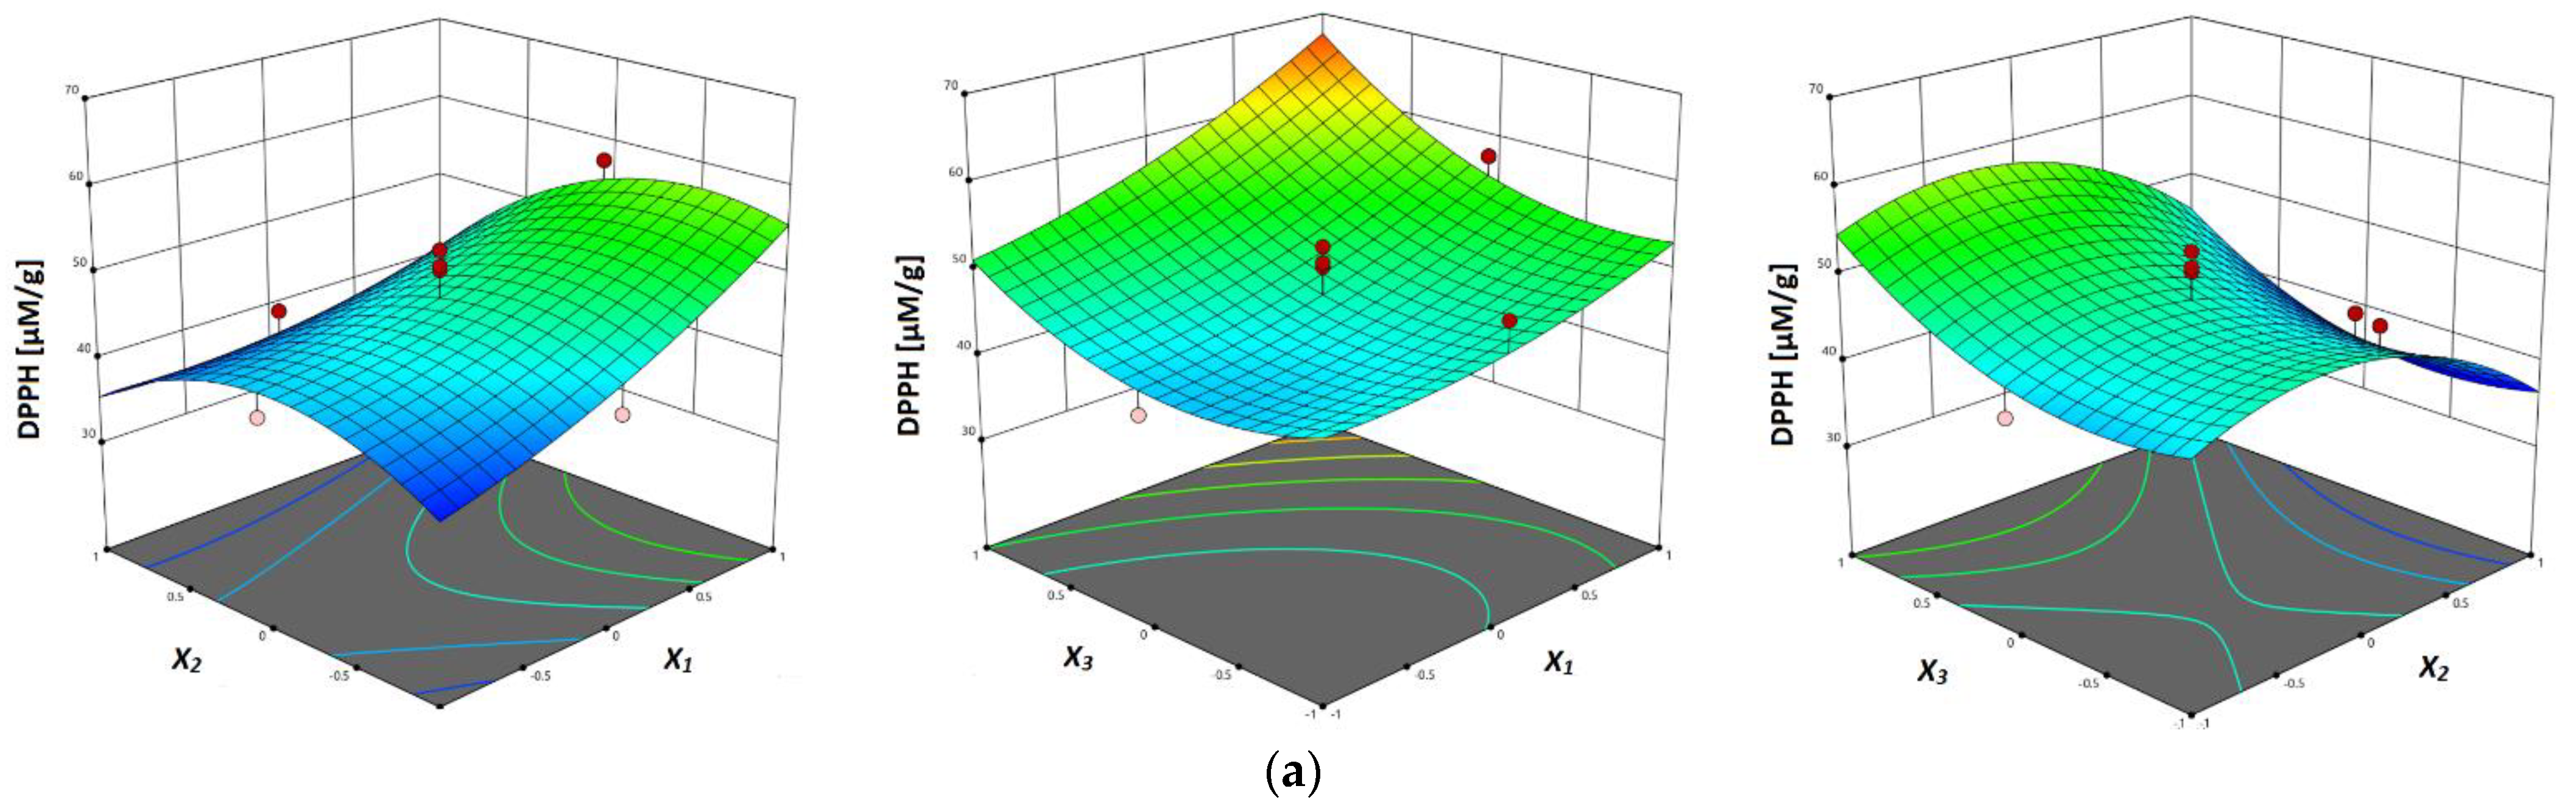
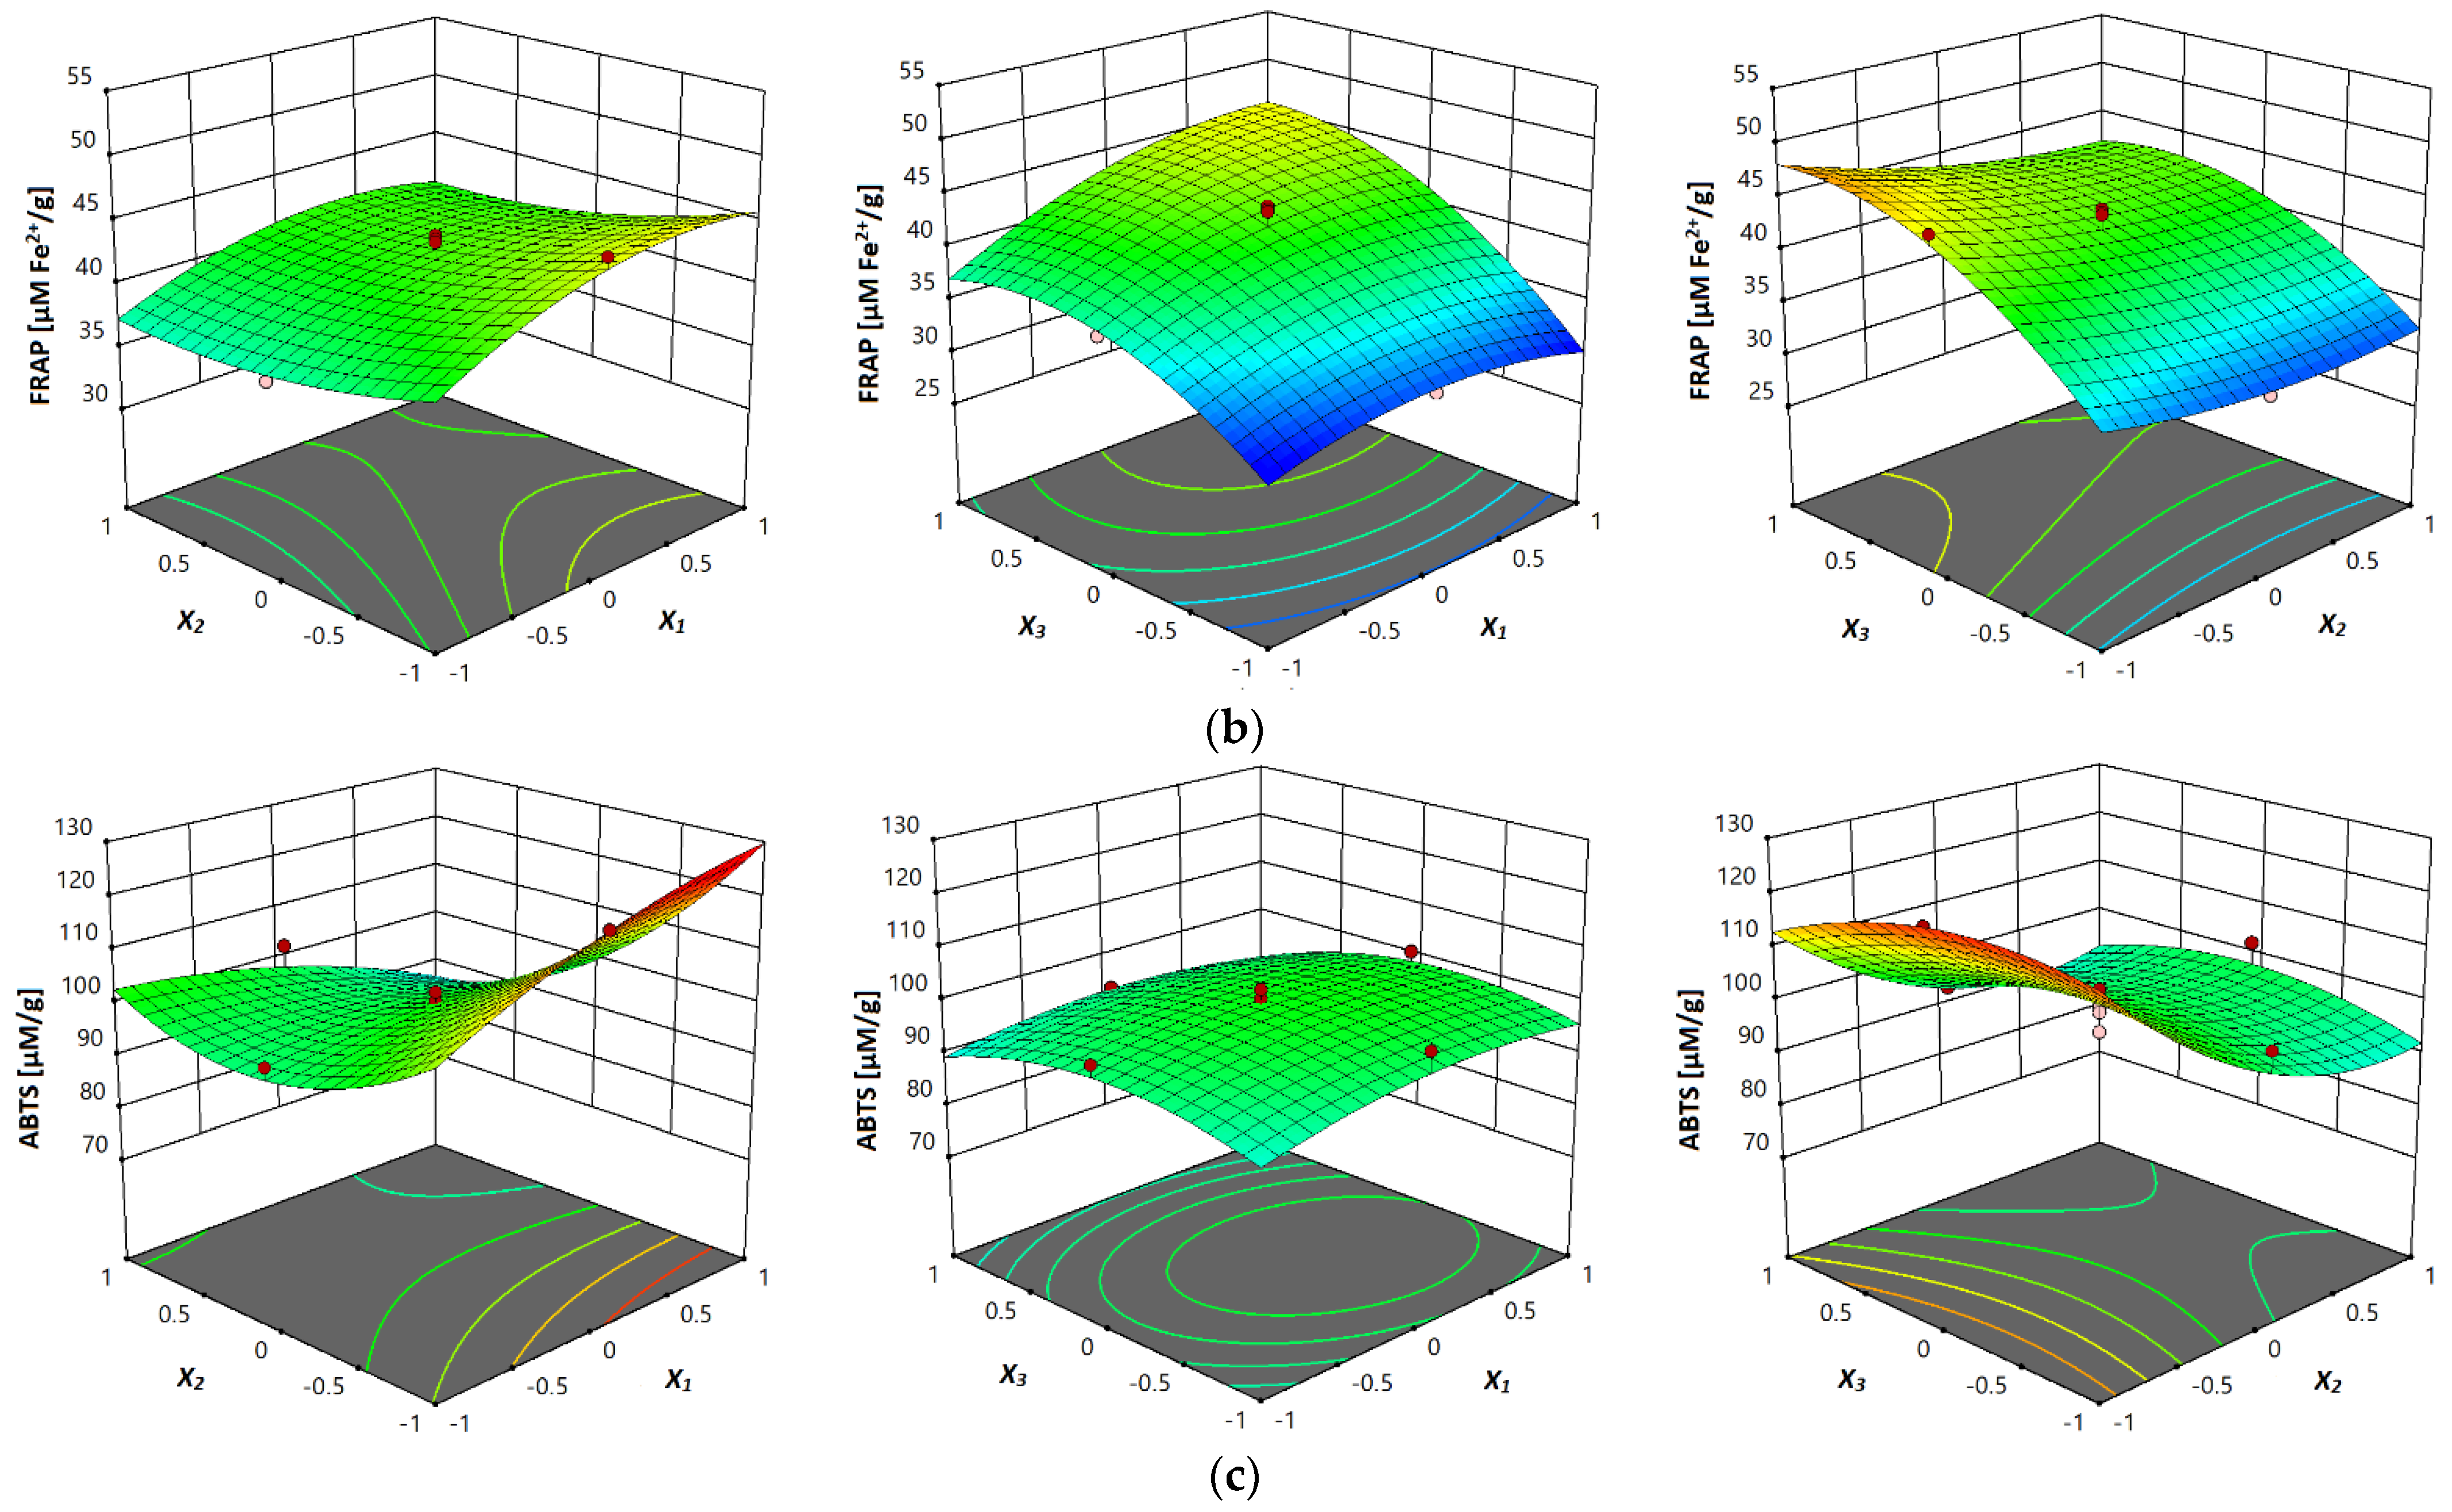
3.3.5. Antioxidant Activity (DPPH, FRAP and ABTS Assay)

The lowest antioxidant activity determined by DPPH assay in analyzed extracts was obtained in the extract observed at 40 °C, 80% and 10 mL/g (Table 2). This was also the extract in which the lowest content of total flavonoids was noticed. The highest antioxidant activity obtained by DPPH assay was obtained in the extract in which the highest content of total phenolics was also obtained, at 80 °C, 40% and 30 mL/g. From the p values shown in Table 4, it was concluded that for the linear term, all three independent variables, temperature, ethanol concentration and liquid–solid ratio, had a significant influence (p ≤ 0.05) on the antioxidant activity obtained (DPPH assay) during extraction. Regarding the p values of the interaction term, it was not found to be a significant interaction for antioxidant activity obtained by DPPH assay, while none of the investigated variables had a significant influence in the quadratic term. The equation that predicted the behavior of the studied extracts, with respect to antioxidant activity obtained by DPPH assay, is shown in Table 4.
The antioxidant activity determined by FRAP assay ranged from 30.19 to 51.33 µM Fe2+/g (Table 2). It was also observed that the lowest and the highest antioxidant activity obtained by FRAP assay were obtained in the same extracts in which the highest and the lowest antioxidant activity obtained by DPPH assay were obtained (40 °C, 80% and 10 mL/g and 80 °C, 40% and 30 mL/g, respectively). With regard to the p values of the linear term presented in Table 4, it was observed that all three investigated variables had a significant influence (p ≤ 0.05) on the antioxidant activity observed by FRAP assay of the vacuum dried sour cherry samples. It was concluded that in the case of interaction term, only the interaction between ethanol concentration and liquid–solid ratio was significant (p ≤ 0.05), while in the quadratic term, the influence of temperature was not significant. Liquid–solid ratio had a significant influence (p ≤ 0.05) on antioxidant activity observed by the FRAP assay of the vacuum dried sour cherry samples. Table 4 shows the equation of the predictive model from the second-order polynomial model for the UAE of antioxidant activity obtained by FRAP assay.
The antioxidant activity determined by ABTS assay ranged from 76.93 to 125.22 µM/g is presented in Table 2. The highest content was obtained in the extract observed at 80 °C, 80% and 10 mL/g. This was also the extract in which the highest content of total monomeric anthocyanins was observed. The lowest antioxidant activity detected by ABTS assay was obtained in the extract observed, at 80 °C, 80% and 30 mL/g. According to the results presented in Table 4, it was found that for the linear term, only one independent variable, ethanol concentration, had a significant influence (p ≤ 0.05) on the antioxidant activity obtained by ABTS assay during extraction. Regarding the p values of the interaction term, it was concluded that only the interaction between temperature and ethanol concentration had significant influence on antioxidant activity obtained by ABTS (p ≤ 0.05).
With regard to the p values of the quadratic term, it was found that the extraction time had a significant influence (p ≤ 0.05) on antioxidant activity obtained with ABTS. The equation that predicted the behavior of the studied UAE of antioxidant activity obtained by ABTS assay is shown in Table 4. Response surface plots of antioxidant activity (ABTS assay) in the investigated vacuum dried sour cherries are given in Figure 2c, where the influence of three investigated parameters can be seen. According to the results obtained by Mrkonjić et al. [42], the antioxidant activity of T. serpyllum extracts, obtained by DPPH, FRAP and ABTS assays, varied between 0.2431 and 0.2914 mMTE/g, 0.6726 and 0.935 7mM Fe2+/g and 0.4362 and 0.6482 mM TE/g, respectively. Moreover, according to the results of Chen et al. [43], FRAP values in the obtained extracts were found to be primarily affected by the solvent-to-sample ratio, and FRAP was also found to be higher at a high level of ultrasonic power and solvent-to-sample ratio. In the same work, it was noticed that with respect to ABTS assay, ABTS is also largely determined by solvent-to-sample ratio.
The response surface plots are shown in Figure 3a–c, where the correlation between investigated parameters and analyzed antioxidant activity (DPPH, FRAP and ABTS assays) of vacuum dried sour cherry extracts can be seen. In terms of all three investigated assays, in Figure 3a–c can be seen the influence of temperature, where the higher values of antioxidant activity were obtained at higher temperatures, which can be explained with the multiple influences of temperature on the process of mass-transfer, such as improved diffusion, improvement of solvent characteristics and degradation of the plant matrix [23].

3.4. Process Optimization and Experimental Verification

Ultrasound-assisted extraction parameters of vacuum dried sour cherry were optimized in order to maximize yields of the investigated chemical and biological properties. The optimized extraction conditions obtained in this research were the following: a maximum applied temperature of 80 °C, a minimum applied ethanol concentration of 40% and an 18.88 mL/g liquid–solid ratio, which presents approximately half of applied ratio values. The predicted values of the investigated responses, according to the optimized extraction conditions, were: 74.64% yield; 1.59 g GAE/100 g total phenolic content; 0.85 g CE/100 g total flavonoid content; 17.99 mg C3G/100 g total monomeric anthocyanins content; 54.90 µM/g antioxidant activity (DPPH assay); 44.72 µM Fe2+/g antioxidant activity (FRAP assay); 130.29 µM/g antioxidant activity (ABTS assay). Determination of the predicted values and optimal conditions was obtained based on the function of desirability that is in the range from zero to one. The desirability obtained in this research was 0.679. Furthermore, UAE was performed at the obtained optimized conditions of temperature, ethanol concentration and liquid–solid ratio, with the goal to validate the mathematical model predicted in this research. The results of experimentally observed responses were in good accordance with predicted values (74.72%, 1.56 g GAE/100 g, 0.86 g CE/100 g, 17.11 mg C3G/100 g, 53.84 µM/g (DPPH), 43.31 µM Fe2+/g and 131.87 µM/g (ABTS), respectively). This confirmed the successful optimization of the recovery of dried sour cherry polyphenolic antioxidants by UAE.

4. Conclusions

After the preliminary screening of the studied UAE factors (temperature, extraction time, ethanol concentration, ultrasonic power and liquid–solid ratio), it was found that three investigated parameters (temperature, liquid–solid ratio and ethanol concentration) showed the highest influence on total phenolic and monomeric anthocyanin content throughout the UAE of previously vacuum dried sour cherry samples. Therefore, mentioned parameters were selected in the main experimental design, while the analysis of responses was extended on yield content, total flavonoid content and antioxidant activity (DPPH, FRAP and ABTS assays). Face-centered experimental design was applied in order to optimize the UAE of vacuum dried sour cherry samples.
According to the obtained results, it was also found that significantly high values of the coefficients of multiple determinations (R2) were obtained for all investigated responses, between 0.8391 (DPPH) and 0.9877 (TMAC), indicating a good fit between experimentally obtained values and values predicted by the model that was applied in this research. According to the CV values, a similar conclusion was drawn as the CV values varied from 1.68% (Y) to 10.04% (DPPH). In agreement, ANOVA results were also obtained, where a good fit between experimental and predicted values was observed.
Finally, it can be concluded that multi-response optimization of UAE can be successfully applied to obtain maximum bioactivity in vacuum dried sour cherry extracts. These results provide a concept for the possible application of the extracts obtained and their use in various forms in both scientific and industrial fields. The extracted compounds can be used directly in most industries, for example in the spirits industry, or as food additives, as in essential oils and high value-added compounds.

Author Contributions

Conceptualization, B.P. and Z.Š.; methodology, A.M. and T.D.; software, B.P. and A.T.H.; validation, A.T.H. and Z.Š.; formal analysis, A.M., T.D. and B.P.; investigation, A.M. and D.B.K.; resources, B.P. and Z.Š.; data curation, B.P.; writing—original draft preparation, A.M.; writing—review and editing, B.P., D.B.K. and P.P.; visualization, B.P.; supervision, A.T.H. and Z.Š.; project administration, Z.Š.; funding acquisition, B.P., A.T.H. and Z.Š. All authors have read and agreed to the published version of the manuscript.

Funding

This research was funded by the Ministry of Education, Science and Technological Development, Republic of Serbia (Project 451-03-9/2021-14/200134) and the Croatian Science Foundation (IP-2019-04-2105).

Institutional Review Board Statement

Not applicable.

Informed Consent Statement

Not applicable.

Data Availability Statement

Data are contained within the article.

Acknowledgments

This research is part of the Project 451-03-9/2021-14/200134 and is financially supported by the Ministry of Education, Science and Technological Development, Republic of Serbia. P. Putnik and D. Bursać Kovačević wish to thank the Croatian Science Foundation for their support through the funding of project number IP-2019-04-2105.

Conflicts of Interest

The authors declare no conflict of interest.

References

  1. Blando, F.; Oomah, B.D. Sweet and sour cherries: Origin, distribution, nutritional composition and health benefits. Trends Food Sci. Technol. 2019, 86, 517–529. [Google Scholar] [CrossRef]
  2. Lukač Bulatović, M.; Rajić, Z.; Đoković, J. Development of Fruit Production and Processing in the Republic of Serbia; Балканская научная ассoциация экoнoмистoв-аграрникoв, Serbia: 2013; Volume 1. Available online: https://ageconsearch.umn.edu/record/146744 (accessed on 13 September 2021).
  3. Milošević, T.; Milošević, N.; Mladenović, J. Combining fruit quality and main antioxidant attributes in the sour cherry: The role of new clonal rootstock. Sci. Hortic. 2020, 265, 109236. [Google Scholar] [CrossRef]
  4. Zlatic, E.; Pichler, A.; Vidrih, R.; Hribar, J.; Piližota, V.; Kopjar, M. Volatile profile of sour cherry puree as affected by sucrose and trehalose. Int. J. Food Prop. 2018, 20, S3237–S3245. [Google Scholar] [CrossRef]
  5. Tepić Horecki, A.; Vakula, A.; Pavlić, B.; Jokanović, M.; Malbaša, R.; Vitas, J.; Jaćimović, V.; Šumić, Z. Comparative drying of cornelian cherries: Kinetics modeling and physico-chemical properties. J. Food Process. Preserv. 2018, 42, e13562. [Google Scholar] [CrossRef]
  6. Ciccoritti, R.; Paliotta, M.; Centioni, L.; Mencarelli, F.; Carbone, K. The effect of genotype and drying condition on the bioactive compounds of sour cherry pomace. Eur. Food Res. Technol. 2018, 244, 635–645. [Google Scholar] [CrossRef]
  7. Yılmaz, F.M.; Görgüç, A.; Karaaslan, M.; Vardin, H.; Ersus Bilek, S.; Uygun, Ö.; Bircan, C. Sour cherry by-products: Compositions, functional properties and recovery potentials—A review. Crit. Rev. Food Sci. Nutr. 2019, 59, 3549–3563. [Google Scholar] [CrossRef]
  8. Šumić, Z.; Vakula, A.; Tepić, A.; Čakarević, J.; Vitas, J.; Pavlić, B. Modeling and optimization of red currants vacuum drying process by response surface methodology (RSM). Food Chem. 2016, 203, 465–475. [Google Scholar] [CrossRef]
  9. Vakula, A.; Tepić Horecki, A.; Pavlić, B.; Jokanović, M.; Ognjanov, V.; Milović, M.; Teslić, N.; Parpinello, G.; Decleer, M.; Šumić, Z. Application of different techniques on stone fruit (Prunus spp.) drying and assessment of physical, chemical and biological properties: Characterization of dried fruit properties. J. Food Process. Preserv. 2021, 45, e15158. [Google Scholar] [CrossRef]
  10. Attila, H.; Nóra, P.; Anna, B.; Éva, B. Health effects of sour cherries with unique polyphenolic composition in their fruits. Orv. Hetil. 2018, 159, 720–725. [Google Scholar] [CrossRef] [Green Version]
  11. Nemes, A.; Szollosi, E.; Stündl, L.; Biró, A.; Homoki, J.R.; Szarvas, M.M.; Balogh, P.; Cziáky, Z.; Remenyik, J. Determination of flavonoid and proanthocyanidin profile of Hungarian sour cherry. Molecules 2018, 23, 3278. [Google Scholar] [CrossRef] [Green Version]
  12. Ivanova, N.N.; Khomich, L.M.; Perova, I.B.; Eller, K.I. Sour cherry juice nutritional profile. Vopr. Pitan. 2018, 87, 78–86. [Google Scholar] [CrossRef] [PubMed]
  13. Ghafoor, K.; Choi, Y.H.; Jeon, J.Y.; Jo, I.H. Optimization of ultrasound-assisted extraction of phenolic compounds, antioxidants, and anthocyanins from grape (Vitis vinifera) seeds. J. Agric. Food Chem. 2009, 57, 4988–4994. [Google Scholar] [CrossRef]
  14. Zia, S.; Khan, M.R.; Shabbir, M.A.; Aslam Maan, A.; Khan, M.K.I.; Nadeem, M.; Khalil, A.A.; Din, A.; Aadil, R.M. An inclusive overview of advanced thermal and nonthermal extraction techniques for bioactive compounds in food and food-related matrices. Food Rev. Int. 2020, 1–31. [Google Scholar] [CrossRef]
  15. Baldino, L.; Scognamiglio, M.; Reverchon, E. Supercritical fluid technologies applied to the extraction of compounds of industrial interest from Cannabis sativa L. and to their pharmaceutical formulations: A review. J. Supercrit. Fluids 2020, 165, 104960. [Google Scholar] [CrossRef]
  16. Bonfigli, M.; Godoy, E.; Reinheimer, M.A.; Scenna, N.J. Comparison between conventional and ultrasound-assisted techniques for extraction of anthocyanins from grape pomace. Experimental results and mathematical modeling. J. Food Eng. 2017, 207, 56–72. [Google Scholar] [CrossRef]
  17. Cai, Z.; Qu, Z.; Lan, Y.; Zhao, S.; Ma, X.; Wan, Q.; Jing, P.; Li, P. Conventional, ultrasound-assisted, and accelerated-solvent extractions of anthocyanins from purple sweet potatoes. Food Chem. 2016, 197, 266–272. [Google Scholar] [CrossRef] [PubMed]
  18. Rostagno, M.A.; Palma, M.; Barroso, C.G. Ultrasound-assisted extraction of soy isoflavones. J. Chromatogr. A 2003, 1012, 119–128. [Google Scholar] [CrossRef]
  19. Görgüç, A.; Bircan, C.; Yılmaz, F.M. Sesame bran as an unexploited by-product: Effect of enzyme and ultrasound-assisted extraction on the recovery of protein and antioxidant compounds. Food Chem. 2019, 283, 637–645. [Google Scholar] [CrossRef]
  20. Liu, Y.; Liu, H.Y.; Xia, Y.; Guo, H.; He, X.Q.; Li, H.; Wu, D.T.; Geng, F.; Lin, F.J.; Li, H.-B.; et al. Screening and process optimization of ultrasound-assisted extraction of main antioxidants from sweet tea (Lithocarpus litseifolius [Hance] Chun). Food Biosci. 2021, 43, 101277. [Google Scholar] [CrossRef]
  21. Luo, M.; Zhou, D.-D.; Shang, A.; Gan, R.-Y.; Li, H.-B. Influences of microwave-assisted extraction parameters on antioxidant activity of the extract from akebia trifoliata peels. Foods 2021, 10, 1432. [Google Scholar] [CrossRef]
  22. Chemat, F.; Rombaut, N.; Meullemiestre, A.; Turk, M.; Perino, S.; Fabiano-Tixier, A.S.; Abert-Vian, M. Review of green food processing techniques. Preservation, transformation, and extraction. Innov. Food Sci. Emerg. Technol. 2017, 41, 357–377. [Google Scholar] [CrossRef]
  23. Ramić, M.; Vidović, S.; Zeković, Z.; Vladić, J.; Cvejin, A.; Pavlić, B. Modeling and optimization of ultrasound-assisted extraction of polyphenolic compounds from Aronia melanocarpa by-products from filter-tea factory. Ultrason. Sonochem. 2015, 23, 360–368. [Google Scholar] [CrossRef]
  24. Aydar, A.Y. Utilization of response surface methodology in optimization of extraction of plant materials. In Statistical Approaches with Emphasis on Design of Experiments Applied to Chemical Processes; InTech: London, UK, 2018. [Google Scholar]
  25. Vakula, A.; Šumić, Z.; Zeković, Z.; Tepić Horecki, A.; Pavlić, B. Screening, influence analysis and optimization of ultrasound-assisted extraction parameters of cornelian cherries (Cornus mas L.). J. Food Process. Preserv. 2019, 43, e14226. [Google Scholar] [CrossRef]
  26. Živković, J.; Šavikin, K.; Janković, T.; Ćujić, N.; Menković, N. Optimization of ultrasound-assisted extraction of polyphenolic compounds from pomegranate peel using response surface methodology. Sep. Purif. Technol. 2018, 194, 40–47. [Google Scholar] [CrossRef]
  27. Zeković, Z.; Pintać, D.; Majkić, T.; Vidović, S.; Mimica-Dukić, N.; Teslić, N.; Versari, A.; Pavlić, B. Utilization of sage by-products as raw material for antioxidants recovery—Ultrasound versus microwave-assisted extraction. Ind. Crops Prod. 2017, 99, 49–59. [Google Scholar] [CrossRef]
  28. Šumić, Z.; Tepić, A.; Vidović, S.; Jokić, S.; Malbaša, R. Optimization of frozen sour cherries vacuum drying process. Food Chem. 2013, 136, 55–63. [Google Scholar] [CrossRef]
  29. Singleton, V.L.; Rossi, J.A. Colorimetry of total phenolics with phosphomolybdic-phosphotungstic acid reagents. Am. J. Enol. Vitic. 1965, 16, 144–158. [Google Scholar] [CrossRef]
  30. Harborne, J.B. Methods of Plant Analysis; Springer: Dordrecht, The Netherlands, 1984. [Google Scholar]
  31. Fuleki, T.; Francis, F.J. Quantitative methods for anthocyanins. 1. extraction and determination of total anthocyanin in Cranberries. J. Food Sci. 1968, 33, 72–77. [Google Scholar] [CrossRef]
  32. Brand-Williams, W.; Cuvelier, M.E.; Berset, C. Use of a free radical method to evaluate antioxidant activity. LWT Food Sci. Technol. 1995, 28, 25–30. [Google Scholar] [CrossRef]
  33. Benzie, I.F.F.; Strain, J.J. The ferric reducing ability of plasma (FRAP) as a measure of “antioxidant power”: The FRAP assay. Anal. Biochem. 1996, 239, 70–76. [Google Scholar] [CrossRef] [Green Version]
  34. Re, R.; Pellegrini, N.; Proteggente, A.; Pannala, A.; Yang, M.; Rice-Evans, C. Antioxidant activity applying an improved ABTS radical cation decolorization assay. Free Radic. Biol. Med. 1999, 26, 1231–1237. [Google Scholar] [CrossRef]
  35. Kumar, K.; Srivastav, S.; Sharanagat, V.S. Ultrasound assisted extraction (UAE) of bioactive compounds from fruit and vegetable processing by-products: A review. Ultrason. Sonochem. 2021, 70, 105325. [Google Scholar] [CrossRef]
  36. Zou, T.-B.; Wang, M.; Gan, R.Y.; Ling, W.H. Optimization of ultrasound-assisted extraction of anthocyanins from mulberry, using response surface methodology. Int. J. Mol. Sci. 2011, 12, 3006–3017. [Google Scholar] [CrossRef]
  37. Medina-Torres, N.; Ayora-Talavera, T.; Espinosa-Andrews, H.; Sánchez-Contreras, A.; Pacheco, N. Ultrasound assisted extraction for the recovery of phenolic compounds from vegetable sources. Agronomy 2017, 7, 47. [Google Scholar] [CrossRef]
  38. Dumitraşcu, L.; Enachi, E.; Stănciuc, N.; Aprodu, I. Optimization of ultrasound assisted extraction of phenolic compounds from cornelian cherry fruits using response surface methodology. CYTA J. Food 2019, 17, 814–823. [Google Scholar] [CrossRef]
  39. Chen, X.Q.; Li, Z.H.; Wang, Z.J.; Liu, L.L.; Sun, T.T.; Ma, J.Z.; Zhang, Y. Ultrasound-assisted extraction of total anthocyanins from Rubia sylvatica Nakai fruit and radical scavenging activity of the extract. Ind. Crops Prod. 2020, 150, 112420. [Google Scholar] [CrossRef]
  40. Esmaeilzadeh Kenari, R.; Dehghan, B. Optimization of ultrasound-assisted solvent extraction of hemp (Cannabis sativa L.) seed oil using RSM: Evaluation of oxidative stability and physicochemical properties of oil. Food Sci. Nutr. 2020, 8, 4976–4986. [Google Scholar] [CrossRef] [PubMed]
  41. Kashyap, P.; Riar, C.S.; Jindal, N. Optimization of ultrasound assisted extraction of polyphenols from Meghalayan cherry fruit (Prunus nepalensis) using response surface methodology (RSM) and artificial neural network (ANN) approach. J. Food Meas. Charact. 2021, 15, 119–133. [Google Scholar] [CrossRef]
  42. Mrkonjić, Ž.; Rakić, D.; Kaplan, M.; Teslić, N.; Zeković, Z.; Pavlić, B. Pressurized-liquid extraction as an efficient method for valorization of thymus serpyllum herbal dust towards sustainable production of antioxidants. Molecules 2021, 26, 2548. [Google Scholar] [CrossRef]
  43. Chen, S.; Zeng, Z.; Hu, N.; Bai, B.; Wang, H.; Suo, Y. Simultaneous optimization of the ultrasound-assisted extraction for phenolic compounds content and antioxidant activity of Lycium ruthenicum Murr. fruit using response surface methodology. Food Chem. 2018, 242, 1–8. [Google Scholar] [CrossRef]
  44. Ciric, A.; Krajnc, B.; Heath, D.; Ogrinc, N. Response surface methodology and artificial neural network approach for the optimization of ultrasound-assisted extraction of polyphenols from garlic. Food Chem. Toxicol. 2020, 135, 110976. [Google Scholar] [CrossRef] [PubMed]
  45. Sasikumar, R.; Das, D.; Jaiswal, A.K. Effects of extraction methods and solvents on the bioactive compounds, antioxidant activity, and storage stability of anthocyanin rich blood fruit (Haematocarpus validus) extracts. J. Food Process. Preserv. 2021, 45, e15401. [Google Scholar] [CrossRef]
Figure 1. Pareto charts showing influence of five UAE parameters (A—temperature; B—extraction time; C—ethanol concentration; D—ultrasonic power; E—liquid–solid ratio) on contents of (a) TP and (b) TMA in vacuum dried sour cherries extracts.
Separations 08 00155 g001aSeparations 08 00155 g001b
Figure 2. Response surface plots showing combined effects of UAE parameters (x1—temperature; x2—ethanol concentration; x3—liquid–solid ratio) on: (a) yield, (b) total phenols content (TP), (c) total flavonoids content (TF) and (d) total monomeric anthocyanins.
Separations 08 00155 g002aSeparations 08 00155 g002b
Figure 3. Response surface plots showing combined effects of UAE parameters (x1—temperature; x2—ethanol concentration; x3—liquid–solid ratio) on: (a) DPPH antiradical activity, (b) FRAP reducing capacity and (c) ABTS antiradical activity.
Separations 08 00155 g003aSeparations 08 00155 g003b
Table 1. Applied 25-1-factorial design for screening the factors of UAE that affect total phenols content (TP) and total monomeric anthocyanins (TMA).
RunFactorsResponses
Temperature
(°C)
Extraction Time (min)Ethanol Concentration (%)Ultrasonic Power (W/L)Liquid–Solid Ratio (mL/g)TP
(g GAE/100 g)
TMA
(mg C3G/100 g)
CodedNaturalCodedNaturalCodedNaturalCodedNaturalCodedNatural
1−140140160160−1101.313124.4973
2−140−120160−130−1101.231119.8717
3−140140−140−130−1101.040221.0907
4−140−120−140−1301201.386428.7221
5−140−120−140160−1100.865016.7824
6−140−1201601601201.328023.5788
7160−120−140−130−1101.337830.0580
8160−120160160−1101.511823.7625
9160140−140−1301201.649130.7927
10160−120160−1301201.570532.5294
11160140−140160−1101.541028.5551
12160140160−130−1101.502927.8370
131601401601601201.628930.9263
14−140140−1401601201.393130.5924
15160−120−1401601201.334729.8576
16−140140160−1301201.750232.9970
Table 2. Experimental design (face-centered central composite) with coded and natural levels of the parameters of UAE and experimentally observed values of investigated responses.
Independent VariablesResponses
RunTemperature
(°C)
Ethanol Concentration (%)Liquid–Solid Ratio (mL/g)Y (%)TP
(g GAE/100 g)
TF
(g CE/100 g)
TMA
(mg C3G/100 g)
DPPH
(µM/g)
FRAP
(µM Fe2+/g)
ABTS
(µM/g)
140401071.961.390.7727.7540.1731.72109.33
240803075.661.870.7210.5044.3037.31101.18
340801069.031.200.6029.2236.6530.1991.07
440602073.301.390.7815.7340.5336.9498.26
540403074.371.880.7810.6247.3339.9196.90
660402072.041.600.8716.5540.8946.23122.42
760602070.101.440.7516.6240.7843.9399.02
860602068.701.490.7815.7142.1040.47102.26
960603069.001.870.809.8053.1942.5093.19
1060802066.241.270.7213.8138.9738.87102.07
1160602068.001.470.7314.3350.4443.39100.54
1260602067.921.430.7815.3150.9642.0394.13
1360602070.741.430.7413.9152.7843.6297.88
1460601067.071.380.7727.6751.0031.80100.76
1580801064.691.160.6127.6037.0231.3783.84
1680803069.271.870.8011.4752.0843.7876.93
1780403070.591.960.8110.3569.6951.33123.45
1880602071.441.510.8016.2157.5840.81100.48
1980401075.571.570.8430.1752.3131.80125.22
Table 3. ANOVA for fitting experimental data with second-order polynomial model.
SourceSum of SquaresDFMean SquareF Valuep Value
Yield
Model153.21917.0212.230.0005
Residual12.5391.39
Lack of fit6.0851.220.750.6253
R2 = 0.9244
CV = 1.68%
Total phenols content
Model1.04890.116553.879.4 × 10−7
Residual0.019590.0022
Lack of fit0.001650.00323.91340.1053
R2 = 0.9818
CV = 3.03%
Total flavonoids content
Model0.069690.00775.79930.0076
Residual0.012090.0013
Lack of fit0.010150.00204.31340.0908
R2 = 0.8529
CV = 4.80%
Total monomeric anthocyanins
Model891.49999.0679.971.65 × 10−7
Residual11.148191.2387
Lack of fit4.446451.28931.09690.4776
R2 = 0.9877
CV = 6.34%
DPPH
Model1058.709117.635.21630.0109
Residual202.96922.55
Lack of fit80.22516.04480.52290.7533
R2 = 0.8391
CV = 10.04%
FRAP
Model589.1965.4521.265.02 × 10−5
Residual27.2193.0787
Lack of fit19.4353.88651.87840.2806
R2 = 0.9551
CV = 4.46%
ABTS
Model2545.69282.813.040.0004
Residual195.2921.68
Lack of fit157.4531.48533.33890.1330
R2 = 0.9288
CV = 4.61%
Table 4. Corresponding p values for regression coefficients from the second-order polynomial model and predictive model equations.
Responses
TermYTPTFTMADPPHFRAPABTS
Linear
x10.0076 *0.0416 *0.08900.58610.0032 *0.0025 *0.3940
x20.0005 *6.63 × 10−5 *0.0005 *0.44070.0223 *0.0066 *1.65 × 10−5 *
x30.0196 *1.66 × 10−8 *0.0225 *1.06 × 10−9 *0.0093 *2.49 × 10−6 *0.2390
Interaction
x120.0115 *0.0472 *0.94430.39600.08140.45940.0003 *
x130.0198 *0.58130.71750.97530.22190.0085 *0.6403
x230.0026 *0.0037 *0.0111 *0.52070.89500.13360.2192
Quadratic
x110.0013 *0.93920.57510.23240.48690.05520.2955
x220.93520.64430.91940.92060.0367 *0.23780.0072 *
x330.17710.0002 *0.52240.0004 *0.10790.0040*0.0814
ResponsePredictive model equation
YY = 69.09 − 1.28x1 − 1.96x2 + 1.06x3 − 1.32x12 − 1.18x13 + 1.72x23 + 3.29x12 + 0.060x22 − 1.045x32
TPTP = 1.452 + 0.035x1 − 0.102x2 + 0.276x3 − 0.0378x12 − 0.009x13 + 0.064x23 − 0.002x12 − 0.013x22 + 0.176x32
TFTF = 0.776 + 0.022x1 − 0.061x2 + 0.032x3 − 0.001x11 + 0.005x13 + 0.041x23 − 0.013x12 − 0.002x22 − 0.015x32
TMATMA = 15.15 + 0.199x1 − 0.284x2 − 8.97x3 − 0.351x12 − 0.013x13 + 0.253x23 + 0.862x12 + 0.069x22 + 3.63x32
DPPHDPPH = 47.22 + 5.970x1 − 4.137x2 + 4.944x3 − 3.294x12 + 2.203x13 − 0.228x23 + 2.083x12 − 7.043x22 + 5.128x32
FRAPFRAP = 42.03 + 2.302x1 − 1.946x2 + 5.794x3 − 0.480x12 + 2.081x13 − 1.023x23 − 2.337x12 + 1.342x22 − 4.065x32
ABTSABTS = 100.43 + 1.318x1 − 12.223x2 − 1.857x3 − 9.240x12 − 0.796x13 + 2.174x23 − 3.129x12 + 9.741x22 − 5.528x32
* Significant at 0.05 level.
Publisher’s Note: MDPI stays neutral with regard to jurisdictional claims in published maps and institutional affiliations.

