Article

A Simple Microextraction Method for Toxic Industrial Dyes Using a Fatty-Acid Solvent Mixture

by
Danielle P. Arcon
and
Francisco C. Franco
*
Chemistry Department, De La Salle University, 2401 Taft Avenue, Manila 0922, Philippines
*
Author to whom correspondence should be addressed.
Separations 2021, 8(9), 135; https://doi.org/10.3390/separations8090135
Submission received: 2 August 2021 / Revised: 18 August 2021 / Accepted: 19 August 2021 / Published: 26 August 2021

Abstract

:
A mixture of dodecanoic and hexanoic fatty acids was used to perform a simple and efficient microextraction method for industrial dyes such as methylene blue (MB), methyl violet (MV), and malachite green (MG) in aqueous solution. The fatty-acid microextractants were simply mixed and heated until the mixture became homogeneous before adding it to the dye solutions. The fatty-acid solvent and its components were characterized with Fourier transform infrared spectroscopy (FTIR) and proton nuclear magnetic resonance (1H NMR) measurements, while the dye concentrations were measured using UV-Vis spectroscopy. The performance of the extracting mixture was observed to vary across different dye contaminants, dosages of the extractant, concentrations of the dyes, and contact times. High extraction efficiencies of up to ~99% were obtained for MG as well as MV, and ~73% efficiency was achieved for MB. The study shows how a mixture of fatty acids can be used as a simple, efficient, green, and sustainable low-volume method for the removal of toxic industrial dyes in aqueous solutions.

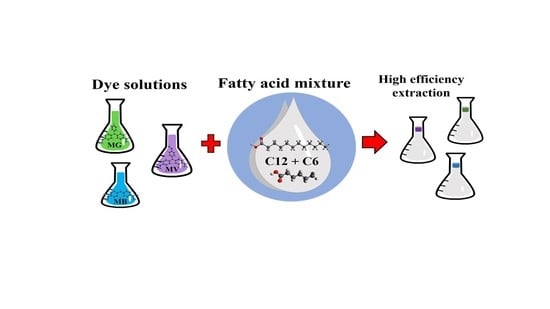
Graphical Abstract

1. Introduction

A vast range of micropollutants heavily permeate several industries. Though broadly relevant in the production of several commodities, the adverse impacts of micropollutants such as dyes, pesticides, and pharmaceutical residues characterize a risk to the environment and exposed organisms [1,2,3]. Dyes alone have been linked to detrimental threats such as cytotoxicity and mutagenic effects [4,5]. As a potent micropollutant chiefly used in the textile, food, and printing industries, the impact of dye contamination reduces water quality and interferes with the photosynthetic activity of microorganisms [6,7]. The accumulation of toxic dyes in bodies of water can cause severe environmental and health hazards. Therefore, an efficient method to treat dye effluent is vital.
Conventional water treatment methods have been the traditional practice in addressing contamination by dye effluents, but collective efforts have been drawn to circumvent their disadvantages such as difficulties in regeneration and high amounts of sludge formation [8,9]. In recent years, numerous natural and synthetic routes have been used to explore alternatives such as ionic liquids (ILs) [10], advanced oxidation processes (AOPs) [11], and a diverse set of bioremediation approaches [12,13]. However, while these alternative techniques are able to reduce the concentration of dyes in aquatic environments, the combination of efficiency, sustainability, and economic feasibility remains to be an elusive balance to be achieved from a single method.
The use of fatty-acid mixtures has been gaining attention in recent years for their use in green applications. Beyond their role as phase-change materials (PCMs) [14,15], fatty acids have been applied for a broad range of uses that encompass applications in latent heat thermal energy storage (LHTES) [16] and water remediation to reduce the presence of micropollutants in aqueous environments [17,18,19]. In maximizing their desirable properties, previous studies have investigated their role in the extraction of compounds such as alkylphenols [20], fluoroquinolones [21], and endocrine-disrupting compounds (EDCs) [22] that threaten the survival of aquatic organisms.
Binary mixtures of fatty acids represent a vast potential in wastewater remediation, and, to expand their role towards green initiatives, their performance is herein assessed. This study explores their performance in dye remediation using the binary combination of hexanoic acid and dodecanoic acid as a microextractant for methylene blue (MB), methyl violet (MV), and malachite green (MG) as shown in Figure 1. With many potential advantages including rapid dye absorption, facile preparations, high efficiency, and minimal volume requirement, the use of fatty-acid-based mixtures presents a green and promising solvent for microextraction methods.
The study aims to investigate the spectral profile of the fatty-acid mixture and to probe the influencing variables that may boost or hinder its performance as a dye extractant. FTIR measurements were conducted to explore if the characteristic peaks of the mixture components would indicate significant changes before and after mixing. 1H NMR measurements were carried out to establish how mixing the fatty acids may impact hydrogen bond strength and the solvent’s behavior upon exposure to water which could influence its extraction capacity. With the use of a liquid–liquid microextraction method and the determination of the solvent’s efficiency via UV-Vis measurements, the proposed approach of the study leveraged the benefits of simplicity and the rapid route of both solvent preparation and analyses.

2. Results and Discussion

2.1. FTIR and 1H NMR Measurements

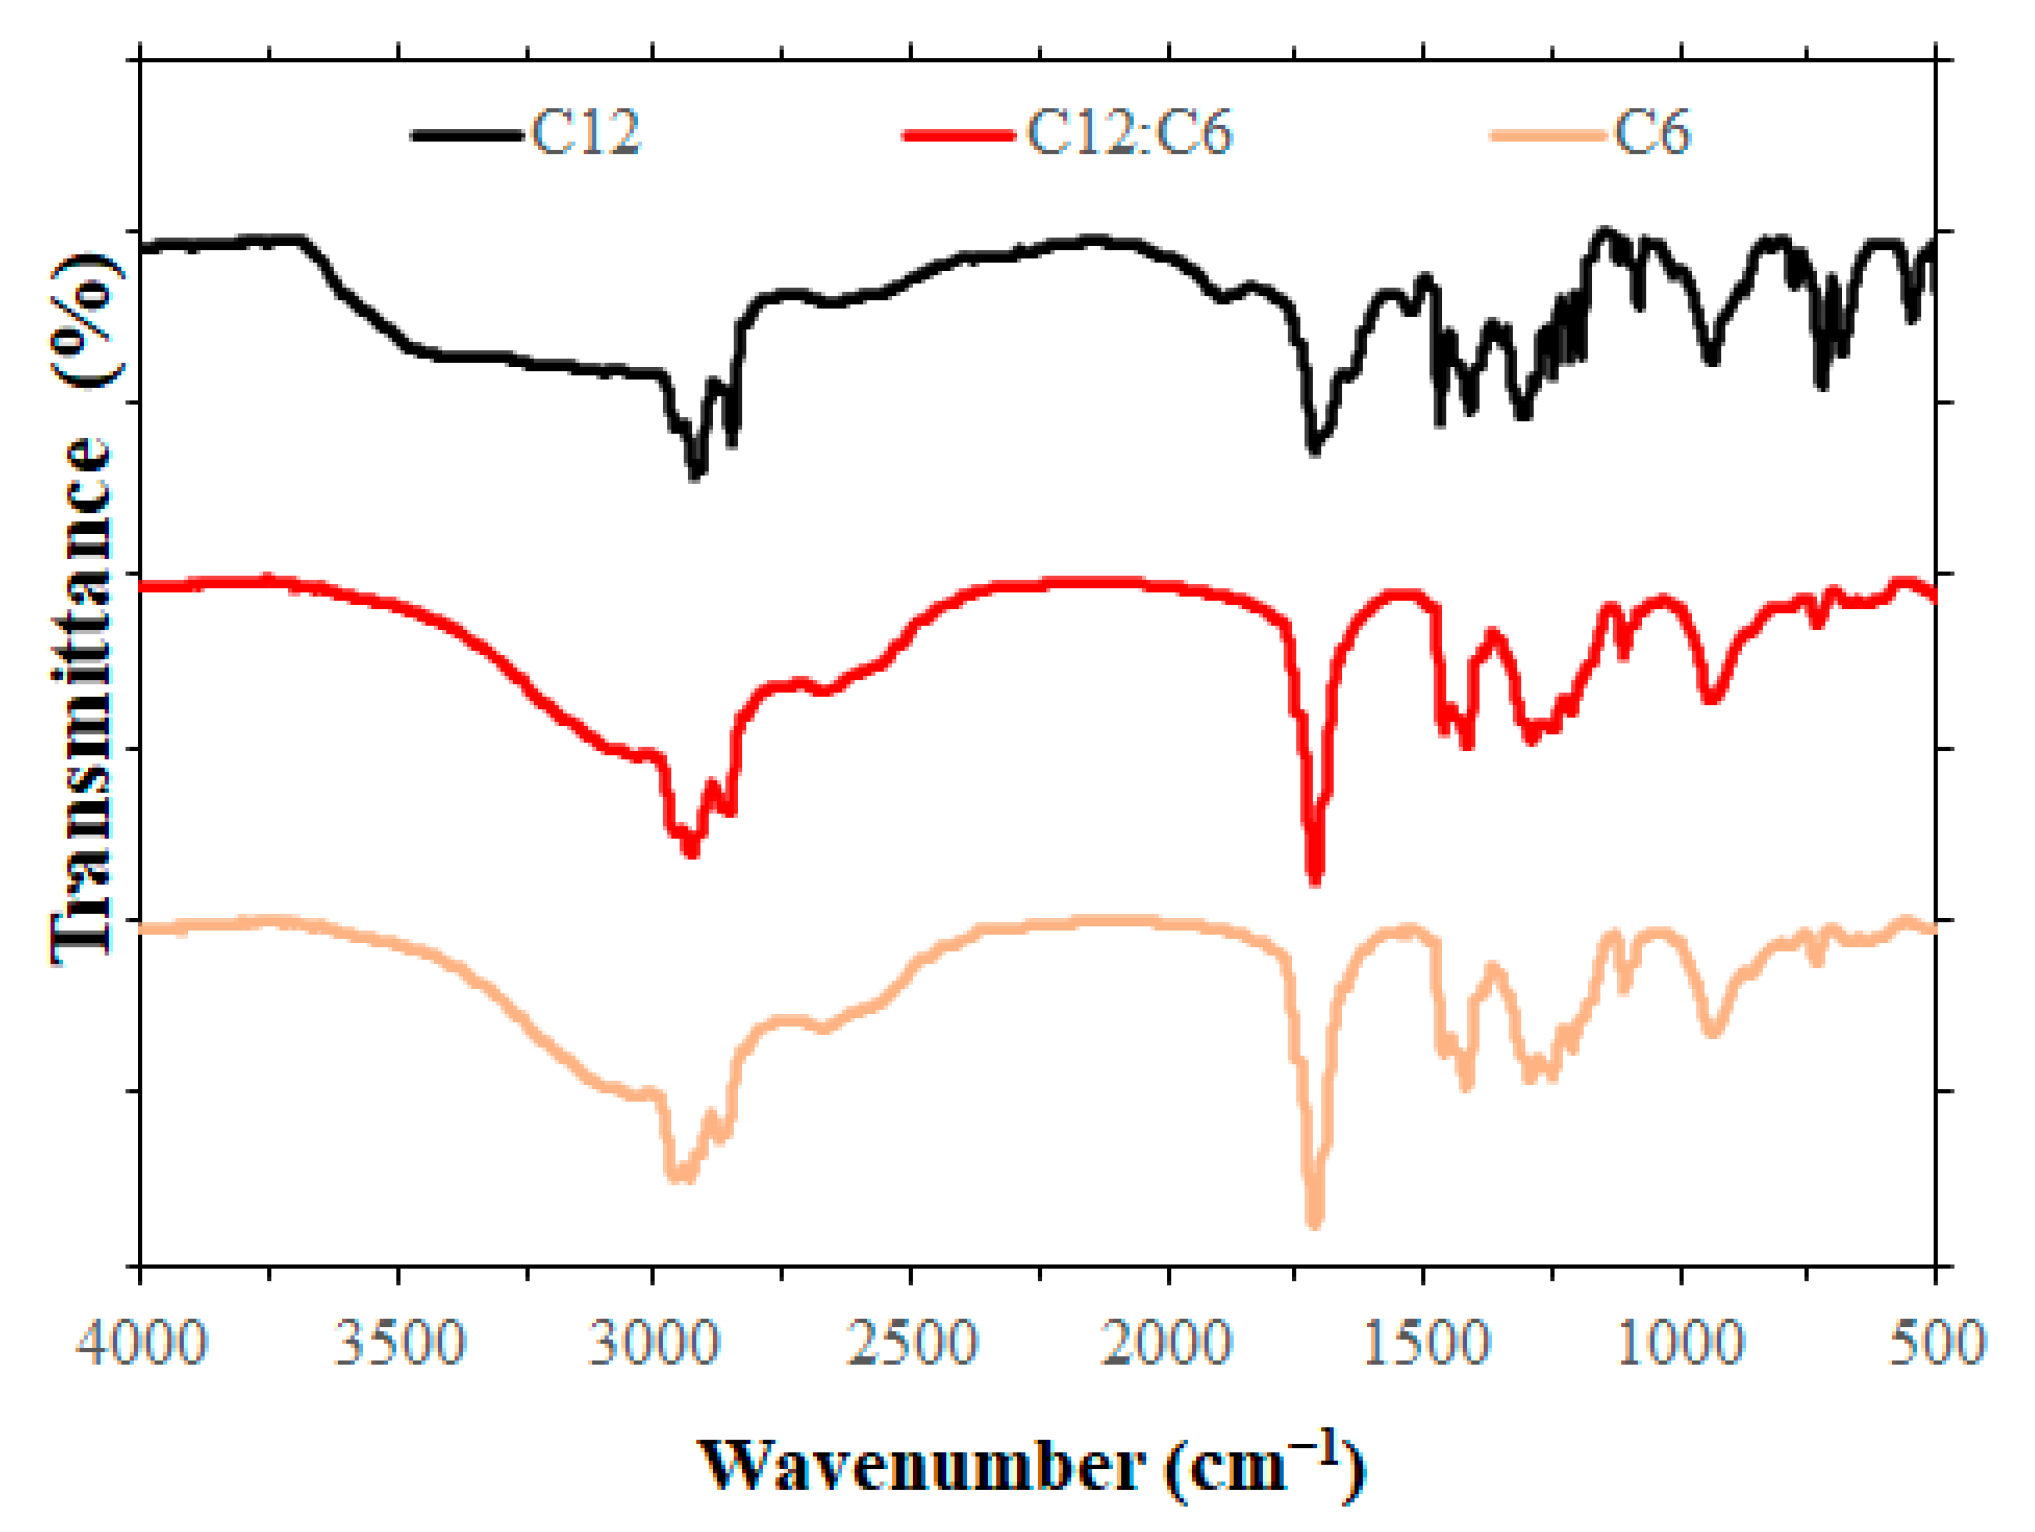
Figure 2 shows the FTIR spectra of the C12:C6 fatty-acid mixture prepared. Vibrations found at ~2900 cm−1 and ~2800 cm−1 wavenumbers correspond to the stretching -CH3 and -CH2 vibrations, respectively. The 1700 cm−1 peak is attributed to the stretching mode of C=O, while the broad peaks found between 3000 cm−1 and 3500 cm−1 are assigned to the hydroxyl group of the fatty acids. Comparing between the spectra of the mixture and its individual components, it was observed that they had the same characteristic peaks, which suggests that there was no chemical reaction that occurred between the hexanoic and dodecanoic fatty-acid components, consistent with previous reports [23,24].
Figure 3 shows the 1H NMR spectra and 1H assignments of the C12 and C6 fatty acids and their C12:C6 mixture. As observed in the FTIR spectra above, the 1H NMR spectra also confirm that the fatty acids in the mixture did not have any chemical reaction as no additional peaks were observed after mixing the C12 and C6 fatty acids [25]. Additionally, the resonance signals did not have significant changes in chemical shifts (Supplementary Materials, Table S1) before and after mixing which shows that the hydrogen bonding strengths did not vary greatly between the individual fatty acids and when combined to form the mixtures. The results show that the preparation of the solvent in this study promoted a maximized atom economy without the formation of side products and could be a sustainable solvent [26,27].
The 1H NMR spectra of the C12:C6 mixture after mixing with water was also determined to understand possible changes in the mixture during extractions in aqueous solution, as shown in Figure 3. Water was first introduced in a vial and was continuously mixed with the fatty-acid layer using a pipette by a series of suction and expulsion steps to form temporary emulsion droplets. The mixture was then allowed to stand until phase separation between the aqueous phase and the fatty-acid layer was achieved, and the hydrophobic layer was then subjected to 1H NMR measurement. From the results, the hydrogens in the aliphatic chain were not greatly affected by the introduction of water and their chemical shifts were similar. However, the resonance signals corresponding to the hydrogens of the carboxyl groups were observed to have significant upfield shifts (SI, Table S1), i.e., they were more shielded, which showed that the introduction of water disrupted the hydrogen bonding interactions of the fatty-acid components, similarly observed in previous studies upon the addition of water [28,29]. This attribute could be seen as an advantage as earlier studies also positively noted the influence of water in potentially improving the efficiency of solvents for various extraction methods and applications [18,30].

2.2. Liquid–Liquid Microextraction

The extraction efficiencies at various experimental conditions of the fatty-acid mixture and dye solutions were varied: (1) dye solution, (2) dye concentration, (3) C12:C6 dose, and (4) contact time, and the changes in the extraction efficiencies were presented. Concentrations were varied between 50 μmol/L and 500 μmol/L for the three dyes: methylene blue (MB), methyl violet (MV), and malachite green (MG). Varying the volume of the solvent extractant could have led to the possibility of increasing the dye uptake but could also have led towards decreasing the solvent’s extraction efficiency, and in line with this, the solvent dose was tested between 30 μL and 600 μL [31].
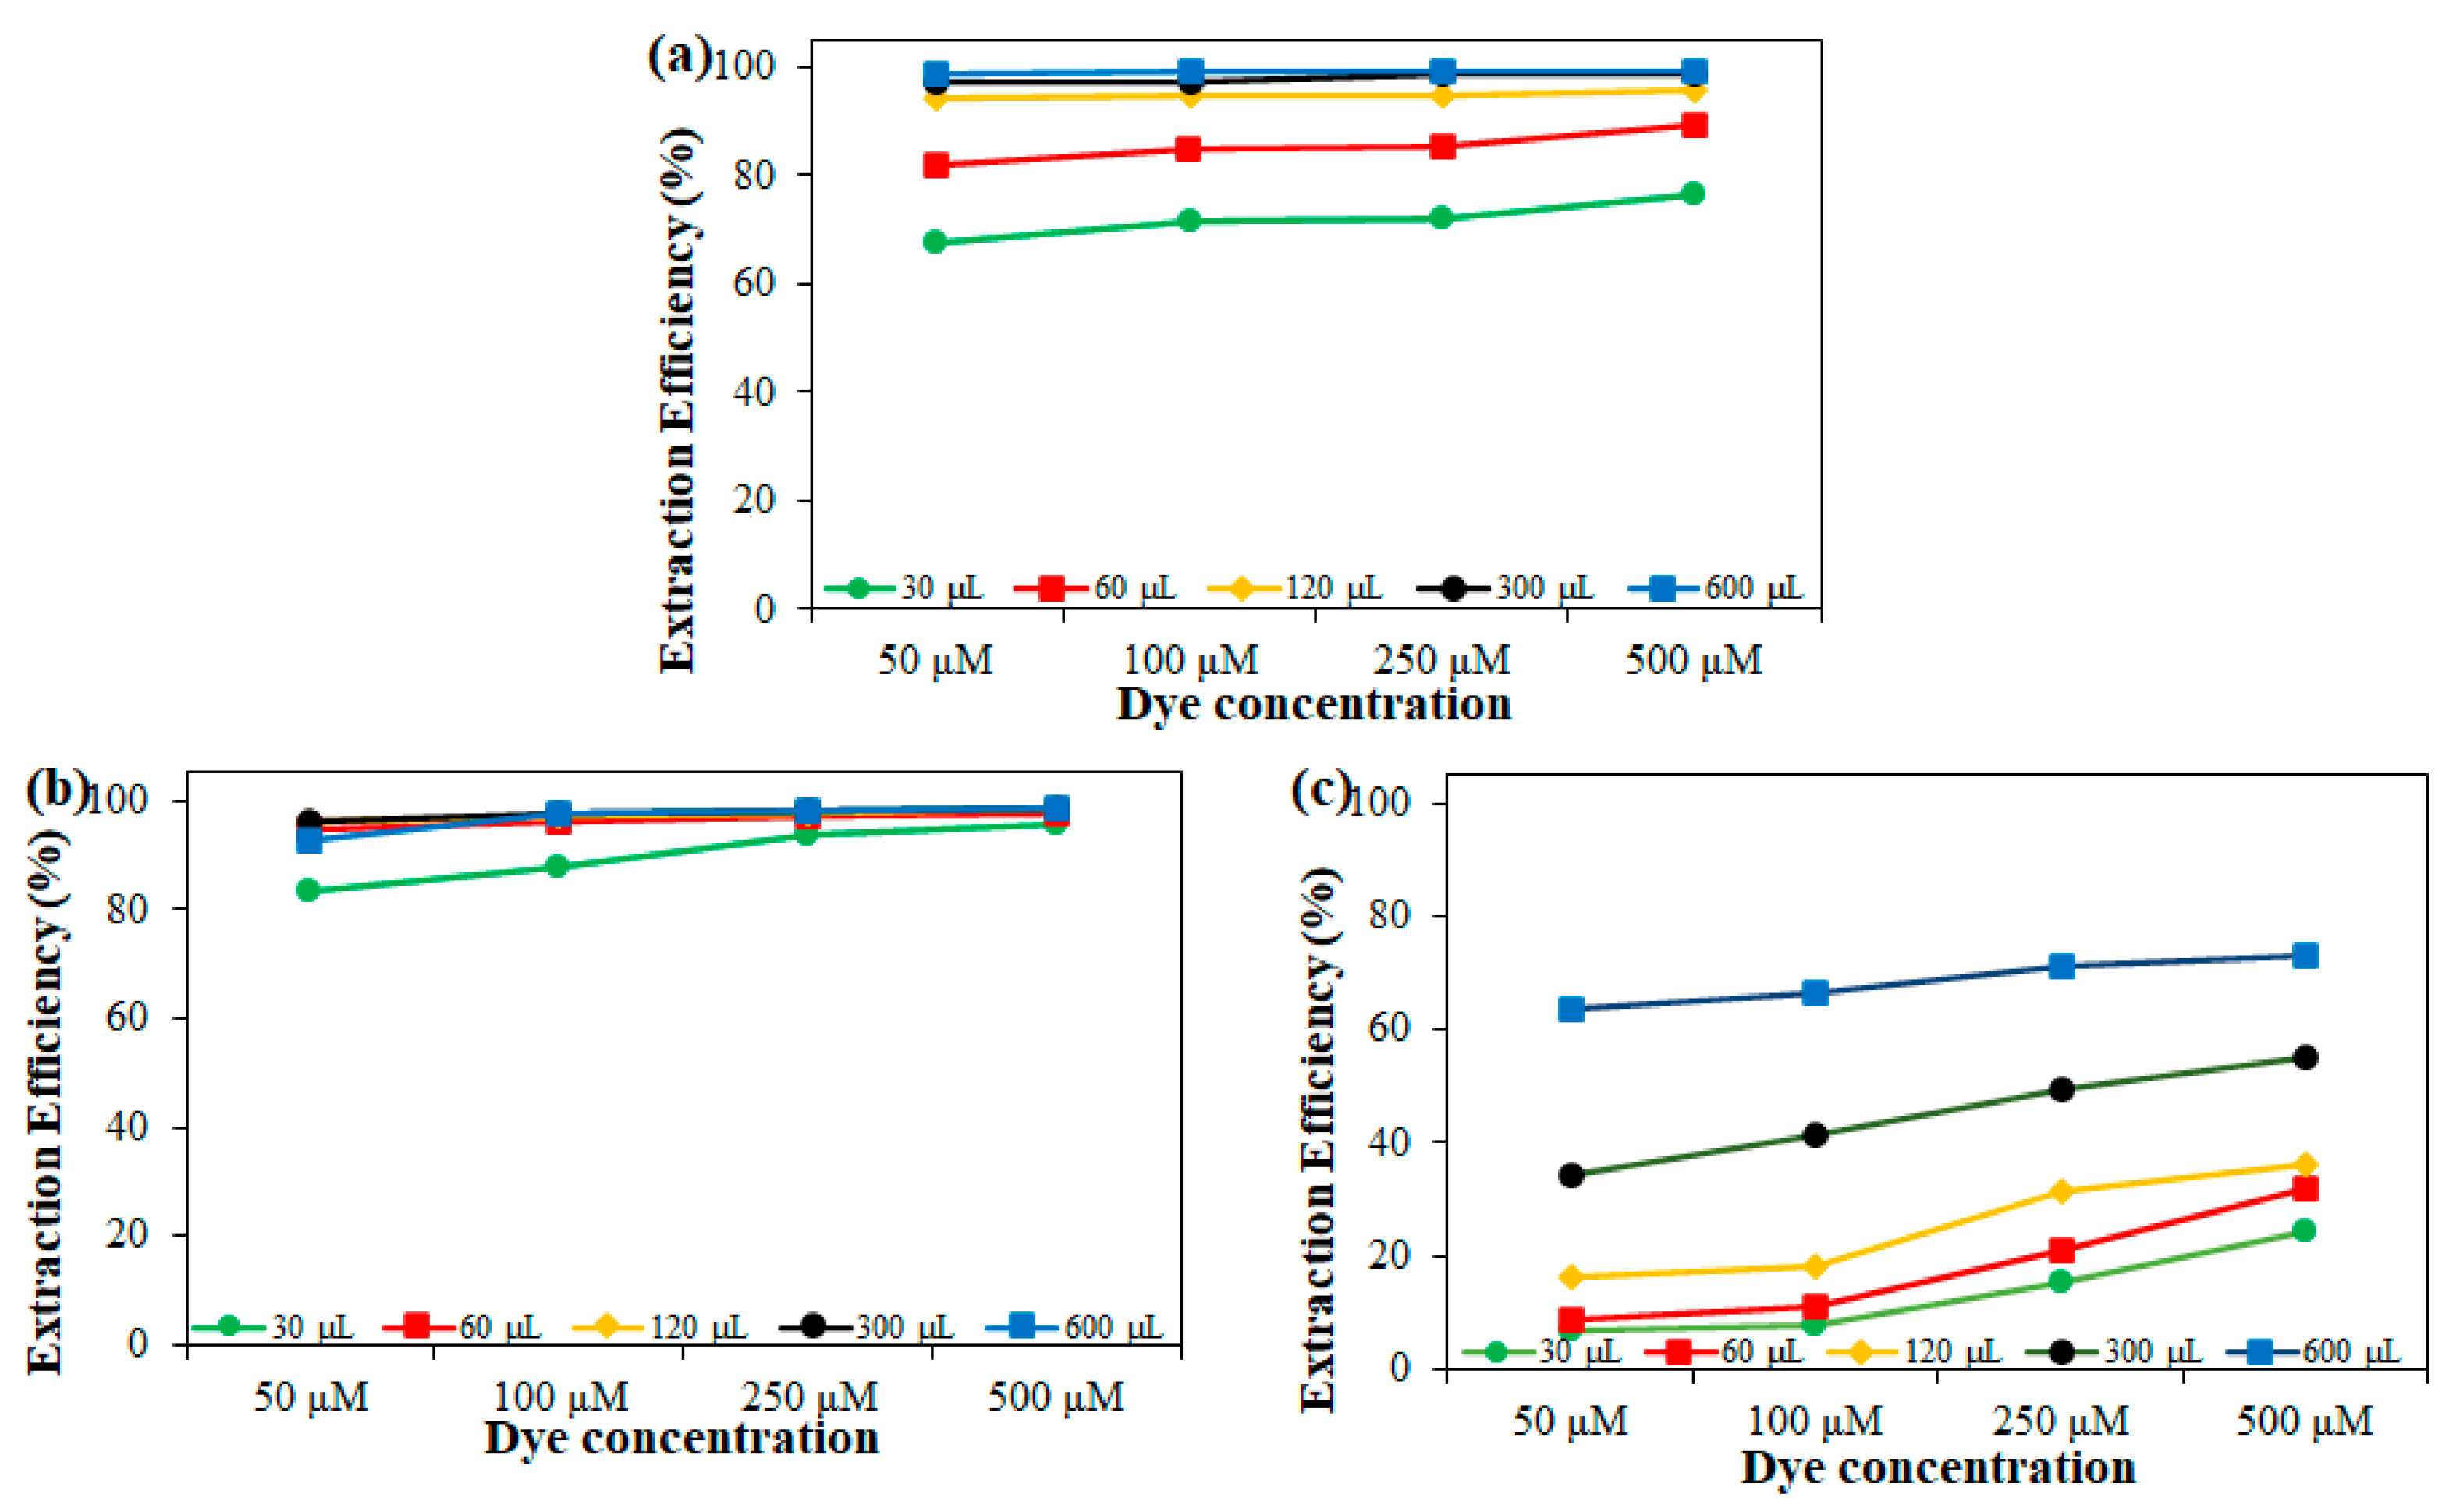
Figure 4 presents the extraction efficiencies for the dyes after 24 h exposure at increasing C12:C6 mixture volumes and dye concentrations. It can be observed that in the dye solutions, extraction efficiencies generally increased as the volume of the C12:C6 mixture increased from 30 μL to 600 μL, and an increase in dye concentration was also followed by an increase in the solvent’s efficiency. Higher extractant volumes were able to increase the possibility of dye dissolution and extraction, and as a result, close to 100% efficiency was achieved at 600 μL of the C12:C6 mixture for the MG and MV dyes. The highest extraction efficiency of 99.3% for the MG dye was achieved at 600 μL extractant volume and 500 μmol/L dye concentration. The highest efficiency for MB (73.1%) was also achieved at similar parameters, while the maximum value for MV was recorded at 98.6%. The minimum and maximum extraction efficiencies during the 24 h extraction are summarized in Table 1.
Comparing the effects of dye concentration in the three dyes, it can be observed that the increase in dye concentration only had a minimal effect on the 24 h extraction performance of C12:C6 on MG and MV due to their high efficiencies, whereas the increase in MB dye concentration contributed a more notable increase in efficiency. The increase in the extraction efficiency with the increase in dye concentration could be attributed to the increase in the driving force due to mass transfer [32]. When the dye concentration was low, the mass transfer was slower, and the equilibrium of the dye distribution in the fatty-acid mixture and aqueous phase was reached faster. Conversely, increasing the dye concentration may have favorably accompanied high mass transfer, and the equilibrium of the dye distribution may not have been reached, suggesting that the dye extraction could still have been ongoing even after 24 h.
Between the three higher extractant volumes (120 μL, 300 μL, and 600 μL) used in MG extraction, the difference in efficiency was not greater than ~5% as the MG concentration increased from 50 μmol/L to 500 μmol/L. Related to this, across all concentrations for MV, the three higher volumes showed a ~3% difference in the extraction of MV for all dye concentrations used. These observations showed that the performances of C12:C6 mixtures for MG and MV were virtually the same even in large dye concentrations, especially when the extractant volume was high. However, although the C12:C6 fatty-acid mixture could efficiently extract MG and MV dyes, the same level of efficiency was not observed for MB.
With the extraction of MB, when the increments of extractant volume and dye concentration were increased, both exhibited significant effects on C12:C6 efficiency. At 50 μmol/L, there was a ~47% jump in efficiency between 120 μL and 600 μL, and at 500 μmol/L, there was a ~37% efficiency gap between a similar volume range. While the earlier examples of MG and MV showed that the performance of 600 μL could be nearly attained with a lower volume such as 120 μL, MB in contrast displayed a wide gap in efficiency between varying C12:C6 volumes. This pattern shows that the extraction for MB may be more resource demanding than MV and MG in terms of the extractant volume needed to reach the maximum efficiency for each concentration.
It was generally observed that MB appeared to have the lowest solubility in the fatty-acid-based solvent relative to MV and MG. Thus, to gain insights on the disparity of extraction efficiency values between the three dyes, the Gibbs free energy of solvation (ΔGsolv) values were determined via quantum chemical calculations using the SMD model with water as the solvent employed in Gaussian16 [33] at the DFT/B3LYP/6-311+G(d,p) level. The results are summarized in Table 2.
The ΔGsolv of MG and MV were very similar, while MB had a more negative ΔGsolv value which could indicate MB’s higher tendency to be solvated in water than the two other dyes. Previous studies have also noted a similar pattern of MB to favor amphiphilic or more hydrophilic media instead of hydrophobic solvents [34,35]. Establishing a connection between a solvent’s performance and a target compound’s solubility could help in the understanding of solvent efficiency and the screening of solvent components based on polarity [36,37].
Showing very high efficiencies ~99% at a large range of concentrations for MG and MV, C12:C6 exhibited a significant capacity to extract MG and MV in high dye concentrations with nearly as much efficiency as when the dye concentration was low. The extraction capability in high-to-low concentration, as well as high-to-minimal extractant volume requirement, is desirable in industrial practice as its performance may exceed the resources it demands. Although the solvent had a lower recorded maximum value of extraction efficiency for MB than with the other two dyes, it was still at a good level at ~73% and may still be used in the right conditions. In the extraction of these dyes at a microvolume range with as low as 1:10 to 1:200 of extractant to dye solution volume ratio without further treatment, the fatty-acid-based mixture presented the attributes of being efficient, environmentally friendly, and cost effective.
To evaluate the performance of the proposed method, under optimal conditions, the figures of merit were also investigated and tabulated in Table 3. The calibration curves for the three dyes had a coefficient of determination (R2) no less than 0.9965.
Contact time between the aqueous dye solution and extractant is also an important parameter in the extraction of dyes. To determine the practicality and efficiency of using the C12:C6 fatty-acid mixture at a shorter period, contact time was reduced to 5 min.
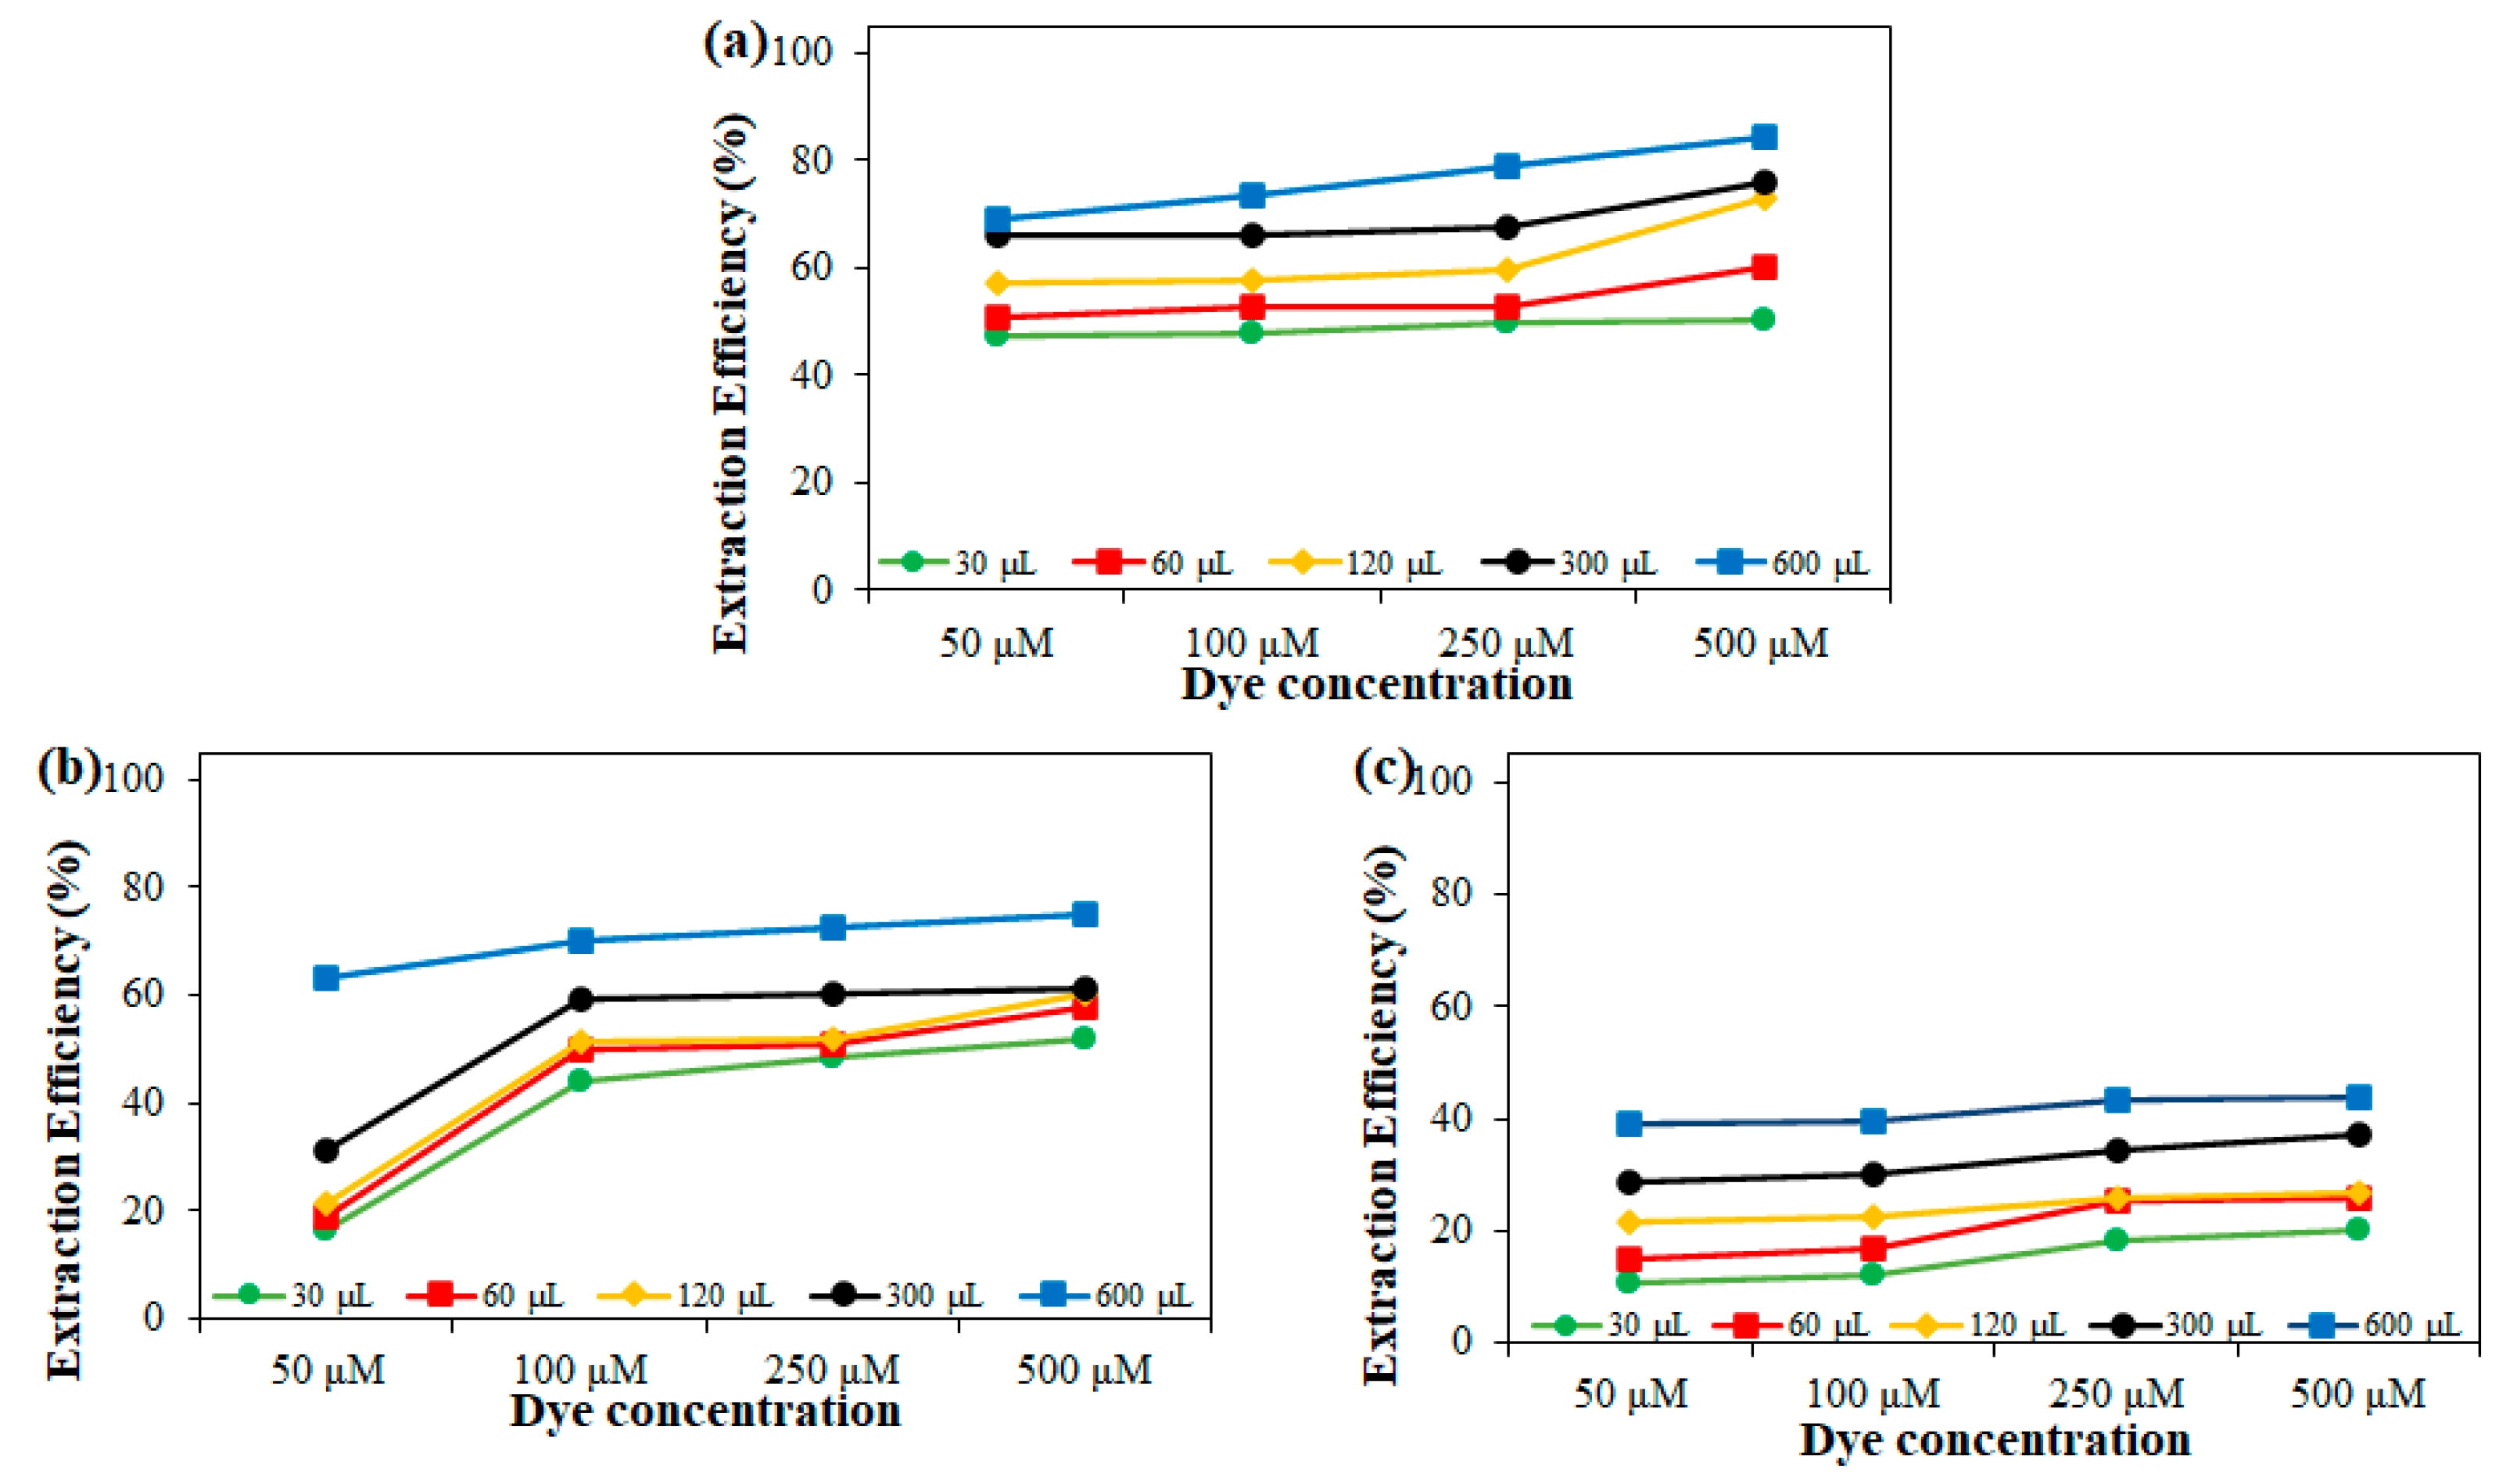
Figure 5 shows the dye extraction efficiencies after the 5 min exposure of the dye solutions with the extractant solvent, and the highest extraction efficiencies exhibited a noticeable decline compared to the 24 h exposure. For MB, the highest extraction efficiency was reduced from 73.1% to 43.6% at 600 μL extractant dose and 500 μmol/L dye concentration. On the other hand, the highest extraction efficiency of MG at 99.3% was reduced to 84.3%. The highest efficiency for MV at 98.6% also decreased, to 75.0%. The lowest and highest efficiency values obtained during the 5 min extraction are tabulated in Table 4.
Even when contact time was greatly reduced, the extraction efficiencies, especially for MG and MV, were still high, showing the capacity of the fatty-acid mixture to extract dyes in aqueous solution. This could be attributed to the high affinity or solubility of the MG and MV dyes in the C12:C6 fatty-acid solvent even at the greatly reduced contact time of 5 min from 24 h, resulting in high mass transfer towards the hydrophobic phase.
Unlike the trend observed during the 24 h extraction wherein a higher volume range of the solvent could perform almost similarly for MV and MG, the gap in performance between the volume range increased when the time frame for the microextraction was reduced to 5 min. This shows that optimizing the C12:C6 volume was a favorable approach for a 5 min extraction of MG and MV, but the increase in solvent volume played only a small role at longer extraction periods. During a 24 h extraction, the difference in performance between 120 μL to 600 μL of solvent volume was ~5% for MG and ~3% for MV. However, in the case of reducing contact time to 5 min, a similar volume range varied in efficiency by as much as ~19% and ~42% for MG and MV, respectively.
The two dyes, along with a higher C12:C6 volume range, shared a common trend of minimal differences in efficiency during a 24 h extraction compared to a 5 min contact time, but the reverse was observed for MB. With the five tested MB concentrations, the extraction efficiency reflected a difference greater than ~37% when the C12:C6 solvent volume was varied between 120 μL to 600 μL for a 24 h extraction. However, the difference was reduced to ~18% when the extraction was shortened to 5 min. This indicates that increasing C12:C6 volume was a desirable optimization step during a 24 h extraction of MB, but the approach may not necessarily boost the recovery yield with as much magnitude at a shorter exposure.
Connecting these observations, the use of more resources by increasing extractant volume can be a practical approach during a 5 min extraction of relatively hydrophobic dyes such as MG and MV. However, it can be a counterintuitive approach for longer periods of extraction as increasing solvent volume was observed to impart minimal influence and would thus not require large resources to achieve high recovery yield. In contrast, for the removal of a more polar dye such as MB, adjustments to solvent volume contributed a higher boost in efficiency during the 24 h extraction than the 5 min period.
The described differences regarding the conditions in which C12:C6 can obtain an optimum recovery yield agree with earlier findings that the solubility of dyes is a significant criterion in determining optimal extraction conditions. The results illustrate that contact time, along with the other studied experimental parameters, could be optimized depending on the polarity of the dyes. Identifying how these factors interact may further improve the extraction process for resource-efficient and cost-effective future experiments that yield higher performance.

3. Materials and Methods

3.1. Materials

Hexanoic acid (≥99%) and dodecanoic acid (≥98%) were acquired from Sigma Aldrich (St. Louis, MO, USA). The dyes methylene blue, methyl violet, and malachite green were purchased from HiMedia (Mumbai, India), Sigma-Aldrich (St. Louis, MO, USA), and LabChem (Auckland, New Zealand), respectively. All reagents were used as received with no further purification.

3.2. FTIR and 1H NMR Measurements

1H NMR studies were carried out with a High-Resolution JEOL 600 MHz spectrometer to confirm the constituent components of the fatty-acid mixture. With the addition of deuterated dimethyl sulfoxide (DMSO-d6), all binary mixtures and pure components were prepared on 5 mm NMR tubes properly sealed with a cap.
All Fourier transform infrared spectra for the samples and pure components were obtained using a Thermo Scientific Nicolet 6700 FTIR spectrometer, and the spectral data for each sample were attained at a 4 cm−1 resolution. With 16 scans, all results were recorded over the wavenumber range of 500–4000 cm−1.

3.3. Liquid–liquid Dye Microextraction Procedure

A binary mixture of dodecanoic acid (C12) and hexanoic acid (C6) in 1:3 mole ratio (χC12 = 0.25) was used as dye microextractant solvent. The concentration of the dye stock solutions for methylene blue (MB), methyl violet (MV), and malachite green (MG) was varied at 50, 100, 250, and 500 μmol/L. Liquid–liquid microextraction (LLME) experiments were carried out by testing different solvent volumes at 30, 60, 120, 300, and 600 μL then loading the solvent dose into a 50 mL conical-bottom polypropylene tube containing 6 mL of dye solution.
To investigate the effect of contact time on dye removal, one batch was simply mixed and left in contact for 24 h at room temperature, while the other batch was centrifuged for 1 min at 7600× g and left for another 4 min at room temperature. Following this, two distinct layers were observed, and the remaining concentration of dyes at the aqueous phase beneath the fatty-acid mixture was extracted with a syringe and analyzed using a Hitachi U-2900 UV-Vis Double Beam Spectrophotometer. Absorbances at the wavelengths 586 nm, 613 nm, and 663 nm were, respectively, used for the measurement of residual concentrations of MV, MG, and MB. The extraction efficiency was calculated as:
%   E x t r a c t i o n   E f f i c i e n c y   E =   C o C f C o   ×   100 %
where Co and Cf represent initial and final dye concentration in μM, respectively.

3.4. Analytical Performance Parameters

For the three sets of calibration curves used for methylene blue, methyl violet, and malachite green in the study, the acceptance criterion for the calibration curve’s coefficient of determination was set to ≥0.98, and the accuracy allowed was within 75–120%.

4. Conclusions

In this study, a low-volume fatty-acid mixture-based solvent was used for a simple and efficient microextraction method for the removal of dyes in aqueous solution. The solvent mixture was easily prepared by mixing dodecanoic acid and hexanoic acid, and the resulting mixture was added to the methylene blue, methyl violet, and malachite green dye solutions. The interaction between the variety of dye, C12:C6 volume, contact time, and dye concentration as well as how these factors relate to the solvent’s extraction efficiency was explored and the fatty-acid mixture presented a green and economic procedure for the extraction of toxic dyes in wastewater treatment. This was corroborated by the high extraction efficiencies obtained for methylene blue (73.1%), methyl violet (98.6%), and malachite green (99.3%). The experimental results reveal that even at a microvolume solvent availability, a fatty-acid mixture performs efficiently even towards hydrophobic contaminants 200 times its volume.
The study also underscores the importance of the solvent being tailored according to desired function and polarity of the target micropollutant. As hydrophobicity contributes a large role in the extraction efficiency of the fatty-acid mixture, screening the match between the dye and the solvent would be beneficial for more targeted and hence more cost-efficient extraction. With a straightforward solvent preparation and with the advantage of a fast and high capacity to extract dyes in aqueous solution, the microextraction method using the fatty-acid-based mixture represents an emerging class of inexpensive green solvents for environmental remediation.

Supplementary Materials

The following are available online at https://www.mdpi.com/article/10.3390/separations8090135/s1, Table S1: Summary of the 1H NMR chemical shifts.

Author Contributions

Conceptualization, D.P.A. and F.C.F.J.; Data curation, D.P.A. and F.C.F.J.; Formal analysis, D.P.A. and F.C.F.J.; Funding acquisition, F.C.F.J.; Investigation, D.P.A. and F.C.F.J.; Methodology, D.P.A.; Project administration, D.P.A. and F.C.F.J.; Resources, F.C.F.J.; Software, F.C.F.J.; Supervision, F.C.F.J.; Validation, D.P.A. and F.C.F.J.; Visualization, D.P.A. and F.C.F.J.; Writing—original draft, D.P.A.; Writing—review & editing, D.P.A. and F.C.F.J. All authors have read and agreed to the published version of the manuscript.

Funding

This work was supported by the University Research Coordination Office (URCO) of De La Salle University—Manila under Project Number 24 F U 1TAY18-1TAY19.

Institutional Review Board Statement

Not applicable.

Informed Consent Statement

Not applicable.

Data Availability Statement

Not applicable.

Conflicts of Interest

The authors declare no conflict of interest.

References

  1. Janssens, I.; Tanghe, T.; Verstraete, W. Micropollutants: A Bottleneck in Sustainable Wastewater Treatment. Water Sci. Technol. 1997, 35, 13–26. [Google Scholar] [CrossRef]
  2. Atas, M.S.; Dursun, S.; Akyildiz, H.; Citir, M.; Yavuz, C.T.; Yavuz, M.S. Selective Removal of Cationic Micro-Pollutants Using Disulfide-Linked Network Structures. RSC Adv. 2017, 7, 25969–25977. [Google Scholar] [CrossRef] [Green Version]
  3. Margot, J.; Rossi, L.; Barry, D.P.A.; Holliger, C. A Review of the Fate of Micropollutants in Wastewater Treatment Plants. Wiley Interdiscip. Rev. Water 2015, 2, 457–487. [Google Scholar] [CrossRef] [Green Version]
  4. Gopinathan, R.; Kanhere, J.; Banerjee, J. Effect of Malachite Green Toxicity on Non Target Soil Organisms. Chemosphere 2015, 120, 637–644. [Google Scholar] [CrossRef]
  5. Schneider, K.; Hafner, C.; Jäger, I. Mutagenicity of Textile Dye Products. J. Appl. Toxicol. 2004, 24, 83–91. [Google Scholar] [CrossRef] [PubMed]
  6. Dos Anjos, F.S.C.; Vieira, E.F.S.; Cestari, A.R. Interaction of Indigo Carmine Dye with Chitosan Evaluated by Adsorption and Thermochemical Data. J. Colloid Interface Sci. 2002, 253, 243–246. [Google Scholar] [CrossRef] [PubMed]
  7. Chandran, C.B.; Singh, D.; Nigam, P. Remediation of Textile Effluent Using Agricultural Residues. Appl. Biochem. Biotechnol. 2002, 102–103, 207–212. [Google Scholar] [CrossRef]
  8. Nguyen, T.A.; Juang, R.-S. Treatment of Waters and Wastewaters Containing Sulfur Dyes: A Review. Chem. Eng. J. 2013, 219, 109–117. [Google Scholar] [CrossRef]
  9. Shi, B.; Li, G.; Wang, D.; Feng, C.; Tang, H. Removal of Direct Dyes by Coagulation: The Performance of Preformed Polymeric Aluminum Species. J. Hazard. Mater. 2007, 143, 567–574. [Google Scholar] [CrossRef] [PubMed]
  10. Isosaari, P.; Srivastava, V.; Sillanpää, M. Ionic Liquid-Based Water Treatment Technologies for Organic Pollutants: Current Status and Future Prospects of Ionic Liquid Mediated Technologies. Sci. Total Environ. 2019, 690, 604–619. [Google Scholar] [CrossRef]
  11. Verma, P.; Samanta, S.K. Microwave-Enhanced Advanced Oxidation Processes for the Degradation of Dyes in Water. Environ. Chem. Lett. 2018, 16, 969–1007. [Google Scholar] [CrossRef]
  12. Kandelbauer, A.; Guebitz, G.M. Bioremediation for the Decolorization of Textile Dyes—A Review. In Environmental Chemistry; Springer: Berlin/Heidelberg, Germany, 2005; pp. 269–288. [Google Scholar]
  13. Sharma, B.; Dangi, A.K.; Shukla, P. Contemporary Enzyme Based Technologies for Bioremediation: A Review. J. Environ. Manag. 2018, 210, 10–22. [Google Scholar] [CrossRef] [PubMed]
  14. Kahwaji, S.; Johnson, M.B.; Kheirabadi, A.C.; Groulx, D.; White, M.A. Fatty Acids and Related Phase Change Materials for Reliable Thermal Energy Storage at Moderate Temperatures. Sol. Energy Mater. Sol. Cells 2017, 167, 109–120. [Google Scholar] [CrossRef]
  15. Cellat, K.; Beyhan, B.; Güngör, C.; Konuklu, Y.; Karahan, O.; Dündar, C.; Paksoy, H. Thermal Enhancement of Concrete by Adding Bio-Based Fatty Acids as Phase Change Materials. Energy Build. 2015, 106, 156–163. [Google Scholar] [CrossRef]
  16. Zhou, D.; Zhou, Y.; Liu, Y.; Luo, X.; Yuan, J. Preparation and Performance of Capric-Myristic Acid Binary Eutectic Mixtures for Latent Heat Thermal Energy Storages. J. Nanomater. 2019, 2019, 1–9. [Google Scholar] [CrossRef]
  17. Florindo, C.; Romero, L.; Rintoul, I.; Branco, L.C.; Marrucho, I.M. From Phase Change Materials to Green Solvents: Hydrophobic Low Viscous Fatty Acid–Based Deep Eutectic Solvents. ACS Sustain. Chem. Eng. 2018, 6, 3888–3895. [Google Scholar] [CrossRef]
  18. Arcon, D.P.; Franco, F.C. All-Fatty Acid Hydrophobic Deep Eutectic Solvents towards a Simple and Efficient Microextraction Method of Toxic Industrial Dyes. J. Mol. Liq. 2020, 318, 114220. [Google Scholar] [CrossRef]
  19. Ma, W.; Row, K.H. PH-Induced Deep Eutectic Solvents Based Homogeneous Liquid-Liquid Microextraction for the Extraction of Two Antibiotics from Environmental Water. Microchem. J. 2021, 160, 105642. [Google Scholar] [CrossRef]
  20. Shih, H.-K.; Shu, T.-Y.; Ponnusamy, V.K.; Jen, J.-F. A Novel Fatty-Acid-Based in-Tube Dispersive Liquid–Liquid Microextraction Technique for the Rapid Determination of Nonylphenol and 4-Tert-Octylphenol in Aqueous Samples Using High-Performance Liquid Chromatography–Ultraviolet Detection. Anal. Chim. Acta 2015, 854, 70–77. [Google Scholar] [CrossRef]
  21. Gao, M.; Wang, J.; Song, X.; He, X.; Dahlgren, R.A.; Zhang, Z.; Ru, S.; Wang, X. An Effervescence-Assisted Switchable Fatty Acid-Based Microextraction with Solidification of Floating Organic Droplet for Determination of Fluoroquinolones and Tetracyclines in Seawater, Sediment, and Seafood. Anal. Bioanal. Chem. 2018, 410, 2671–2687. [Google Scholar] [CrossRef] [Green Version]
  22. El-Deen, A.K.; Shimizu, K. A Green Air Assisted-Dispersive Liquid-Liquid Microextraction Based on Solidification of a Novel Low Viscous Ternary Deep Eutectic Solvent for the Enrichment of Endocrine Disrupting Compounds from Water. J. Chromatogr. A 2020, 1629, 461498. [Google Scholar] [CrossRef]
  23. Ke, H. Phase Diagrams, Eutectic Mass Ratios and Thermal Energy Storage Properties of Multiple Fatty Acid Eutectics as Novel Solid-Liquid Phase Change Materials for Storage and Retrieval of Thermal Energy. Appl. Therm. Eng. 2017, 113, 1319–1331. [Google Scholar] [CrossRef]
  24. He, H.; Yue, Q.; Gao, B.; Zhang, X.; Li, Q.; Wang, Y. The Effects of Compounding Conditions on the Properties of Fatty Acids Eutectic Mixtures as Phase Change Materials. Energy Convers. Manag. 2013, 69, 116–121. [Google Scholar] [CrossRef]
  25. Van Osch, D.J.G.P.; Dietz, C.H.J.T.; van Spronsen, J.; Kroon, M.C.; Gallucci, F.; van Sint Annaland, M.; Tuinier, R. A Search for Natural Hydrophobic Deep Eutectic Solvents Based on Natural Components. ACS Sustain. Chem. Eng. 2019, 7, 2933–2942. [Google Scholar] [CrossRef]
  26. Hao, L.; Su, T.; Hao, D.; Deng, C.; Ren, W.; Lü, H. Oxidative Desulfurization of Diesel Fuel with Caprolactam-Based Acidic Deep Eutectic Solvents: Tailoring the Reactivity of DESs by Adjusting the Composition. Chin. J. Catal. 2018, 39, 1552–1559. [Google Scholar] [CrossRef]
  27. Liu, S.; Zhang, C.; Zhang, B.; Li, Z.; Hao, J. All-In-One Deep Eutectic Solvent Toward Cobalt-Based Electrocatalyst for Oxygen Evolution Reaction. ACS Sustain. Chem. Eng. 2019, 7, 8964–8971. [Google Scholar] [CrossRef]
  28. Florindo, C.; Branco, L.C.; Marrucho, I.M. Development of Hydrophobic Deep Eutectic Solvents for Extraction of Pesticides from Aqueous Environments. Fluid Phase Equilibria 2017, 448, 135–142. [Google Scholar] [CrossRef]
  29. Arora, K.; Singh, G.; Singh, G.; Kang, T.S. Aggregation Behavior of Sodium Dioctyl Sulfosuccinate in Deep Eutectic Solvents and Their Mixtures with Water: An Account of Solvent’s Polarity, Cohesiveness, and Solvent Structure. ACS Omega 2018, 3, 13387–13398. [Google Scholar] [CrossRef]
  30. Vilková, M.; Płotka-Wasylka, J.; Andruch, V. The Role of Water in Deep Eutectic Solvent-Base Extraction. J. Mol. Liq. 2020, 304, 112747. [Google Scholar] [CrossRef]
  31. Shamsipur, M.; Zohrabi, P.; Hashemi, M. Application of a Supramolecular Solvent as the Carrier for Ferrofluid Based Liquid-Phase Microextraction for Spectrofluorimetric Determination of Levofloxacin in Biological Samples. Anal. Methods 2015, 7, 9609–9614. [Google Scholar] [CrossRef]
  32. Dutta, B.K. Principles of Mass Transfer and Separation Processes; PHI Learning Private Limited: New Delhi, India, 2007. [Google Scholar]
  33. Frisch, M.J.; Trucks, G.W.; Schlegel, H.B.; Scuseria, G.E.; Robb, M.A.; Cheeseman, J.R.; Scalmani, G.; Barone, V.; Petersson, G.A.; Nakatsuji, H.; et al. Gaussian16 B.01. Available online: www.gaussian.com (accessed on 18 August 2021).
  34. Takeshita, J.; Hasegawa, Y.; Yanai, K.; Yamamoto, A.; Ishii, A.; Hasegawa, M.; Yamanaka, M. Organic Dye Adsorption by Amphiphilic Tris-Urea Supramolecular Hydrogel. Chem. Asian J. 2017, 12, 2029–2032. [Google Scholar] [CrossRef] [PubMed]
  35. Tong, A.; Wu, Y.; Tan, S.; Li, L.; Akama, Y.; Tanaka, S. Aqueous Two-Phase System of Cationic and Anionic Surfactant Mixture and Its Application to the Extraction of Porphyrins and Metalloporphyrins. Anal. Chim. Acta 1998, 369, 11–16. [Google Scholar] [CrossRef]
  36. Jiang, H.; Xu, D.; Zhang, L.; Ma, Y.; Gao, J.; Wang, Y. Vapor–Liquid Phase Equilibrium for Separation of Isopropanol from Its Aqueous Solution by Choline Chloride-Based Deep Eutectic Solvent Selected by COSMO-SAC Model. J. Chem. Eng. Data 2019, 64, 1338–1348. [Google Scholar] [CrossRef]
  37. Jeliński, T.; Cysewski, P. Application of a Computational Model of Natural Deep Eutectic Solvents Utilizing the COSMO-RS Approach for Screening of Solvents with High Solubility of Rutin. J. Mol. Model. 2018, 24, 180. [Google Scholar] [CrossRef] [PubMed] [Green Version]
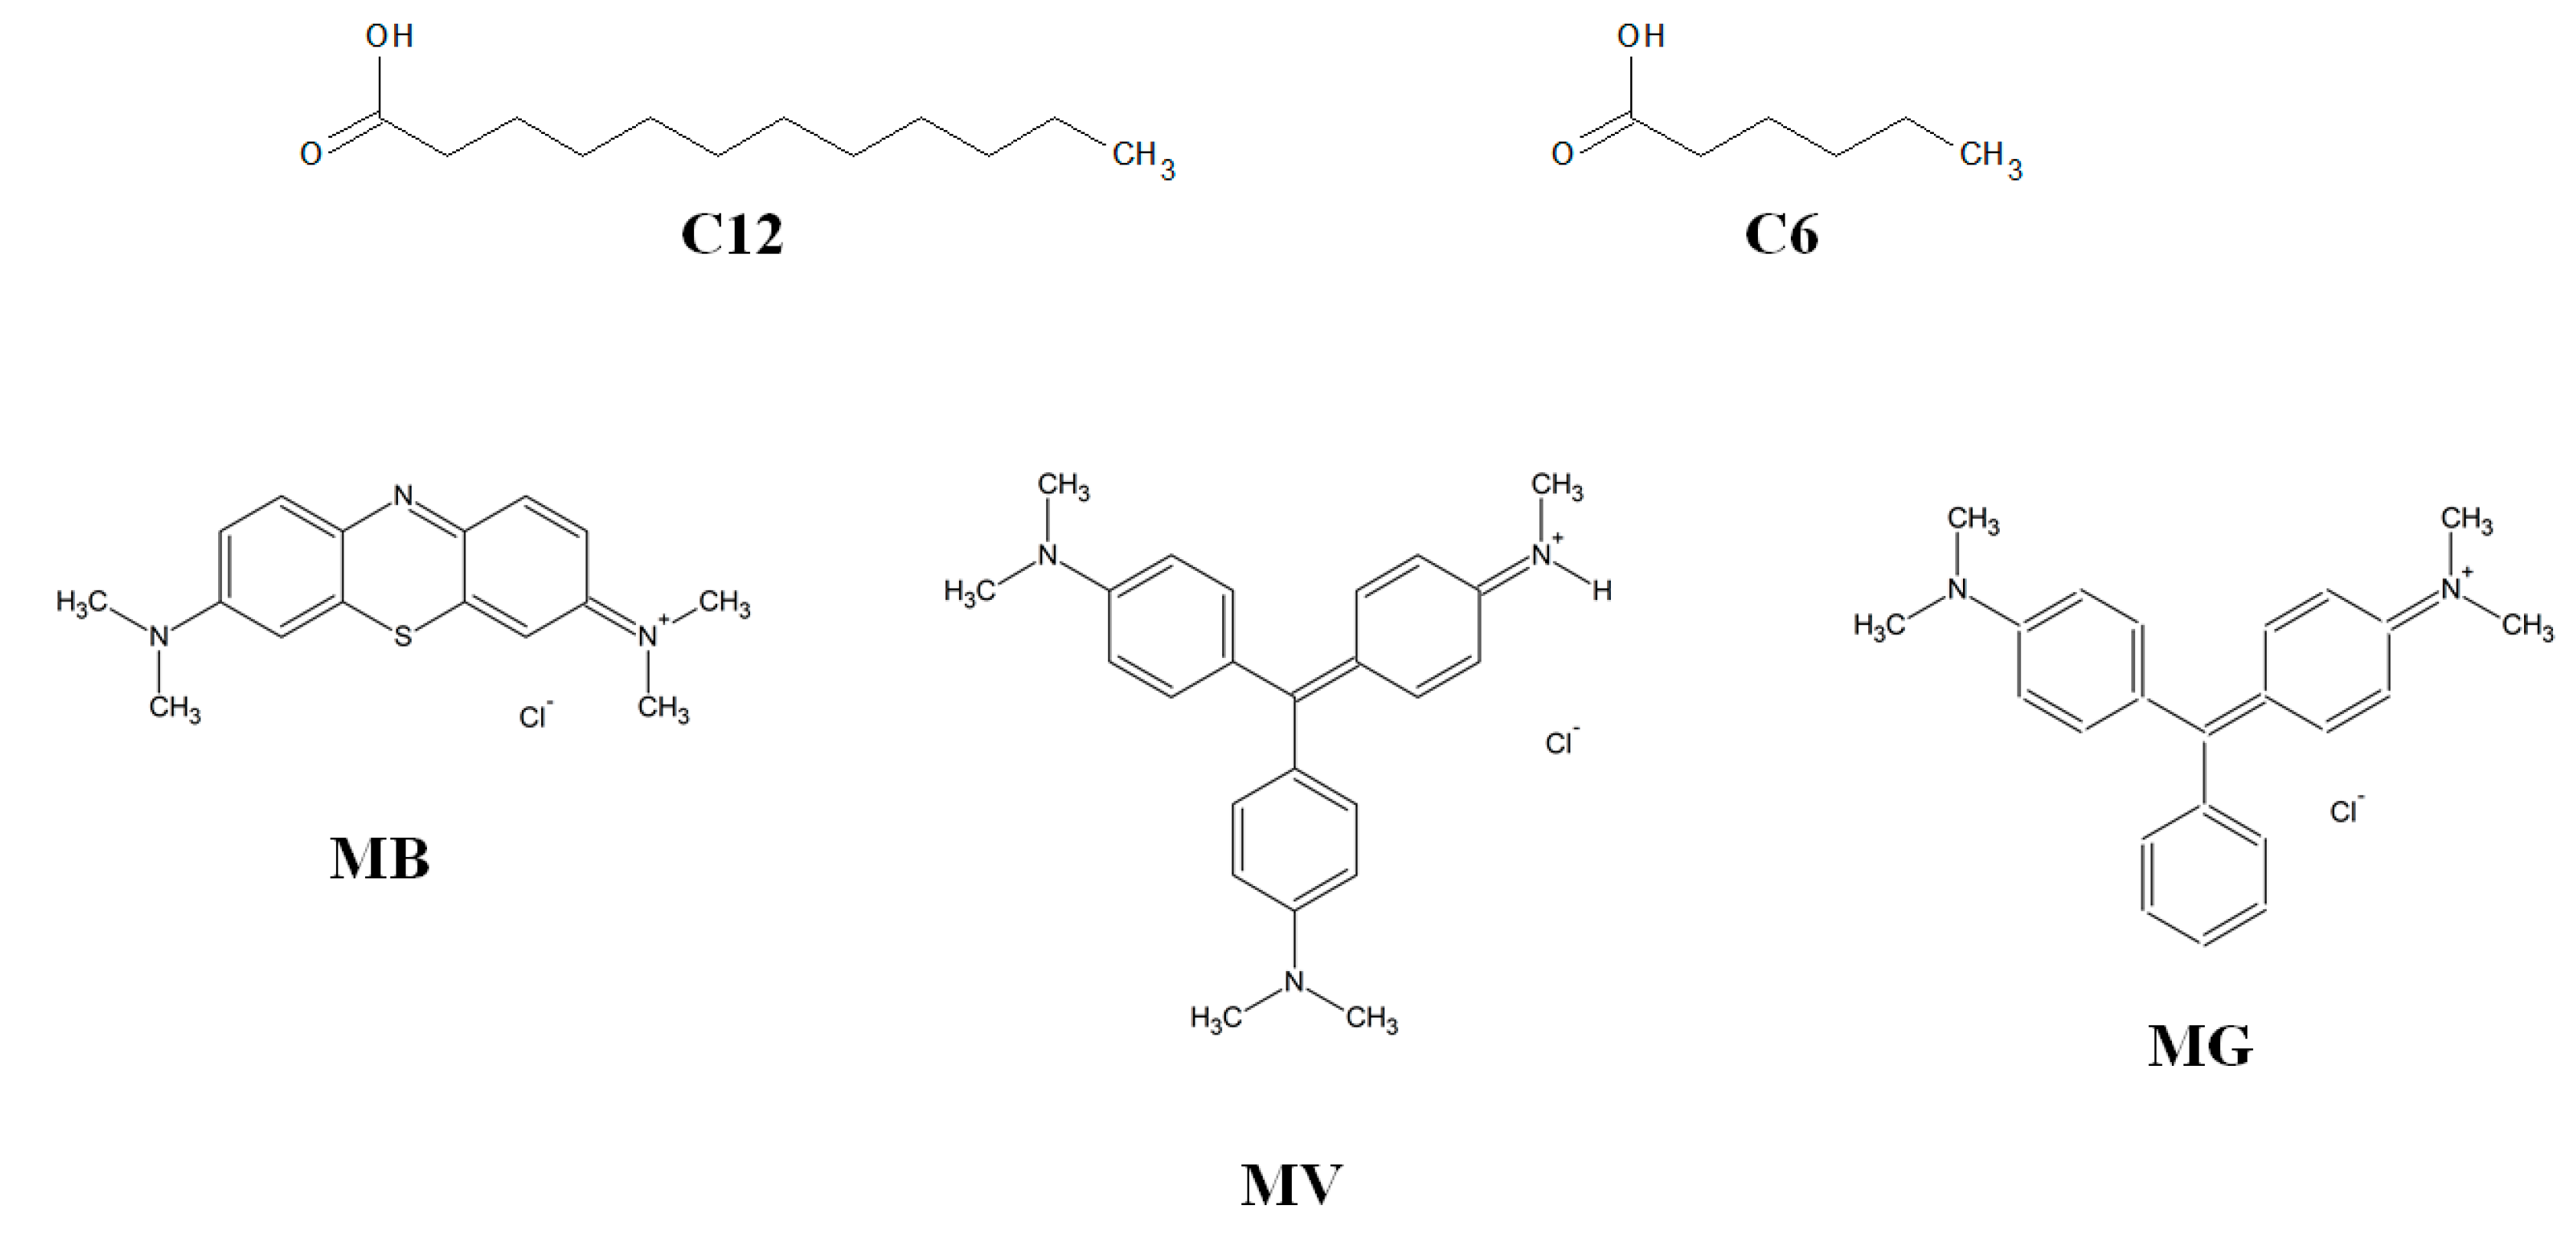
Figure 1. Chemical structures of the fatty acids and dyes used in this study.
Separations 08 00135 g001
Figure 2. FTIR spectra of the fatty-acid mixture prepared and its individual components: C12 (black line), C12:C6 (red line), and C6 (orange line).
Separations 08 00135 g002
Figure 3. 1H NMR spectra of the C12:C6 fatty-acid mixture prepared (red line) and its individual components, C12 (black line), and C6 (blue line). The 1H NMR spectra of the C12:C6 mixture after mixing with water (green line) is also shown.
Separations 08 00135 g003
Figure 4. Dye extraction efficiencies after 24 h exposure of the dye solution with the C12:C6 mixture: (a) malachite green, (b) methyl violet, and (c) methylene blue at various dye concentrations (50 μmol/L, 100 μmol/L, 250 μmol/L, and 500 μmol/L) and extractant volume: 30 μL (green circle), 60 μL (red square), 120 μL (yellow diamond), 300 μL (black circle), and 600 μL (blue square). The error bars are the standard deviations from the three trials.
Separations 08 00135 g004
Figure 5. Dye extraction efficiencies after 5 min exposure of the dye solution with the C12:C6 mixture: (a) malachite green, (b) methyl violet, and (c) methylene blue at various dye concentrations (50 μmol/L, 100 μmol/L, 250 μmol/L, and 500 μmol/L) and extractant volume: 30 μL (green circle), 60 μL (red square), 120 μL (yellow diamond), 300 μL (black circle), and 600 μL (blue square). The error bars are the standard deviations from the three trials.
Separations 08 00135 g005
Table 1. Highest and lowest extraction efficiencies of the methylene blue (MB), methyl violet (MV), and malachite green (MG) dye solutions with the C12:C6 mixture at 24 h contact time.
Extraction Efficiency (%)
LowestHighest
MB6.773.1
MV83.298.6
MG67.599.3
Table 2. Gibbs free energy of solvation for the three dyes used using the SMD model at the DFT/B3LYP/6-311+G(d,p) level.
DyeΔGsolv (kcal/mol)
Malachite green−34.07
Methyl violet−34.16
Methylene blue−39.79
Table 3. Analytical performance of the proposed microextraction method.
ParameterMethylene BlueMethyl VioletMalachite Green
Coefficient of determination (R2)0.99970.99980.9965
Linear equationy = 53170x − 0.0327y = 44782x − 0.0212y = 48699x + 0.0099
Accuracy (%)102.45 ± 4.95100.39 ± 1.5792.95 ± 14.37
Linearity range (×10−6 mol/L)1–501–500.5–50
Standard error of intercept0.01310.00740.0435
Standard deviation of intercept0.02920.01950.1065
Limit of detection (LOD, ×10−6)1.811.447.21
Limit of quantification (LOQ, ×10−6)5.494.3621.9
Table 4. Highest and lowest extraction efficiencies of the methylene blue (MB), methyl violet (MV), and malachite green (MG) dye solutions with the C12:C6 mixture at 5 min contact time.
Extraction Efficiency (%)
LowestHighest
MB10.843.6
MV16.775.0
MG47.284.3
Publisher’s Note: MDPI stays neutral with regard to jurisdictional claims in published maps and institutional affiliations.