Article

Efficient Sub-1 Minute Analysis of Selected Biomarker Catecholamines by Core-Shell Hydrophilic Interaction Liquid Chromatography (HILIC) with Nanomolar Detection at a Boron-Doped Diamond (BDD) Electrode

Innovative Chromatography Group, Irish Separation Science Cluster (ISSC) Ireland, School of Chemistry, The Analytical & Biological Chemistry Research Facility (ABCRF), University College Cork, Western Road, T12 YN60 Cork, Ireland
*
Author to whom correspondence should be addressed.
Separations 2021, 8(8), 124; https://doi.org/10.3390/separations8080124
Submission received: 23 July 2021 / Revised: 11 August 2021 / Accepted: 14 August 2021 / Published: 18 August 2021
(This article belongs to the Special Issue Chromatographic Analysis of Biological Samples)

Abstract

:
A rapid, sensitive method for the separation of catecholamine biomarkers (CAs), of importance in traumatic brain injury (TBI) and in Parkinson’s disease (PD), has been successfully developed using hydrophilic interaction liquid chromatography (HILIC). Dopamine (DA), epinephrine (EPI), and norepinephrine (NE) are known to be three to fivefold elevated above normal in traumatic brain injury (TBI) patients. HILIC facilitates the rapid and efficient separation of these polar biomarkers, which can be poorly retained by reversed-phase liquid chromatography (RPLC), while electrochemical detection (ECD) at the boron-doped diamond (BDD) electrode provides enhanced nanomolar detection. Three HILIC columns were compared, namely the superficially porous (core-shell) Z-HILIC column and the Z-cHILIC and Z-HILIC fully porous columns. The core-shell Z-HILIC showed the highest efficiency with a rapid separation within 60 s. The HILIC method utilizing the core-shell Z-HILIC column was initially optimized for the simultaneous analysis of DA, EPI, and NE using UV detection. The advantages of using the BDD electrode over UV detection were explored, and the improved limits of detection (LODs, S/N = 3) measured were 40, 50, and 50 nM for DA, EPI, and NE, respectively. Method validation is reported in terms of the linearity, repeatability, reproducibility, and LODs. Furthermore, the proposed method was successfully applied to the real sample analysis of urinary CAs following phenylboronic acid (PBA) solid phase extraction (SPE) pretreatment.

1. Introduction

Catecholamines (CAs) are biogenic amines consisting of a catechol group with an amine side chain, which are synthesized from the amino acid tyrosine [1]. Among the most critical CAs in biological systems are dopamine (DA), epinephrine (EPI), and norepinephrine (NE) [2]. They are released from the adrenal glands and function as neurotransmitters that facilitate intercellular communication within the nervous system [3]. Therefore, they have an essential biological role for many physiological functions, and their levels can be regarded as key biomarkers for several diseases and neurological disorders such as some forms of cancer, Parkinson’s disease (PD), and Alzheimer’s disease (AD) [2,4,5].
DA is the most abundant CA, and it has a major influence on behavior and physical function. These include learning, motivation, memory [5], movement [6], and heart and kidney function [7]. EPI and NE also play important roles as they control the regulation of the sympathetic nervous system. Based upon their concentration levels, they affect the muscular and cardiovascular function [8]. The overproduction of specific CAs in urine and plasma is utilized for biomarking for types of tumors, such as phaeochromocytomas, neuroblastomas, and ganglioneuromas [9,10].
Studies have emphasized the association between elevated specific CAs and traumatic brain injury (TBI) [11]. A study by Hamill et al. concluded that these plasma CAs could be utilized as prognostic biomarkers of head injury. Their investigation found that the concentrations of NE and EPI were raised four to fivefold while the DA level increased threefold above normal with TBI patients [11,12]. Further work by Clifton et al. found higher concentrations of NE and DA in the first week after mild-to-severe TBI in 48 patients [13].
An additional CAs-related pathology is Parkinson’s disease (PD), as it is caused by the loss of dopaminergic neurons in the substantia nigra in the brain [4]. To date, there is no laboratory test for the early diagnosis of PD [14]. Recently, studies have revealed that peripheral dopaminergic and noradrenergic neuronal degeneration could be an early marker of PD [15,16,17,18,19]. For example, Chekhonin et al. found a positive correlation between PD and a deficiency in urinary and striatum CAs [20]. Consequently, sensitive methods for the analysis of CAs in body fluids, such as in urine, blood, and cerebrospinal fluid, are required to facilitate the early identification of any abnormalities in their levels that are connected to pathological cases.
Various analytical techniques for CAs analysis have been reported. Reverse-phase liquid chromatography (RPLC) using C18 columns hyphenated to different detection systems, including mass spectrometry (MS) [21,22,23], electrochemical detection (ECD) [24,25,26,27,28], and fluorescence detection [29] has been widely applied. However, due to the non-polar character of C18 phases and the high polarity of the CAs, derivatization steps, as well as ion pair additives are often considered.
Alternatively, efficient methods for CAs separation based on HILIC, avoiding the need for derivatization or the use of ion pair reagents, have been developed [30,31,32]. The separation mechanisms in HILIC, including hydrophilic partitioning of polar analytes between the water-enriched stationary phase and the bulk organic mobile phase, hydrogen bonding, ion exchange, and dipole–dipole interactions, provide efficient separation for polar analytes [33]. Different types of HILIC stationary phases have been used in the last 15 years, including bare silica, amide, and zwitterionic bonded phases on polymeric or silica supports.
There is growing recognition of the importance of developing rapid and highly efficient separation and detection methods. Reduced sample and reagent consumption, better sample throughput, and higher productivity are some of the associated advantages. Rapid liquid chromatographic (LC) separations can be achieved using short separation columns, high flow rates with low back pressure, and with a careful choice of particle size, permeability, and temperature. Different types of silica materials have been developed in the last 20 years to enable fast and efficient chromatography, including smaller fully porous particles, monolithic silicas, and superficially porous particles (core-shell) particles.
Their benefits and drawbacks have been reported extensively in the literature [34,35,36,37,38]. The literature also highlights the superiority of core-shell particles in providing rapid separations with a high flow rate and lower backpressure, while offering higher separation efficiency in comparison to traditional fully porous particles of similar dimensions. The effectiveness of utilizing core-shell particles as packing materials in various applications including for the separation of drugs, metabolites, and biomacromolecules [39,40,41], as well as for the analysis of proteins and peptides [42] has been reported.
CAs are electroactive compounds amenable to detection using ECD. Due to the similar oxidation potential values of CAs, direct ECD is quite challenging, and the need for electrode modification is evident [43]. Coupling sub-minute chromatographic separation to sensitive ECD is now achievable and effective. The BDD electrode has several advantages compared to other available electrodes, such as the glassy carbon electrode (GCE) [44].
The attributes include a wide potential window [45], low background capacitive current [46], high sensitivity, and high resistance to fouling [47,48]. LC coupled with a BDD electrode has been used in many applications, including the detection of chlorophenols in environmental water samples [49], monoamine and purine molecules from the frontal cortex and striatal in mouse samples [28], six antidepressant drugs in blood [50], and phenolic compounds in whiskey samples [51].
To the best of our knowledge, this is the first application of HILIC core-shell stationary phases coupled with a BDD electrode for the rapid and sensitive detection of CAs. Amperometric ECD is especially suitable for the sensitive determination of electroactive substances due to its high selectivity, relative simplicity, and low cost. The optimization of the separation and detection conditions, including HILIC column selection, was carried out prior to employing the method for the simultaneous analysis of the selected biomarkers in urine samples.

2. Materials and Methods

2.1. Chemicals and Materials

LC-MS grade acetonitrile (ACN), ammonium formate, formic acid, sodium dihydrogen phosphate, disodium hydrogen phosphate, trisodium phosphate, dopamine dihydrochloride (DA) (pKa 8.9), epinephrine dihydrochloride (EPI) (pKa 8.6), and norepinephrine (NE) (pKa 8.4) were obtained from Sigma-Aldrich (Dublin, Ireland). All reagents used were analytical grade of the highest purity, and aqueous solutions were prepared in deionized water with a resistivity of 18.2 MΩ.cm at 25 °C (Millipore Purification Pak, Molsheim, France).
An aqueous filter membrane (0.2 µm) was purchased from Millipore Ltd., Ireland (Cork, Ireland). Phenylboronic acid cartridges (PBA, 100 mg) were obtained from Agilent Technologies (Cork, Ireland). Stock solutions were prepared daily at a concentration of 100 mM in 0.1% formic acid and stored in the dark at 4 °C. The stock solutions were stable for one week and used for further dilution with mobile phase (80:20) ACN: H2O to obtain the desired concentrations of working standards.
For urine sample analysis, urine samples were obtained from two healthy individuals within the research group. A 24-h urine collection was carried out by collecting the urine in a special container over a full 24-h period. The urine samples were kept away from light and stored in the fridge throughout the 24-h period. Lastly, the urine samples were pre-treated using PBA solid phase extraction (SPE) as described elsewhere [32].
Briefly, the PBA cartridge was initially equilibrated with 1 mL of 80:20 ACN: H2O (v/v) containing 1% formic acid, and then with 1 mL of 50 mM phosphate buffer (pH 10). A 3 mL of buffered urine sample (prepared by mixing 1 mL urine and 2 mL of phosphate buffer, pH 8.5) was then loaded to the cartridge. The cartridge was washed with 1 mL of (50:50 v/v) ACN: 10 mM phosphate buffer pH 8.5. Eventually, the analytes were eluted from the cartridge with 1 mL of 80:20 ACN: H2O (v/v) containing 1% formic acid and analyzed by HILIC-BDD.

2.2. Cyclic Voltammetry (CV)

An electrochemical workstation (CH Instrument, Bee Cave, TX, USA) was used to determine the electrochemical behavior of CAs. An electrochemical cell consisting of silver/silver chloride (Ag/AgCl/3M KCl) as a reference electrode (BASi Analytical Instruments, West Layette, IN, USA), BDD as the working electrode (Windsor Scientific, Slough Berkshire, UK), and a Pt wire as a counter electrode (Sigma-Aldrich, Dublin, Ireland) was utilized. Ammonium formate buffer of pH 3 in 85% ACN was used as the supporting electrolyte for all voltammetric measurements. A stock solution of 100 mM for each CAs was prepared in 0.1% formic acid.

2.3. HPLC Instrumentation

An Agilent 1290 Infinity II UHPLC system (Agilent Technologies, Waghaeusel, Germany) consisting of 1290 Infinity II High Speed Pump (model G7120A), degasser (model G7116B), multi-sampler (model G7167B), and diode array detection (DAD) (G7117B) system was used. Agilent Open Lab CDS workstation software was used for the data analysis. A Metrohm 654 pH meter (Metrohm Ltd., Carlow, Ireland) was equipped with a Metrohm Microelectrode (6.0234.100) to give an accurate reading of the pH up to 3 decimals.
The columns used were Poro-shell (core-shell) Z-HILIC (Length 50 mm, I.D. 2.1 mm, 2.7 µm) (Agilent Technologies, Cork, Ireland), fully porous Z-cHILIC (Length 50 mm, I.D. 2.1 mm, 3 µm), and Z-HILIC (Length 50 mm, I.D. 2.1 mm, 3.5 µm) from Merck (Darmstadt, Germany). The ECD setting is described in [51]. An Antec Flexcell thin layer flow cell with a cell volume of 0.7 μL (Apex Scientific, Co., Kildare, Ireland) was used for ECD. The flow cell consists of a three electrode configuration with a working BDD electrode (8 mm diameter), a HyREF (Pd/H2) reference electrode and carbon-loaded polytetrafluoroethylene (PTFE) counter electrode. A CHI660E electrochemical workstation was used for data analysis (CH Instrument, Bee Cave, TX, USA).

2.4. Chromatographic Conditions

Isocratic separation mode was examined for the separation of the selected biomarker CAs by varying the percentage of ACN (75–90%), the ammonium formate pH (3–5) and concentration (10–20 mM), and flow rate (0.5–1.5 mL/min). The optimum mobile phase composition consisted of 85% ACN (v/v) and 10 mM ammonium formate at pH 3. The selective mobile phase was prepared by mixing 85% ACN with 66 mM ammonium formate (pH 3) to give 10 mM buffer concentration. The mobile phase was filtered and sonicated for 15 min. Each column was equilibrated with the mobile phase for 20 min prior to injection. The separation time using the core-shell Z-HILIC column was less than 60 s with a flow rate of 1.5 mL/min and injection volume of 5 µL. The column temperature was set at 23 °C. LC-UV detection was carried out at 280 nm, while +1.3 V in oxidative mode was used in LC-ECD.

2.5. Validation Procedures

The statistical analysis was applied in the method validation for the determination of the limit of detection (LOD), linearity, repeatability, accuracy, and precision. LODs were determined utilizing a signal to noise (S/N) ratio of 3. The linearity was based on linear regression analysis of the calibration curve between various standard concentrations versus peak areas of each standard (50 to 500 µM for LC-UV, and 0.1 to 25 µM for LC-BDD)). The intra- and inter-day results were evaluated via triplicate runs of each standard mixture with concentration 500 µM for LC-UV and 25 µM for LC-BDD. The relative standard deviation (RSD%) was obtained to express the precision of the method.

3. Results and Discussion

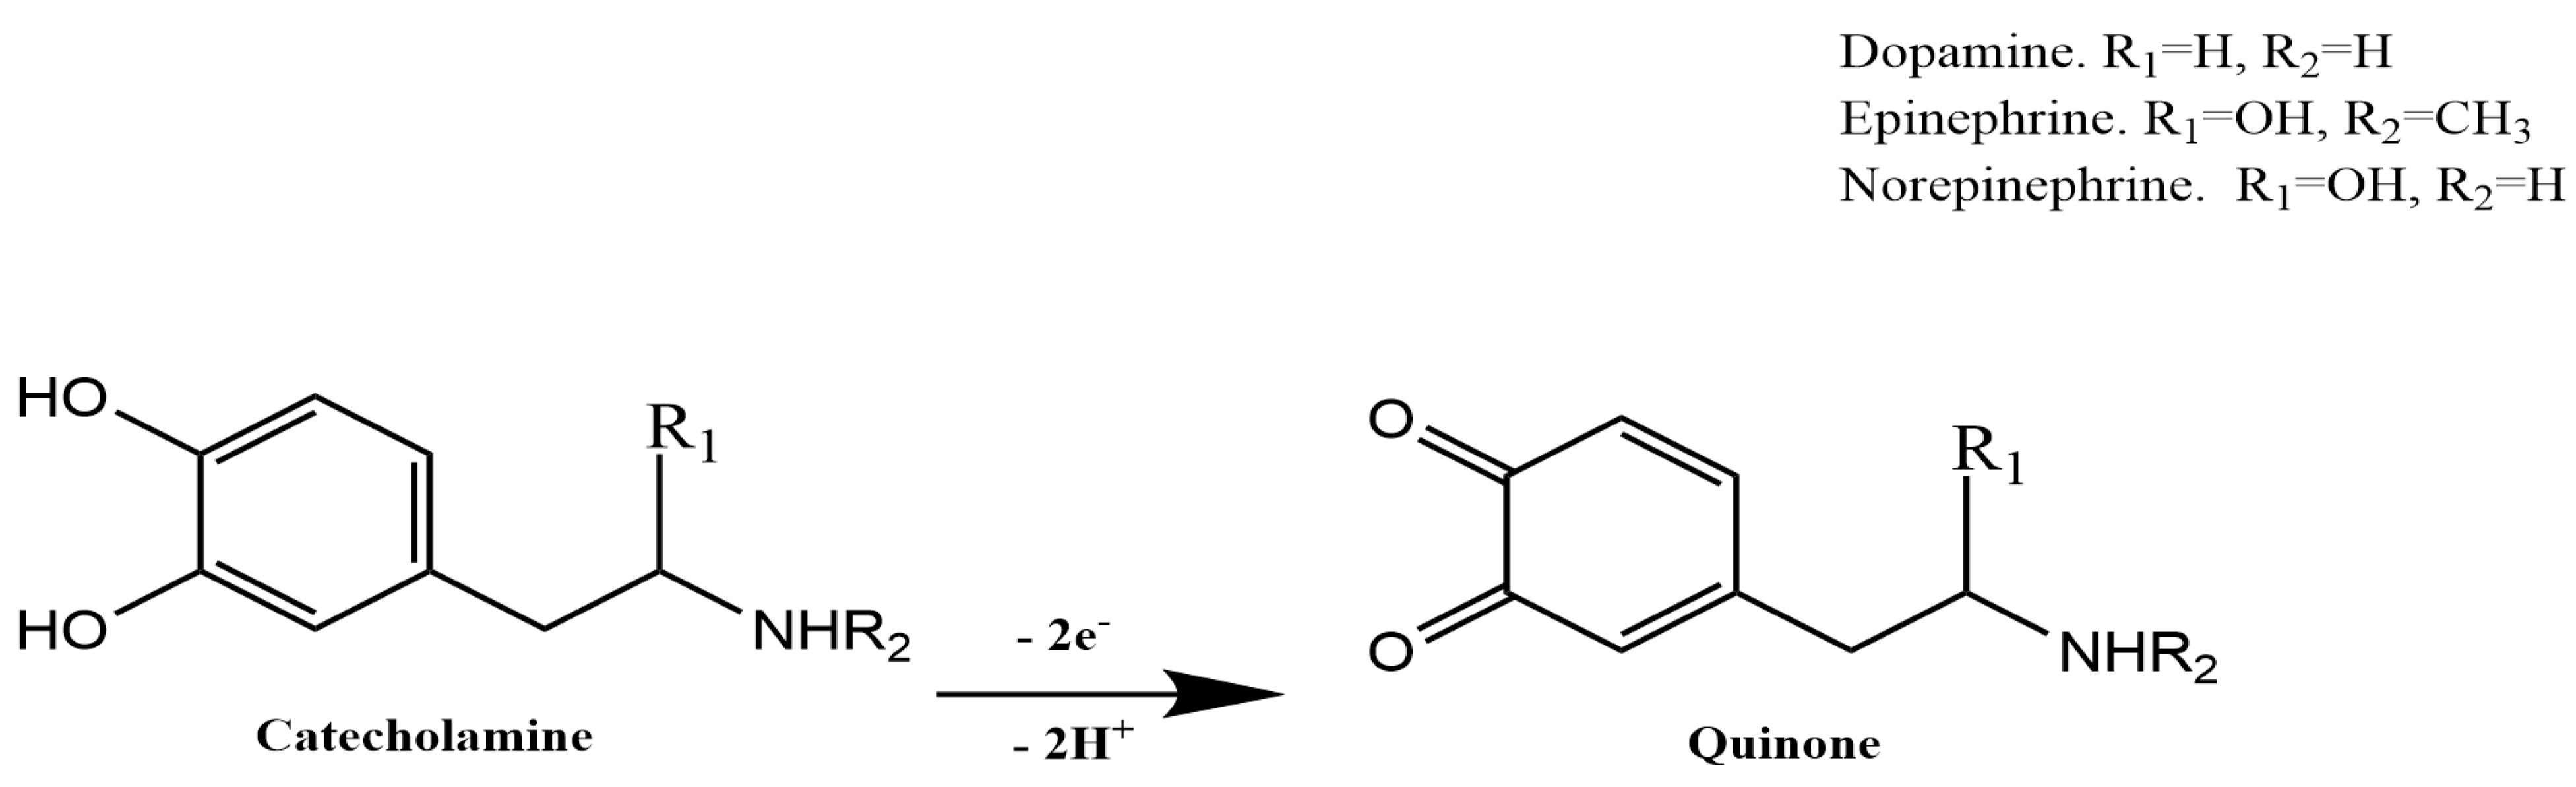
3.1. Electrochemical Behavior of the CAs Using Cyclic Voltammetry (CV)

The direct electrochemical responses of DA, EPI, and NE at the bare BDD electrode were recorded in 85% ACN with 10 mM ammonium formate buffer at pH 3. In brief, CAs exhibit similar electrochemical behavior as they oxidize to their corresponding o-quinones as illustrated in Scheme 1. CV analysis revealed well-defined oxidation peaks for DA, EPI, and NE on the forward scan at potentials of +0.82, +0.9, and +0.85 V, respectively. The quasi-reversible reactions of DA, EPI, and NE on the BDD electrode were indicated by the corresponding cathodic peaks at +0.07, −0.27, and +0.11 V, respectively, as illustrated in Figure 1.
The electrochemical behavior of the CAs has been extensively reported in the literature [52,53,54,55]. Due to the similar redox potentials of the CAs, it is challenging to detect them simultaneously. Several reports have investigated new methods for CA detection based on electrode modification [43,56,57]. However, often due to the complexity, difficulty, and irreproducibility of electrode modification, hyphenation with rapid and robust separation methods is highly effective.

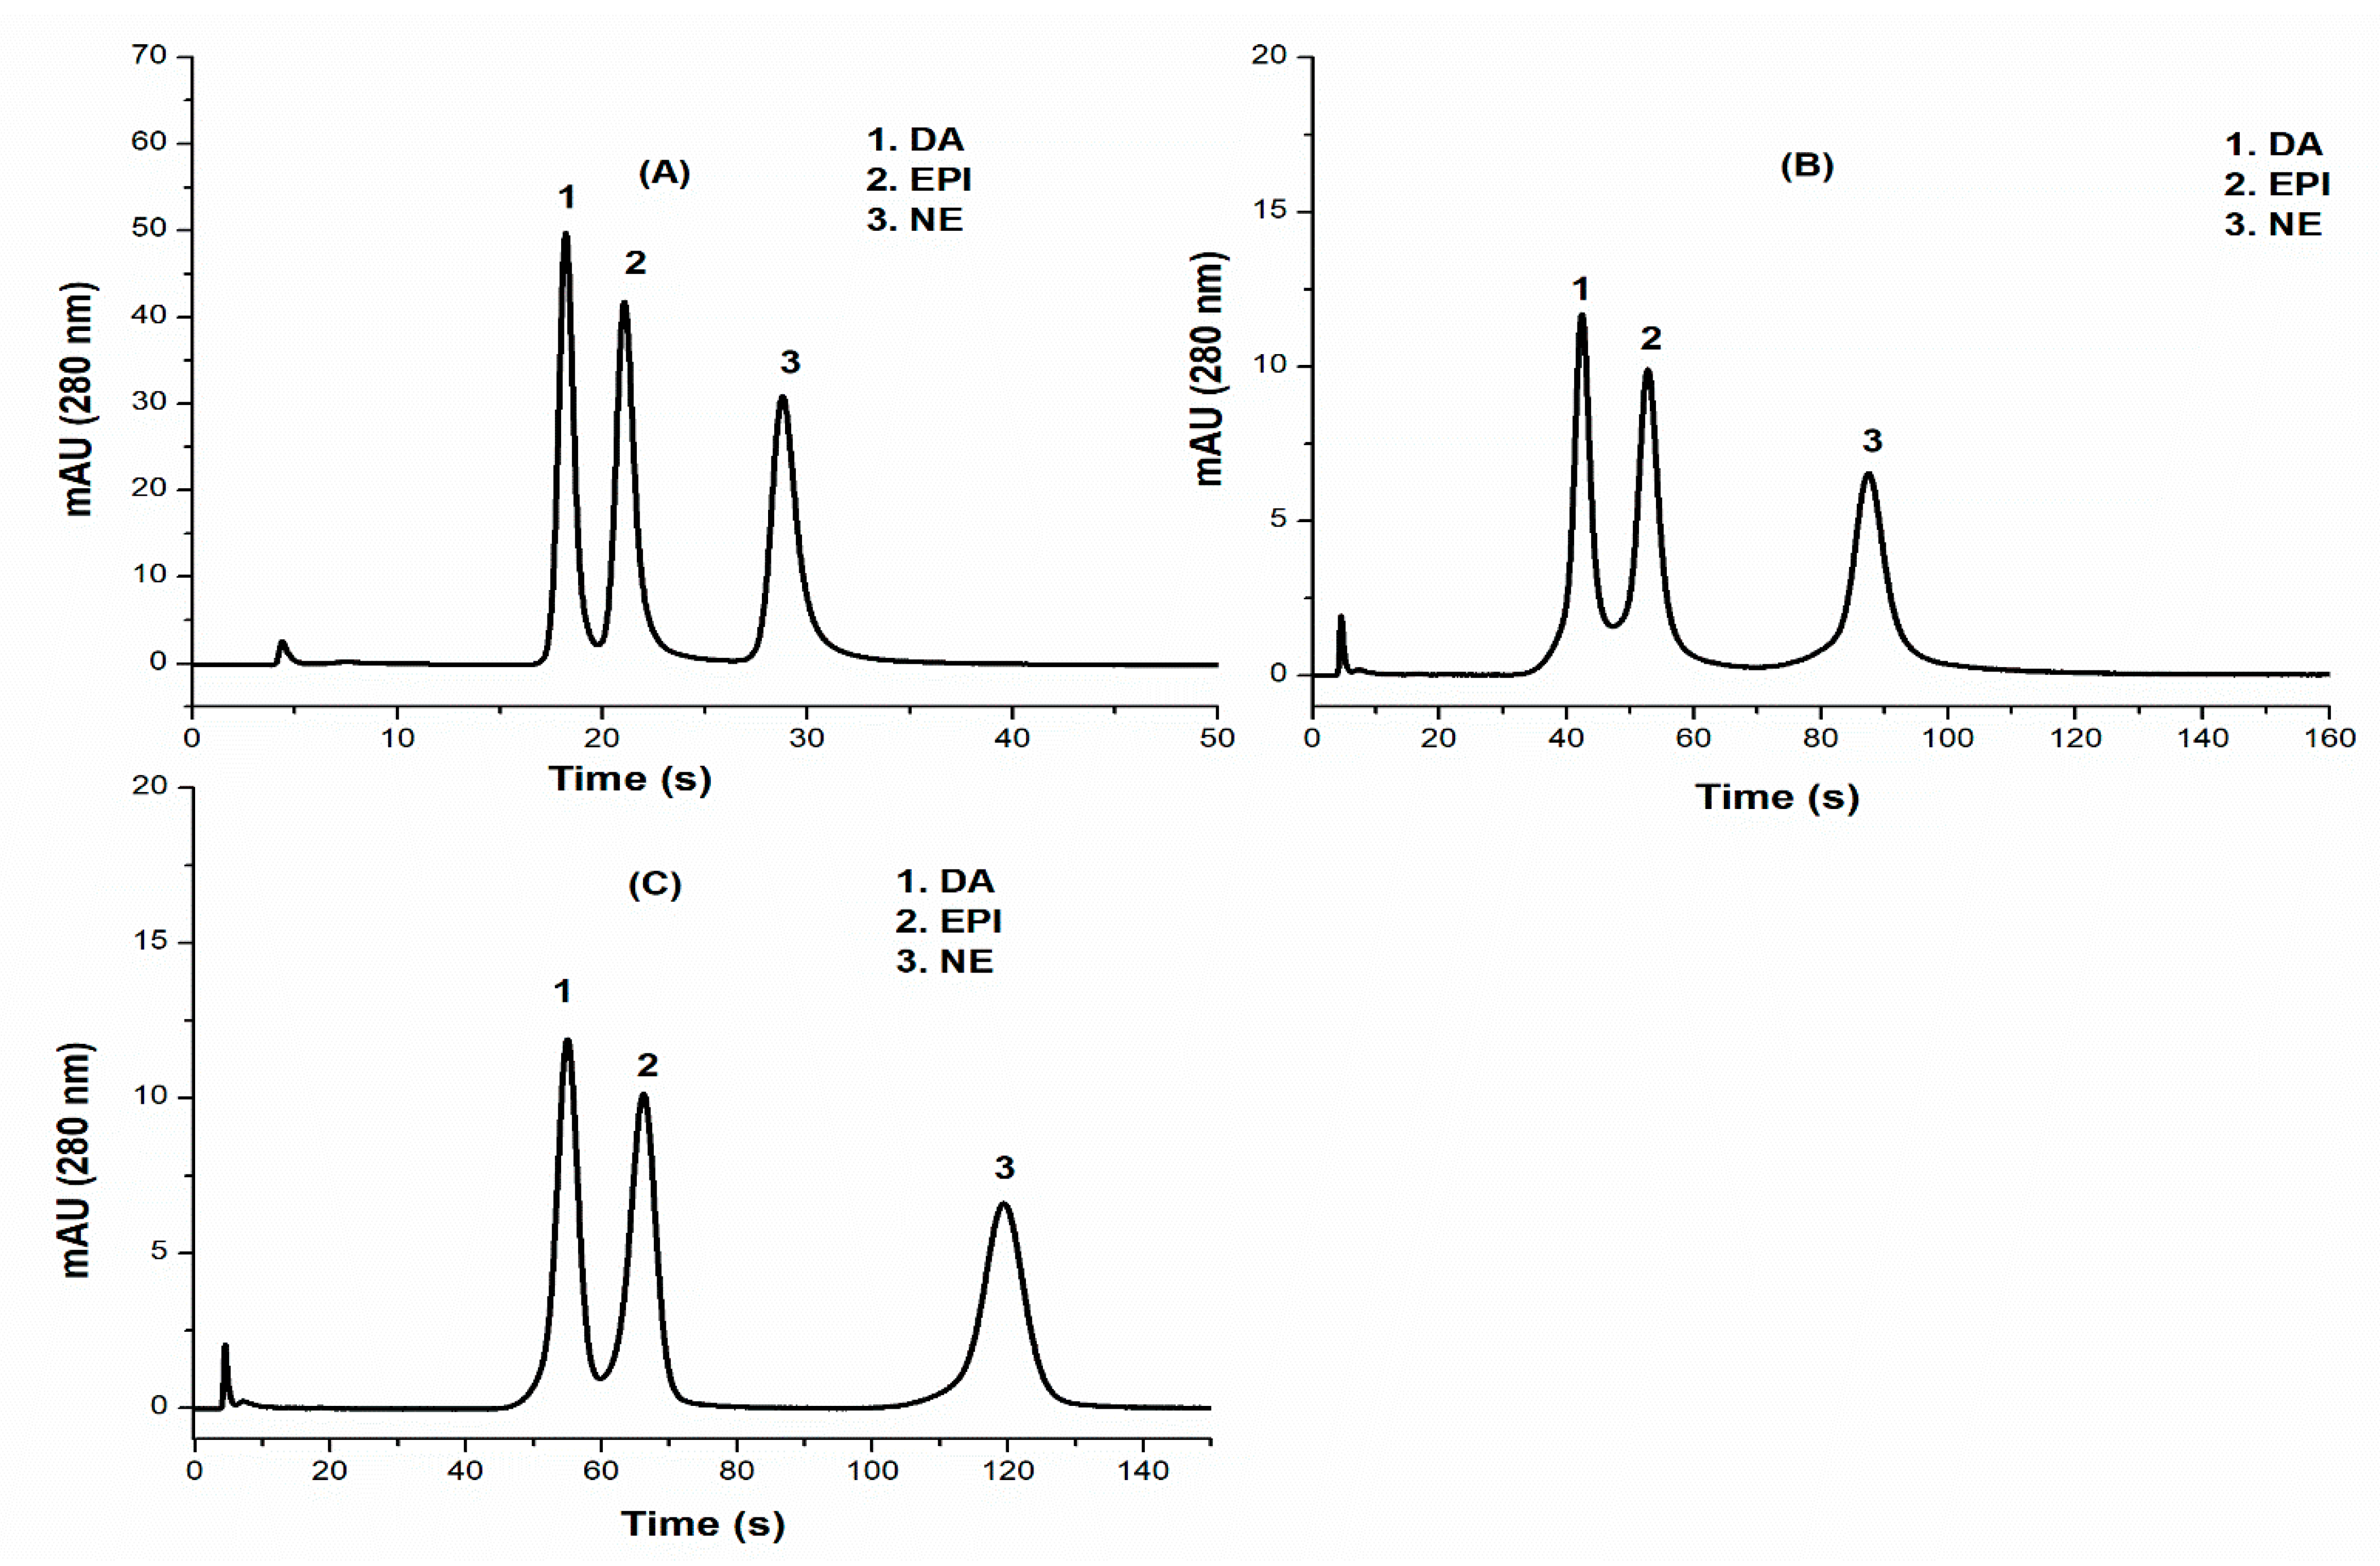
3.2. Comparison of Zwitterionic HILIC Columns

Three different commercially available zwitterionic columns were tested for the separation of the CAs. Separation using two fully porous Z-HILIC columns was compared to the core-shell Z-HILIC column under the same separation conditions (Figure 2). The core-shell Z-HILIC phase uses a novel zwitterionic stationary phase bonded to a robust hybrid silica particle, while the Z-cHILIC and Z-HILIC fully porous columns contain a zwitterionic phosphorylcholine functional group and sulfobetaine functional group, respectively.
The present study confirmed that the core-shell column provided superior performance over the fully porous columns in terms of efficiency and speed. The column efficiency is indicated as the number of theoretical plates (N) per column, and the RSD (%) values are reported in Table 1. Table 1 indicates that the core-shell Z-HILIC column provided an almost twofold increase in efficiency in comparison to the two fully porous columns. The separation time was reduced by approximately 60% using the core-shell column (Figure 3).
Selectivity (α) is another important factor that indicates the ability of the stationary phase to discriminate between analytes. α values were calculated between DA and EPI, and EPI and NE for each column (Table 2, Figure 2). The core-shell Z-HILIC column provided the best α value between DA and EPI at 1.3, while the Z-cHILIC provided the highest α value between EPI and NE at 1.84. Selectivity (α) values greater than 1 indicate that the three columns provided sufficient selectivity for the separation of CAs [58]. However, as the core-shell Z-HILIC column displayed higher efficiency and rapid separation, it was selected for all subsequent experiments.

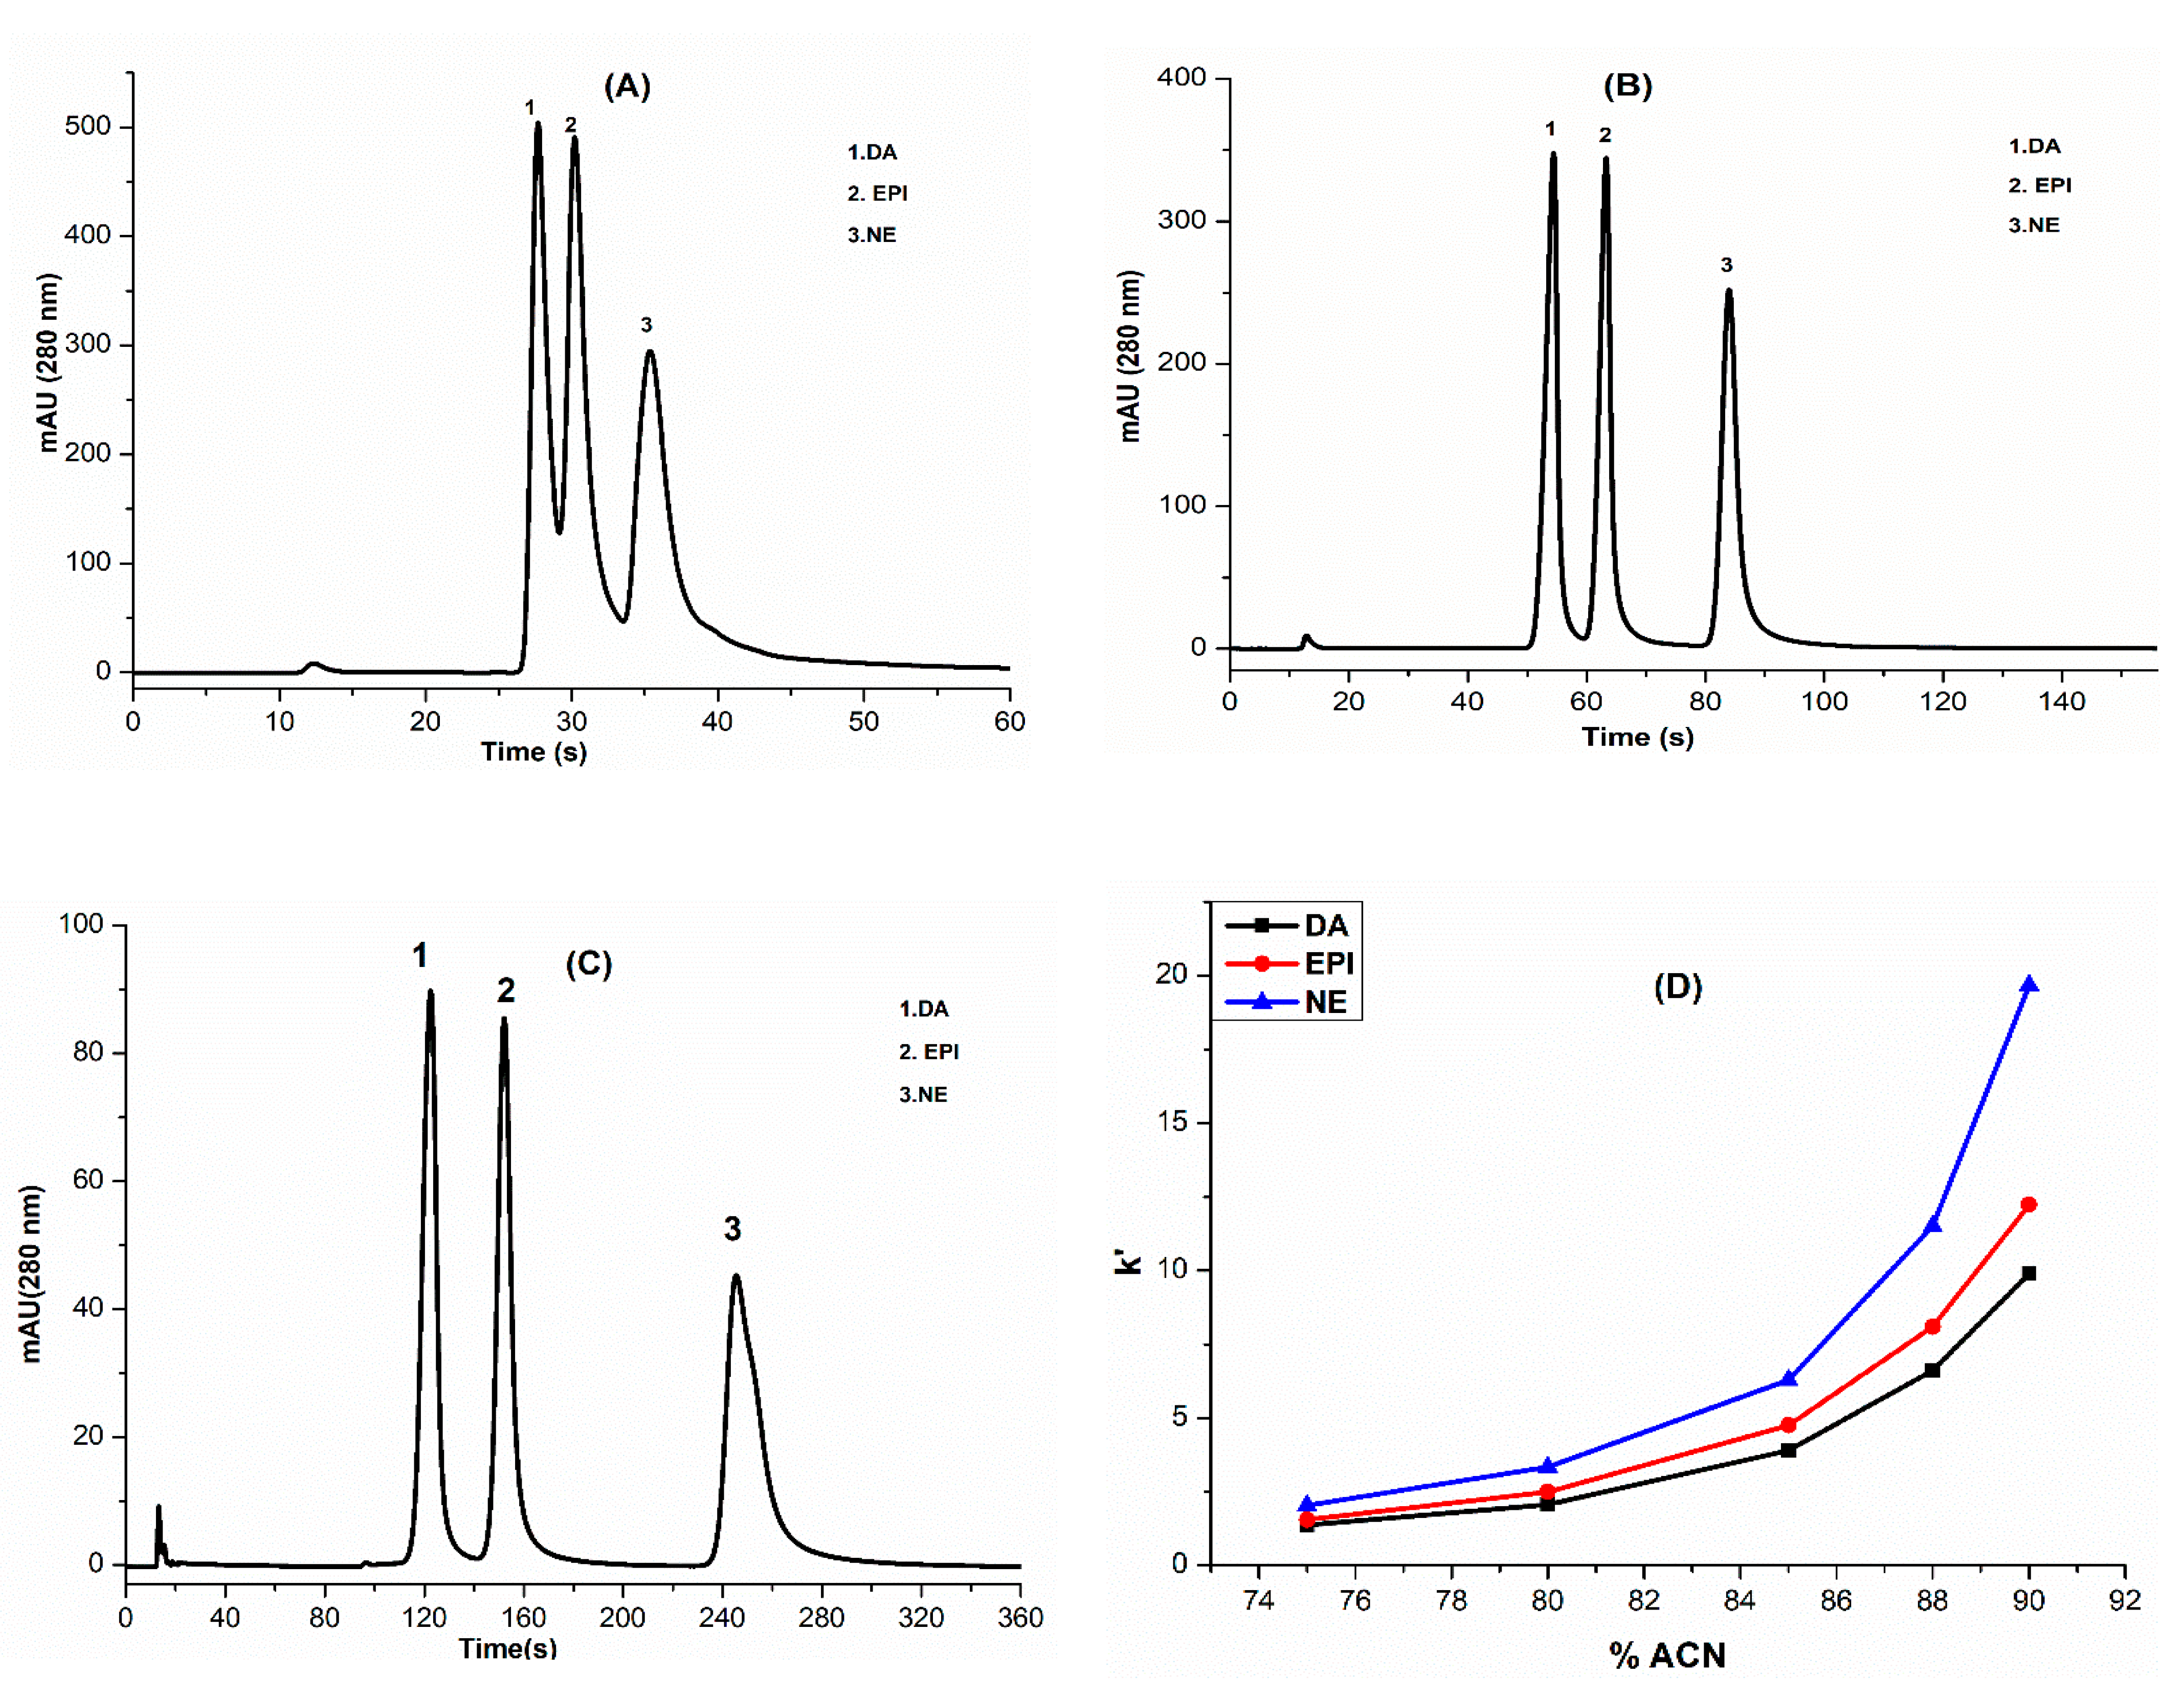
3.3. Optimization of HILIC Separation Conditions

The chromatographic separation of the selected biomarker CAs using the core-shell Z-HILIC column was initially performed at a flow rate of 0.5 mL/min and UV detection at 280 nm and was optimized in terms of the mobile phase composition, buffer pH, and concentration. Different mobile phase compositions were tested with varying percentages of ACN in 10 mM ammonium formate buffer, as illustrated in Figure 3. A higher concentration of ACN in the mobile phase increase the retention times (Figure 3), as the polar analytes have a higher degree of partitioning in the thin water-enriched layer on the stationary phase [32].
Furthermore, it is important to highlight that, as the concentration of the organic solvent is increased, the pH of the mobile phase also increases. The measured pH in the presence of high organic solvent content ( p w s H ) differed considerably from the actual pH measured on water ( p w w H ) using the pH meter calibrated with aqueous buffers [32,59,60]. This can potentially aid the deprotonation of the silanol group and increase the secondary interaction between the analyte and the silanol group, which would cause peak distortion and tailing [32,59].
Also, Figure S1 demonstrates the major effect of buffer pH on the peak shapes and peak intensities for the CAs. Increasing the pH from 3 to 5 caused peak broadening and tailing, and the peak heights were reduced by 18% for DA, 33% for EPI, and 31% for NE. Similar findings were reported by Abhinav et al. for the separation of CAs using HILIC [32]. It is worth noting that CAs are very reactive molecules, and they are kept in vesicles with acidic media in the brain as they can be easily degraded to their corresponding o-quinones forms in an alkaline environment [4]. Therefore, developing a separation method with a suitable pH value requires careful attention with CAs.
In addition, as the concentration of the ammonium formate buffer at pH 3 increased from 10 to 20 mM, the retention times of the analytes decreased slightly, and the peaks became sharper [33]. The relationship between the inverse of buffer concentration and the retention time of the analytes can shed light on the mechanism involved in the separation. A linear plot would indicate ion exchange retention between the analytes and the stationary phase [32,61]. However, a slightly curved line plot indicates the presence of other mechanisms, such as HILIC partitioning and electrostatic interactions [32]. To obtain a rapid HILIC separation in less than 60 s, faster flow rates were examined, and 1.5 mL/min with a corresponding backpressure of 360 bar was chosen, as illustrated in Figure S2.

3.4. Optimization of Detection Potential for LC-ECD

The influence of the detection potential on the oxidation of the CAs was investigated in the range of +1.0 to +1.7 V using amperometric detection. Figure 4 shows the hydrodynamic voltammograms of the CAs under the optimum separation conditions with the maximum oxidation currents occurring at +1.3 V.

3.5. Method Validation

Linear calibration curves were obtained by the injection of a mixture of CAs with six different concentrations under the optimal separation conditions, initially with LC-UV (Table S1) and then with LC-BDD. The linear calibration range (0.1–25 µM), regression equation, correlation coefficients, and LODs are presented in Table 3 for LC-BDD. Linear regression analysis was performed by plotting the peak areas versus concentrations with a correlation coefficient (R2) of more than 0.99. The linearity of the three CAs was evaluated by triplicate injection of different concentrations of the standard mixtures.
The LODs (calculated at a S/N of 3) were 40 nM for DA and 50 nM for both EPI and NE with ECD. The LODs of CAs detected by the BDD electrode were lower than those obtained by UV, indicating the higher sensitivity achievable with the BDD electrode. The LODs reported in the present work were lower than those previously reported methods using the capillary electrophoresis (CE) chemiluminescence (CL) method [62], and using a magnetic molecularly imprinted polymer (MMIP) for the sorbent extraction and CE analysis [63].
However, the LODs of CAs using LC-MS [64] and LC-fluorescence detection [29] were lower than the present LODs, shown in Table 4. The nanomolar detection achievable with LC-BDD indicates its suitability in providing early diagnosis of TBI and cancer types previously stated. Repeatability and intermediate precision (intra- and inter-assay) were calculated as RSD%. The intra-day and inter-day precision levels based on retention time were in the range of 0.35–0.42% and 0.4–0.65%, respectively. This indicates good method repeatability, further confirming the applicability of this method for analysis of CAs (Table 5).

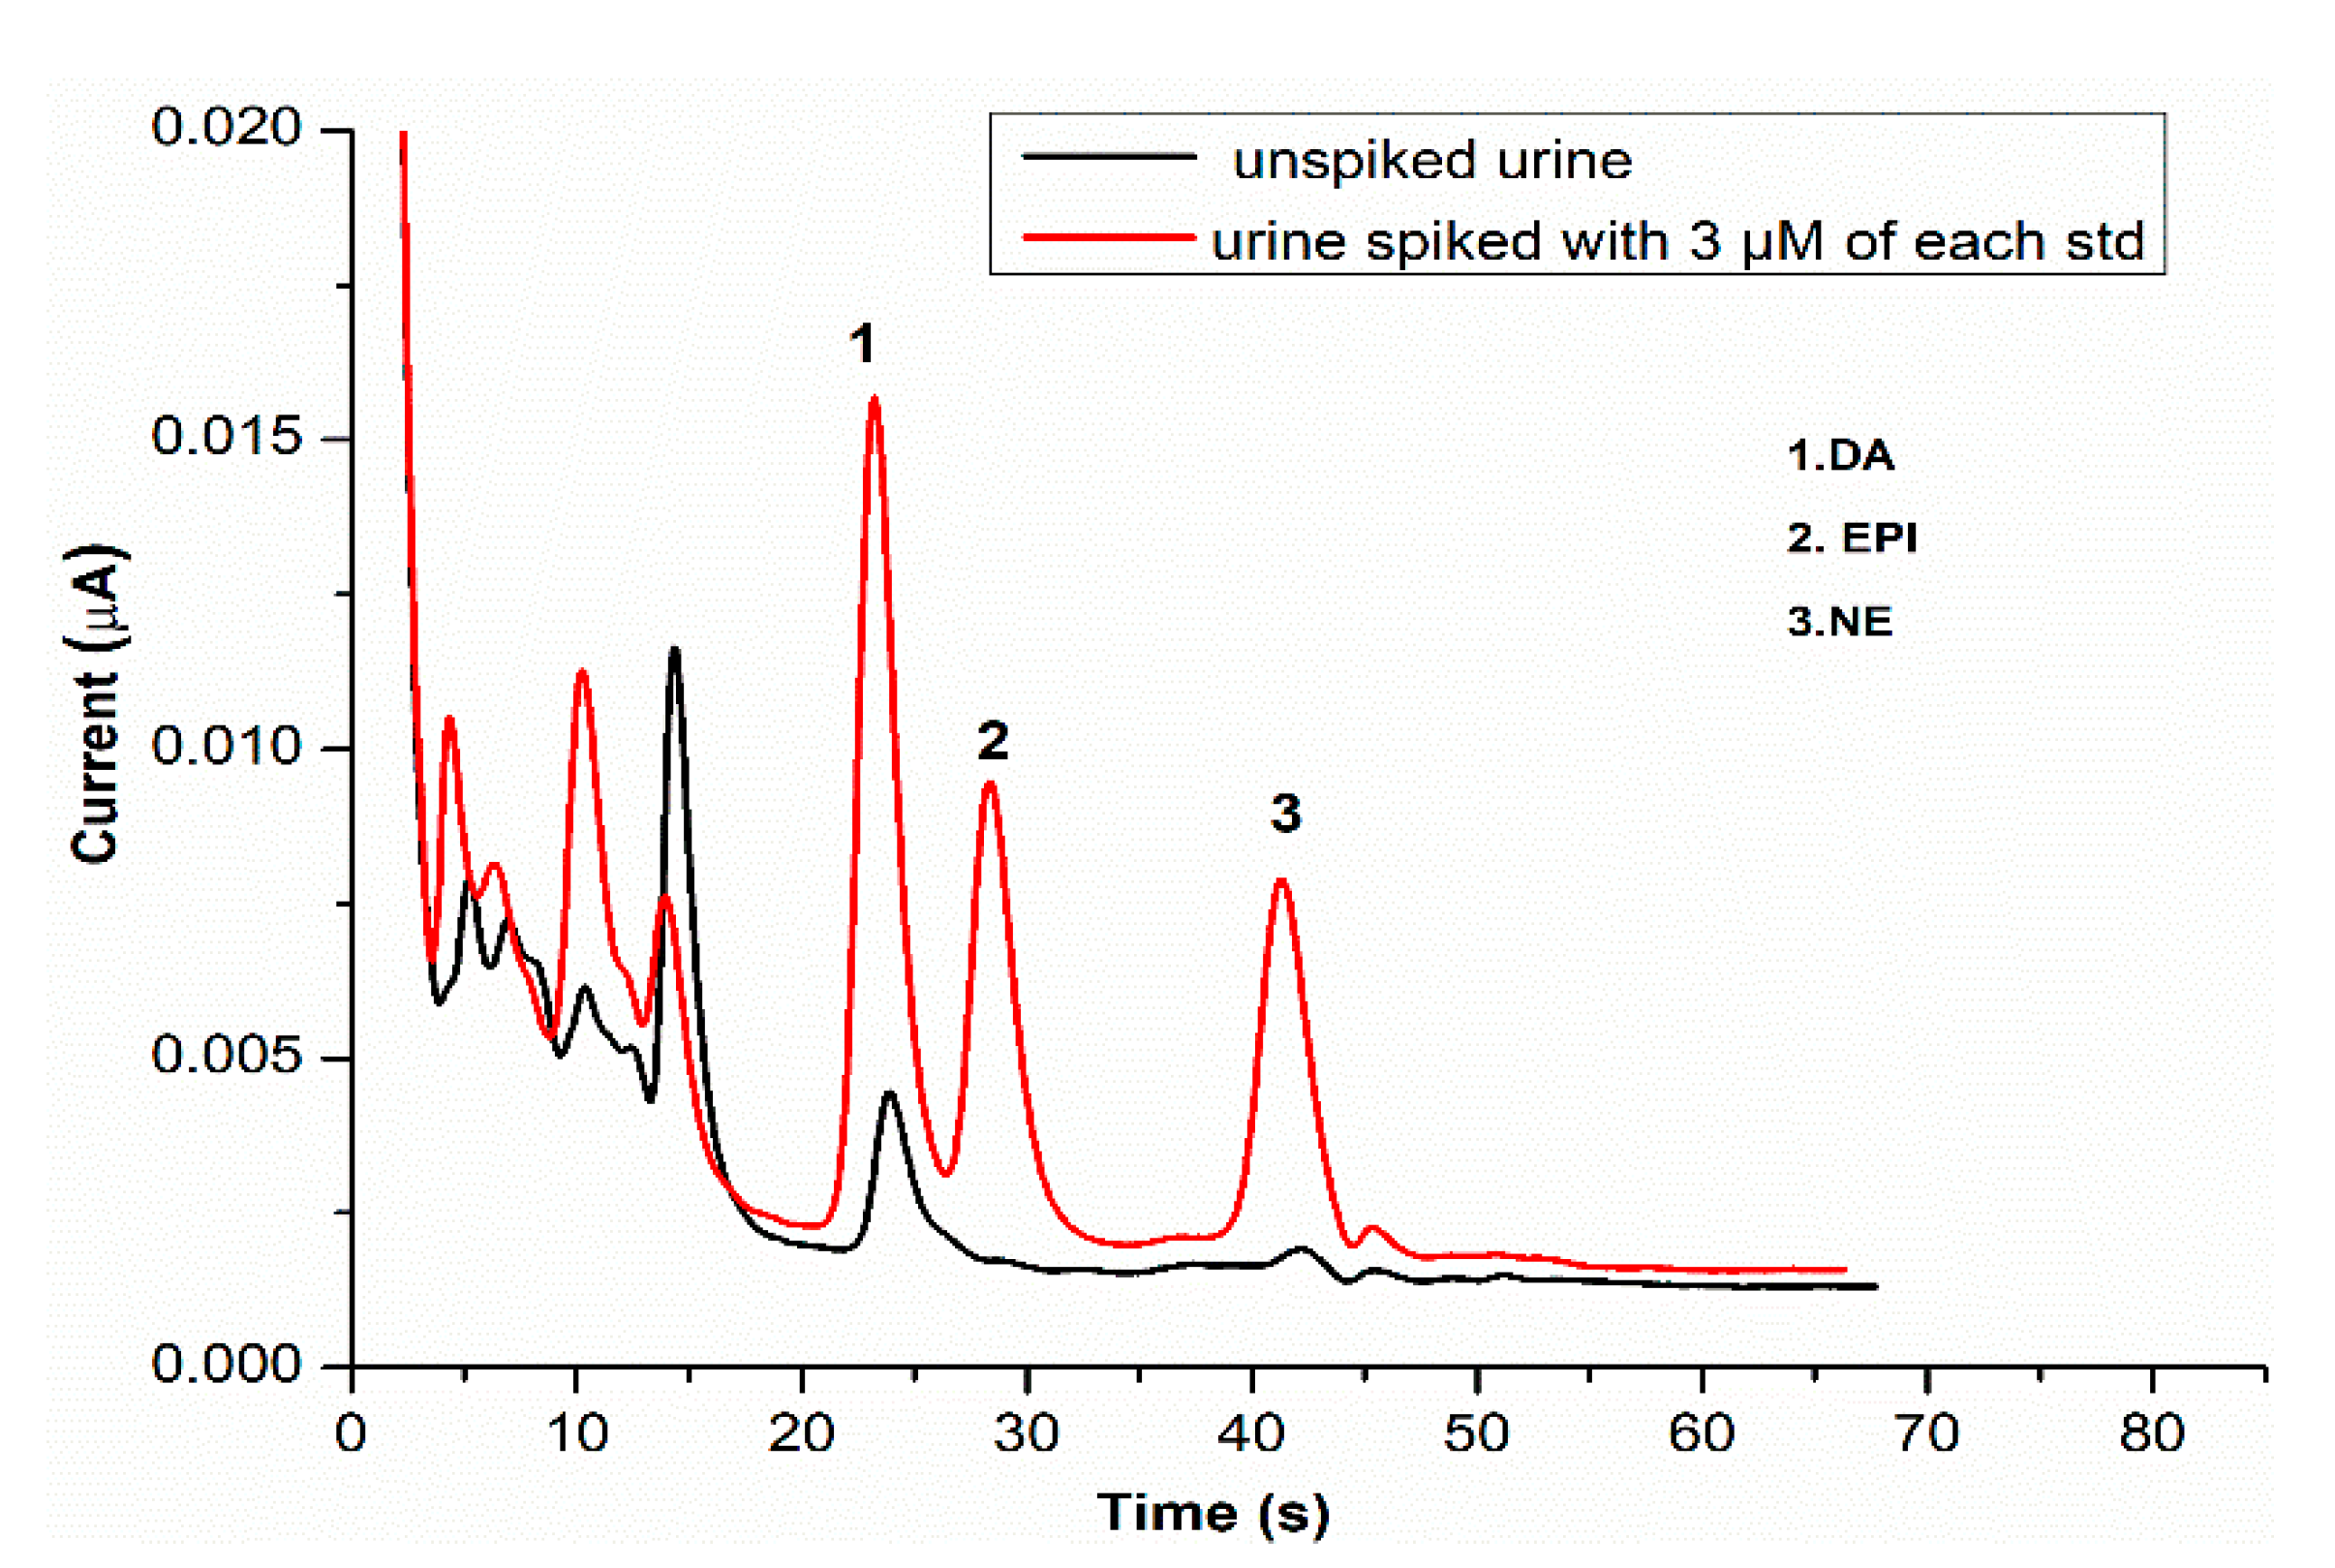
3.6. Urine Sample Analysis

The applicability of the method was examined by evaluating its use in determining the concentrations of the three selected CAs in urine samples using the optimal LC-BDD method following PBA SPE [66,67,68,69]. In this study, PBA SPE, as described by Abhinav et al. [32], was used for urine sample pretreatment using the elution solvent under acidic conditions with 80% ACN making it a suitable and efficient step prior to HILIC separation. The recovery results obtained for each analyte after spiking urine samples at three different CAs concentration levels are shown in Table 6. RSD expresses the variation of peak areas for each analyte (n = 6 each). The utilized SPE method provided good recovery values ranging from 90% to 94%. These finding are in agreement with previously reported values [32].
DA and NE were successfully quantified in the unspiked urine samples, and the calculated concentrations are presented in Table 7. EPI was not quantifiable in the urine samples. This might be due to the low concentration of EPI, below the detection limit, which was also reported by Xu et al. [62]. The expected ranges of urinary CAs over a 24 h period were 65–400 µg/L DA, 0–20 µg/L EPI, and 15–80 µg/L NE [70]. The calculated values of DA and NE in urine samples were in the normal range of their concentration in urine. Figure 5 shows a representative chromatogram of a urine sample spiked with a mixture of CAs (3 µM).

4. Conclusions

An efficient, rapid, and sensitive separation method for dopamine (DA), epinephrine (EPI), and norepinephrine (NE) has been optimized, combining the superior performance of a core-shell Z-HILIC column coupled to nanomolar ECD at a BDD electrode. The core-shell Z-HILIC column provided higher efficiency with separation in less than 60 s in comparison to the fully porous Z-HILIC stationary phases. The proposed method represents sufficient precision and linearity to enable the rapid separation of DA, EPI, and NE with sensitive detection at a downstream BDD electrode.
The applicability of the developed method was evaluated by determining the CA levels in urine samples following SPE based on PBA. The concentrations of DA and NE in unspiked urine samples were determined, and their values were in the expected range for these CAs in urine. This rapid LC-BDD method could be effectively applied for the screening of CAs overproduction in urine samples for patients with TBI, pheochromocytoma, and paraganglioma [12,71,72].

Supplementary Materials

The following are available online at https://www.mdpi.com/article/10.3390/separations8080124/s1, Figure S1: Effect of the mobile phase pH on the retention time of a mixture of 500 μM each of DA, EPI, and NE. Mobile phase: 15:85, ACN: 10 mM ammonium formate pH 3 (A) and 10 mM ammonium acetate pH 5 (B) Column: Poro-shell Z-HILIC (2.1 × 50 mm, 2.7 μm), flow rate: 0.5 mL/min, injection volume: 5 µL, UV detection: 280 nm, and temperature 23 °C. Figure S2: Effect of the mobile phase flow rate on the retention time of a mixture of 500 μM each of DA, EPI, and NE. Mobile phase: ACN: 10 mM ammonium formate pH 3 (85:15). Column: Poro-shell Z-HILIC (2.1 × 50 mm, 2.7 μm), injection volume: 1 μL, UV detection: 280 nm, temperature 23 °C flow rate: 1.5 mL/min (A), 1 mL/min (B), 0.5 mL/min (C). Table S1: Linear regression parameters of the calibration curves and precision data with HPLC-UV at 280 nm.

Author Contributions

Conceptualization, M.A. and J.D.G.; methodology, M.A.; software, M.A.; validation, M.A. and H.A.; formal analysis, M.A.; investigation, M.A. and H.A.; resources, M.A. and H.A.; data curation, M.A. and P.E.H.; writing—original draft preparation, M.A.; writing—review and editing, M.A., P.E.H., A.M.H. and J.D.G.; visualization, M.A. and A.M.H.; supervision, J.D.G.; project administration, J.D.G.; funding acquisition, J.D.G. and M.A. All authors have read and agreed to the published version of the manuscript.

Funding

This research was funded by Science Foundation Ireland, grant number (08/SRC/B1412), and the Saudi Ministry of Education and Cultural Bureau, Dublin, Ireland.

Institutional Review Board Statement

Ethical review and approval were waived for this study, due to it being non-medical research.

Informed Consent Statement

Not applicable.

Acknowledgments

JDG thanks the Science Foundation Ireland (08/SRC/B1412) for previous research funding of the Irish Separation Science Cluster (ISSC) under the Strategic Research Cluster Programme. MA thanks the Saudi Ministry of Education and Cultural Bureau, Dublin, Ireland, for research funding.

Conflicts of Interest

There are no conflict to declare.

References

  1. Goldstein, D.S.; Eisenhofer, G.; Kopin, I.J. Sources and Significance of Plasma Levels of Catechols and Their Metabolites in Humans. J. Pharmacol. Exp. Ther. 2003, 305, 800. [Google Scholar] [CrossRef] [PubMed] [Green Version]
  2. Laverty, R. Catecholamines: Role in Health and Disease. Drugs 1978, 16, 418–440. [Google Scholar] [CrossRef] [PubMed]
  3. Focke, P.J.; Wang, X.; Larsson, H.P. Neurotransmitter transporters: Structure meets function. Structure 2013, 21, 694–705. [Google Scholar] [CrossRef] [PubMed] [Green Version]
  4. Meiser, J.; Weindl, D.; Hiller, K. Complexity of dopamine metabolism. Cell Commun. Signal. 2013, 11, 34. [Google Scholar] [CrossRef] [PubMed] [Green Version]
  5. Pan, X.; Kaminga, A.C.; Jia, P.; Wen, S.W.; Acheampong, K.; Liu, A. Catecholamines in Alzheimer’s Disease: A Systematic Review and Meta-Analysis. Front. Aging Neurosci. 2020, 12, 184. [Google Scholar] [CrossRef]
  6. Kordower, J.H.; Olanow, C.W.; Dodiya, H.B.; Chu, Y.; Beach, T.G.; Adler, C.H.; Halliday, G.M.; Bartus, R.T. Disease duration and the integrity of the nigrostriatal system in Parkinson’s disease. Brain 2013, 136, 2419–2431. [Google Scholar] [CrossRef] [Green Version]
  7. Olivares-Hernández, A.; Figuero-Pérez, L.; Cruz-Hernandez, J.J.; González Sarmiento, R.; Usategui-Martin, R.; Miramontes-González, J.P. Dopamine Receptors and the Kidney: An Overview of Health- and Pharmacological-Targeted Implications. Biomolecules 2021, 11, 254. [Google Scholar] [CrossRef]
  8. Adameova, A.; Abdellatif, Y.; Dhalla, N.S. Role of the excessive amounts of circulating catecholamines and glucocorticoids in stress-induced heart disease. Can. J. Physiol. Pharmacol. 2009, 87, 493–514. [Google Scholar] [CrossRef]
  9. Fung, M.M.; Viveros, O.H.; O’Connor, D.T. Diseases of the adrenal medulla. Acta Physiol. 2008, 192, 325–335. [Google Scholar] [CrossRef]
  10. Barron, J. Phaeochromocytoma: Diagnostic challenges for biochemical screening and diagnosis. J. Clin. Pathol. 2010, 63, 669–674. [Google Scholar] [CrossRef]
  11. Rizoli, S.B.; Jaja, B.N.R.; Di Battista, A.P.; Rhind, S.G.; Neto, A.C.; da Costa, L.; Inaba, K.; da Luz, L.T.; Nascimento, B.; Perez, A.; et al. Catecholamines as outcome markers in isolated traumatic brain injury: The COMA-TBI study. Crit. Care 2017, 21, 37. [Google Scholar] [CrossRef] [Green Version]
  12. Hamill, R.W.; Woolf, P.D.; McDonald, J.V.; Lee, L.A.; Kelly, M. Catecholamines predict outcome in traumatic brain injury. Ann. Neurol. 1987, 21, 438–443. [Google Scholar] [CrossRef]
  13. Clifton, G.L.; Ziegler, M.G.; Grossman, R.G. Circulating catecholamines and sympathetic activity after head injury. Neurosurgery 1981, 8, 10–14. [Google Scholar] [CrossRef]
  14. Trifonova, O.P.; Maslov, D.L.; Balashova, E.E.; Urazgildeeva, G.R.; Abaimov, D.A.; Fedotova, E.Y.; Poleschuk, V.V.; Illarioshkin, S.N.; Lokhov, P.G. Parkinson’s Disease: Available Clinical and Promising Omics Tests for Diagnostics, Disease Risk Assessment, and Pharmacotherapy Personalization. Diagnostics 2020, 10, 339. [Google Scholar] [CrossRef]
  15. Sawada, H.; Oeda, T.; Yamamoto, K. Catecholamines and Neurodegeneration in Parkinson’s Disease-From Diagnostic Marker to Aggregations of α-Synuclein. Diagnostics 2013, 3, 210–221. [Google Scholar] [CrossRef] [PubMed] [Green Version]
  16. Goldstein, D.S.; Holmes, C.; Sharabi, Y. Cerebrospinal fluid biomarkers of central catecholamine deficiency in Parkinson’s disease and other synucleinopathies. Brain 2012, 135, 1900–1913. [Google Scholar] [CrossRef] [PubMed]
  17. Vermeiren, Y.; Hirschberg, Y.; Mertens, I.; De Deyn, P.P. Biofluid Markers for Prodromal Parkinson’s Disease: Evidence from a Catecholaminergic Perspective. Front. Neurol. 2020, 11, 595. [Google Scholar] [CrossRef] [PubMed]
  18. Kim, A.R.; Nodel, M.R.; Pavlenko, T.A.; Chesnokova, N.B.; Yakhno, N.N.; Ugrumov, M.V. Tear Fluid Catecholamines as Biomarkers of the Parkinson’s Disease: A Clinical and Experimental Study. Acta Nat. 2019, 11, 99–103. [Google Scholar] [CrossRef] [PubMed]
  19. Song, J.; Kim, J. Degeneration of Dopaminergic Neurons due to Metabolic Alterations and Parkinson’s Disease. Front. Aging Neurosci. 2016, 8, 65. [Google Scholar] [CrossRef] [PubMed]
  20. Chekhonin, V.P.; Baklaushev, V.P.; Kogan, B.M.; Savchenko, E.A.; Lebedev, S.V.; Man’kovskaya, I.V.; Filatova, T.S.; Yusupova, I.U.; Dmitrieva, T.B. Catecholamines and their metabolites in the brain and urine of rats with experimental Parkinson’s disease. Bull. Exp. Biol. Med. 2000, 130, 805–809. [Google Scholar]
  21. van Faassen, M.; Bischoff, R.; Eijkelenkamp, K.; de Jong, W.H.A.; van der Ley, C.P.; Kema, I.P. In Matrix Derivatization Combined with LC-MS/MS Results in Ultrasensitive Quantification of Plasma Free Metanephrines and Catecholamines. Anal. Chem. 2020, 92, 9072–9078. [Google Scholar] [CrossRef]
  22. Chung, H.; Tajiri, S.; Hyoguchi, M.; Koyanagi, R.; Shimura, A.; Takata, F.; Dohgu, S.; Matsui, T. Analysis of Catecholamine and Their Metabolites in Mice Brain by Liquid Chromatography–Mass Spectrometry Using Sulfonated Mixed-mode Copolymer Column. Anal. Sci. 2019, 35, 433–439. [Google Scholar] [CrossRef] [Green Version]
  23. Peitzsch, M.; Pelzel, D.; Glöckner, S.; Prejbisz, A.; Fassnacht, M.; Beuschlein, F.; Januszewicz, A.; Siegert, G.; Eisenhofer, G. Simultaneous liquid chromatography tandem mass spectrometric determination of urinary free metanephrines and catecholamines, with comparisons of free and deconjugated metabolites. Clin. Chim. Acta 2013, 418, 50–58. [Google Scholar] [CrossRef] [PubMed]
  24. Machida, M.; Sakaguchi, A.; Kamada, S.; Fujimoto, T.; Takechi, S.; Kakinoki, S.; Nomura, A. Simultaneous analysis of human plasma catecholamines by high-performance liquid chromatography with a reversed-phase triacontylsilyl silica column. J. Chromatogr. B Biomed. Sci. Appl. 2006, 830, 249–254. [Google Scholar] [CrossRef]
  25. Kumarathasan, P.; Vincent, R. New approach to the simultaneous analysis of catecholamines and tyrosines in biological fluids. J. Chromatogr. A 2003, 987, 349–358. [Google Scholar] [CrossRef]
  26. Ehrenström, F.; Johansson, P. A method for very rapid determinations of catechols using ion-pairing reverse phase HPLC with electrochemical detection: Effects of L-DOPA treatment on the catechol content in various rat brain structures. Life Sci. 1985, 36, 867–879. [Google Scholar] [CrossRef]
  27. Speek, A.J.; Odink, J.; Schrijver, J.; Schreurs, W.H.P. High-performance liquid chromatographic determination of urinary free catecholamines with electrochemical detection after prepurification on immobilized boric acid. Clin. Chim. Acta 1983, 128, 103–113. [Google Scholar] [CrossRef]
  28. Birbeck, J.A.; Mathews, T.A. Simultaneous Detection of Monoamine and Purine Molecules Using High-Performance Liquid Chromatography with a Boron-Doped Diamond Electrode. Anal. Chem. 2013, 85, 7398–7404. [Google Scholar] [CrossRef] [PubMed]
  29. Huang, X.; Guo, X.-F.; Wang, H.; Zhang, H.-S. Analysis of catecholamines and related compounds in one whole metabolic pathway with high performance liquid chromatography based on derivatization. Arab. J. Chem 2019, 12, 1159–1167. [Google Scholar] [CrossRef] [Green Version]
  30. Konieczna, L.; Roszkowska, A.; Niedźwiecki, M.; Bączek, T. Hydrophilic interaction chromatography combined with dispersive liquid–liquid microextraction as a preconcentration tool for the simultaneous determination of the panel of underivatized neurotransmitters in human urine samples. J. Chromatogr. A 2016, 1431, 111–121. [Google Scholar] [CrossRef]
  31. Miękus, N.; Konieczna, L.; Kowiański, P.; Moryś, J.; Bączek, T. HILIC-MS Rat Brain Analysis, A New Approach for the Study of Ischemic Attack. Transl. Neurosci. 2017, 8, 70–75. [Google Scholar] [CrossRef] [Green Version]
  32. Kumar, A.; Hart, J.P.; McCalley, D.V. Determination of catecholamines in urine using hydrophilic interaction chromatography with electrochemical detection. J. Chromatogr. A 2011, 1218, 3854–3861. [Google Scholar] [CrossRef] [PubMed]
  33. McCalley, D.V. Study of the selectivity, retention mechanisms and performance of alternative silica-based stationary phases for separation of ionised solutes in hydrophilic interaction chromatography. J. Chromatogr. A 2010, 1217, 3408–3417. [Google Scholar] [CrossRef] [PubMed]
  34. Kobayashi, H.; Ikegami, T.; Kimura, H.; Hara, T.; Tokuda, D.; Tanaka, N. Properties of monolithic silica columns for HPLC. Anal. Sci. 2006, 22, 491–501. [Google Scholar] [CrossRef] [Green Version]
  35. Cabrera, K. Applications of silica-based monolithic HPLC columns. J. Sep. Sci 2004, 27, 843–852. [Google Scholar] [CrossRef] [PubMed]
  36. Hayes, R.; Ahmed, A.; Edge, T.; Zhang, H. Core–shell particles: Preparation, fundamentals and applications in high performance liquid chromatography. J. Chromatogr. A 2014, 1357, 36–52. [Google Scholar] [CrossRef] [Green Version]
  37. Gosetti, F. Benefits and Drawbacks of Fully Porous sub-2 µm and Core-Shell Particles. Comparative UHPLC Applications in Food, Environmental, Forensic, Biopharmaceutical and Natural Products Analyses. Curr. Chromatogr 2018, 5, 18–32. [Google Scholar] [CrossRef]
  38. DeStefano, J.J.; Schuster, S.A.; Lawhorn, J.M.; Kirkland, J.J. Performance characteristics of new superficially porous particles. J. Chromatogr. A 2012, 1258, 76–83. [Google Scholar] [CrossRef] [Green Version]
  39. Kirkland, J.J.; Schuster, S.A.; Johnson, W.L.; Boyes, B.E. Fused-core particle technology in high-performance liquid chromatography: An overview. J. Pharm. Anal. 2013, 3, 303–312. [Google Scholar] [CrossRef] [Green Version]
  40. Wagner, B.M.; Schuster, S.A.; Boyes, B.E.; Kirkland, J.J. Superficially porous silica particles with wide pores for biomacromolecular separations. J. Chromatogr. A 2012, 1264, 22–30. [Google Scholar] [CrossRef] [Green Version]
  41. Langsi, V.K.; Ashu-Arrah, B.A.; Ward, N.; Glennon, J.D. Synthesis and characterisation of non-bonded 1.7μm thin-shell (TS1.7-100nm) silica particles for the rapid separation and analysis of uric acid and creatinine in human urine by hydrophilic interaction chromatography. J. Chromatogr. A 2017, 1506, 37–44. [Google Scholar] [CrossRef]
  42. Ruta, J.; Guillarme, D.; Rudaz, S.; Veuthey, J.-L. Comparison of columns packed with porous sub-2 μm particles and superficially porous sub-3 μm particles for peptide analysis at ambient and high temperature. J. Sep. Sci. 2010, 33, 2465–2477. [Google Scholar] [CrossRef] [PubMed]
  43. Barman, K.; Jasimuddin, S. Simultaneous electrochemical detection of dopamine and epinephrine in the presence of ascorbic acid and uric acid using a AgNPs–penicillamine–Au electrode. RSC Adv. 2016, 6, 99983–99988. [Google Scholar] [CrossRef]
  44. Sarada, B.V.; Rao, T.N.; Tryk, D.A.; Fujishima, A. Electrochemical oxidation of histamine and serotonin at highly boron- doped diamond electrodes. Anal. Chem. 2000, 72, 1632–1638. [Google Scholar] [CrossRef] [PubMed]
  45. Swain, G.M.; Anderson, A.B.; Angus, J.C. Applications of Diamond Thin Films in Electrochemistry. MRS Bull. 1998, 23, 56–60. [Google Scholar] [CrossRef]
  46. Bouamrane, F.; Tadjeddine, A.; Butler, J.E.; Tenne, R.; Lévy-Clément, C. Electrochemical study of diamond thin films in neutral and basic solutions of nitrate. J. Electroanal. Chem. 1996, 405, 95–99. [Google Scholar] [CrossRef]
  47. DeClements, R.; Swain, G.M. The formation and electrochemical activity of microporous diamond thin film electrodes in concentrated KOH. J. Electrochem. Soc. 1997, 144, 856–866. [Google Scholar] [CrossRef]
  48. Rao, T.N.; Sarada, B.V.; Tryk, D.A.; Fujishima, A. Electroanalytical study of sulfa drugs at diamond electrodes and their determination by HPLC with amperometric detection. J. Electroanal. Chem. 2000, 491, 175–181. [Google Scholar] [CrossRef]
  49. Terashima, C.; Rao, T.N.; Sarada, B.V.; Tryk, D.A.; Fujishima, A. Electrochemical Oxidation of Chlorophenols at a Boron-Doped Diamond Electrode and Their Determination by High-Performance Liquid Chromatography with Amperometric Detection. Anal. Chem. 2002, 74, 895–902. [Google Scholar] [CrossRef]
  50. Ivandini, T.A.; Sato, R.; Makide, Y.; Fujishima, A.; Einaga, Y. Pt-implanted boron-doped diamond electrodes and the application for electrochemical detection of hydrogen peroxide. Diam. Relat. Mater. 2005, 14, 2133–2138. [Google Scholar] [CrossRef]
  51. Hayes, P.E.; Luong, J.H.T.; Gilchrist, E.S.; Buzid, A.; Glennon, J.D. Profiling of phenolic flavorings using core-shell reversed-phase liquid chromatography with electrochemical detection at a boron-doped diamond electrode. J. Chromatogr. A 2020, 1612, 460649. [Google Scholar] [CrossRef] [PubMed]
  52. Hawley, M.D.; Tatawawadi, S.V.; Piekarski, S.; Adams, R.N. Electrochemical Studies of the Oxidation Pathways of Catecholamines. J. Am. Chem. Soc. 1967, 89, 447–450. [Google Scholar] [CrossRef] [PubMed]
  53. Sochr, J.; Švorc, Ľ.; Rievaj, M.; Bustin, D. Electrochemical determination of adrenaline in human urine using a boron-doped diamond film electrode. Diam. Relat. Mater. 2014, 43, 5–11. [Google Scholar] [CrossRef]
  54. Wei, M.; Sun, L.-G.; Xie, Z.-Y.; Zhii, J.-F.; Fujishima, A.; Einaga, Y.; Fu, D.-G.; Wang, X.-M.; Gu, Z.-Z. Selective Determination of Dopamine on a Boron-Doped Diamond Electrode Modified with Gold Nanoparticle/Polyelectrolyte-coated Polystyrene Colloids. Adv. Funct. Mater. 2008, 18, 1414–1421. [Google Scholar] [CrossRef]
  55. Brycht, M.; Baluchová, S.; Taylor, A.; Mortet, V.; Sedláková, S.; Klimša, L.; Kopeček, J.; Schwarzová-Pecková, K. Comparison of electrochemical performance of various boron-doped diamond electrodes: Dopamine sensing in biomimicking media used for cell cultivation. Bioelectrochemistry 2021, 137, 107646. [Google Scholar] [CrossRef]
  56. Colleran, J.J.; Breslin, C.B. Simultaneous electrochemical detection of the catecholamines and ascorbic acid at PEDOT/S-β-CD modified gold electrodes. J. Electroanal. Chem. 2012, 667, 30–37. [Google Scholar] [CrossRef]
  57. Ferry, Y.; Leech, D. Amperometric Detection of Catecholamine Neurotransmitters Using Electrocatalytic Substrate Recycling at a Laccase Electrode. Electroanalysis 2005, 17, 113–119. [Google Scholar] [CrossRef]
  58. Benická, E.; Krupcík, J.; Lehotay, J.; Sandra, P.; Armstrong, D.W. Selectivity Tuning in an HPLC Multicomponent Separation. J. Liq. Chromatogr. Relat. Technol. 2005, 28, 1453–1471. [Google Scholar] [CrossRef]
  59. McCalley, D.V. Is hydrophilic interaction chromatography with silica columns a viable alternative to reversed-phase liquid chromatography for the analysis of ionisable compounds? J. Chromatogr. A 2007, 1171, 46–55. [Google Scholar] [CrossRef]
  60. Alvarez-Segura, T.; Subirats, X.; Rosés, M. Retention-pH profiles of acids and bases in hydrophilic interaction liquid chromatography. Anal. Chim. Acta 2019, 1050, 176–184. [Google Scholar] [CrossRef]
  61. Bicker, W.; Wu, J.; Yeman, H.; Albert, K.; Lindner, W. Retention and selectivity effects caused by bonding of a polar urea-type ligand to silica: A study on mixed-mode retention mechanisms and the pivotal role of solute-silanol interactions in the hydrophilic interaction chromatography elution mode. J. Chromatogr. A 2011, 1218, 882–895. [Google Scholar] [CrossRef] [PubMed]
  62. Xu, X.; Zhang, H.; Shi, H.; Ma, C.; Cong, B.; Kang, W. Determination of three major catecholamines in human urine by capillary zone electrophoresis with chemiluminescence detection. Anal. Biochem. 2012, 427, 10–17. [Google Scholar] [CrossRef]
  63. Bouri, M.; Lerma-García, M.J.; Salghi, R.; Zougagh, M.; Ríos, A. Selective extraction and determination of catecholamines in urine samples by using a dopamine magnetic molecularly imprinted polymer and capillary electrophoresis. Talanta 2012, 99, 897–903. [Google Scholar] [CrossRef] [PubMed]
  64. Whiting, M.J. Simultaneous measurement of urinary metanephrines and catecholamines by liquid chromatography with tandem mass spectrometric detection. Ann. Clin. Biochem. 2009, 46, 129–136. [Google Scholar] [CrossRef]
  65. Zhang, L.; Yang, J.-q.; Luo, Y.; Shang, J.-c.; Jiang, X.-h. Simultaneous determination of eleven compounds related to metabolism of bioamines in rat cortex and hippocampus by HPLC-ECD with boron-doped diamond working electrode. J. Pharm. Biomed. Anal. 2016, 118, 41–51. [Google Scholar] [CrossRef]
  66. Nikolajsen, R.P.H.; Hansen, Å.M. Analytical methods for determining urinary catecholamines in healthy subjects. Anal. Chim. Acta 2001, 449, 1–15. [Google Scholar] [CrossRef]
  67. Thomas, D.H.; Taylor, J.D.; Barnaby, O.S.; Hage, D.S. Determination of free catecholamines in urine by tandem affinity/ion-pair chromatography and flow injection analysis. Clin. Chim. Acta 2008, 398, 63–69. [Google Scholar] [CrossRef] [Green Version]
  68. Wu, A.H.; Gornet, T.G. Preparation of urine samples for liquid-chromatographic determination of catecholamines: Bonded-phase phenylboronic acid, cation-exchange resin, and alumina adsorbents compared. Clin. Chem. 1985, 31, 298–302. [Google Scholar] [CrossRef]
  69. Bicker, J.; Fortuna, A.; Alves, G.; Falcão, A. Liquid chromatographic methods for the quantification of catecholamines and their metabolites in several biological samples—A review. Anal. Chim. Acta 2013, 768, 12–34. [Google Scholar] [CrossRef]
  70. Chou, D. Clinical Guide to Laboratory Tests. JAMA 1984, 251, 2587–2588. [Google Scholar] [CrossRef]
  71. Shen, Y.; Cheng, L. Biochemical Diagnosis of Pheochromocytoma and Paraganglioma. In Paraganglioma: A Multidisciplinary Approach; Mariani-Costantini, R., Ed.; Codon Publications: Brisbane, Australia, 2019. [Google Scholar]
  72. Patel, D.; Phay, J.E.; Yen, T.W.F.; Dickson, P.V.; Wang, T.S.; Garcia, R.; Yang, A.D.; Solórzano, C.C.; Kim, L.T. Update on Pheochromocytoma and Paraganglioma from the SSO Endocrine/Head and Neck Disease-Site Work Group. Part 1 of 2: Advances in Pathogenesis and Diagnosis of Pheochromocytoma and Paraganglioma. Ann. Surg. Oncol. 2020, 27, 1329–1337. [Google Scholar] [CrossRef] [PubMed]
Scheme 1. Electrochemical oxidation of CAs.
Separations 08 00124 sch001
Figure 1. Cyclic voltammograms of CAs in the absence (red line) and presence (black lines) of 100 µM each (A) DA, (B) EPI, and (C) NE on the bare BDD electrode vs. Ag/AgCl. Background electrolytes consist of 10 mM of ammonium formate at pH 3.0 in 85% ACN with a scan rate of 100 mV/s.
Separations 08 00124 g001
Figure 2. Chromatograms of mixture of 500 μM each of DA, EPI, and NE. Mobile phase: ACN: 10 mM ammonium formate pH 3 (85:15) (A) Poro-shell Z-HILIC (2.1 × 50 mm 2.7 µm); (B) fully porous Z-HILIC (2.1 × 50 mm 3.5 µm), and (C) fully porous Z-cHILIC (2.1 × 50 mm 3 µm), 1.5 mL/min flow rate, 1 μL injection volume, at 280 nm UV detection, and 23 °C.
Separations 08 00124 g002
Figure 3. The effect of the concentration of ACN on the retention time of a mixture of 500 μM each of 1. DA, 2. EPI, and 3. NE. Mobile phase: ACN: 10 mM ammonium formate pH 3 (A) 75:25, (B) 85:15, (C) 90:10, (D) a plot of % ACN versus k’. Column: Poro-shell Z-HILIC (2.1 × 50 mm, 2.7 μm), 0.5 mL/min flow rate, 5 μL injection volume, at 280 nm UV detection, and 23 °C.
Separations 08 00124 g003
Figure 4. Plot of the effect of applied potential (E) versus current (μA) for a mixture of 25 μM each of DA, EPI, and NE at the BDD electrode vs. Pd/H2. Mobile phase: 85:15, ACN: 10 mM ammonium formate pH 3. Column: Poro-shell Z-HILIC (2.1 × 50 mm, 2.7 μm), 1.5 mL/min flow rate, 5 μL injection volume, at 23 °C.
Separations 08 00124 g004
Figure 5. The HPLC-ECD BDD chromatogram of a urine sample, the black line is unspiked urine, and the red line is spiked urine with 3 µM each of DA, EPI, and NE. Mobile phase: 15: 85, 10 mM ammonium formate pH 3: ACN. Column: Poro-shell z-HILIC (2.1 × 50 mm, 2.7 μm), 1.5 mL/min flow rate, 5 μL injection volume, at 23 °C. detector: oxidation potential: +1.3 V on the BDD electrode vs. Pd/H2.
Separations 08 00124 g005
Table 1. The number of theoretical plates (efficiency) per m and RSD (%) for CAs using different columns.
HILIC ColumnsAnalyteN/mRSD (%)
Poro-Shell Z-HILICDA49,0400.98
EPI43,1320.91
NE44,1721.86
Fully Porous Z-cHILICDA23,0190.72
EPI23,8871.04
NE31,2471.36
Fully Porous Z-HILICDA18,3950.69
EPI16,9732.01
NE22,5982.27
Table 2. Selectivity (α) values and RSD (%) for CAs using different columns.
HILIC ColumnsAnalyteαRSD (%)
Poro-Shell Z-HILICDA& EPI1.300.572
EPI& NE1.390.187
Fully Porous Z-cHILICDA& EPI1.220.417
EPI& NE1.840.132
Fully Porous Z-HILICDA& EPI1.260.231
EPI& NE1.710.214
Table 3. The linear regression parameters of the calibration curves and LODs for the CA compounds.
AnalyteLinear Range (µM)Linear Regression EquationCorrelation Coefficient (R2)LOD a HPLC-ECD (nM)LOD b HPLC-UV (µM)
DA0.1–25y = 6 × 10⁻⁸ C − 4 × 10−90.994400.5
EPI0.1–25y = 5 × 10⁻⁸ C − 3 × 10−90.993500.7
NE0.1–25y = 4 × 10⁻⁸ C − 4 × 10−90.995501
a LOD (S/N = 3) at + 1.3 V. b LOD (S/N = 3) at 280 nm.
Table 4. Comparison between the LOD values of CAs in the present work with those reported in the literature.
TechniqueAnalytesSeparation TimeLODRef.
CE-CLDA
EPI
NE
6 min69 nM
79 nM
100 nM
[62]
MMIP-CEDA
EPI
NE
8 min60 nM
60 nM
50 nM
[63]
HPLC- fluorescence detectionDA
EPI
NE
40 min0.1 nM
0.4 nM
0.4 nM
[29]
RP-Amperometric detection (BDD electrode)DA
EPI
NE
9 min4 × 10−3 µg/mL (26 nM)
2 × 10⁻³ µg/mL (11 nM)
4 × 10⁻³ µg/mL (23 nM)
[65]
HPLC-MS-MSDA
EPI
NE
6 min5 nM
10 nM
10 nM
[64]
HILIC- Amperometric detection (BDD electrode)DA
EPI
NE
less than 1 min40 nM (7.5 × 10⁻³ µg/mL)
50 nM (10.6 × 10⁻³ µg/mL)
50 nM (10.2 × 10⁻³ µg/mL)
This work
Table 5. The RSD (%) Intra-day and inter-day data for CAs in LC-ECD.
AnalyteRSD a (%) Intra-DayRSD b (%) Inter-Day
DA0.420.65
EPI0.350.40
NE0.360.49
a RSD (%) Intra-day values calculated from three measurements within one experiment for the retention time at 25 µM of each standard. b RSD (%) Inter-day values calculated from three measurements within three different days for the retention time at 25 µM of each standard.
Table 6. Recovery results obtained for CAs after spiking human urine samples at different DA, EPI, and NE concentration levels.
AnalytesConcentration (nM) in Unspiked UrineConcentration (nM) AddedConcentration (nM) FoundRecovery %RSD %
DA1440600
1500
3000
1990
2800
4170
91.6
93
90.9
4.6
2.7
2.3
EPIND a250
500
1000
231
471
915
92.4
94
91.5
2.3
6
4
NE112400
800
1600
473
840
1550
90.3
91
90
1.4
2.7
2.4
ND a Not detected.
Table 7. The concentration of CAs in the unspiked urine samples (n = 6).
SampleDA (nM) ± SDEPI (nM) ± SDNE (nM) ± SD
11440 ± 1.44ND a112 ± 1.67
21793 ± 1.34ND a158 ± 2.67
ND a Not detected.
Publisher’s Note: MDPI stays neutral with regard to jurisdictional claims in published maps and institutional affiliations.

