Abstract
Efficient separation of pharmaceuticals and metabolites with the adequate resolution is a key factor in choosing the most suitable chromatographic method. For quality control, the analysis time is a key factor, especially in pharmacokinetic studies. High back pressure is considered as one of the most important factors in chromatography’s flow control, especially in UHPLC. The separation of the anti-hyperlipidemic mixtures was carried out using two columns: a column silica-based particle packed UHPLC and a monolithic column. The systematic suitability of the two columns was compared for the separation of Fenofibrate, its active metabolite, Fenofibric acid and Pravastatin using Atorvastatin as an internal standard. Separation on both columns was obtained using ethanol: buffer potassium dihydrogen orthophosphate pH = 3 (adjusted with orthophosphoric acid) (75:25 v/v) as mobile phase and flow rate 0.8 mL/min. The analytes’ peak detection was achieved by using a PDA detector at 287 nm, 214 nm, 236 nm, and 250 nm for Fenofibrate, Fenofibric acid, Pravastatin, and Atorvastatin, respectively. Reduction of back-pressure was achieved with the monolithic column, where the analytes could be completely separated in less than 1.5 min at a flow rate of 5 mL/min. The principles of Green Analytical Chemistry (GAC) were followed throughout the developed method using environmentally safe solvents.
1. Introduction
Nowadays, quality control laboratories are concerned with economical separation methods with shorter analysis times. From the 1960s until now, there have been many new approaches in chromatography to reduce run time without affecting separation efficacy and resolution [1]. Among them are ultra-high-performance liquid chromatography (UHPLC) and the use of monolithic columns. There have been several trials by scientists to decrease the particle size and change its shape [2]. However, this was accompanied by a dramatic increase in the backpressure. UHPLC is a rapid chromatographic method with a better resolution and economical use of mobile phases compared to HPLC. UHPLC achieves this by using a smaller column filled with smaller particles. Researchers in biochemistry, molecular biology, pharmacokinetics, and many other fields rely on UHPLC to separate various types of molecules such as proteins, metabolites, peptides, pharmaceutical compounds, and other chemicals from a mixture. Particle-filled UHPLC columns are made from a particulate material, normally silica. Fundamentally, small particles, when tightly packed in a stainless steel HPLC column, produce substantial resistance to the flow of the solvent/sample mixture as well as other drawbacks. The most important limitations of particle-filled columns are that the high flow resistance limits the ability to shorten the analysis time due to the high backpressure which can cause the column to clog especially with biological substrates. UHPLC particle-packed column can withstand pressure up to 100 MPa [3,4].
On the other hand, the highly porous silica rods with the revolutionary double pore structure of the monolithic HPLC columns help cut down the run time [5,6]. The two types of voids in the monolithic column are mesopores and macropores. Mesopores form the fine porous structure (130 Å) of the interior of the column and contribute to a great surface on which the adsorption of the compounds of interest can occur, where each macropore has an approximate diameter of 2 µm, and together they form a substantial pore size network through which the mobile phase can flow rapidly at low pressure, greatly reducing separation time [7]. Hjerten et al. introduced the first monolith, and it was introduced in the US Pharmacopoeia under L1 type materials [8,9].
Meanwhile, attention to the application of green chemistry principles has increased dramatically in recent years [10,11]. Most of the reported chromatographic methods use “environmentally toxic” solvents. The solvent used has a great influence on the greenness of the method. Therefore, ethanol was used as an organic solvent in this study being non-toxic and non-hazardous for the environment [12,13].
NEMI and analytical eco-scale have been used as evaluation tools to measure the greenness of the established method [14,15]. The established method was found to be a tremendous green analytical technique that could be used as an eco-friendly substitute for the reported methods.
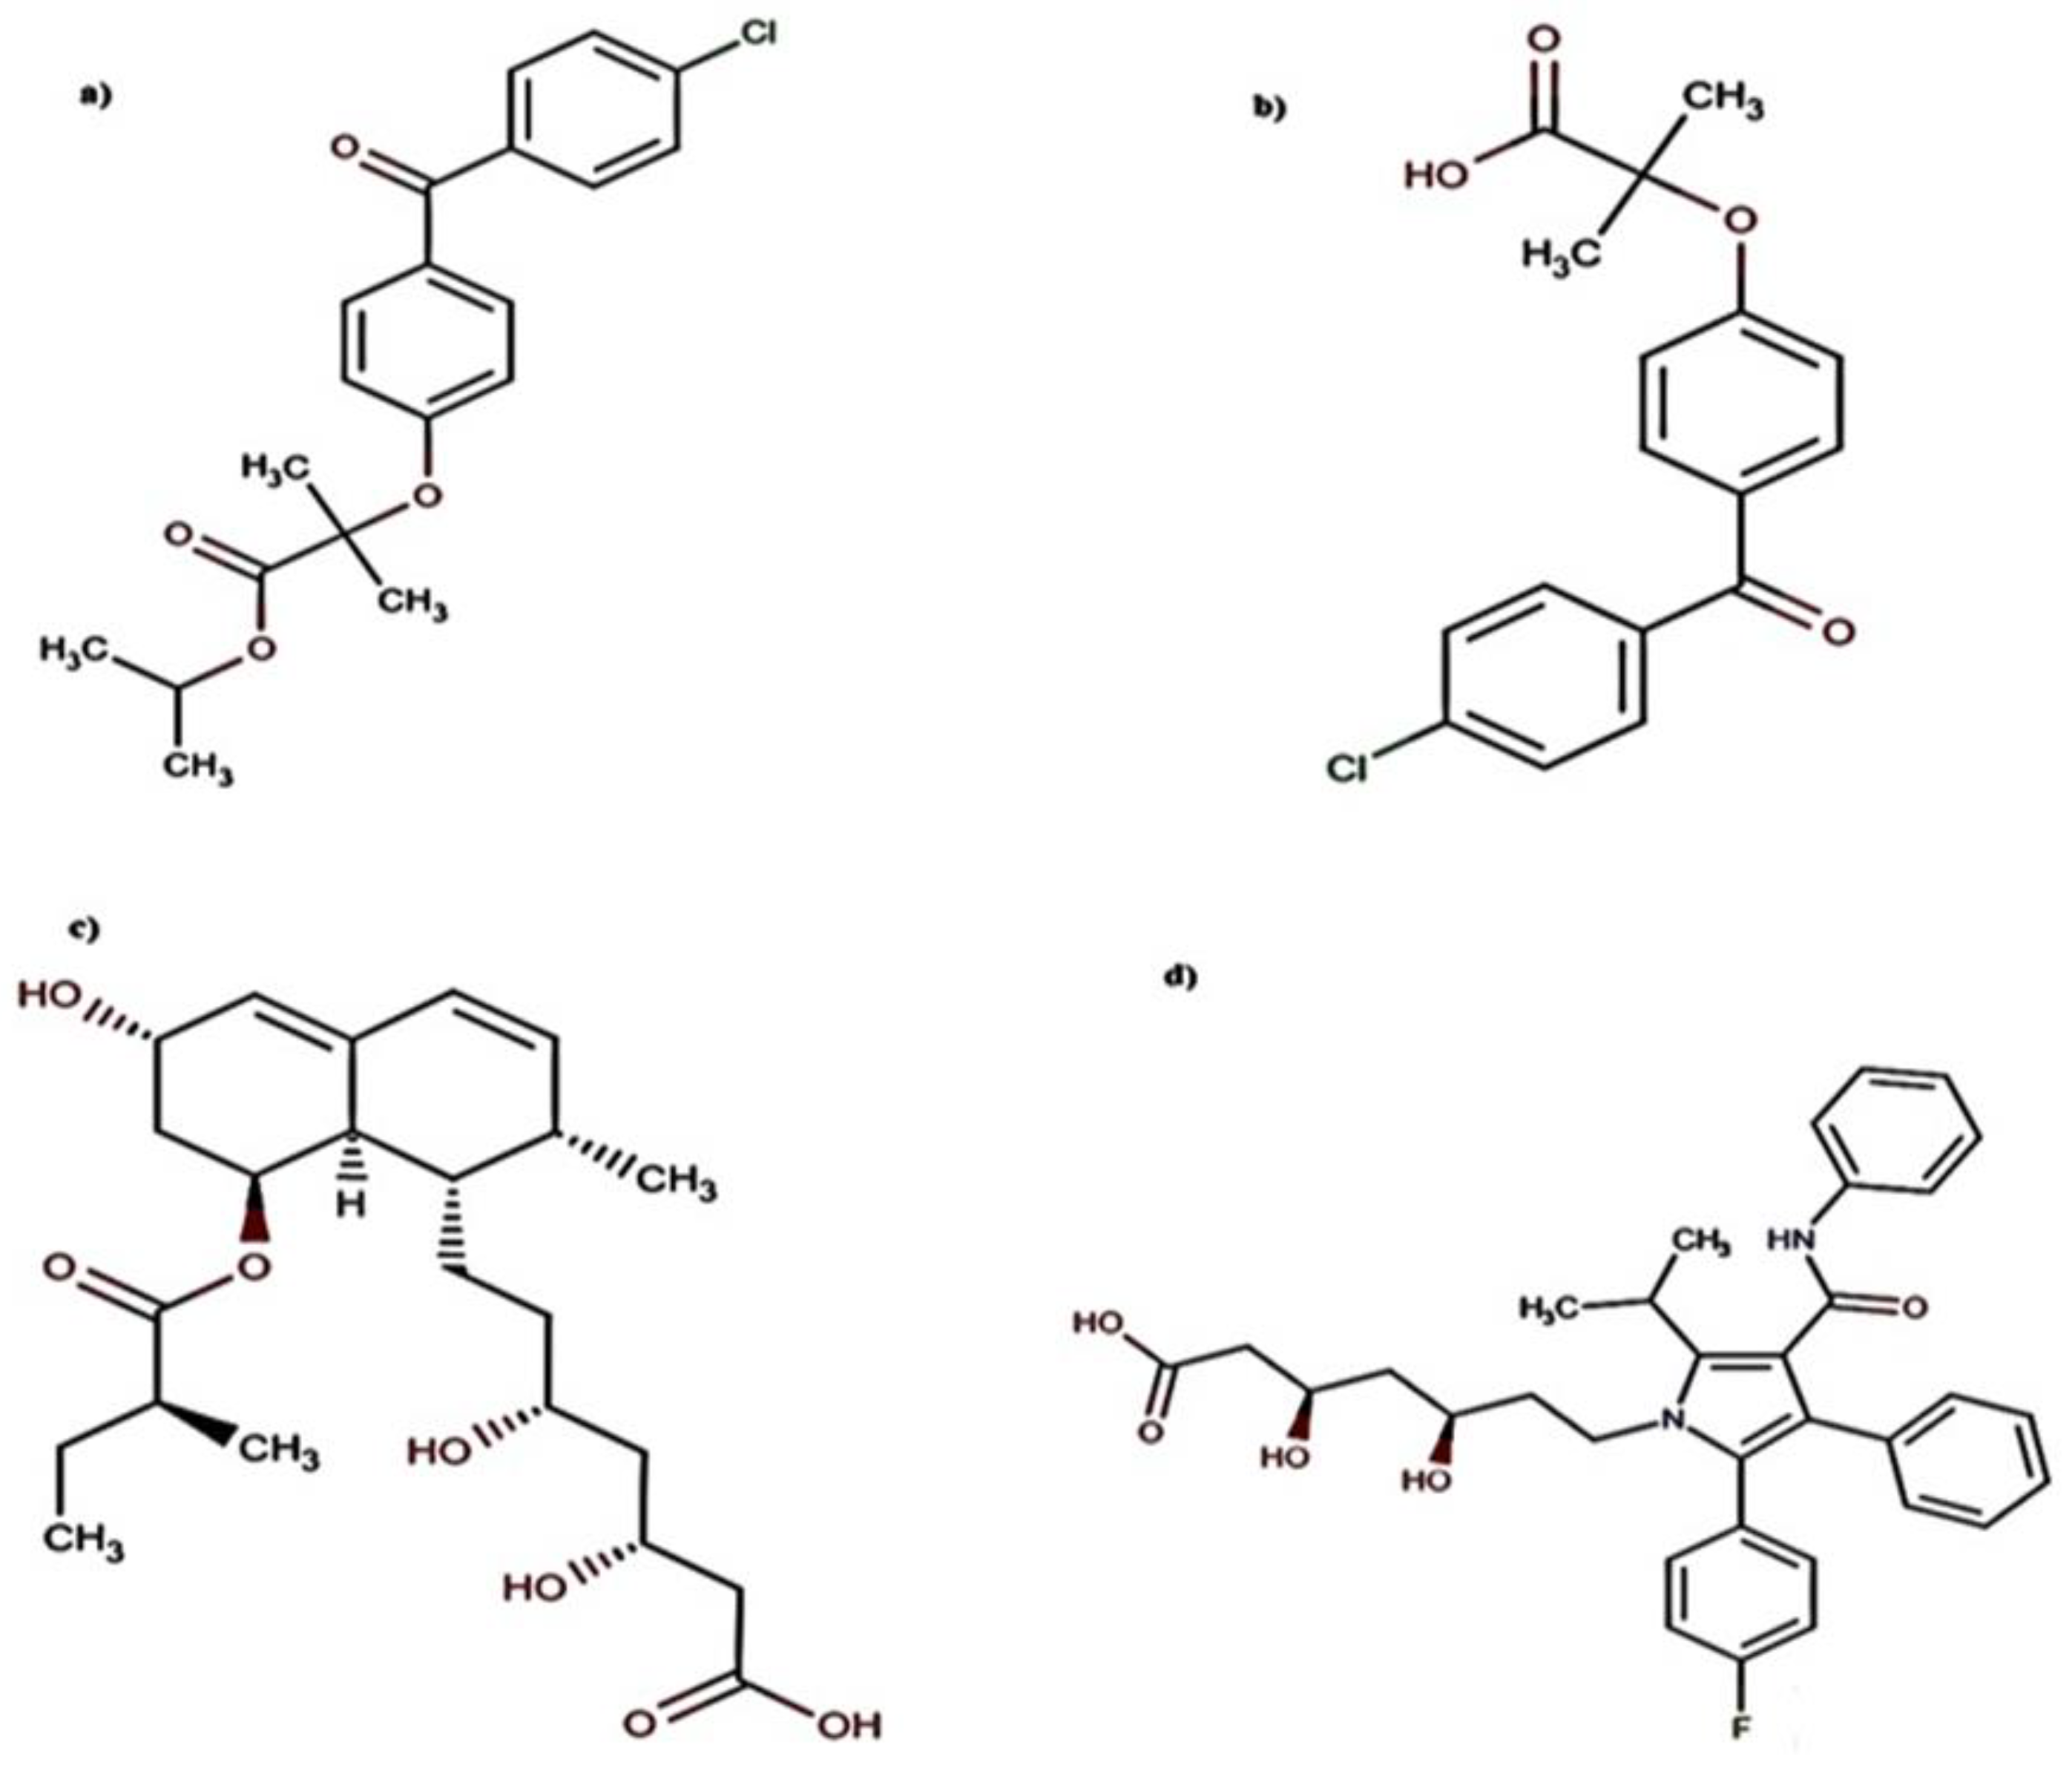
The purpose of the present study was to separate the components of an antihyperlipidemic pharmaceutical using UHPLC and monolithic columns and comparison of their performance. Pravafenix® was used as a model dosage form for this comparison. Pravafenix® is an antihyperlipidemic drug that contains the prodrug Fenofibrate and the HMG-CoA reductase inhibitor Pravastatin. The two components were separated and quantified in the presence of the active metabolite Fenofibric acid. Additionally, the analytes were separated by green solvents. The results of both columns were very competitive, with the monolithic column showing lower back pressure with higher flow rates.
There are several chromatographic and spectrophotometric methods in the literature for the separation of either fenofibrate and/or Pravastatin together or with other combinations [16,17,18]. However, no methods were found for the separation of the combination along with the active metabolite Fenofibric acid. Additionally, this work presents the first method for the separation of the mixture by monolithic column using Green Analytical Chemistry (GAC).
2. Materials and Methods
2.1. Material and Reagents
Fenofibrate, Fenofibric acid, Pravastatin, and Atorvastatin (IS) were purchased from Sigma-Aldrich. The purity of the standards was certified to be higher than 99.6%. Structures of the compounds are shown in Figure 1. Pravafenix® capsules labeled to contain 40 mg Pravastatin and 160 mg Fenofibrate (Sun Pharmaceutical Industries, Goregaon, Mumbai, India) were purchased from a Czech market. Ethanol, HPLC-grade, was purchased from Sigma-Aldrich, Germany. Potassium dihydrogen phosphate was provided by the Al-Nasr company for chemicals, Egypt.
Figure 1.
Chemical structures of (a) Fenofibrate, (b) Fenofibric acid, (c) Pravastatin sodium, and (d) Atorvastatin.
2.2. Instrument
The separation was performed using a chromatographic system Schimadzu LC-2040C 3D PLUS Nexera–i coupled with triple quadrupole MS 8040 (Japan) equipped with Photodiode array (PDA) detector (LC-2030/2040 PDA), LC-2040 pump, and 4-line degasser. The separation was accomplished using two types of columns: a Shim-pack GISS C18 (3 × 50 mm, 3µ) analytical column, and a Chromolith® C18 (3 × 50 mm). Data acquisition was performed with LabSolutions software.
2.3. Procedures
2.3.1. Chromatographic Conditions
Two types of columns were used for separation: a Shim-pack GISS C18 (3 × 50 mm, 3µ) analytical column and a Chromolith® C18 (3 × 50 mm).
The mobile phase was composed of ethanol: potassium di-hydrogen ortho-phosphate buffer pH = 3 (adjusted with o-phosphoric acid) (75:25 v/v). The detection of the analytes’ peaks was achieved using PDA detector at 287 nm, 214 nm, 236 nm, and 250 nm for Fenofibrate, Fenofibric acid, Pravastatin, and Atorvastatin, respectively. The flow rate was set at 0.8 mL/min.
2.3.2. Standard Solutions
Fenofibrate, Fenofibric acid, Pravastatin, and Atorvastatin (IS) stock solutions (1.0 mg/mL) were made separately by dissolving 100 mg in a small amount of ethanol and making up to the mark with distilled water. Distilled water was used to dilute stock solutions to prepare working standard solutions (100 µg/mL).
2.3.3. Validation
Linearity
Calculated volumes from the standard solutions of the analytes were transferred separately to 10-mL volumetric flasks. The volume was finalized to the mark with the mobile phase. The calibration standards of the analytes covered the Range of 1–80 μg/mL for the UHPLC column and 0.1–60 μg/mL for the Monolithic column. Each concentration was chromatographed three times, and the mean relative peak area of each analyte was plotted against concentration.
Accuracy
Various concentrations of each analyte were injected into the UHPLC to indicate the accuracy of the method. Regression equations were used to obtain the concentration and the recovery of each analyte.
Precision Repeatability
Relative standard deviations were calculated by injecting three concentrations of each analyte three times within the same day using the same experimental conditions.
Intermediate Precision
Relative standard deviations were calculated by injecting three concentrations of individual analyte three times in three consecutive days using the same experimental conditions.
Limit of Quantitation (LOQ) and Limit of Detection (LOD)
According to ICH recommendations, several methods can be used to determine the limit of quantitation and detection are possible. The indication of the signal-to-noise ratio was achieved by comparing measured signals from samples with known low concentrations of analyte with those of blank samples and developing the minimum concentration at which the analyte can be precisely and accurately detected. A signal-to-noise ratio of 3:1 is generally considered acceptable for estimating the detection limit, where a ratio of 10:1 is used to measure the quantitation limit.
2.3.4. Application to Pharmaceutical Formulation
Pravafenix® (composed of 40 mg Pravastatin and 160 mg Fenofibrate per capsule) was determined after mixing the contents of ten capsules. The extraction solvent was ethanol, where 50 mL was added, stirred for ten min and filtered through 0.5 µm Whatman filter paper. The filter paper was rinsed three times with ethanol to guarantee the extraction of the analytes. Then, to approach the linearity range, dilutions were made. The sample was injected using the same experimental conditions mentioned above to determine the drug content in each capsule.
3. Results and Discussion
The key goal of this study was to fully separate an antihyperlipidemic combination using two columns, a particle-packed UHPLC column, and a monolithic column, with the aid of green solvents. The performance of both columns was compared. The resolution of the analytes on both columns was performed by applying Green Analytical Chemistry (GAC) principles. Using substitute solvents that are non-toxic to the environment, shortening the analysis time, and obtaining accurate and precise analytical results are important characteristics of green analytical chemistry principles. It should be noted that MeOH and ACN are classified as hazardous solvents by the US Environmental Protection Agency (EPA) due to their inherent toxicity and the huge importance of the safe decontamination of their waste [19]. According to P.C. Sadek [12], ethanol is an important substitute for methanol and acetonitrile. Therefore, ethanol was used as an extraction solvent and organic regulator in the mobile phase. In addition, one of the principles of the GAC is to shorten the time between the start of the analysis and the obtaining of a reliable analytical result, and this was achieved by using the adopted conditions, which allowed rapid separation of the analytes in a short time [20].
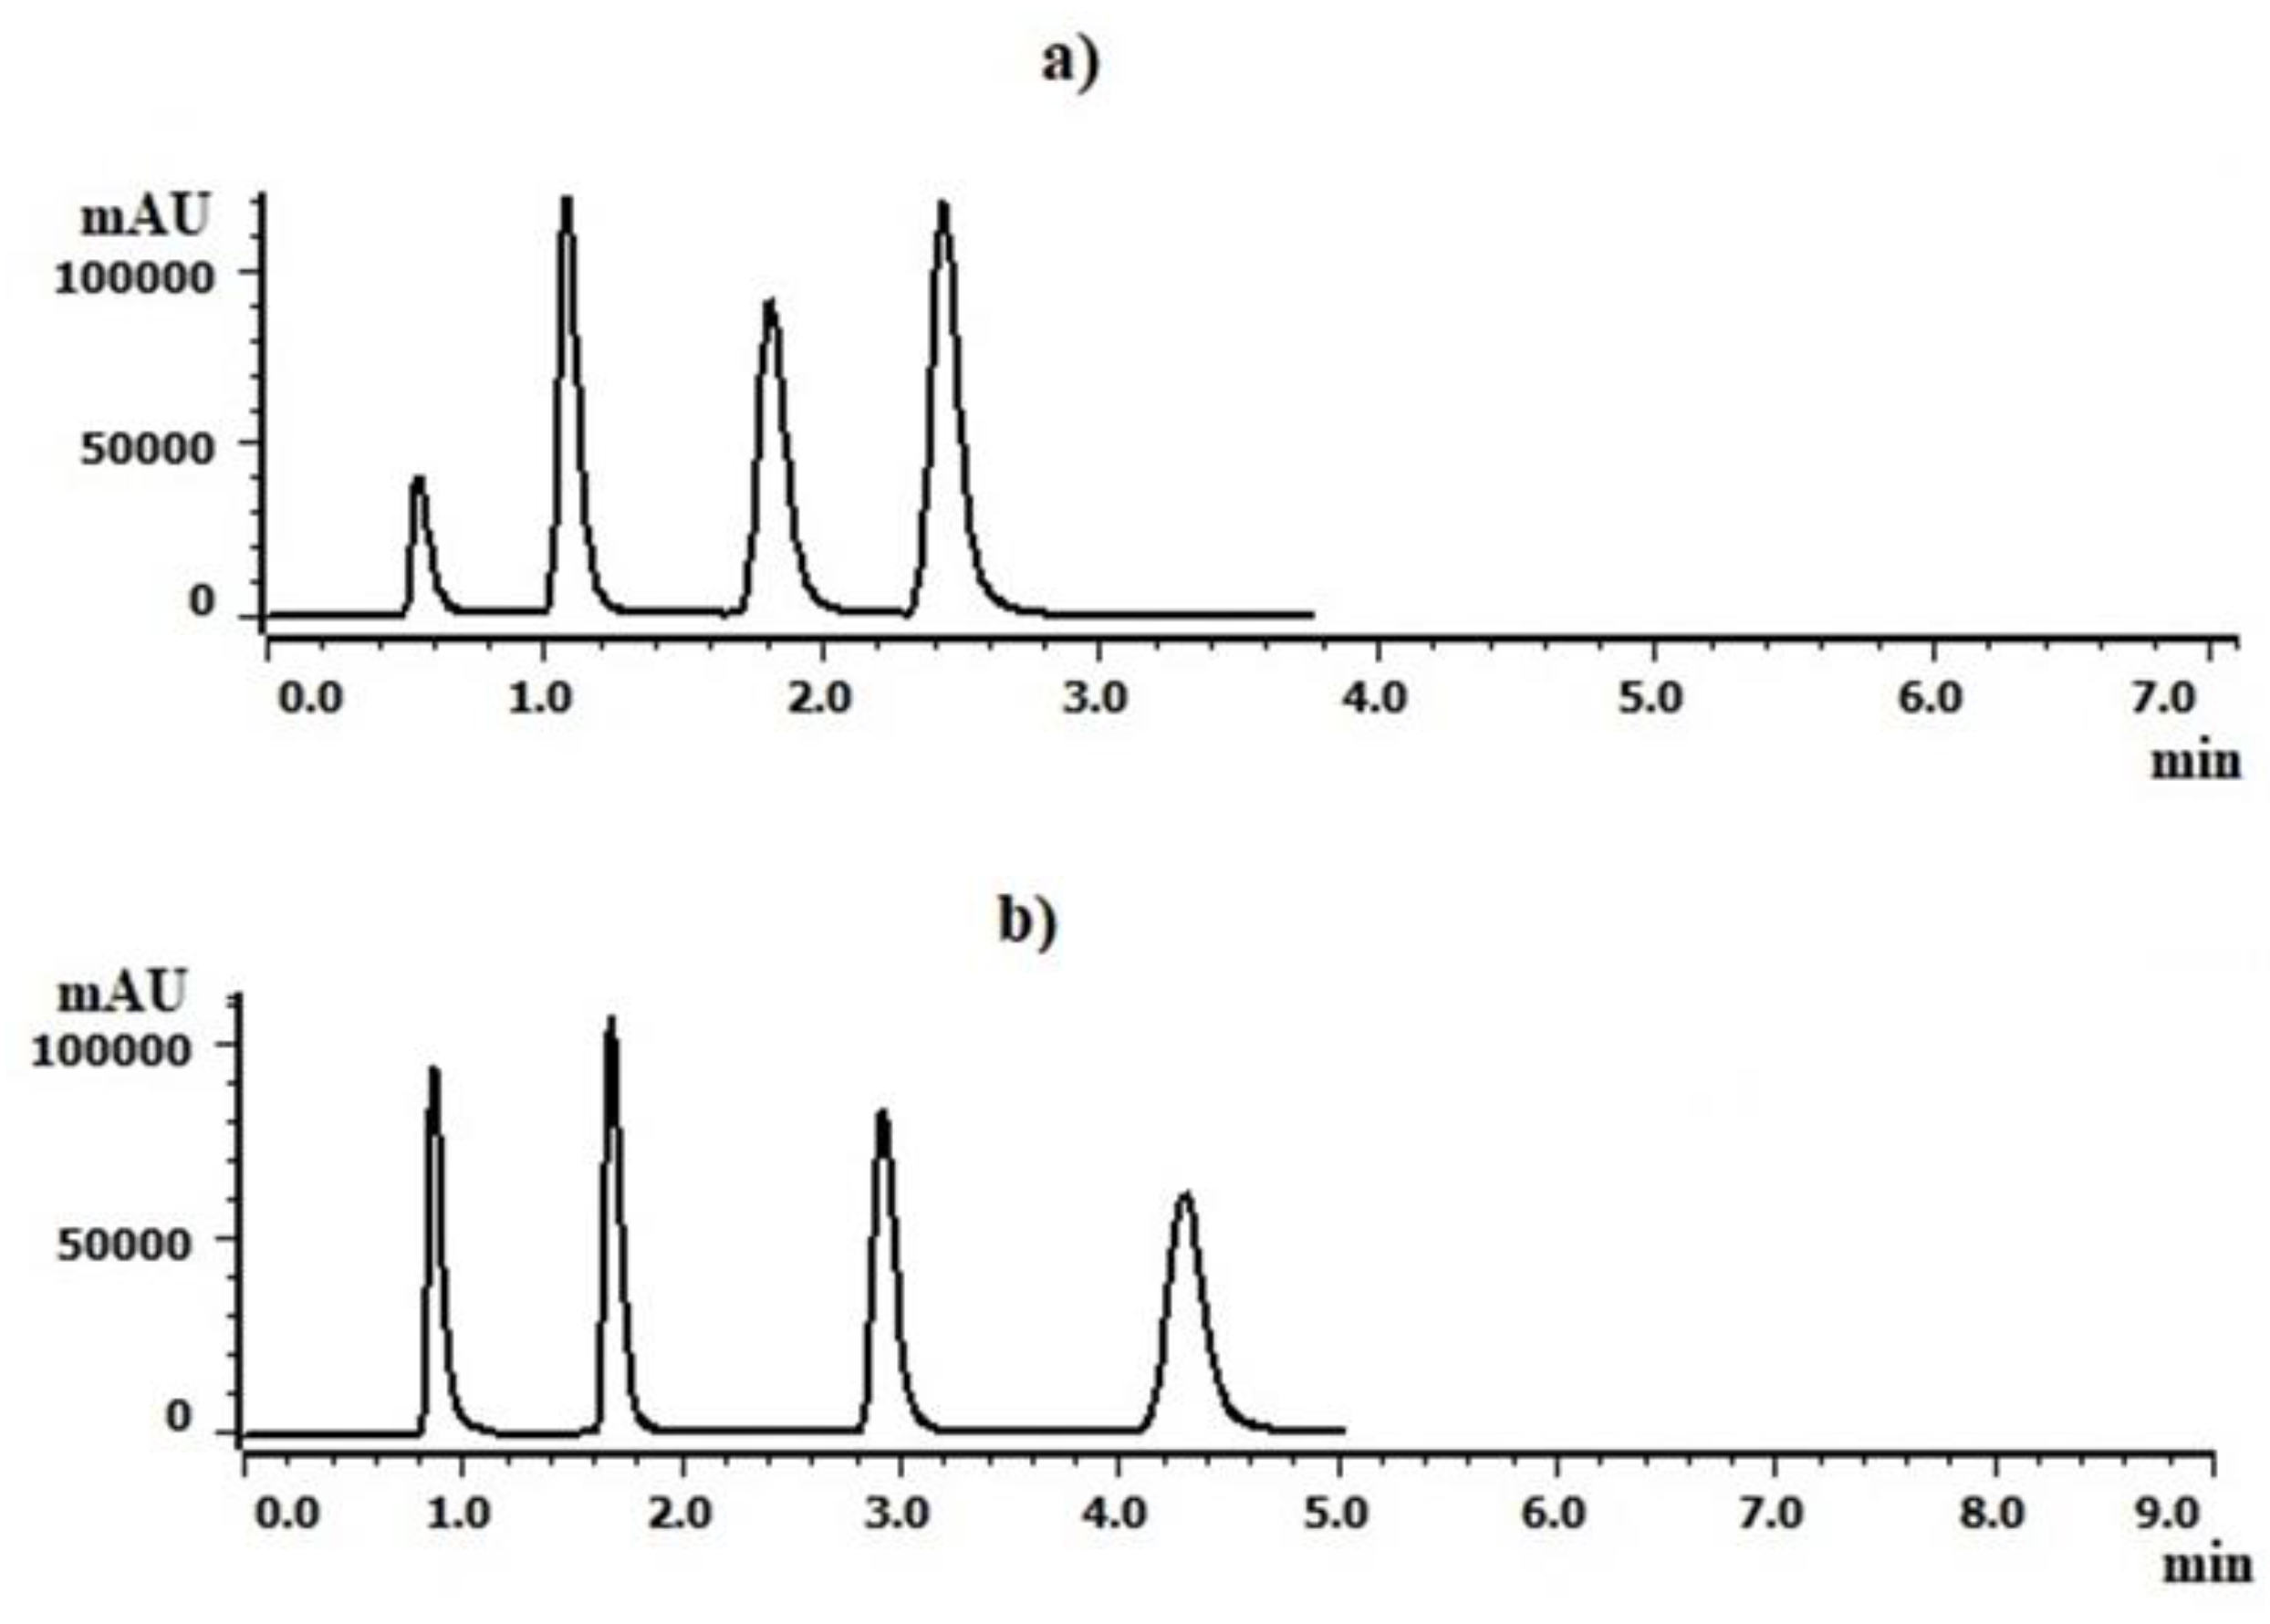
The developed method uses the green solvent to separate all analytes with perfect accuracy and resolution in two chromatographic columns with a flow rate of 0.8 mL/min, as shown in Figure 2. The particle-packed UHPLC column separates the analytes within approximately 3 running minutes with a back pressure of 30 MPa. The monolithic column can separate the mixture with a back pressure of 10 MPa in 4.5 min of running time. All chromatographic data of the two columns are compared and listed in Table 1. The table shows that the monolithic column has advantages with concerning theoretical plate number, HETP, and resolution. Furthermore, to separate the analytes in a shorter run time, different flow rates were tested on the two chromatographic columns.
Figure 2.
Complete resolution of (a) Fenofibrate, (b) Fenofibric acid, (c) Pravastatin sodium, and (d) Atorvastatin by the proposed UHPLC method at flow rate 0.8 mL/min on the UHPLC column (a) and the monolithic column (b).
Table 1.
Chromatographic specifications by the use of monolithic and particle-packed columns.
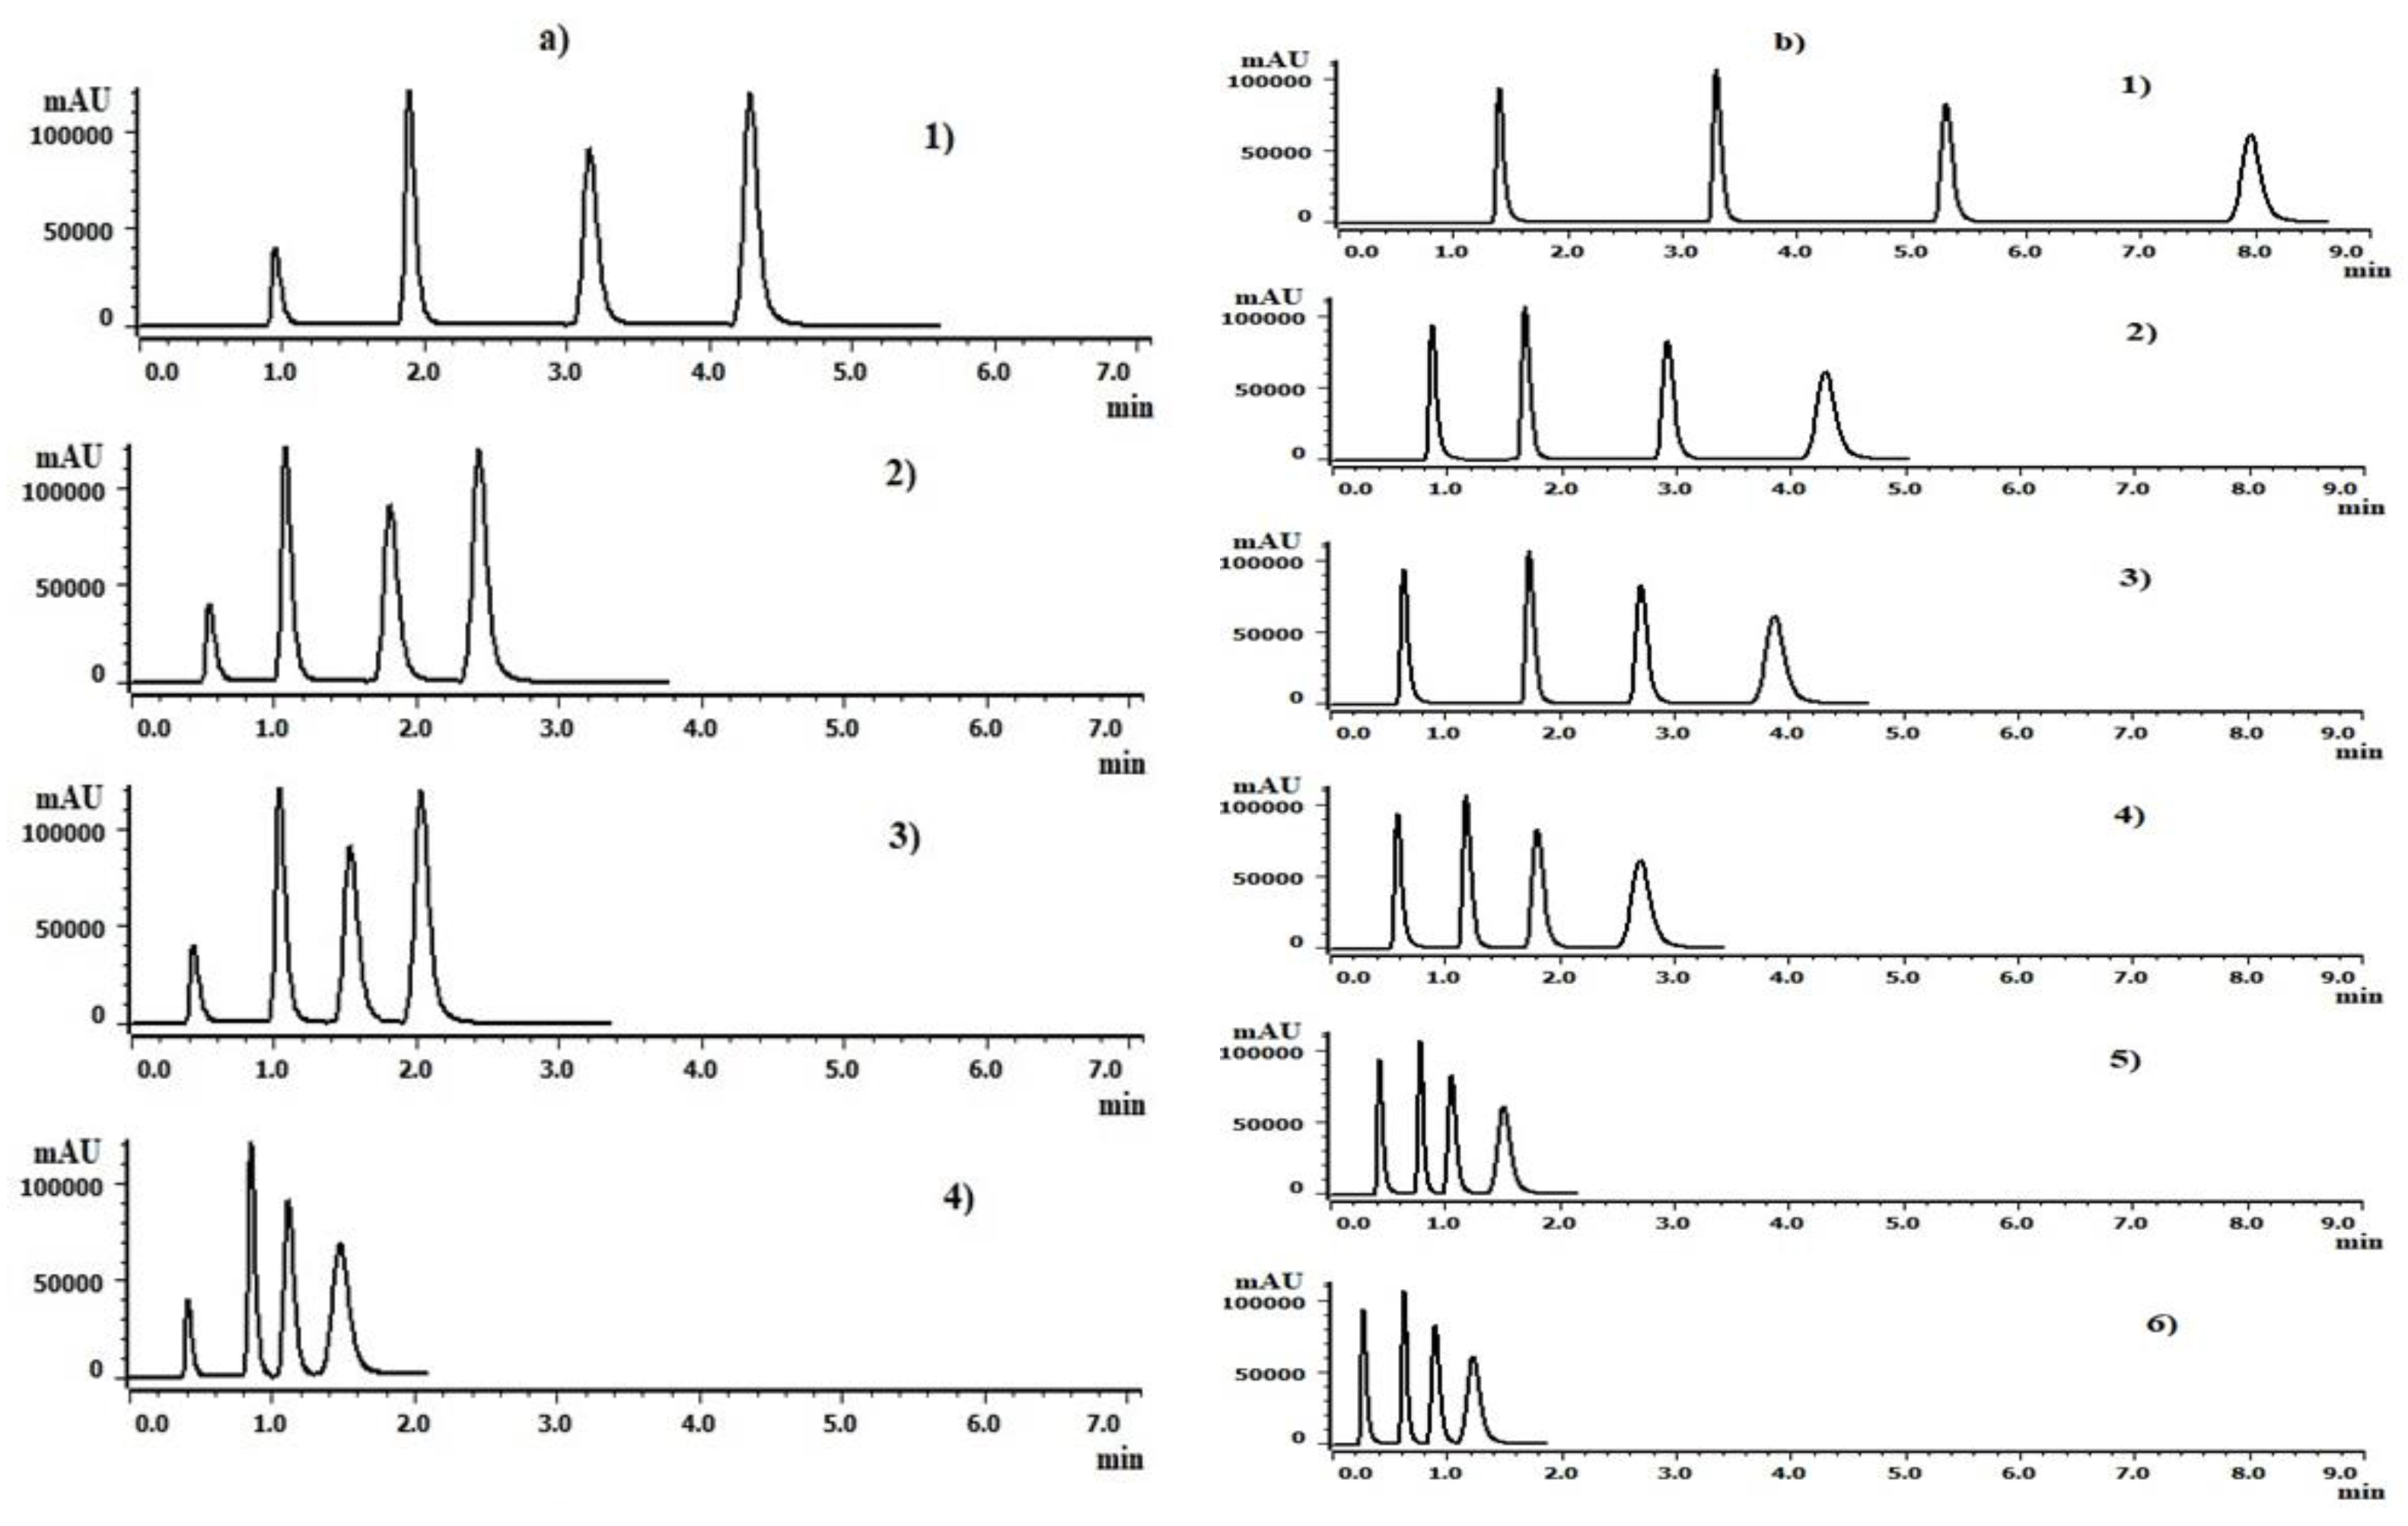
On account of the high porosity of the monolithic column, the high flow rate was applied without high backpressure, so the separation was performed in a short run time, as shown in Table 2 and 
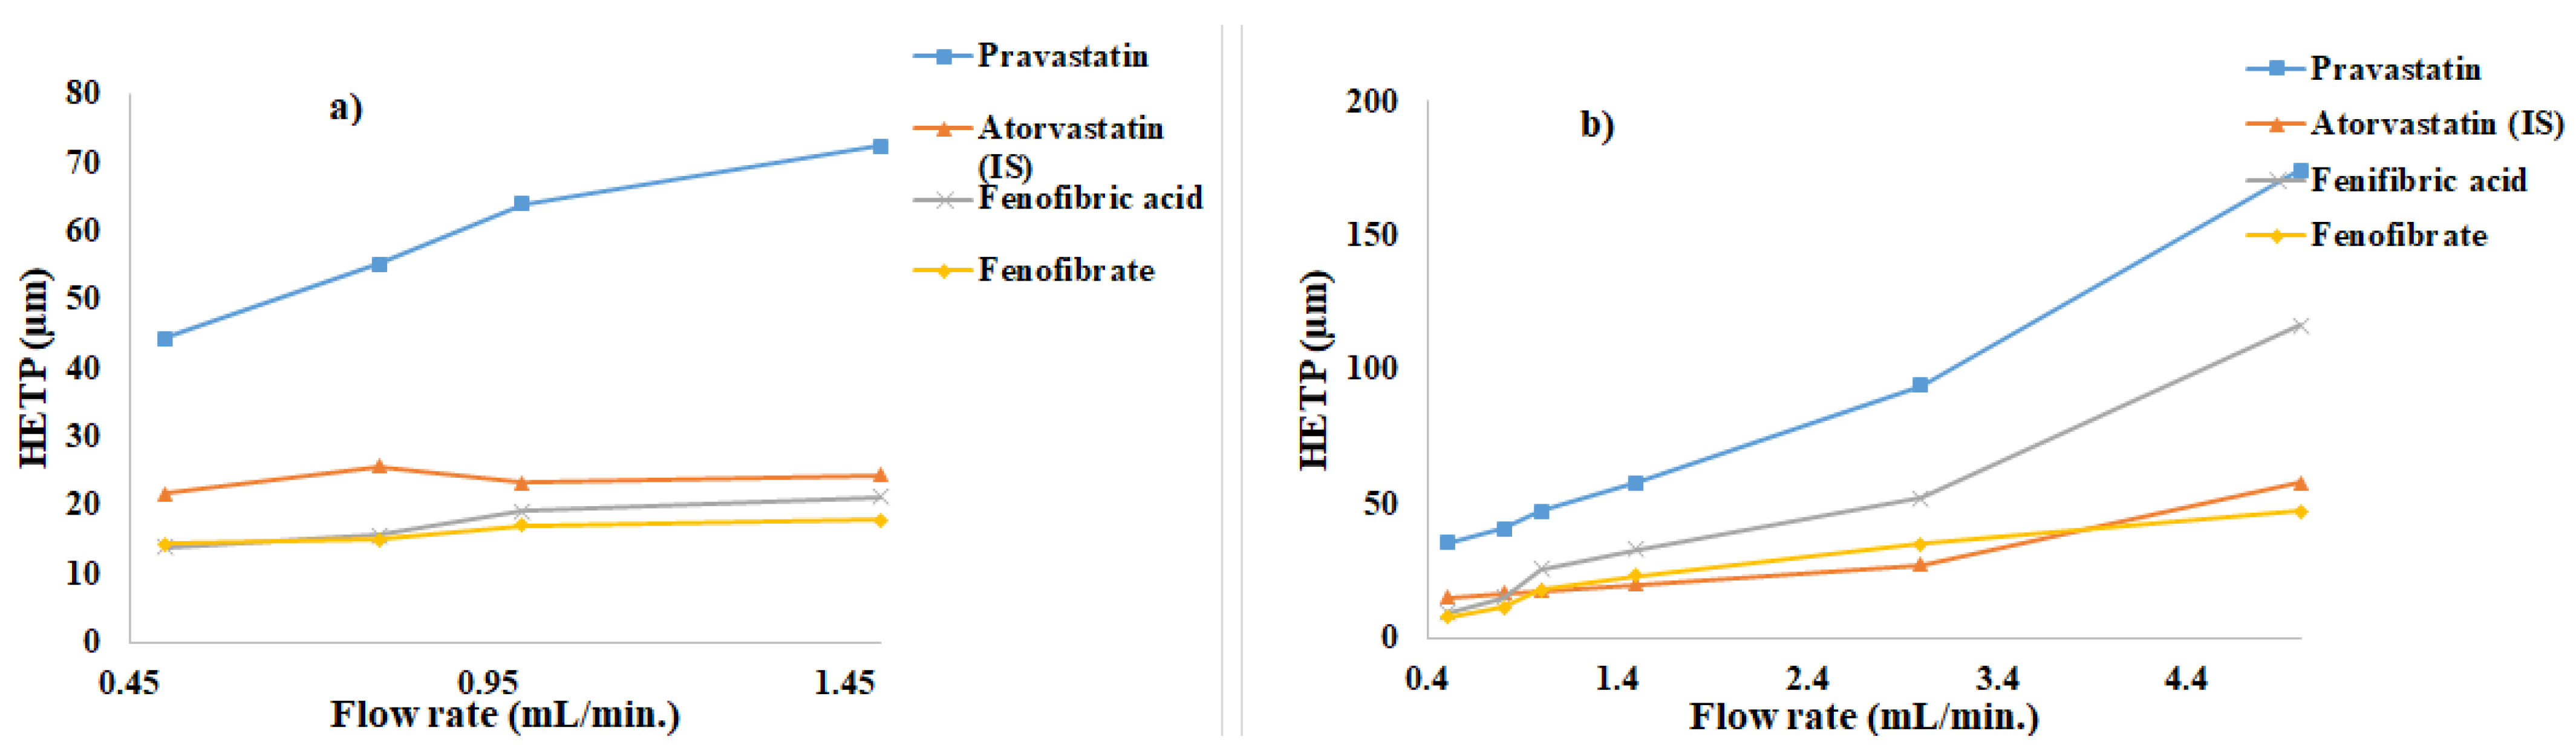
Figure 3. Van Deemter was used to compare the effects of different flow rates on the HETP of the two chromatographic columns, as shown in 
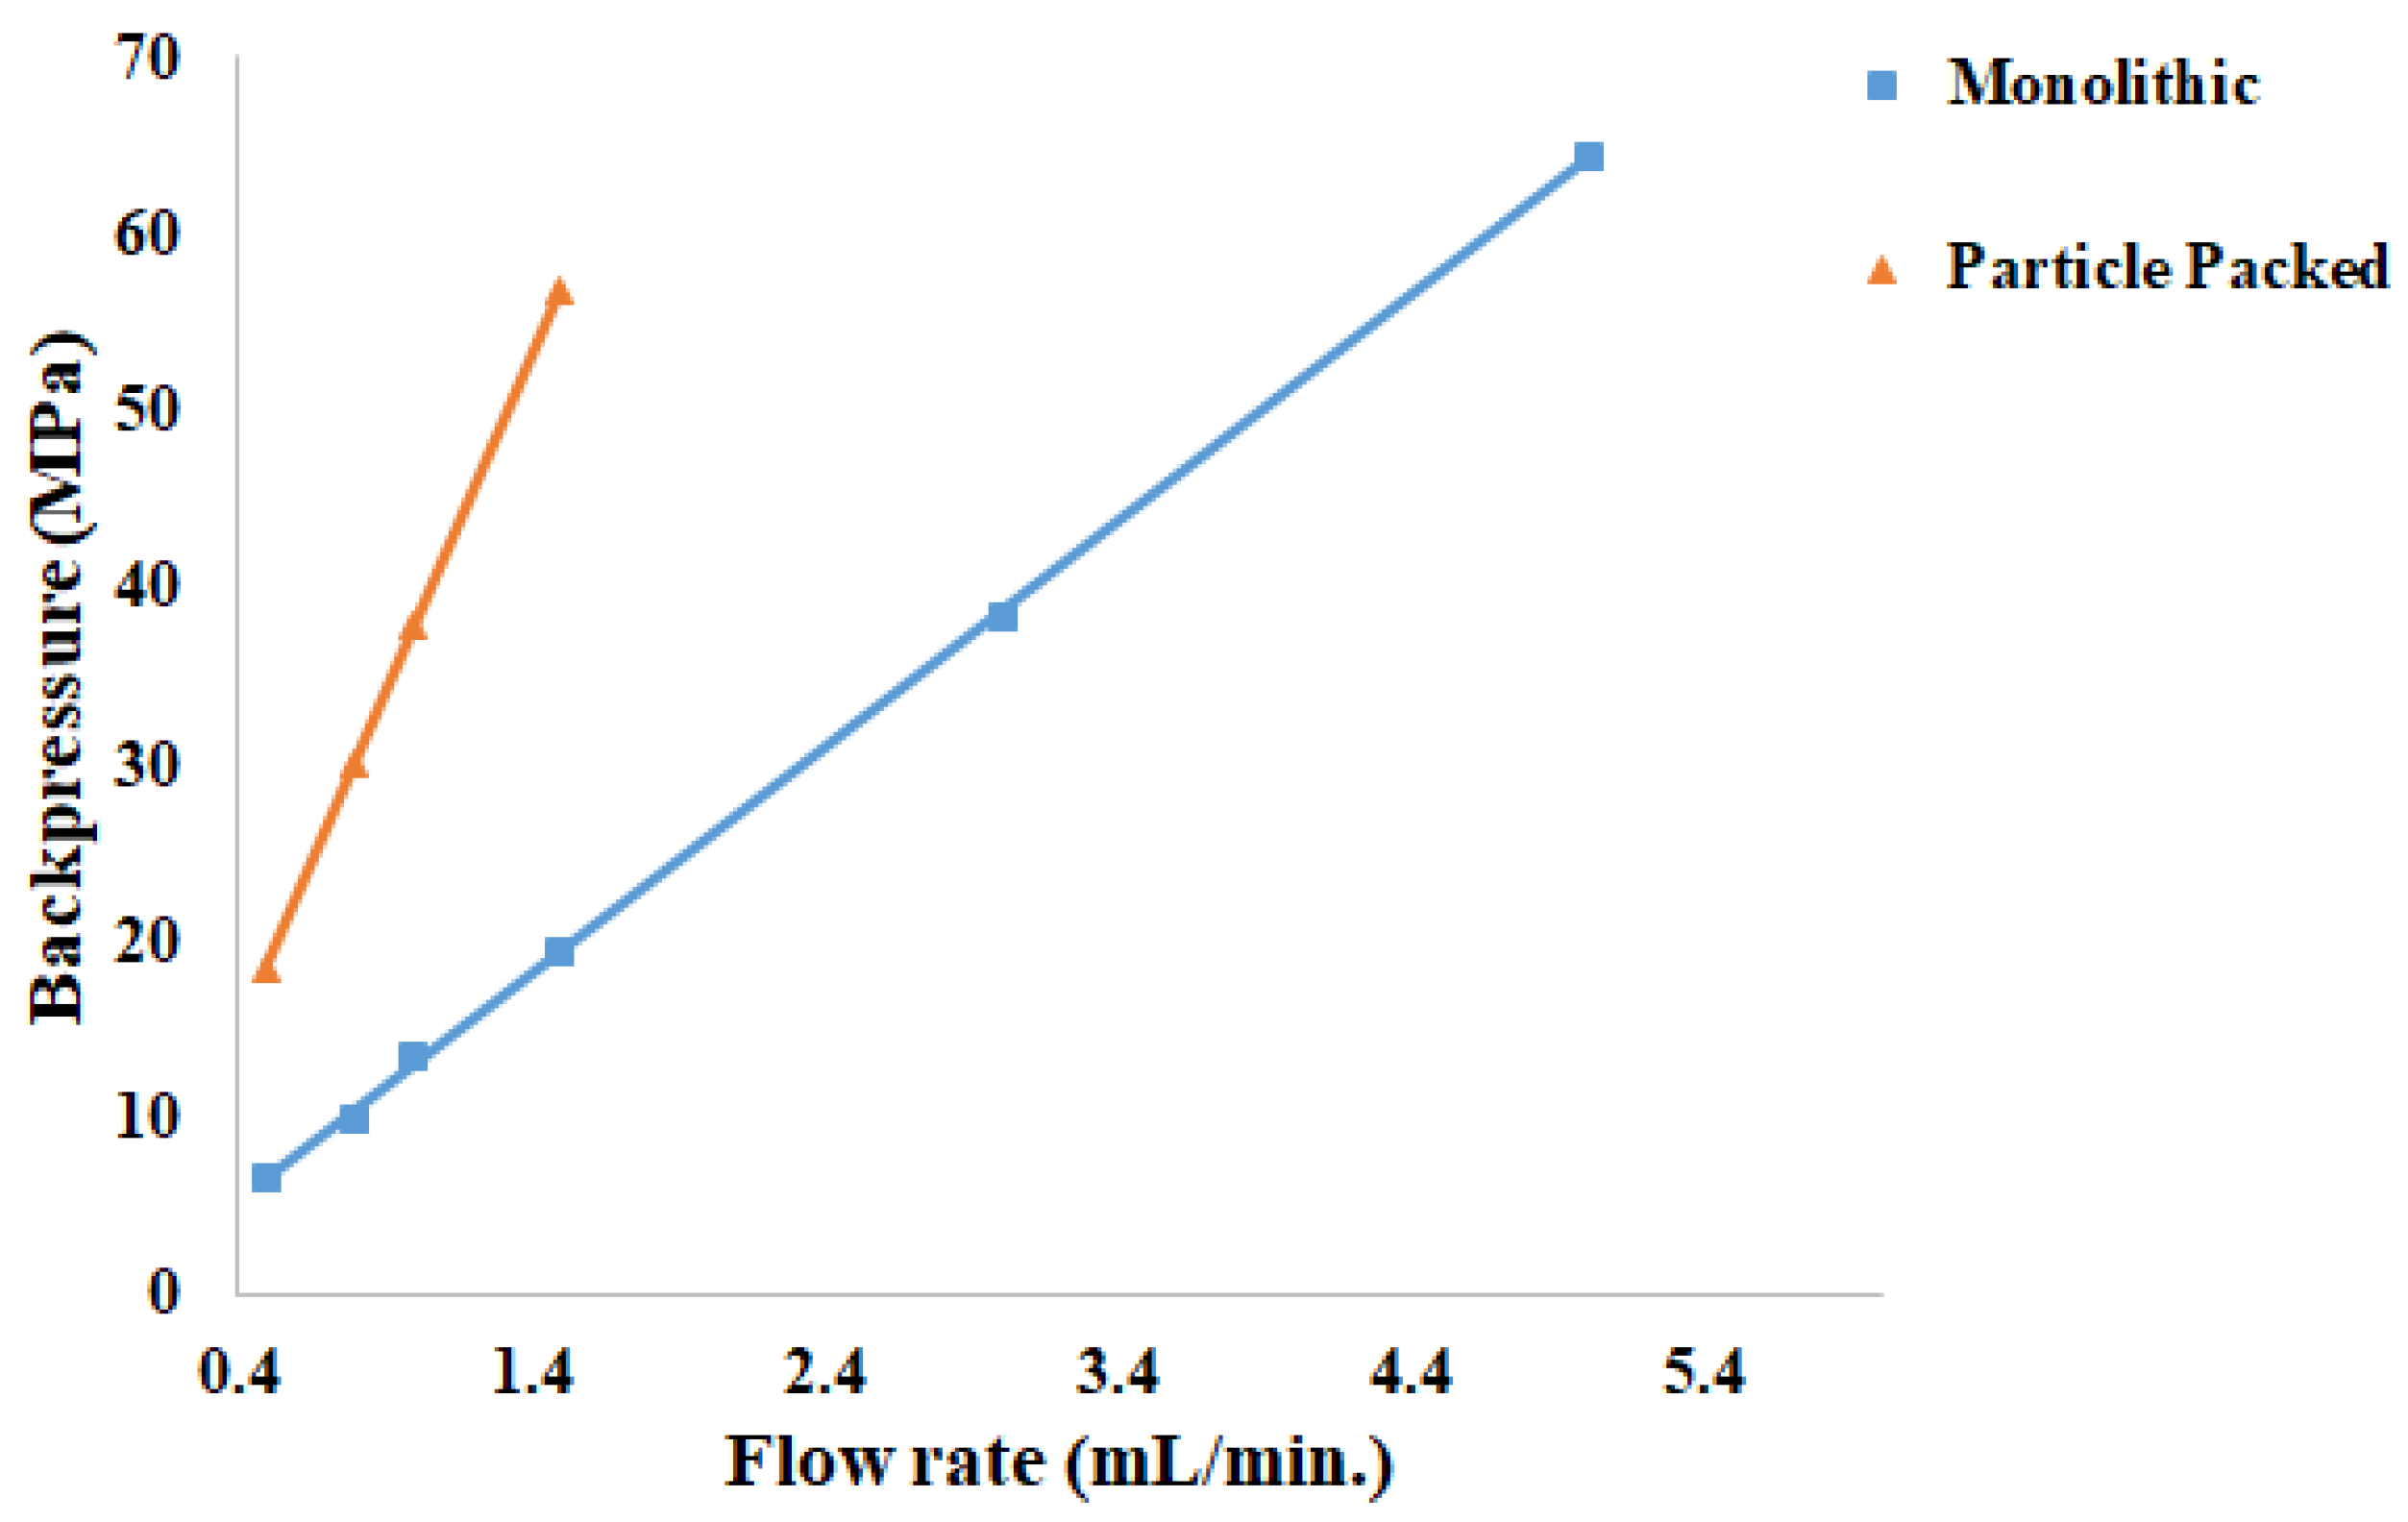
Figure 4. Furthermore, the effect of various flow rates on the backpressure was also reported. The high flow rate increases the backpressure of the particle packed column, and a flow rate of 2 mL/min led to overpressure, and the instrument stopped working. Figure 5 shows the effect of a large flow rate on the backpressure of the two columns. Since there are two kinds of pores, flow pores, and mesopores, high flow rates can be applied in monolithic columns. The permeability of the monolith is due to the large flow pores, which permit the separation of analytes at large flow rates with minimal backpressure. The inner pores of the particle-packed column correspond to the mesopores in the monolithic column. Therefore, in comparison with a particle packed column with similar efficiency, rapid separation can be achieved at a high flow rate of the mobile phase and moderate back-pressure.
Table 2.
The influence of flow rates on the backpressure of the instrument.
Figure 3.
Chromatograms of separation of the compounds by (a) UHPLC column with flow rates (1) 0.5 mL/min, (2) 0.8 mL/min, (3) 1 mL/min, (4) 1.5 mL/min, and (b) monolithic column with flow rates (1) 0.5 mL/min, (2) 0.8 mL/min, (3) 1 mL/min, (4) 1.5 mL/min, (5) 3 mL/min, and (6) 5 mL/min.
Figure 4.
Van Deemter plot of the Height Equivalent to Theoretical Plates versus flow rate of (a) UHPLC column and (b) monolithic column for separation of the tested compounds.
Figure 5.
The influence of various flow rates on the back-pressure of monolithic and particle-packed columns.
From the Van Deemter diagram, it can be seen that the separation efficiency in the monolithic column decreases as the flow rate increases, while in the UHPLC column, the reduction in the separation efficiency only occurs in Pravastatin, while for the other compounds, the separation efficiency was almost the same. Although the separation efficiency in the UHPLC column was stable at different flow rates, the backpressure increases sharply as the flow rate increases. Therefore, the monolithic column is more convenient, because it allows the resolution of compounds at high flow rates, thus shortening the analysis time.
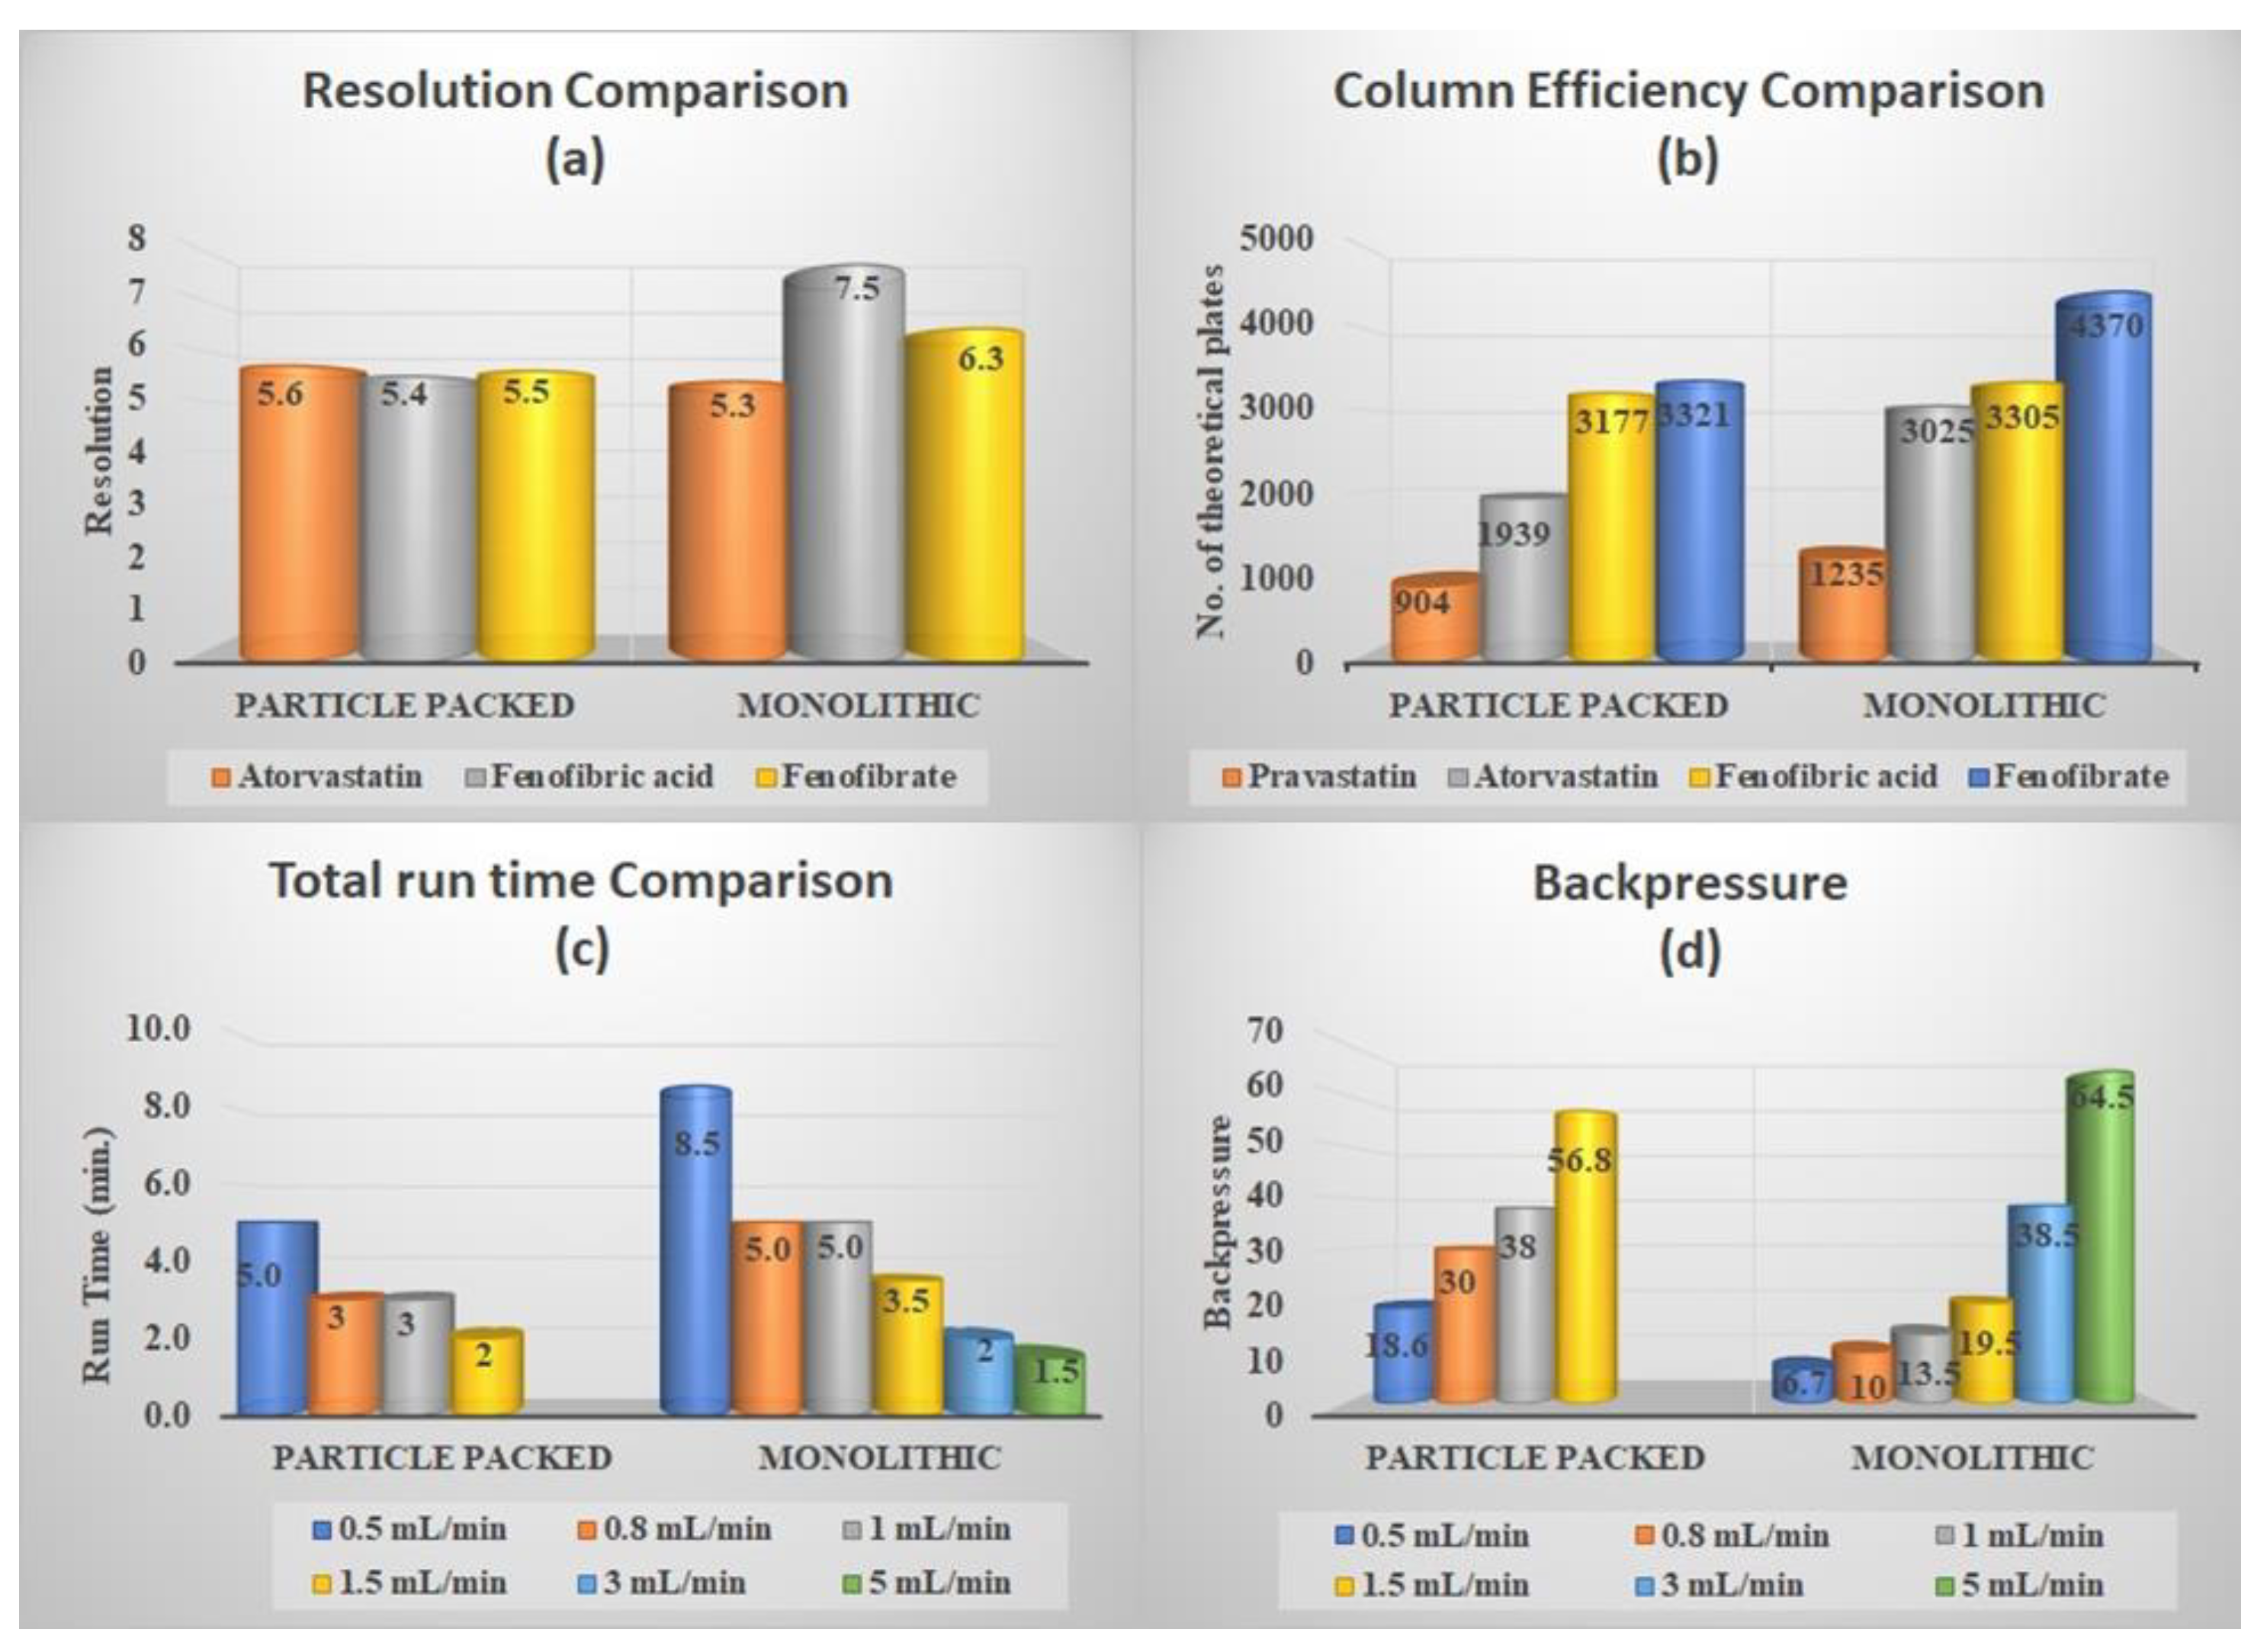
Although both columns can separate the studied drugs with an acceptable resolution, comparisons of the different system suitability parameters show significant differences. As shown in Figure 6, comparisons are made with respect to resolution, column efficiency, backpressure, and total analysis time. In terms of resolution, column efficiency, and backpressure, the monolithic column shows better results than the UHPLC column. However, at the same flow rate, the particle-packed UHPLC column showed better results in terms of method run time.
Figure 6.
Comparison between the used columns in terms of (a) resolution, (b) column efficiency, (c) total run time, and (d) backpressure.
3.1. Validation
The validation of the developed method was achieved in accordance per ICH guidelines, as shown in Table 3 [21].
Table 3.
Validation specifications and an assay of pharmaceutical formulation by the proposed methods.
Determination of the analytes’ concentration if the marketed dosage form was performed, and the results attained were within the accepted limits, as shown in Table 3.
3.2. Greenness Assessment
The greenness assessment was performed using two GAC evaluation tools:
3.2.1. National Environmental Methods Index Labeling
In the established methods, phosphate buffer pH 3 and ethanol were used, neither are registered as hazardous nor are they defined as PBT in the EPA’s TRI list [22,23]. The waste formed from one run was less than 10 g in both methods. Therefore, the established methods are green analytical methods, as they pass the four quadrants profile of this evaluation method. The greenness of the developed method was compared with the reported methods on the same mixture in Table 4.
Table 4.
Comparison of greenness profile between the proposed and reported HPLC methods.
3.2.2. Analytical Eco-Scale
Penalty points for the different aspects of the established methods are shown in Table 5. The proposed methods are considered excellent green methods. The major advantage of the analytical Eco-Scale is its capability to discover and enhance the weakest points in the analytical method.
Table 5.
Penalty points for the suggested chromatographic method.
3.3. Statistical Comparison
The results achieved for the analysis of the components of interest in pure powder by the proposed methods were statistically compared with those attained by applying the reported HPLC method [18]. The results showed no significant variations between the proposed methods and the reported one as presented in Table 6. Moreover, the results achieved on both columns were compared with each other by a one-way ANOVA test as shown in Table 7. The results revealed no significant difference.
Table 6.
Statistical comparison for the results obtained by the proposed method and the reported method for the analysis of the analytes in bulk powder.
Table 7.
Comparison of the established methods by one way-ANOVA.
4. Conclusions
The presented chromatographic method is the first for the separation of the mentioned mixture. The large porosity of the monolithic column allows the resolution of the analyte mixture in a shorter run time by applying higher flow rates. The UHPLC column has an advantage at lower flow rates, while it suffers from high backpressure at higher flow rates. However, both columns were able to separate the mixture in a reasonable time with perfect resolution. Additionally, the mixture was separated on both columns with the use of eco-friendly solvents to apply the Green Analytical Chemistry principles. The developed method can be used in quality control laboratories where there is a great number of samples to be analyzed.
Author Contributions
N.F.A.-T. and A.H. contributed equally to this work on conceptualization, methodology, software, validation, formal analysis, investigation, resources, data curation, writing—original draft preparation, writing—review and editing, visualization, supervision, project administration. All authors have read and agreed to the published version of the manuscript.
Funding
This research received no external funding.
Institutional Review Board Statement
Not applicable.
Informed Consent Statement
Not applicable.
Data Availability Statement
Not applicable.
Acknowledgments
The Department of Pharmaceutical Chemistry, Faculty of Pharmacy, Kuwait University provided the facilities and instruments used to finalize this study.
Conflicts of Interest
The authors declare no conflict of interest.
References
- Atia, N.N.; Peter, Y.; Brian, J.C. Comparison between monolithic and particle-packed platinum C18columns in HPLC determination of acidic and basic test mixtures. J. Sep. Sci. 2009, 32, 2732–2736. [Google Scholar] [CrossRef] [PubMed]
- Tanaka, N.; Kobayashi, H.; Nakanishi, K.; Minakuchi, H.; Ishizuka, N. A new type of chromatographic support could lead to higher separation efficiencies. Anal. Chem. 2001, 73, 420–429. [Google Scholar] [CrossRef] [PubMed] [Green Version]
- Walter, T.H.; Andrews, R.W. Recent innovations in UHPLC columns and instrumentation. Trends Anal. Chem. 2014, 63, 14–20. [Google Scholar] [CrossRef] [Green Version]
- Dong, M.W.; Zhang, K. Ultra-high-pressure liquid chromatography (UHPLC) in method development. Trends Anal. Chem. 2014, 63, 21–30. [Google Scholar] [CrossRef]
- Cabrera, K. Applications of silica-based monolithic HPLC columns. J. Sep. Sci. 2004, 27, 843–852. [Google Scholar] [CrossRef] [PubMed]
- Hemdan, A.; Abdel-Aziz, O. Application of a Fast Separation Method for Anti-diabetics in Pharmaceuticals Using Monolithic Column: Comparative Study With Silica Based C-18 Particle Packed Column. J. Chromatogr. Sci. 2018, 56, 351–357. [Google Scholar] [CrossRef] [PubMed]
- Hjerten, S.; Liao, J.L.; Zhang, R. High-performance liquid chromatography on continuous polymer beds. J. Chromatogr. A 1989, 473, 273–275. [Google Scholar] [CrossRef]
- Hjerten, S.; Mohammad, J.; Nakazato, K. Improvement in flow properties and pH stability of compressed, continuous polymer beds for high-performance liquid chromatography. J. Chromatogr. A 1993, 646, 121–128. [Google Scholar] [CrossRef]
- Rezeli, M.; Kilar, F.; Hjerten, S. Monolithic beds of artificial gel antibodies. J. Chromatogr. A 2006, 1109, 100–102. [Google Scholar] [CrossRef] [PubMed]
- Anastas, P.T. Green chemistry and the role of analytical methodology development. Crit. Rev. Anal. Chem. 1999, 29, 167–175. [Google Scholar] [CrossRef]
- Kirchhoff, M.M. Promoting sustainability through green chemistry. Resour. Conserv. Recycl. 2005, 44, 237–243. [Google Scholar] [CrossRef]
- Sadek, P.C. The HPLC Solvent Guide; Wiley & Sons: New York, NY, USA, 1996. [Google Scholar]
- Hemdan, A.; Magdy, R.; Farouk, M. Response surface design as a powerful tool for the development of environmentally benign HPLC methods for the determination of two antihypertensive combinations: Greenness assessment by two green analytical chemistry evaluation tools. J. Sep. Sci. 2018, 41, 3213–3223. [Google Scholar] [CrossRef] [PubMed]
- Lawrence, H.K.; Gron, L.U.; Young, J.L. Green analytical methodologies. Chem. Rev. 2007, 107, 2695–2708. [Google Scholar]
- Gałuszka, A.; Migaszewski, Z.; Konieczka, P.; Namieśnik, J. Analytical Eco-Scale for assessing the greenness of analytical procedures. Trends Anal. Chem. 2012, 37, 61–72. [Google Scholar] [CrossRef]
- Mertens, B.; Cahay, B.; Klinkenberg, R.; Streel, B. An automated method for the simultaneous determination of pravastatin, 3-hydroxy isomeric metabolite, pravalactone and fenofibric acid in human plasma by sensitive liquid chromatography combined with diode array and tandem mass spectrometry detection. J. Chromatogr. A 2008, 2, 493–502. [Google Scholar] [CrossRef] [PubMed]
- Alghazi, M.; Alanazi, F.; Mohsin, K.; Siddiqui, N.A.; Shakeel, F.; Haq, N. Simultaneous separation of antihyperlipidemic drugs by green ultrahigh-performance liquid chromatography–diode array detector method: Improving the health of liquid chromatography. J. Food Drug Anal. 2017, 1, 430–437. [Google Scholar] [CrossRef] [PubMed] [Green Version]
- HeFnawy, M.M.; MoHaMed, M.S.; Abounassif, M.A.; Alanazi, A.M.; Mostafa, G.A. High-performance liquid chromatography and derivative spectrophotometry for simultaneous determination of pravastatin and fenofibrate in the dosage form. Acta Pharm. 2014, 64, 433–446. [Google Scholar] [CrossRef] [PubMed] [Green Version]
- Sheldon, R.A. Fundamentals of green chemistry: Efficiency in reaction design. Chem. Soc. Rev. 2012, 41, 1437–1451. [Google Scholar] [CrossRef] [PubMed] [Green Version]
- Tobiszewski, M.; Mechlińska, A.; Namieśnik, J. Green analytical chemistry—Theory and practice. Chem. Soc. Rev. 2010, 39, 2869–2878. [Google Scholar] [CrossRef] [PubMed]
- US FDA. International Conference on Harmonization (ICH). Fed. Regist. 1997, 62, 25692–25709. [Google Scholar]
- Emergency Planning and Community Right-to-Know Act; Section 313; Toxic Release Inventory (TRI): Washington, DC, USA, 2004.
- Code of Federal Regulations, Title 40, Part 261; Office of the Federal Register: Washington, DC, USA, 2014.
Publisher’s Note: MDPI stays neutral with regard to jurisdictional claims in published maps and institutional affiliations. |
© 2021 by the authors. Licensee MDPI, Basel, Switzerland. This article is an open access article distributed under the terms and conditions of the Creative Commons Attribution (CC BY) license (https://creativecommons.org/licenses/by/4.0/).


