Article

Non-Targeted Ultra-High Performance Liquid Chromatography-High-Resolution Mass Spectrometry (UHPLC-HRMS) Fingerprints for the Chemometric Characterization and Classification of Turmeric and Curry Samples

1
Department of Chemical Engineering and Analytical Chemistry, University of Barcelona, Martí i Franquès 1-11, E08028 Barcelona, Spain
2
Research Institute in Food Nutrition and Food Safety, University of Barcelona, Recinte Torribera, Av. Prat de la Riba 171, Edifici de Recerca (Gaudí), Santa Coloma de Gramenet, E08921 Barcelona, Spain
3
Serra Húnter Fellow, Generalitat de Catalunya, E08007 Barcelona, Spain
*
Authors to whom correspondence should be addressed.
Separations 2020, 7(2), 32; https://doi.org/10.3390/separations7020032
Submission received: 26 May 2020 / Revised: 6 June 2020 / Accepted: 9 June 2020 / Published: 10 June 2020

Abstract

:
In this work, non-targeted ultra-high performance liquid chromatography-high-resolution mass spectrometry (UHPLC-HRMS) fingerprints obtained by C18 reversed-phase chromatography were proposed as sample chemical descriptors for the characterization and classification of turmeric and curry samples. A total of 21 turmeric and 9 curry commercially available samples were analyzed in triplicate after extraction with dimethyl sulfoxide (DMSO). The results demonstrated the feasibility of non-targeted UHPLC-HRMS fingerprints for sample classification, showing very good classification capabilities by partial least squares regression-discriminant analysis (PLS-DA), with 100% classification rates being obtained by PLS-DA when randomly selected samples were processed as “unknown” ones. Besides, turmeric curcuma species (Curcuma longa vs. Curcuma zedoaria) and turmeric Curcuma longa varieties (Madras, Erodes, and Alleppey) discrimination was also observed by PLS-DA when using the proposed fingerprints as chemical descriptors. As a conclusion, non-targeted UHPLC-HRMS fingerprinting is a suitable methodology for the characterization, classification, and authentication of turmeric and curry samples, without the requirement of using commercially available standards for quantification nor the necessity of metabolite identification.

1. Introduction

Turmeric (Curcuma longa) is a rhizomatous herbaceous perennial plant related to the ginger family (Zingiberaceae) [1], originally from India, although nowadays it is cultivated around the world, especially in Southeast Asia, China, and Latin America [2]. The interest in this plant-derived curry spice for both society and the scientific community has increased because of its recognized medicinal properties, attributed to the presence of curcumin and its derivatives [3,4,5,6,7,8,9,10,11]. Curcumin, (1,7-bis(4-hydroxy-3-methoxyphenyl)-1,6-heptadiene-3,5-dione), also known as diferuloylmethane, is the main natural bioactive compound found in turmeric as well as in other Curcuma species. In addition, other polyphenolic-related bioactive substances such as phenolic acids and flavonoids are also abundant in this kind of products. Turmeric is also a very appreciated culinary spice, being an important component of Asian curries, to which it gives the yellow color, as well as in mustard and sauces in the West [12]. Besides, it is used to add flavor and color to rice, pasta, meat and vegetable dishes, and salads.
Few critical reviews addressing the characterization and determination of curcumin and curcumin derivatives in turmeric samples have been reported [1,2,13,14]. Analytical methodologies involved spectroscopy such as ultraviolet [15], fluorescence [16], infrared [17,18], and nuclear magnetic resonance (NMR) [19], as well as separation techniques such as capillary electrophoresis (CE) [20,21,22], liquid chromatography (LC) [23,24,25,26], and gas chromatography (GC) [27,28].
The use of mass spectrometry (MS) techniques, using either low- or high-resolution mass analyzers, is frequently proposed for the analysis of turmeric samples. Among them, liquid chromatography coupled with mass spectrometry (LC-MS) [27,29] or high-resolution mass spectrometry (LC-HRMS) [30,31,32,33] are among the most common techniques to address the characterization, determination, and identification of curcuminoids and other bioactive substances in turmeric samples. For instance, ultra-high performance liquid chromatography-quadrupole-time-of-flight mass spectrometry (UHPLC-QTOF-MS) was proposed for the identification and characterization of curcuminoids and related metabolites in turmeric samples [31], while UHPLC-HRMS in a Q-Orbitrap mass analyzer was applied to the characterization of the phenolic and antioxidant profiles of several culinary herbs and spices, including turmeric [30].
Nowadays, the use of non-targeted fingerprinting (“metabolomic”) approaches is gaining relevance to address food characterization and classification for authentication purposes [34]. In contrast to targeted strategies where selected known chemicals are monitored (requiring the use of commercially available standards for analyte identification and/or quantitation), non-targeted fingerprinting methods are based on the analysis of complex instrumental responses without assuming any previous knowledge of food components. For example, in the case of LC-HRMS methodologies, the fingerprinting information consists of the peak intensity values recorded as a function of m/z (from 100 to 1500 Da) and retention times [35]. Besides, the identification of components that may be relevant for product authentication is not mandatory. A qualitative strategy based on the chemometric comparison between the samples under study and/or with authentic reference samples is normally exploited, clearly simplifying the method, since confirmation strategies are not required.
This work aims to evaluate the applicability of non-targeted UHPLC-HRMS fingerprinting using a Q-Exactive Orbitrap mass analyzer for the characterization and classification of commercial turmeric and curry samples. For that purpose, a total of 30 samples (21 turmeric and 9 curry samples) were analyzed in triplicate based on a simple sample extraction procedure and subsequent non-targeted reversed-phase UHPLC-HRMS using a C18 column under gradient elution with water and acetonitrile (both acidified with 0.1% formic acid) as mobile phase components. The suitability of the obtained UHPLC-HRMS fingerprints as sample chemical descriptors to address turmeric and curry classification was evaluated with multivariate chemometric methods such as principal component analysis (PCA) and partial least squares regression-discriminant analysis (PLS-DA).

2. Materials and Methods

2.1. Chemicals and Solutions

All the chemicals, reagents, and standards employed in this work were of analytical grade unless otherwise indicated. LC-MS Chromasolv® quality water, methanol, and acetonitrile, formic acid (98-100% purity), and dimethyl sulfoxide (DMSO) were provided by Sigma-Aldrich (Steinheim, Germany). Curcumin (98% purity) was also obtained from Sigma-Aldrich, while demethoxycurcumin (>95% purity) and bisdemethoxycurcumin (>95% purity) were purchased from Biopurify Chemicals Ltd. (Chengdu, Sichuan, China).

2.2. UHPLC-HRMS Instrumentation

Non-targeted UHPLC-HRMS (metabolomic) fingerprints were obtained in an Accela UHPLC system coupled to a Q-Exactive Orbitrap HRMS instrument, both of them from Thermo Fisher Scientific (San Jose, CA, USA), by using a heated electrospray ionization (HESI II) source in negative ionization mode. Nitrogen (purity higher than 99.98%) was used for the HESI-II sheath gas, ion-sweep gas, and auxiliary gas, at flow rates of 60, 0, and 10 a.u. (arbitrary units), respectively. In addition, capillary and S-Lens RF voltages were set at −2.5 kV and 50 V, respectively, and heater and capillary temperatures at 350 °C and 320 °C, respectively.
A full scan HRMS mode from 100 to 1500 m/z using a resolution of 70,000 full width at half maximum (FWHM) at m/z 200 was employed for UHPLC-HRMS fingerprinting. An automatic gain control (AGC) value (number of ions to fill the C-trap) and a maximum injection time (IT) of 2.5 × 10⁵ and 200 ms, respectively, were used. The Q-Exactive Orbitrap HRMS system was tuned and calibrated every 3 days to ensure a working mass accuracy error lower than 5 ppm by using a calibration solution commercially available from Thermo Fisher Scientific for that purpose.
The analytical column consisted of a porous-shell Ascentis® Express C18 reversed-phase (150 × 2.1 mm I.D., 2.7 µm partially porous particle size) from Supelco (Bellefonte, PA, USA). Water and acetonitrile (both acidified with 0.1% formic acid) were the mobile phase components. The gradient elution program is summarized in Table 1. A mobile phase flow rate of 300 µL/min was used. Separation was performed at room temperature, and the volume injection was 10 µL in full-loop mode.
Instrument control and data acquisition and processing were performed using Xcalibur v3.1 software (Thermo Fisher Scientific).

2.3. Samples and Sample Treatment

A total of 21 turmeric and 9 curry commercially available samples were purchased at local markets in Barcelona (Spain). Table 2 summarizes sample characteristics and commercial brands. Samples were analysed in triplicate, thus obtaining 63 turmeric and 27 curry sample extracts.
Sample extracts were obtained following previously described procedures with some modifications [24]. Turmeric or curry samples (10 mg) were suspended in 5 mL of DMSO and extracted by sonication (Branson 5510 bath, Branson Ultrasonics, Danbury, CT, USA) at room temperature during 15 min. Next, a centrifugation step at 3500× g for 15 min (Rotanta 460 RS centrifuge, Hettich, Tuttlingen, Germany) was performed. The resulting extracts were then filtered through 0.45-µm nylon filters (Whatman, Clifton, NJ, USA), and 2 mL were transferred into amber injection glass vials. Extracts were stored at −18 °C until analysis.
A quality control (QC) extract solution was prepared by mixing 50 µL of each sample extract. The QC solution was used to evaluate the method reproducibility, to ensure the robustness of the obtained chemometric data, and to detect signal tendencies attributed to the sample sequence analysis. With this aim, the QC solution and a blank of acetonitrile were injected every 10 samples. All the sample extracts were analyzed randomly.

2.4. Data Analysis

Data matrices for non-targeted analysis were obtained using R software (R Foundation, Vienna, Austria). For that purpose, the obtained UHPLC-HRMS raw data was processed with the MSConvert free-software (ProteoWizard Software Foundation and Project, available at www.proteowizard.sourceforge.net/tools.shtml), obtaining Excel files with all the chemical features detected and registered by means of the peak signal intensities as a function of m/z values and retention times. For data simplification, a threshold peak filter of 105 (absolute intensity) was applied. Common features from different samples were further grouped on the same columns under a tolerance filter of 2 ppm in the m/z domain and 0.25 min in the time domain. A mass defect filter was finally applied to exclude those features with more than 0.2 mass units in the corresponding whole number, and the m/z working range was 100 to 1500.
Eigenvector Stand-alone Chemometric Software (SOLO) v8.6 was employed for PCA and PLS-DA chemometric calculations [36]. The theoretical background of these chemometric methods have been described in detail elsewhere [37]. The X-data matrices for both PCA and PLS-DA calculations consisted of the UHPLC-HRMS (Orbitrap) fingerprints (peak intensities as a function of retention time and m/z value from 100 to 1500) obtained in the negative ionization mode. With the aim of providing similar weights to all the samples, a normalization pretreatment regarding the overall peak signal was applied in all the cases. The Y-data matrix in the PLS-DA models consisted of the membership of each sample to its corresponding class. The structure of maps of both samples and variables was investigated from the scatter plots of scores and loadings of principal components (PCs) in PCA, and of latent variables (LVs) in PLS-DA, thus providing information regarding sample correlations and dependences. The first significant minimum point of a cross-validation (CV) error using a Venetian blind approach was considered to establish the most appropriate number of LVs for each PLS-DA model evaluated. PLS-DA chemometric models were validated for sample classification by using only 70% of the samples of each group randomly selected as the calibration set to build the model, and the remaining 30% of samples of each group as the “unknown” prediction set.

3. Results and Discussion

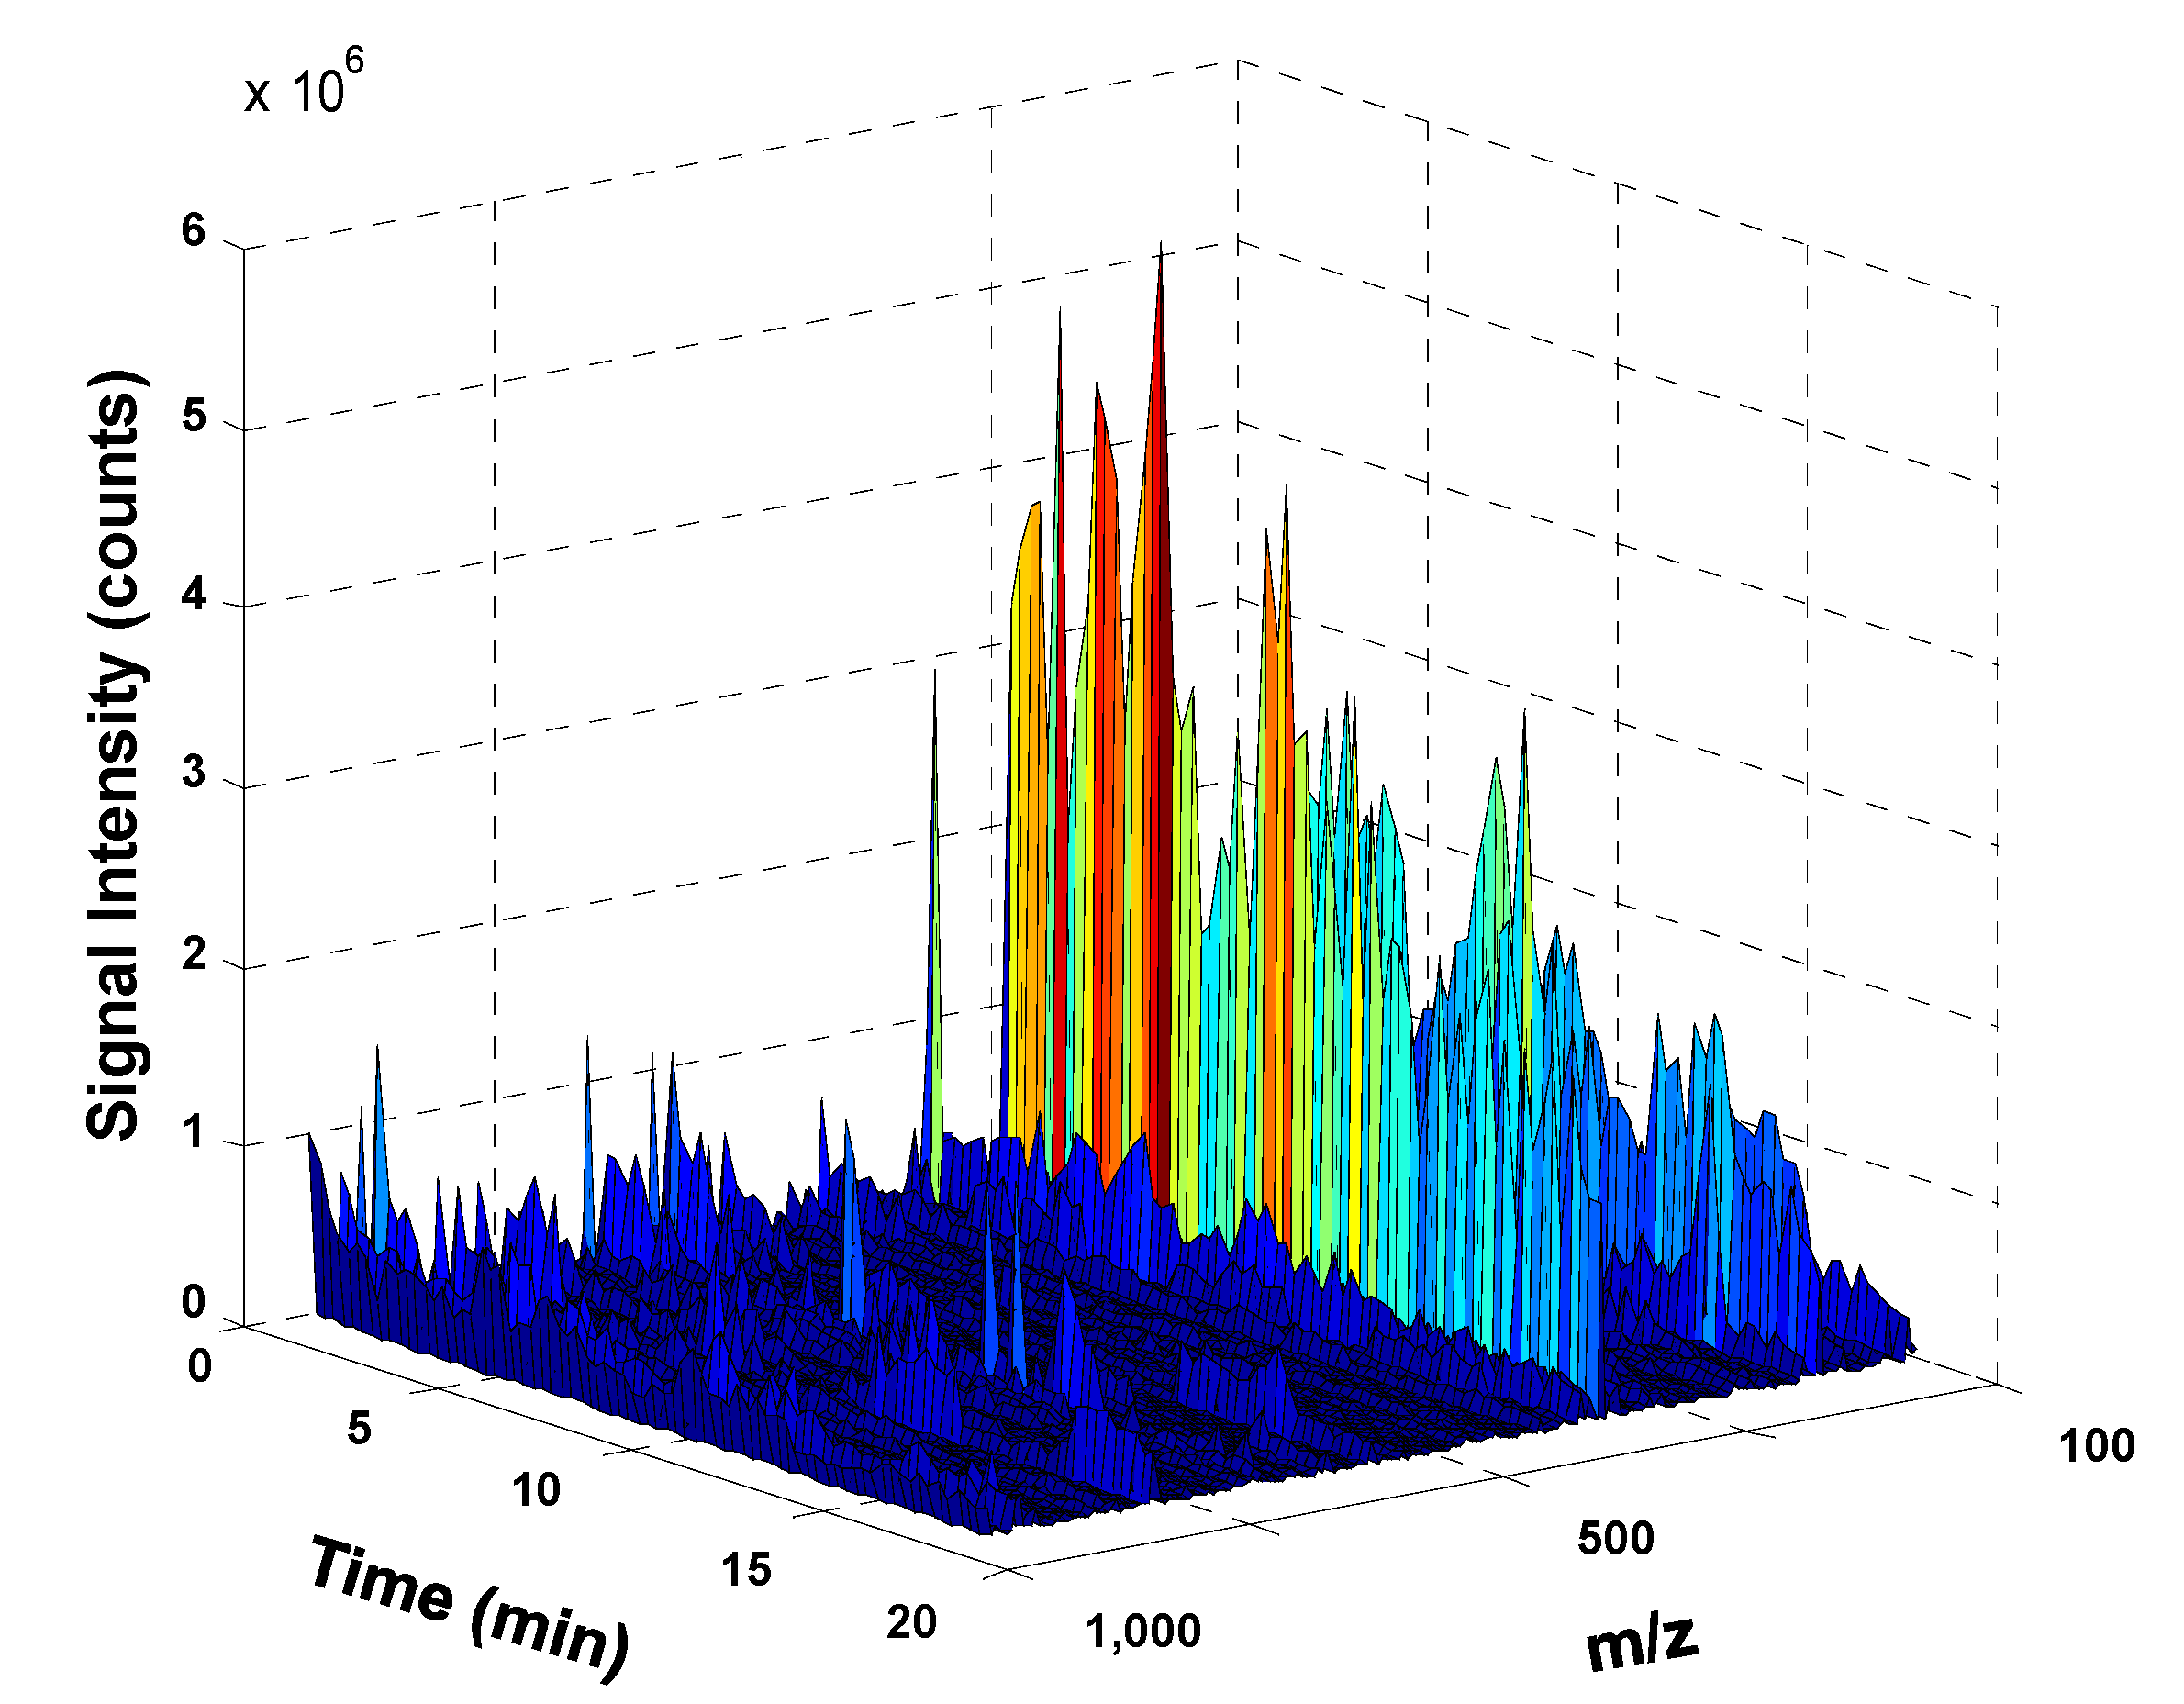
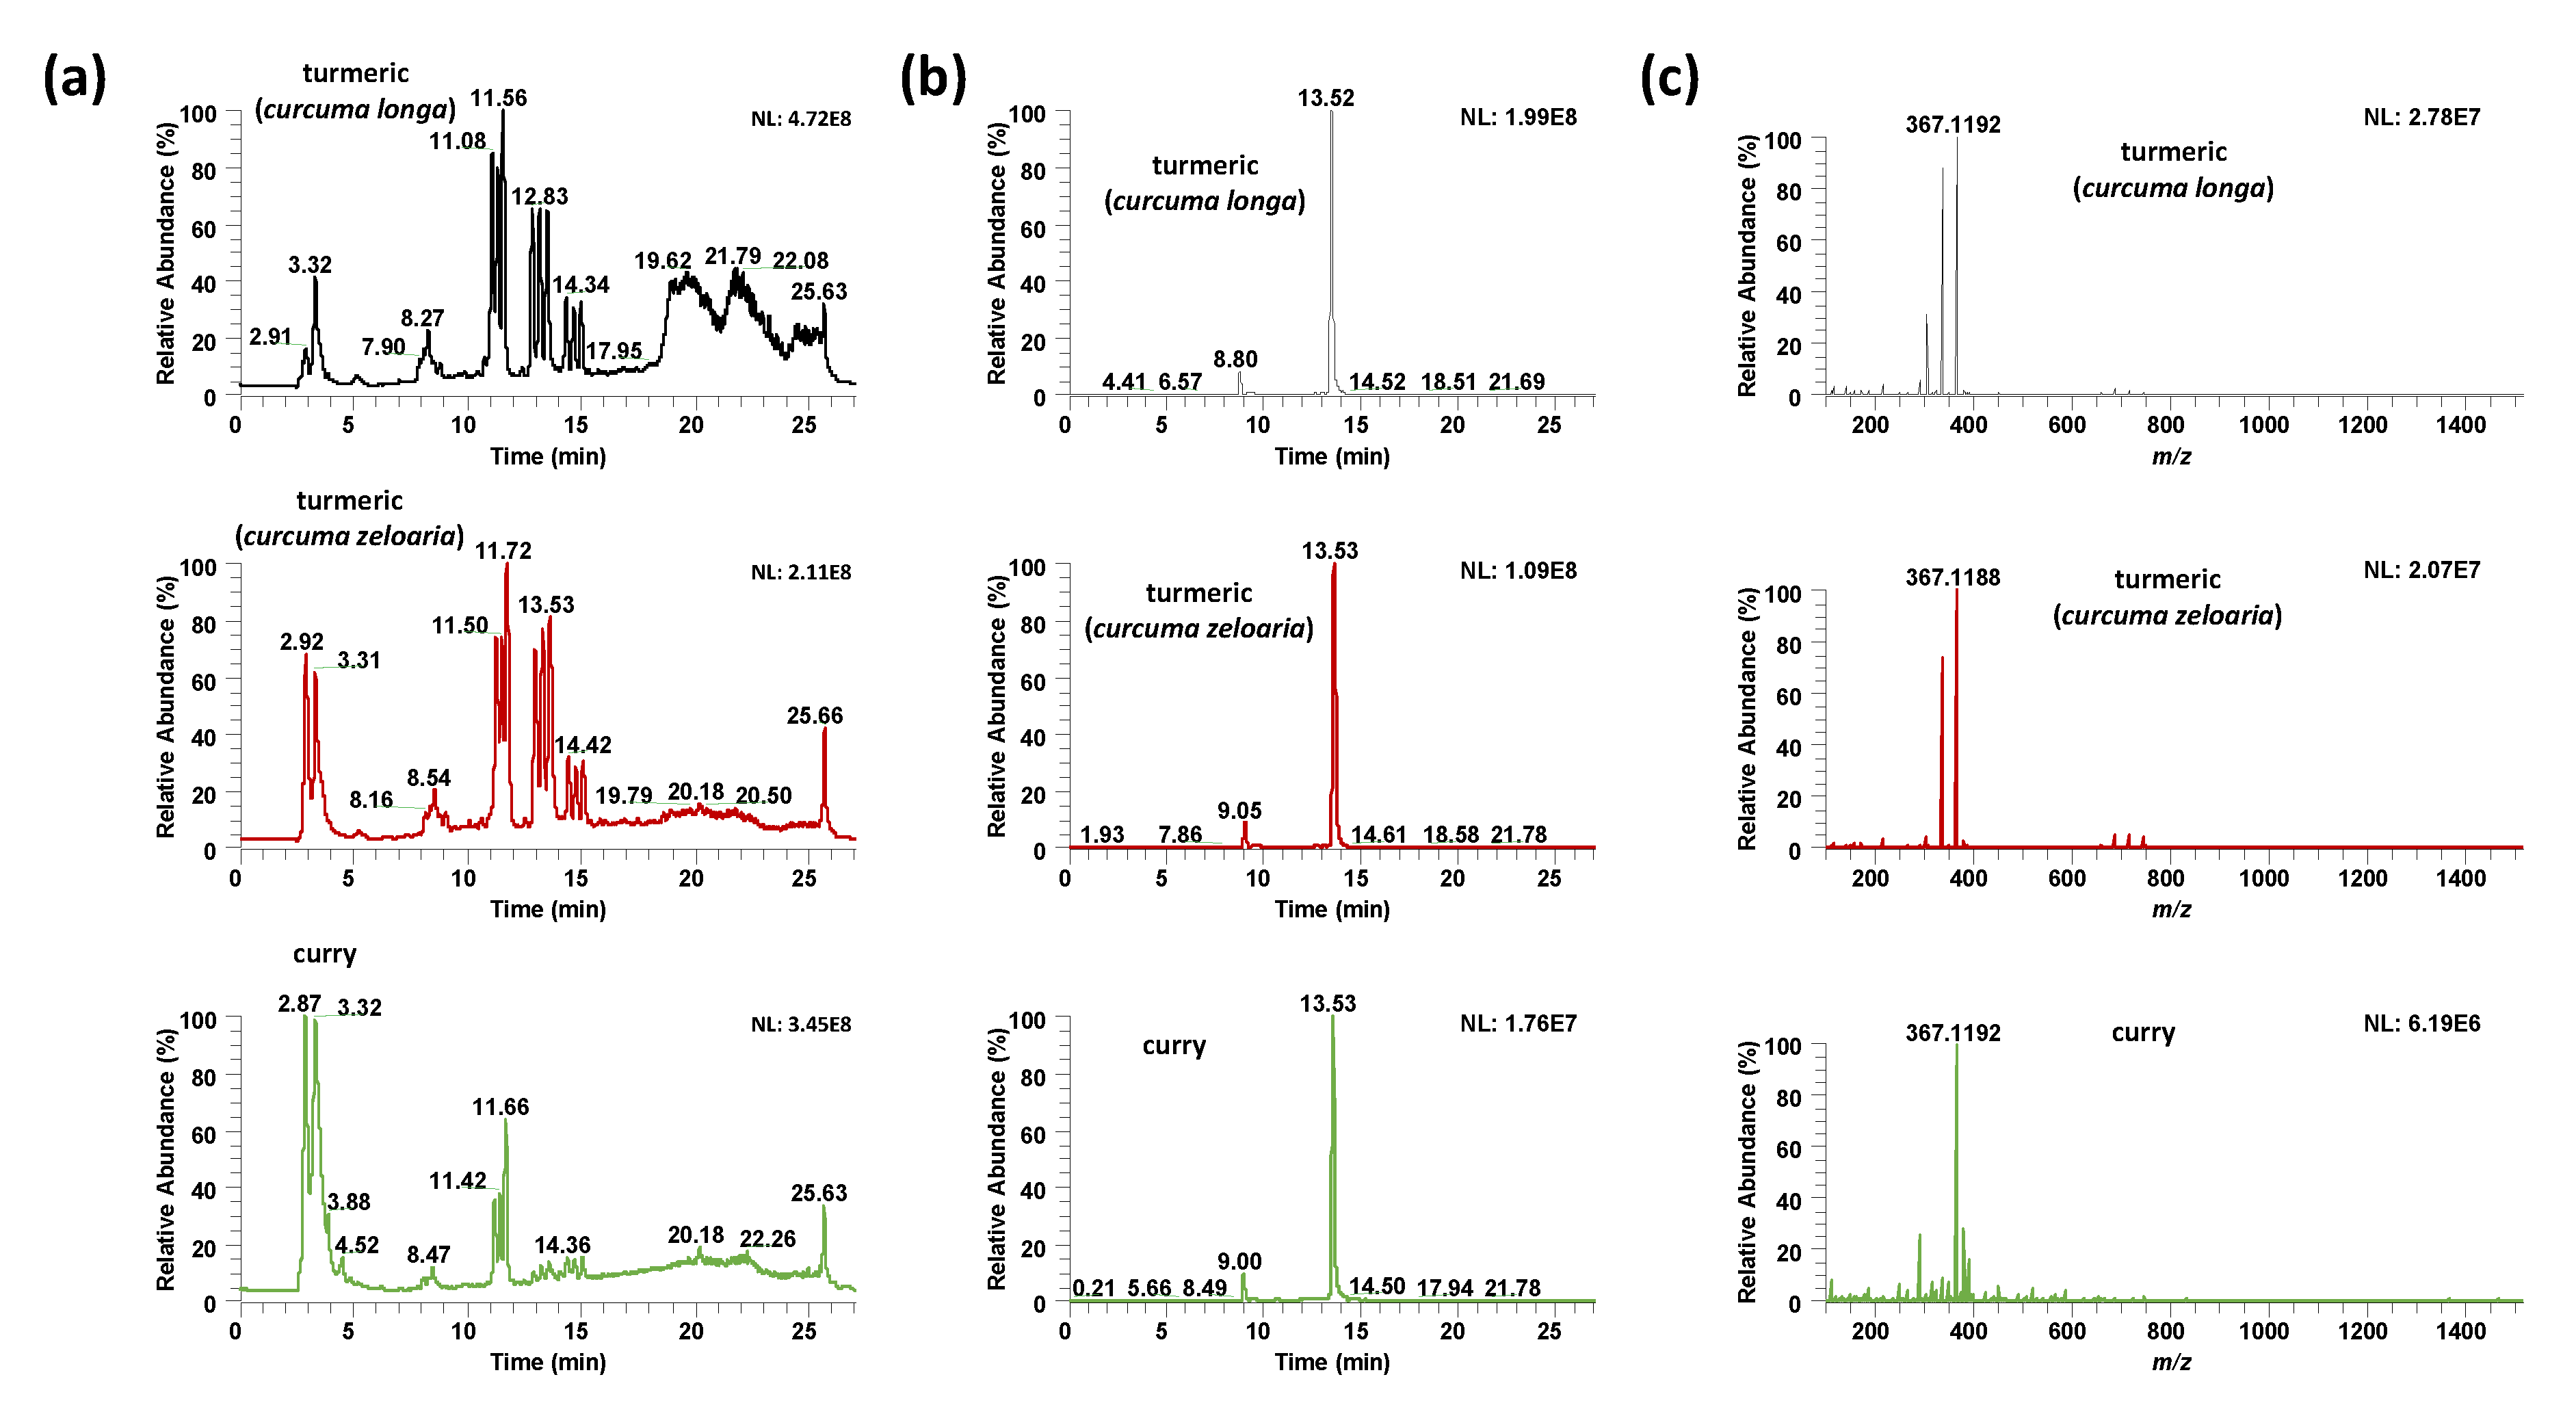
3.1. Non-Targeted UHPLC-HRMS Fingerprinting
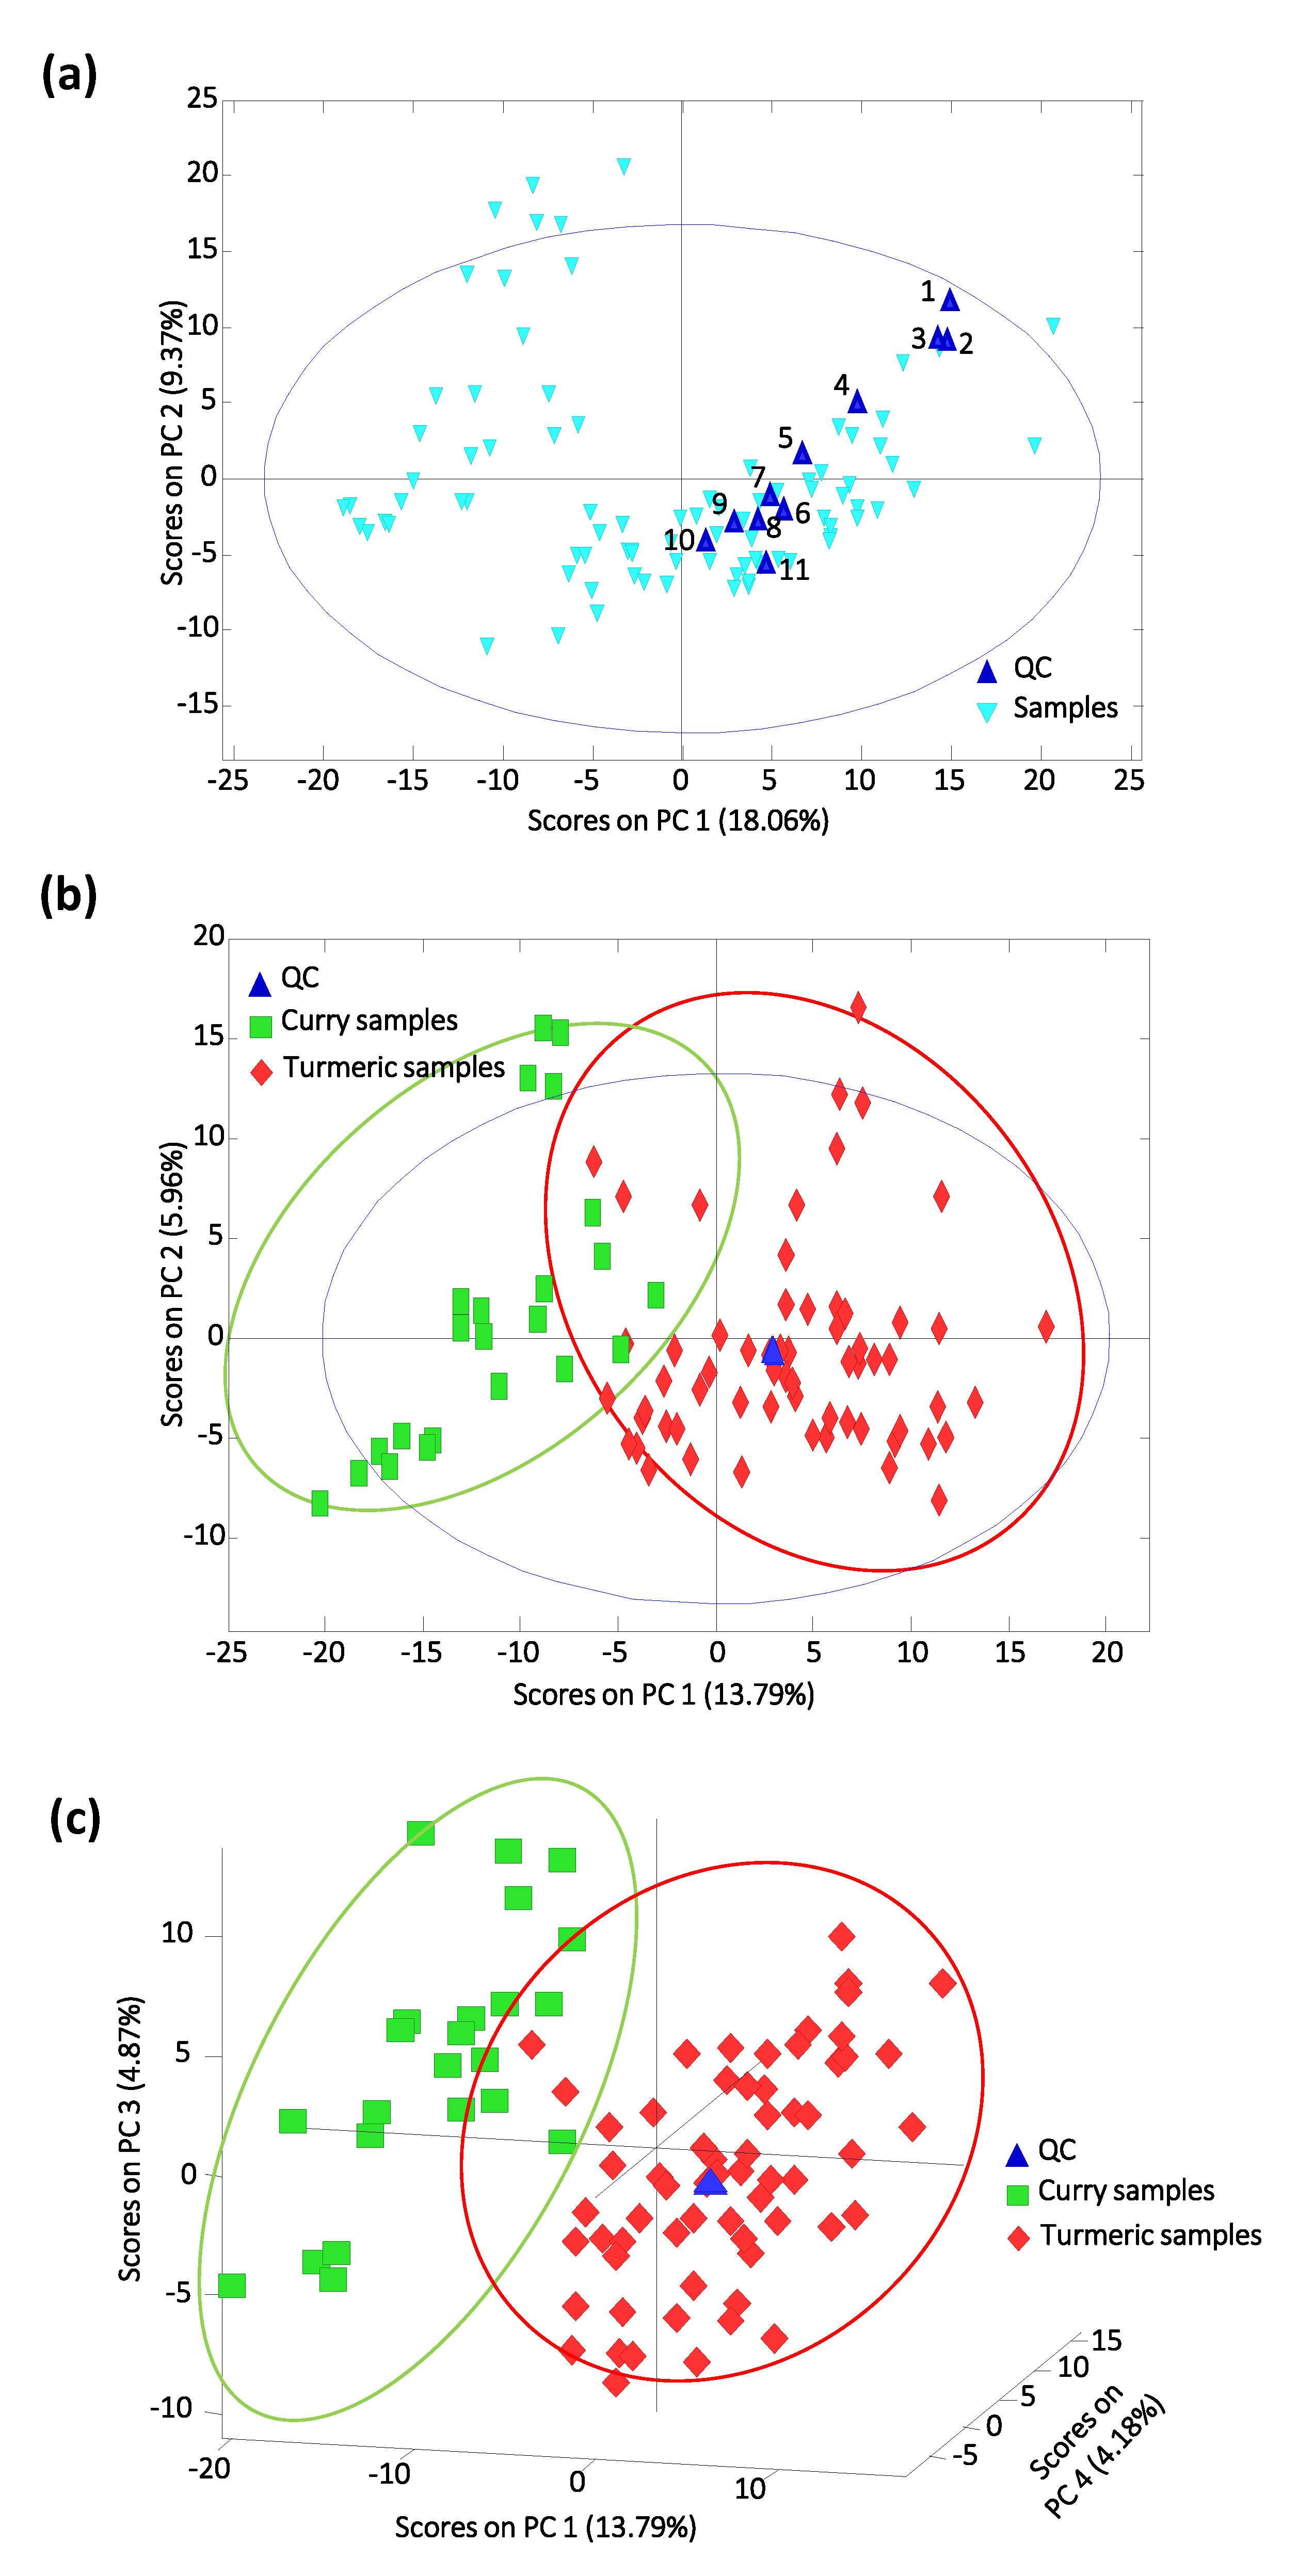
As previously mentioned, this work aimed to evaluate the applicability of non-targeted UHPLC-HRMS “metabolomic” fingerprints as chemical descriptors to address the characterization and classification of turmeric and curry samples. Thus, 21 turmeric samples of different curcuma varieties and 9 curry samples were analyzed in triplicate. As a non-supervised fingerprinting approach was considered, a generic and simple sample treatment using DMSO as extractant solvent was applied prior to the chromatographic separation to extract as many chemical descriptors as possible. In the case of spice-based products such as turmeric and curry samples, their fingerprint will depend not only on the spice variety genotype but also on the product phenotype (food attributes dependent on external conditions such as ambient conditions, agricultural practices, and food-processing procedures among others). Therefore, UHPLC-HRMS “metabolomic” fingerprints are expected to provide good chemical features to address sample classification. Polyphenolic and curcuminoid compounds are among the bioactive substances most frequently found in turmeric and curry samples, and they are usually determined by LC-MS with electrospray in negative ionization mode [14,38].
As an example, Figure 1 shows the 3D UHPLC-HRMS fingerprint of a curry sample. For simplification, only signal intensity of features within retention times (RT) 0–20 min and m/z 100–1000 (which are the richer segments) are shown. As can be seen, features providing higher intensities appeared at m/z values mainly lower than 500 Da, which correspond to small molecules such as polyphenolic and phenolic acids as well as curcumin and curcuminoids. Besides, most of these bioactive substances are relatively polar presenting RT below 15 min when using C18 reversed-phase chromatography.
Figure 2 compares the UHPLC-HRMS total ion chromatograms, the extracted ion chromatograms for curcumin (m/z 367.1187), and the HRMS spectra at RT 13.53 (curcumin retention time confirmed using a commercially available standard) of two turmeric samples of different curcuma species (Curcuma longa and Curcuma zedoaria), and a curry sample. As can be seen, important differences in both chromatographic profiles (Figure 2a,b) and MS signal intensities (Figure 2c) are observed. Although these differences are enhanced between turmeric and curry samples, especially at retention times ranging from 10 to 17 min, where mainly curcuminoids are eluting, noticeable differences are also observed within the different turmeric samples according to their species. For example, the turmeric curcuma longa sample shows a fingerprint with higher signal intensities than turmeric curcuma zedoaria, as well as richer profiles at higher retention times. Because of these differences, non-targeted UHPLC-HRMS fingerprints are expected to be good sample chemical descriptors for classification purposes using chemometrics.
Important differences were also observed in the MS signals as depicted in the HRMS spectra at RT 13.53 min, shown in Figure 2c. Differences are not only based on the signal intensity, but also in the presence of different ions due to different chemical coelutions depending on the sample. All these differences will help with obtaining discriminant sample chemical descriptors to address sample characterization and classification by chemometrics.

3.2. PCA Study

First, the reproducibility of the proposed UHPLC-HRMS fingerprinting method as well as the robustness of the chemometric results were evaluated by studying the behavior of the QCs by PCA. Raw UHPLC-HRMS “metabolomic” fingerprints, consisting of peak signal intensities as a function of both chromatographic retention times and HRMS m/z values, contained a great amount of features, including a lot of background noise signals common in all the analyzed samples. Thus, noise was mainly avoided by applying a threshold peak filter of 105 (absolute signal intensity). These filtered data were then processed with R software to obtain the final data matrix containing the non-targeted UHPLC-HRMS fingerprints of both QCs and samples to be subsequently processed by PCA.
Figure 3a shows the obtained PCA score plot of PC1 vs. PC2. As can be seen, although QCs are replicates of the same solution injected throughout the analysis sequence, they are not correctly grouped in the PCA score plot, revealing a lack of reproducibility of the proposed UHPLC-HRMS fingerprinting procedure, which hinders the chemometric evaluation of the samples. As shown, QCs follow a trend within the score plot probably due to losses in the H-ESI ionization efficiency. Nevertheless, as the QC is the same solution, all the obtained non-targeted UHPLC-HRMS fingerprints can be corrected using the QC signals as the reference. To perform this correction, each sample fingerprinting was divided by the equivalent one in the closest QC injected in the sequence, while each QC signal was divided by itself (resulting in fingerprinting variables defined by the value 1). The PCA score plot of PC1 vs. PC2 when using corrected fingerprints is depicted in Figure 3b. Although a perfect discrimination of both groups of samples is not accomplished, a general trend is observed through PC1 with turmeric samples exhibiting positive PC1 values being located at the right of the plot, while curry samples tend to be located at the left of the plot with negative PC1 values.
PCA sample discrimination slightly improves when using a higher number of PCs, as can be seen in the PCA score plot of PC1 vs. PC3 vs. PC4 depicted in Figure 3c. Turmeric samples exhibited positive PC1 and PC4 values, while curry samples showed negative ones.

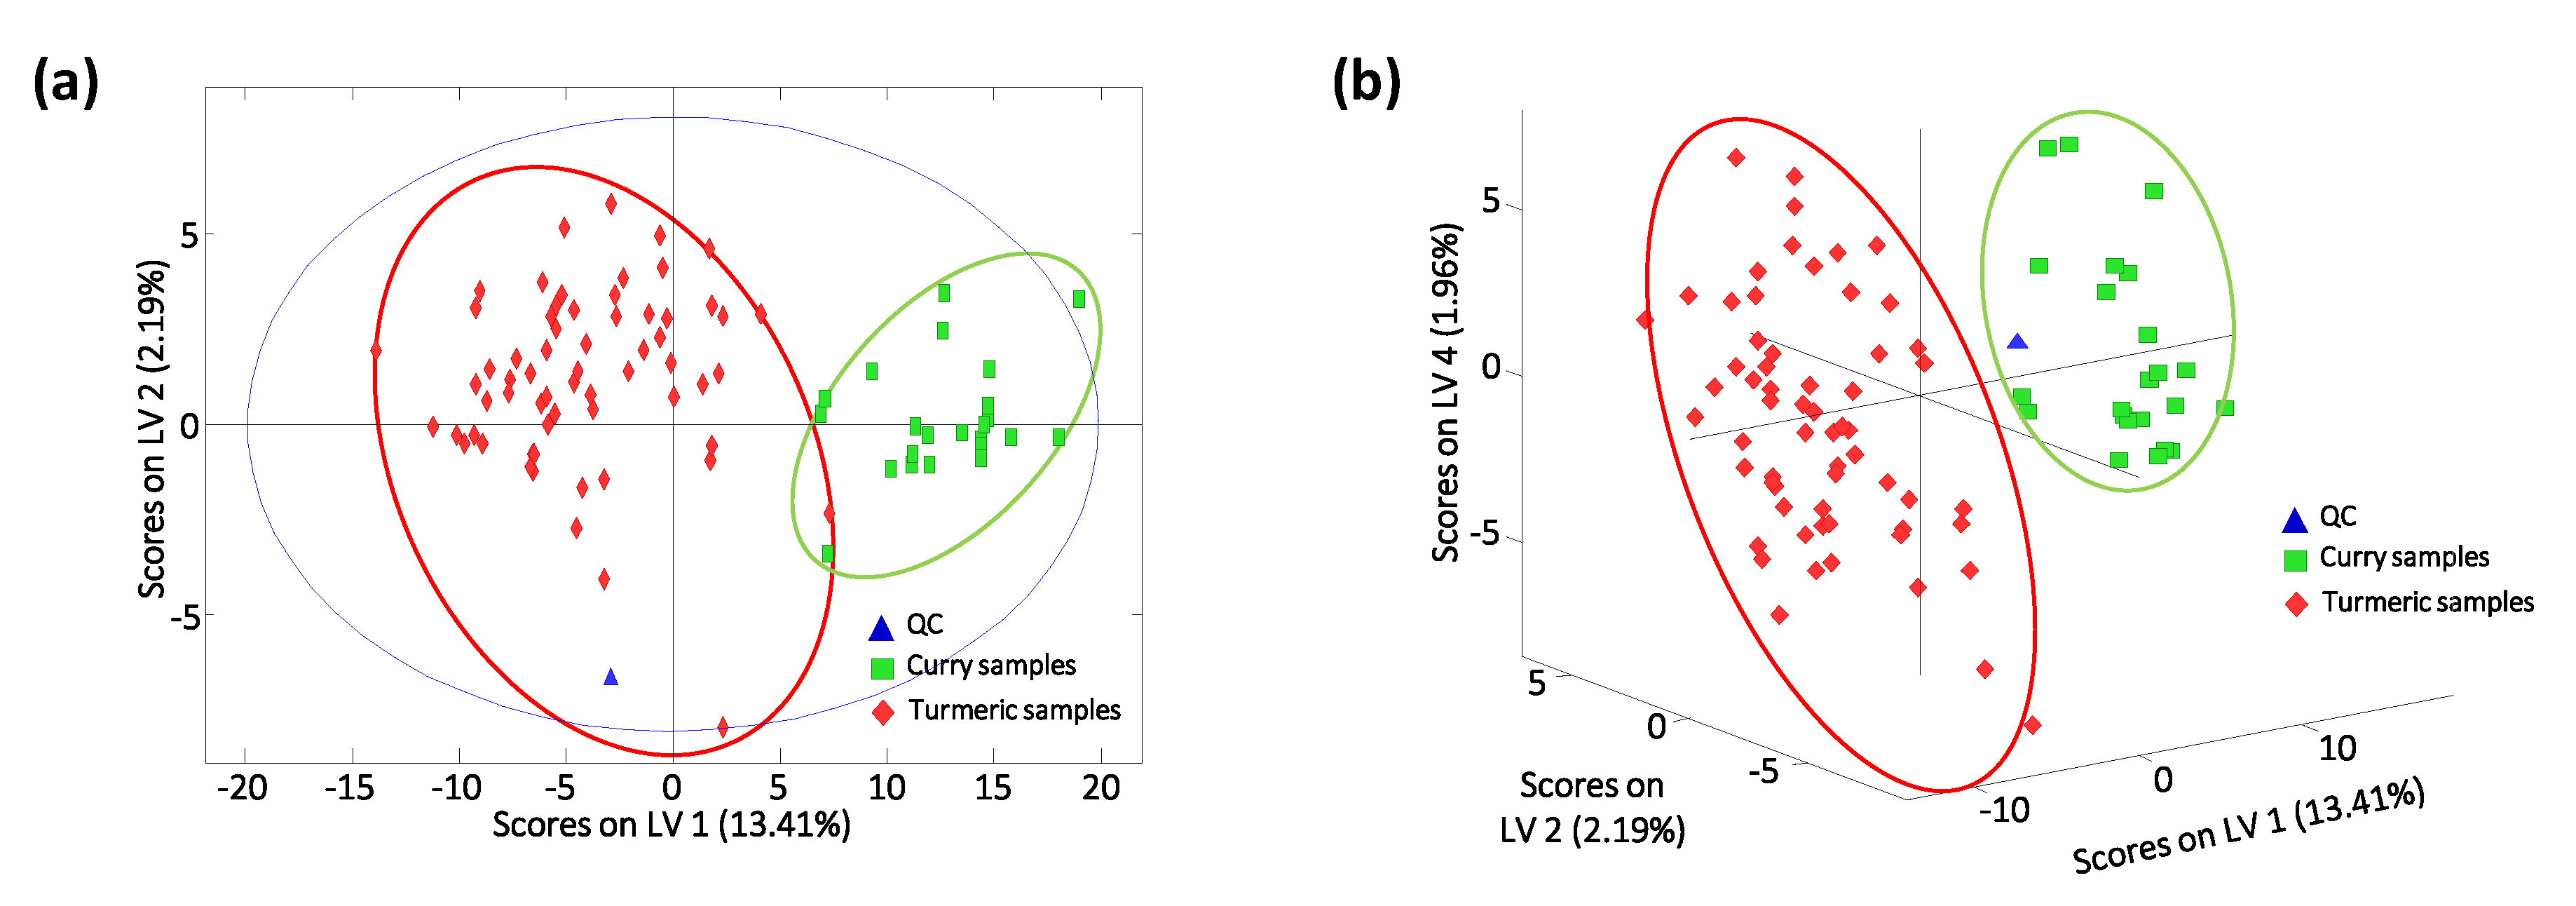
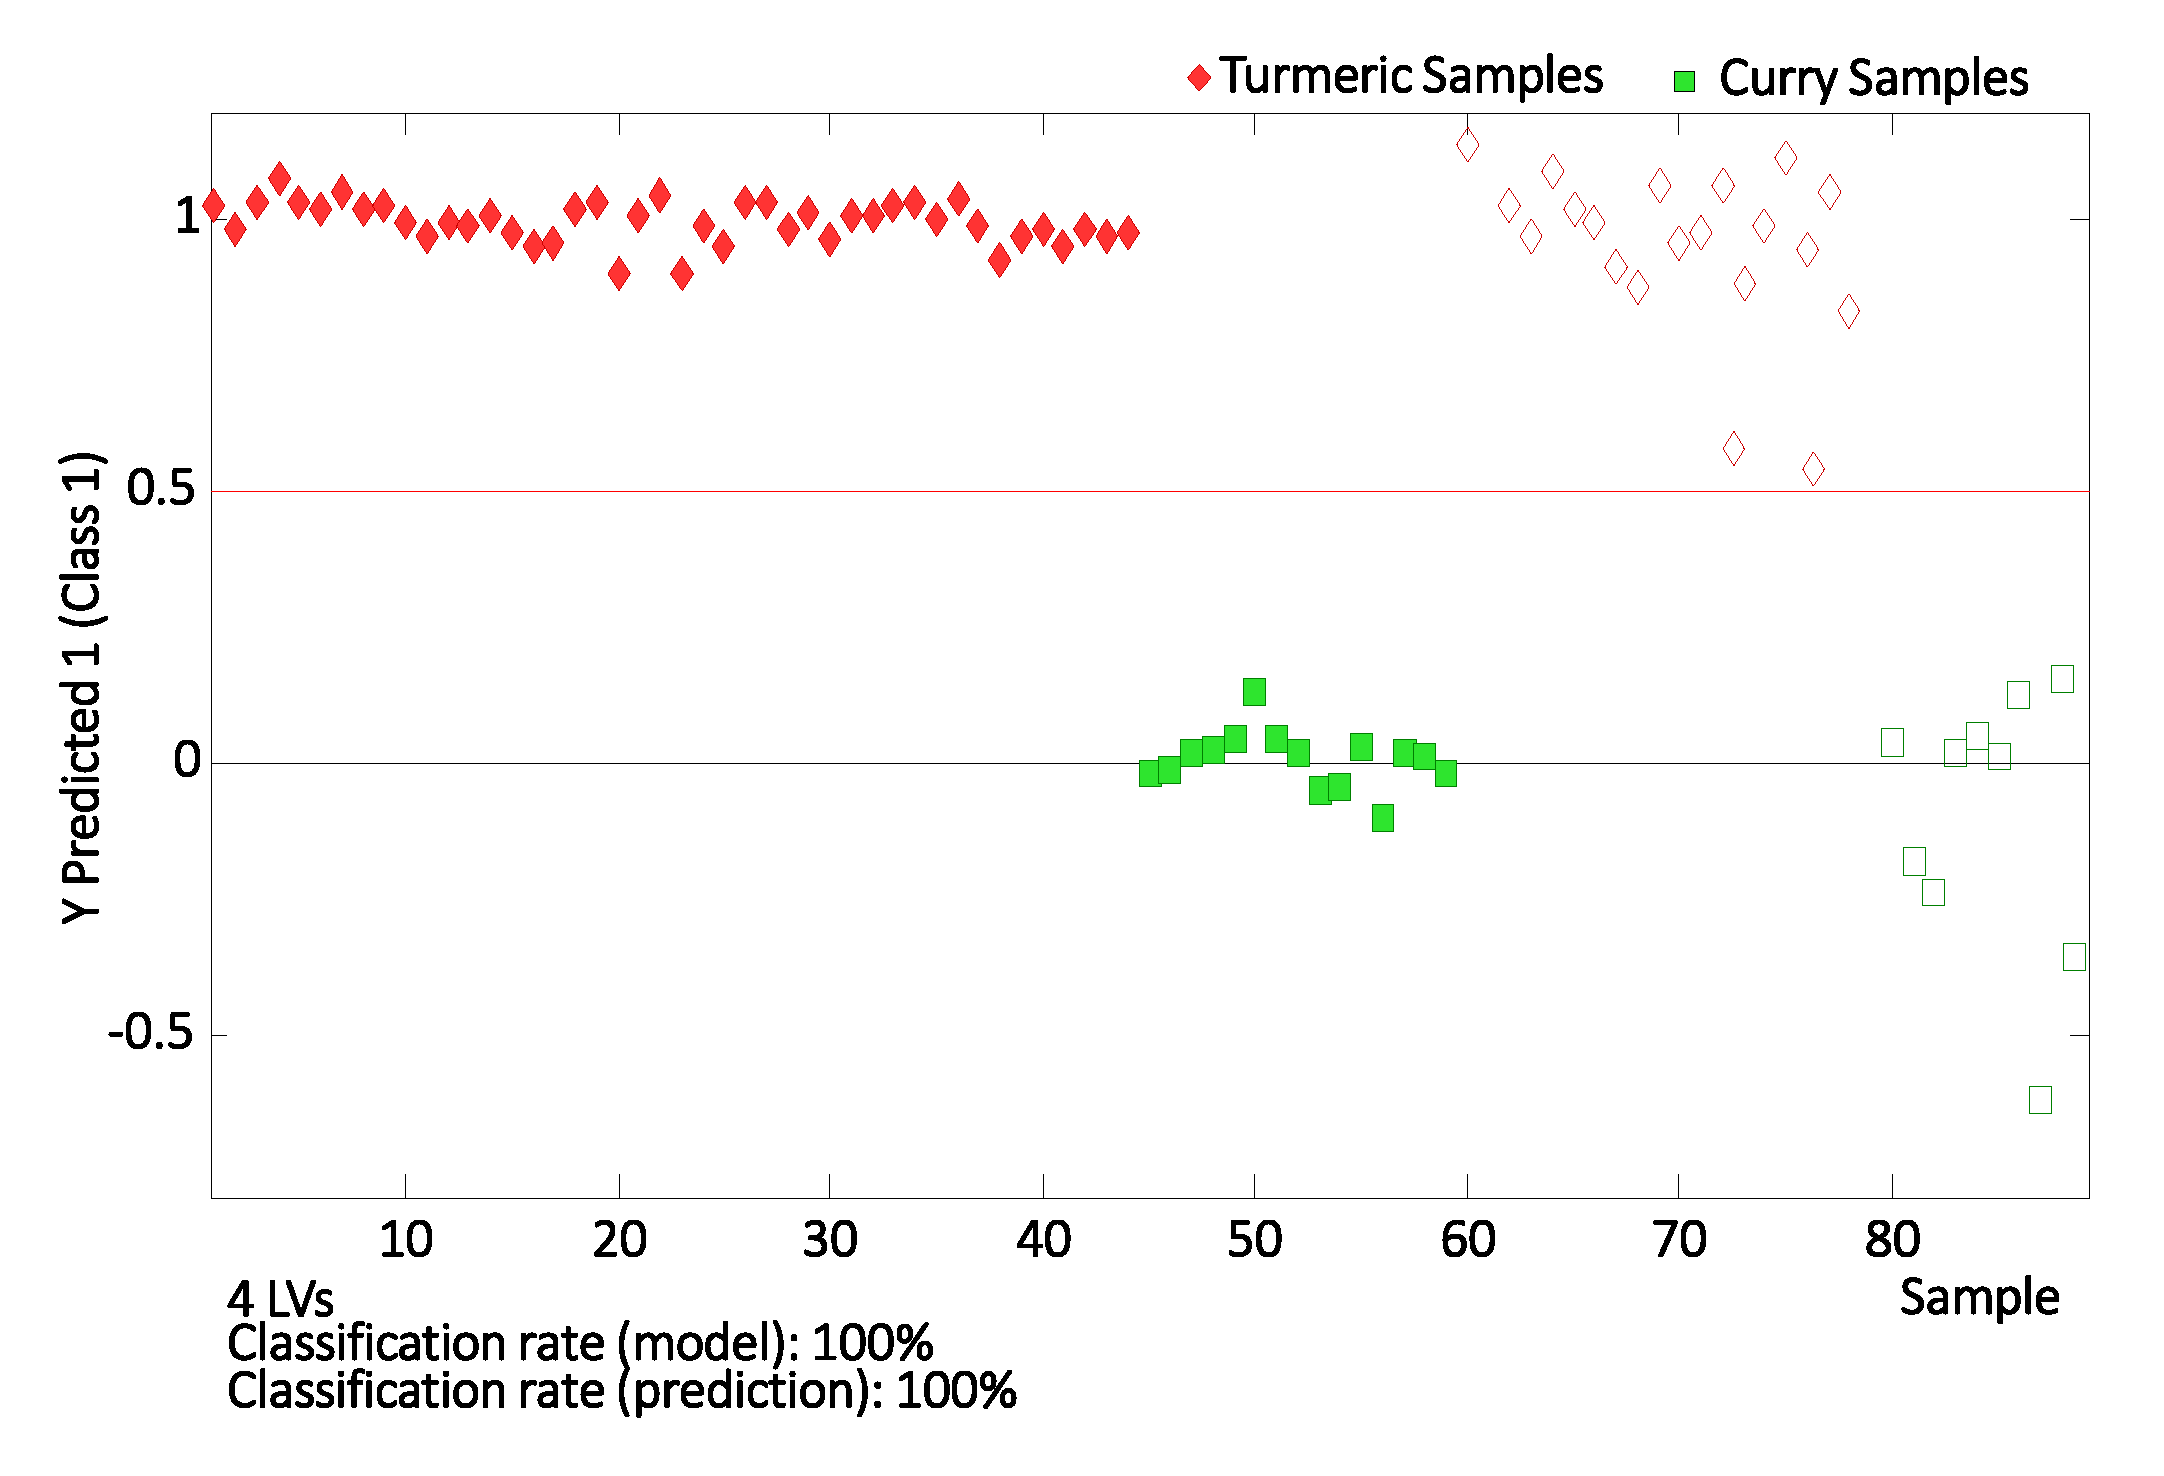
3.3. Sample Classification by PLS-DA

PLS-DA was also applied to evaluate the feasibility of non-targeted UHPLC-HRMS corrected fingerprints as potential chemical descriptors for turmeric and curry classification. The X-data matrix was that used in the PCA, while the Y-data matrix defined the membership of each analyzed sample. Four LVs were required to build the PLS-DA model, as deduced by the first significant minimum error in CV from a Venetian blind approach. The obtained PLS-DA score plots of (a) LV1 vs. LV2 and (b) LV1 vs. LV2 vs. LV4 for turmeric and curry sample classification is depicted in Figure 4. Sample discrimination improved in comparison with the results previously obtained by PCA, as expected. LV1 is responsible for the discrimination between turmeric and curry samples. As can be seen in Figure 4a, curry samples tend to exhibit higher LV1 values in comparison with turmeric samples, which are located to the left of the plot. Again, when using the sample information explained by higher LVs, such as LV4, excellent classification and separation of both groups of samples are accomplished (Figure 4b).
The assignation of “unknown” turmeric samples into their corresponding classes, regarding their curcuma species (Curcuma longa vs. Curcuma zedoaria), as well as among different Curcuma longa varieties (Alleppey, Madras, and Erode) was also studied by PLS-DA. Figure 5 shows the obtained PLS-DA score plot of LV1 vs. LV2. As can be seen, excellent discrimination was accomplished between turmeric Curcuma longa vs. Curcuma zedoaria species (Figure 5a), being perfectly differentiated by LV1. Curcuma zedoaria samples tend to be located at the bottom-right area of the PLS-DA plot, while Curcuma longa turmeric samples are distributed throughout the plot but mainly exhibiting negative LV1 values. Excellent sample discrimination was also achieved when comparing different Curcuma longa varieties, as can be observed in Figure 5b. Both LV1 and LV2 are playing an important role in the sample distribution. Erode samples are located in the center of the plot, and the other samples are distributed in different areas, with Alleppey samples appearing in the top-right area, Madras samples in the bottom-right area, and the curcuma zedoaria turmeric samples in the bottom-left part of the plot. The sample labeled only as Curcuma longa is located in the top-left area of the plot, while the unknown curcuma variety sample overlaps with those of Curcuma longa Erode, but is also very close to Curcuma zedoaria samples. Obviously, a higher number of samples will be required to perform a deeper study in order to perfectly identify this sample, although this was not the aim of the present work.
Finally, the applicability of the proposed fingerprinting methodology to assign turmeric and curry samples to predefined classes was also studied by evaluating the classification rate of the corresponding PLS-DA model. This evaluation was carried out by randomly selecting 70% of the samples of each group as the calibration set to build the PLS-DA model, and using the remaining 30% as the “unknown” set for prediction/validation purposes. The classification plot obtained by PLS-DA by using four LVs to build the model is depicted in Figure 6, showing excellent results. As can be seen, all the samples used as “unknown” samples were correctly classified within the corresponding group.
All the results obtained by PLS-DA demonstrated the applicability and good performance of non-targeted UHPLC-HRMS fingerprints as sample chemical descriptors for the characterization, classification, and authentication of curry and turmeric samples.

4. Conclusions

Non-targeted C18 reversed-phase UHPLC-HRMS fingerprints have been proposed as sample chemical descriptors to achieve turmeric and curry characterization, classification, and authentication by chemometrics. Both PCA and PLS-DA chemometric methods showed good discrimination capacity with the analyzed turmeric and curry samples. Besides, PLS-DA models showed 100% classification rates in both calibration and prediction steps.
The characterization and classification of turmeric samples regarding the different turmeric curcuma species (curcuma longa vs. curcuma zedoaria) and between different curcuma longa varieties (Madras, Erode, and Alleppey) was successfully accomplished, despite the low number of turmeric samples available, by using non-targeted UHPLC-HRMS fingerprints as chemical descriptors and the PLS-DA chemometric method.
The results obtained in this work show that non-targeted UHPLC-HRMS fingerprints can be proposed as excellent sample chemical descriptors for the characterization, classification, and authentication of turmeric and curry samples. The method is advantageous in comparison with targeted approaches as the availability of chemical standards for sample quantitation is not required, and the identification of metabolites is not mandatory.

Author Contributions

Conceptualization, S.S., J.S., and O.N.; methodology, N.N. and O.V.-C.; software, N.N., O.V.-C. and J.S.; validation, N.N.; investigation, N.N., O.V.-C., S.S., J.S., and O.N.; writing—original draft preparation, N.N. and O.N.; writing—review and editing, N.N., O.V.-C., S.S., J.S., and O.N.; supervision, J.S. and O.N. All authors have read and agreed to the published version of the manuscript.

Funding

This research was funded by the Spanish Ministry of Science and Innovation (project PGC2018-095013-B-I00), and by the Agency for Administration of University and Research Grants (Generalitat de Catalunya) under projects 2017SGR-171 and 2017SGR-310.

Conflicts of Interest

The authors declare no conflict of interest.

References

  1. Priyadarsini, K.I. The chemistry of curcumin: From extraction to therapeutic agent. Molecules 2014, 19, 20091–20112. [Google Scholar] [CrossRef] [PubMed] [Green Version]
  2. Carolina Alves, R.; Perosa Fernandes, R.; Fonseca-Santos, B.; Damiani Victorelli, F.; Chorilli, M. A critical review of the properties and analytical methods for the determination of curcumin in biological and pharmaceutical matrices. Crit. Rev. Anal. Chem. 2019, 49, 138–149. [Google Scholar] [CrossRef] [PubMed]
  3. Gupta, S.C.; Patchva, S.; Aggarwal, B.B. Therapeutic roles of curcumin: Lessons learned from clinical trials. AAPS J. 2013, 15, 195–218. [Google Scholar] [CrossRef] [PubMed] [Green Version]
  4. Amalraj, A.; Pius, A.; Gopi, S.; Gopi, S. Biological activities of curcuminoids, other biomolecules from turmeric and their derivatives—A review. J. Tradit. Complement. Med. 2017, 7, 205–233. [Google Scholar] [CrossRef] [PubMed] [Green Version]
  5. Shen, L.R.; Parnell, L.D.; Ordovas, J.M.; Lai, C.Q. Curcumin and aging. BioFactors 2013, 39, 133–140. [Google Scholar] [CrossRef] [PubMed]
  6. Wong, K.E.; Ngai, S.C.; Chan, K.G.; Lee, L.H.; Goh, B.H.; Chuah, L.H. Curcumin nanoformulations for colorectal cancer: A review. Front. Pharmacol. 2019, 10. [Google Scholar] [CrossRef] [PubMed]
  7. Kim, Y.; Clifton, P. Curcumin, cardiometabolic health and dementia. Int. J. Environ. Res. Public Health 2018, 15, 2093. [Google Scholar] [CrossRef] [PubMed] [Green Version]
  8. Xu, X.Y.; Meng, X.; Li, S.; Gan, R.Y.; Li, Y.; Li, H. Bin Bioactivity, health benefits, and related molecular mechanisms of curcumin: Current progress, challenges, and perspectives. Nutrients 2018, 10. [Google Scholar] [CrossRef] [PubMed] [Green Version]
  9. Tsuda, T. Curcumin: An effective or deceptive dietary factor? Challenges for functional food scientists. J. Agric. Food Chem. 2018, 66, 1059–1060. [Google Scholar] [CrossRef] [PubMed]
  10. Tsuda, T. Curcumin as a functional food-derived factor: Degradation products, metabolites, bioactivity, and future perspectives. Food Funct. 2018, 9, 705–714. [Google Scholar] [CrossRef] [PubMed]
  11. Hewlings, S.; Kalman, D. Curcumin: A review of its’ effects on human health. Foods 2017, 6, 92. [Google Scholar] [CrossRef] [PubMed]
  12. Kocaadam, B.; Şanlier, N. Curcumin, an active component of turmeric (Curcuma longa), and its effects on health. Crit. Rev. Food Sci. Nutr. 2017, 57, 2889–2895. [Google Scholar] [CrossRef] [PubMed]
  13. Kotha, R.R.; Luthria, D.L. Curcumin: Biological, pharmaceutical, nutraceutical, and analytical aspects. Molecules 2019, 24, 2930. [Google Scholar] [CrossRef] [PubMed] [Green Version]
  14. Kotra, V.S.R.; Satyabanta, L.; Goswami, T.K. A critical review of analytical methods for determination of curcuminoids in turmeric. J. Food Sci. Technol. 2019, 56, 5153–5166. [Google Scholar] [CrossRef] [PubMed]
  15. Gad, H.A.; Bouzabata, A. Application of chemometrics in quality control of Turmeric (Curcuma longa) based on Ultra-violet, Fourier transform-infrared and 1H NMR spectroscopy. Food Chem. 2017, 237, 857–864. [Google Scholar] [CrossRef] [PubMed]
  16. Ali, Z.; Saleem, M.; Atta, B.M.; Khan, S.S.; Hammad, G. Determination of curcuminoid content in turmeric using fluorescence spectroscopy. Spectrochim. Acta Part A Mol. Biomol. Spectrosc. 2019, 213, 192–198. [Google Scholar] [CrossRef] [PubMed]
  17. Lestari, H.P.; Martono, S.; Wulandari, R.; Rohman, A. Simultaneous analysis of Curcumin and demethoxycurcumin in Curcuma xanthorriza using FTIR spectroscopy and chemometrics. Int. Food Res. J. 2017, 24, 2097–2101. [Google Scholar]
  18. Chao, K.; Dhakal, S.; Schmidt, W.F.; Qin, J.; Kim, M.; Peng, Y.; Huang, Q. Raman and IR spectroscopic modality for authentication of turmeric powder. Food Chem. 2020, 320, 126567. [Google Scholar] [CrossRef] [PubMed]
  19. Windarsih, A.; Rohman, A.; Swasono, R.T. Application of 1H-NMR based metabolite fingerprinting and chemometrics for authentication of Curcuma longa adulterated with C. heyneana. J. Appl. Res. Med. Aromat. Plants 2019, 13, 100203. [Google Scholar] [CrossRef]
  20. Wu, C.; Wang, W.; Quan, F.; Chen, P.; Qian, J.; Zhou, L.; Pu, Q. Sensitive analysis of curcuminoids via micellar electrokinetic chromatography with laser-induced native fluorescence detection and mixed micelles-induced fluorescence synergism. J. Chromatogr. A 2018, 1564, 207–213. [Google Scholar] [CrossRef] [PubMed]
  21. Li, F.; Liu, R.; Yang, F.; Xiao, W.; Chen, C.; Xia, Z. Determination of three curcuminoids in Curcuma longa by microemulsion electrokinetic chromatography with protective effects on the analytes. Anal. Methods 2014, 6, 2566–2571. [Google Scholar] [CrossRef]
  22. Anubala, S.; Sekar, R.; Nagaiah, K. Determination of Curcuminoids and Their Degradation Products in Turmeric (Curcuma longa) Rhizome Herbal Products by Non-aqueous Capillary Electrophoresis with Photodiode Array Detection. Food Anal. Methods 2016, 9, 2567–2578. [Google Scholar] [CrossRef]
  23. Vidal, Ò.; Castilla, X.; Aliaga-Alcalde, N.; López-Periago, A.M.; Domingo, C.; Sentellas, S.; Saurina, J. Determination of curcuminoids by liquid chromatography with diode array detection: Application to the characterization of turmeric and curry samples. Curr. Anal. Chem. 2018, 16, 95–105. [Google Scholar] [CrossRef]
  24. Vidal-casanella, O.; Nuñez, N.; Sentellas, S.; Oscar, N. Characterization of turmeric and curry samples by liquid chromatography with spectroscopic detection based on polyphenolic and curcuminoid contents. Separations 2020, 7, 23. [Google Scholar] [CrossRef] [Green Version]
  25. Chao, I.C.; Wang, C.M.; Li, S.P.; Lin, L.G.; Ye, W.C.; Zhang, Q.W. Simultaneous quantification of three curcuminoids and three volatile components of curcuma longa using pressurized liquid extraction and high-performance liquid chromatography. Molecules 2018, 23. [Google Scholar] [CrossRef] [PubMed] [Green Version]
  26. Sepahpour, S.; Selamat, J.; Manap, M.Y.A.; Khatib, A.; Razis, A.F.A. Comparative analysis of chemical composition, antioxidant activity and quantitative characterization of some phenolic compounds in selected herbs and spices in different solvent extraction systems. Molecules 2018, 23, 402. [Google Scholar] [CrossRef] [PubMed] [Green Version]
  27. Hiserodt, R.; Hartman, T.G.; Ho, C.T.; Rosen, R.T. Characterization of powdered turmeric by liquid chromatography-mass spectrometry and gas chromatography-mass spectrometry. J. Chromatogr. A 1996, 740, 51–63. [Google Scholar] [CrossRef]
  28. Singh, S.; Rajesh, B.S.S.; Sahoo, K.; Subudhi, E.; Nayak, S. Chemical composition of turmeric oil (Curcuma longa L. cv. Roma) and its antimicrobial activity against eye infecting pathogens. J. Essent. Oil Res. 2011, 23, 11–18. [Google Scholar] [CrossRef]
  29. Kulyal, P.; Kuchibhatla, L.N.; Uma Maheshwari, K.; Nirmal Babu, K.; Tetali, S.D.; Raghavendra, A.S. Highly sensitive HPLC method for estimation of total or individual curcuminoids in Curcuma cultivars and commercial turmeric powders. Curr. Sci. 2016, 111, 1816–1824. [Google Scholar] [CrossRef]
  30. Vallverdú-Queralt, A.; Regueiro, J.; Alvarenga, J.F.R.; Martinez-Huelamo, M.; Leal, L.N.; Lamuela-Raventos, R.M. Characterization of the phenolic and antioxidant profiles of selected culinary herbs and spices: Caraway, turmeric, dill, marjoram and nutmeg. Food Sci. Technol. 2015, 35, 189–195. [Google Scholar] [CrossRef] [Green Version]
  31. Jia, S.; Du, Z.; Song, C.; Jin, S.; Zhang, Y.; Feng, Y.; Xiong, C.; Jiang, H. Identification and characterization of curcuminoids in turmeric using ultra-high performance liquid chromatography-quadrupole time of flight tandem mass spectrometry. J. Chromatogr. A 2017, 1521, 110–122. [Google Scholar] [CrossRef] [PubMed]
  32. Jude, S.; Amalraj, A.; Kunnumakkara, A.B.; Divya, C.; Löffler, B.M.; Gopi, S. Development of validated methods and quantification of curcuminoids and curcumin metabolites and their pharmacokinetic study of oral administration of complete natural turmeric formulation (CureitTM) in human plasma via UPLC/ESI-Q-TOF-MS spectrometry. Molecules 2018, 23. [Google Scholar] [CrossRef] [PubMed] [Green Version]
  33. Ashraf, K.; Mujeeb, M.; Ahmad, A.; Ahmad, N.; Amir, M. Determination of curcuminoids in curcuma longa linn. by UPLC/Q-TOF-MS: An application in turmeric cultivation. J. Chromatogr. Sci. 2015, 53, 1346–1352. [Google Scholar] [CrossRef] [PubMed]
  34. Cuadros-Rodríguez, L.; Ruiz-Samblás, C.; Valverde-Som, L.; Pérez-Castaño, E.; González-Casado, A. Chromatographic fingerprinting: An innovative approach for food “identitation” and food authentication—A tutorial. Anal. Chim. Acta 2016, 909, 9–23. [Google Scholar] [CrossRef]
  35. Campmajó, G.; Núñez, N.; Núñez, O. The role of liquid chromatography-mass spectrometry in food integrity and authenticity. In Mass Spectrometry—Future Perceptions and Applications; Kamble, G.S., Ed.; IntechOpen: London, UK, 2019; pp. 3–20. ISBN 978-953-51-7845-3. [Google Scholar]
  36. Eigenvector Research Incorporated. Powerful Resources for Intelligent Data Analysis. Available online: https://eigenvector.com/software/solo/ (accessed on 7 May 2020).
  37. Massart, D.L.; Vandeginste, B.G.M.; Buydens, L.M.C.; de Jong, S.; Lewi, P.J.; Smeyers-Verbeke, J. Handbook of Chemometrics and Qualimetrics; Elsevier: Amsterdam, The Netherlands, 1997. [Google Scholar]
  38. Lucci, P.; Saurina, J.; Núñez, O. Trends in LC-MS and LC-HRMS analysis and characterization of polyphenols in food. TrAC Trends Anal. Chem. 2017, 88, 1–24. [Google Scholar] [CrossRef]
Figure 1. 3D ultra-high performance liquid chromatography-high resolution mass spectrometry (UHPLC-HRMS) fingerprint of a curry sample. For simplification, only the time range from 0–20 min and m/z range from 100 to 1000 is depicted.
Separations 07 00032 g001
Figure 2. (a) Ultra high-performance liquid chromatography-high resolution mass spectrometry (UHPLC-HRMS) total ion chromatogram (negative ionization mode), (b) UHPLC-HRMS extracted ion chromatogram for curcumin (accurate mass at m/z 367.1187), and (c) HRMS spectrum at RT 13.53 (corresponding to elution of curcumin) for a Curcuma longa turmeric sample (Biospirit brand), a Curcuma zedoaria turmeric sample (Dani brand), and a curry sample (Hacendado brand).
Separations 07 00032 g002
Figure 3. Study of turmeric and curry samples by principal component analysis (PCA). (a) Score plot of PC1 vs. PC2 when using non-normalized UHPLC-HRMS fingerprints as chemical descriptors. (b) PCA score plot of PC1 vs. PC2 using normalized data to build the model. (c) PCA score plot of PC1 vs. PC3 and PC4 when using corrected UHPLC-HRMS fingerprints.
Separations 07 00032 g003
Figure 4. Partial least square regression-discriminant analysis (PLS-DA) score plots of (a) LV1 vs. LV2 and (b) LV1 vs. LV2 vs. LV4 by non-targeted UHPLC-HRMS using selected fingerprint features as sample chemical descriptors for the classification of the analyzed samples. Four latent variables (LVs) were required to build the models.
Separations 07 00032 g004
Figure 5. PLS-DA score plots of LV1 vs LV2 when using corrected non-targeted UHPLC-HRMS fingerprints as sample chemical descriptors for (a) classification of curcuma longa vs. curcuma zedoaria turmeric samples, and (b) classification of turmeric curcuma longa varieties. A total of four LVs were used to build the model.
Separations 07 00032 g005
Figure 6. Class prediction plot for turmeric vs. curry samples. Filled and empty symbols correspond to calibration and validation sets, respectively. Four LVs were used to generate the model.
Separations 07 00032 g006
Table 1. Chromatographic elution program for the generation of liquid chromatography-high-resolution mass spectrometry (LC-HRMS) fingerprints.
Time (min)Acetonitrile (%)Elution Mode
010Initial conditions
110Isocratic step
2095Linear gradient
2395Isocratic step
2410Linear gradient
3010Isocratic step for column re-equilibration
Table 2. Characteristics of the analyzed turmeric and curry samples.
SampleCommercial BrandNumber of SamplesNumber of ExtractsCompositional Characteristics
TurmericHacendado515Curcuma longa (Erode)
MG13Curcuma longa (Alleppey)
Burriac13Curcuma longa
Carmencita13Curcuma longa (Erode)
Ducros13Curcuma longa
Artemis Bio13Curcuma longa
Natco13Curcuma longa
Pelotari13Unknown
Dani26Curcuma zedoaria
Especies13Curcuma longa (Alleppey)
Ocena13Curcuma longa (Madras)
Tata Sampann13Unknown
Herbalist13Curcuma longa (Madras)
Street market13Curcuma longa (Madras)
Biospirit13Curcuma longa
NAAI13Unknown
CurryHacendado26White pepper, coriander, ginger, cardamom, clove, cinnamon, anise, mustard
Carrefour13Pepper, coriander, ginger, cumin, fenugreek, laurel, fennel, mustard
Species Kania13Pepper, coriander, cumin, fenugreek, parsley, chili, garlic, fennel
Condis13Pepper, coriander, fennel, cumin, cayenne, garlic, anise
Burriac13White pepper, coriander, ginger, cardamom, clove, cinnamon, anise, mace
Eroski13Coriander, cardamom, ginger, fenugreek, anise, garlic, clove, mustard
Ducros13Pepper, coriander, cumin, ginger, laurel, anise, garlic, clove, cinnamon, mace
Street market13Unknown

