Article

Evaluation of the Performance of Cryogen-Free Thermal Modulation-Based Comprehensive Two-Dimensional Gas Chromatography-Time-of-Flight Mass Spectrometry (GC×GC-TOFMS) for the Qualitative Analysis of a Complex Bitumen Sample

by
Haleigh Boswell
,
Kieran Tarazona Carrillo
and
Tadeusz Górecki
*
Department of Chemistry, University of Waterloo, Waterloo, ON N2L 3G1, Canada
*
Author to whom correspondence should be addressed.
Separations 2020, 7(1), 13; https://doi.org/10.3390/separations7010013
Submission received: 24 December 2019 / Revised: 14 February 2020 / Accepted: 15 February 2020 / Published: 20 February 2020

Abstract

:
Historically, one-dimensional gas chromatography combined with mass spectrometry (GC/MS) has been employed in the analysis of petrochemical samples such as diesel, crude oil and bitumen. With increasingly complex samples, obtaining detailed information can be difficult with this method due to the large number of coelutions. By implementing comprehensive two-dimensional gas chromatography time-of-flight mass spectrometry (GC×GC-TOFMS), the limitations of GC/MS can be overcome, due to the ability of this method to separate mixtures using two different separation mechanisms and obtain full mass spectra. Furthermore, this enables an investigation of biomarkers, compounds which aid in the identification of geological and environmental processes, potentially differentiating crude oil samples. Cryogenic-based thermal modulators are typically used for this application due to their superior focusing effect; however, some platforms require expensive cryogenic consumables. The solid-state modulator (SSM), a cryogen-free thermal platform, was employed for the first time for the group and biomarker analysis of Alberta oil sands bitumen. Evaluation of the SSM performance was based on published literature data on bitumen analysis. Extracted ion chromatograms (EIC) and molecular ion peaks were used for the confirmation of the groups’ and individual’s analytes. Identification of the characteristic biomarkers responsible for determining thermal maturity, source rock or oil origin was achieved. These results indicate the successful analysis of bitumen by consumable-free, solid-state modulation-based GC×GC-TOFMS.

1. Introduction

Bitumen is a complex form of crude oil, made up of heavy hydrocarbons that can be found in oil reservoirs [1]. Present as a thick, highly viscous fluid within oil reservoirs, it must be extracted from the ground because of its inability to flow. It is also the main fossil fuel component of oil sands, a natural mixture of sand, water and bitumen [2]. Drilling wells are used to recover the heavy bitumen, which cannot flow on its own. As a by-product of petroleum exploration and drilling, it is mainly used in the construction industry for paving and roofing [1]. Added as a binder in asphalt, bitumen is used in paving roads, runways and parking lots. Additionally, it is used in roofing as a waterproofing compound to help seal and insulate.
As a highly complex mixture, bitumen contains a very large number of compounds belonging to many chemical classes. This leads to numerous coelutions when utilizing traditional one-dimensional gas chromatography (1D GC). Comprehensive two-dimensional gas chromatography (GC×GC) coupled to time-of-flight mass spectrometry (TOFMS) has the ability to reduce the severity of these limitations by employing two different dimensions of separation and the fast, full scanning capabilities of the TOFMS. Furthermore, GC×GC has the ability to identify biomarkers within crude oil or bitumen samples. Biomarkers are organic molecules that show resistance to chemical change and can assist in determining geological origin and environmental transformations [3,4]. These compounds can assist in connecting crude oils to their source, indicate the maturity of the oil, as well as help identify the source of oil spills. Typically, the classes of primary biomarkers of interest in petroleum geochemistry include hopanes, terpanes, steranes and aromatic steroids [4].
GC×GC-TOFMS has successfully been employed for the qualitative and quantitative identification of biomarkers in various crude oil and bitumen samples. Aguiar et al. performed both group and individual biomarker characterization in Brazilian oils using GC×GC-TOFMS [3]. GC×GC allowed greater separation compared to 1D GC, which allowed terpanes and steranes that usually co-elute to be separated. Hopanes and steranes, which share a similar fragment of 217 m/z, showed no overlap within the two-dimensional space. The C30 hopane and C30R demethylated homohopane, which typically co-elute in 1D GC, were separated with GC×GC. Additionally, for the first time in Brazilian oil samples, the demethylated tricyclic and tetracyclic terpanes were identified.
As the first study to separate hopane and 2 α -methylhopane with tentative spectral identification within Ceara Basin oils from Brazil, this was a breakthrough in oil analysis [4]. Hopane and 2 α -methylhopane elute very close to one another when an apolar methylsilicone column is employed. Identification of these compounds is usually completed by GC-MS selective ion monitoring or GC-MS/MS transitions; however, both procedures do not provide mass spectra. Due to the coelution and identification problems, GC×GC-TOFMS was used. The improved separation and enhanced response of GC×GC-TOFMS allowed the tentative identification of these compounds. Silva et al. employed GC×GC-TOFMS to quantify biomarkers in oils from Colombia [5]. The ability to quantify the identified biomarkers is important for determining the origin of the petroleum, thermal maturity, biodegradation level and source correlations. The identification or absence of a biomarker is not sufficient evidence of geochemical location or thermal maturity; hence the biomarker ratios must be provided. Silva et al. used the ratios in order to compare whether the oils have similar thermal maturity levels. GC×GC-TOFMS proved again to be an appropriate tool by resolving typical 1D GC coelutions and providing spectral deconvolution. Biomarker identification by GC×GC-TOFMS was also shown as a powerful tool in studying the chemical attributes of asphaltene [6]. By studying the biomarkers and biomarker ratios, the thermal maturity was determined. More recently, GC×GC coupled to a flame ionization detector (FID) and high-resolution time-of-flight mass spectrometry (HR-TOFMS) were employed to compare two crude oil spills in the Gulf of Mexico, Ixtoc I and Deepwater Horizon. Groups of chemicals and some individual species were positively identified by accurate mass spectra. The two oil spills of similar origin/type could be differentiated through GC×GC environmental fingerprinting techniques. Furthermore, information on the degradation and weathering gained from the post-spill monitoring of Ixtoc I could be implemented for predicting the long-term outcomes of the Deepwater Horizon spill.
The identification of biomarkers has been shown to be important for the petrochemical, geochemical and environmental industries; however, it is not an easy task due to the low concentrations of the biomarkers in highly complex matrices. In GC×GC, the choice of the modulator interface is a key consideration in obtaining the desired separation and identification of trace compounds. In both consumable and consumable-free thermal modulators, cooling is used in order to trap analytes eluting from 1D at a temperature lower than that of the oven. This trapping provides a re-concentration of the analytes, creating a focusing effect in space. Typically, cryogenic thermal modulators are employed due to their superior focusing effect, resulting in an increase in S/N when compared to a 1D separation. This gain is very beneficial when analyzing trace compounds, making their identification not as challenging. However, some of these modulators require expensive cryogenic consumables. As an alternative to the cryogenic platforms, there are consumable-free models to decrease the costs involved. Additionally, heater-based thermal modulators offer a similar focusing effect without the need for cryogens. The recently commercialized solid-state modulator (SSM) has shown promise in separating various complex mixtures. It has been applied, among others, to the analysis of kerosene, light cycle oil and diesel [7,8,9,10]. However, this platform has not yet been used to analyze a very complex mixture such as bitumen. The primary aim of this study was to evaluate the performance of the SSM compared to published literature for the analysis of bitumen by GC×GC-TOFMS. The analysis was not meant to be a full characterization of the oil sands bitumen, but more the assessment of the capabilities of the SSM to analyze a very complex sample. To the authors’ knowledge, this is the first application of the SSM for the analysis of bitumen. To compare the SSM’s performance to that of cryogenic platforms, several analyses and identifications were completed. A group analysis was employed for a full characterization of bitumen. Furthermore, a characteristic biomarker identification from extracted ion chromatograms was performed.

2. Materials and Methods

2.1. Samples

An oil sand sample was obtained from Alberta (Canada). Solvent extraction was performed based on a previously established protocol for bitumen from oil sand [11]. Briefly, a solvent/oil sand mixture at a 5:3 ratio (mL/g) was stirred at a velocity of 500 rpm for 30 min at a temperature of 50–60 °C. The extract was then evaporated to dryness. Cyclohexane (Sigma-Aldrich, Oakville, Ontario, Canada) was used for the extraction process. It is important to choose a solvent that promotes solubilization of the bitumen and has a low boiling point, to allow easy solvent recovery [12]. Wang et al. studied various solvents to determine the best choice for bitumen recovery and asphaltene content determination with regards to their solubility parameters [11]. Cyclohexane was found to be an appropriate choice due to its medium solubility parameter and medium bitumen recovery, while toluene offered a slightly higher bitumen recovery and higher solubility parameters [11]. Despite the higher bitumen recovery, toluene has a higher boiling point than cyclohexane, and a lower boiling point is beneficial for the solvent extraction process [12].

2.2. Solid-State Modulation

Solid-state, thermal modulation was implemented for all analyses using a SSM1810 thermal modulator, as seen in Figure 1, from J&X Technologies (Shanghai, China) [13]. The modulator featured independent heating and cooling zones and operated outside the GC oven. Micathermic heaters allowed temperature programming of the two aluminum heating chambers (entry and exit zones) from ambient to greater than 350 °C for remobilization. A pair of three-stage thermoelectric coolers allowed temperature programming within the trapping zone from −50 °C to 50 °C. Dual stage modulation was achieved by mechanically moving the modulator column back and forth, a principle similar to that of the longitudinally modulated cryogenic system (LMCS) [14]. However, instead of moving the cold trap along the column like in the LMCS system, the modulation column moved in and out of the cold zone. Actuation of a solenoid valve swung a column gripper left and right to drive the column back and forth between the hot and cold zones. A graphite roller was placed in each heating chamber to facilitate the movement of the modulation column and reduce the wear of the polyimide exterior coating. The manufacturer offers four types of modulator columns depending on the boiling point range of the analytes. The columns are selected according to the application and analyte requirements. The four options include EV, HV, SV and DV columns. The EV series has a modulation range from C2 to C12; the HV series has a modulation range between C5 to C30, the SV series covers the range from C7 to C40, while the DV series ranges from C9 to C40+. The modulator columns are coated with proprietary phases and the series labels are not further elaborated on by the manufacturer.
The SSM performed dual stage modulation, as seen in Figure 2 [13,15]. As the analytes eluted off the 1D, they were trapped in the segment of the modulation column exposed to the cooled zone. As the modulator column moved into the entry hot zone, the analytes were remobilized due to the elevated temperature. With this movement of the modulator column, the downstream segment was exposed to the cooling zone. As the remobilized analytes traversed the modulation column, they were exposed to the cooling zone and trapped during the second stage. The movement of the modulator column towards the exit zone exposed the previously trapped analytes once again to an elevated temperature for injection into the 2D. Simultaneously, the upstream portion of the modulation column was exposed to the first stage of trapping once again.

2.3. Analysis Conditions

An Agilent 6890 gas chromatograph (Agilent Technologies, Wilmington, DE, USA) with a split/splitless injector, an Agilent 7683 auto-sampler and LECO Pegasus III TOFMS (St. Joseph, MI, USA) were used for all analyses. A standard column configuration was used, which included a 30 m × 0.25 mm i.d. × 0.25 µm Rxi-5MS from Restek Corporation (Bellefonte, PA, USA) as the first dimension (1D), and a 1.0 m × 0.25 mm i.d. × 0.25 µm Rxi-17MS from Restek Corporation as the second dimension (2D).The HV series modulation column (J&X Technologies, Shanghai, China), capable of a modulation range from C5 to C30, was used for all analyses. The oven temperature program began at 100 °C for 5 min, then ramped to 200 °C at a rate of 2 °C/min and to 320 °C (held for 5 min) at a rate of 4 °C/min. All connections between the 1D column, modulation column and 2D column were made using Pressfit Connectors for 0.25 mm columns (Restek Corporation, Bellefonte, PA, USA). A one microliter sample was injected into the injector operated in split mode with a 4-mm i.d. single taper inlet liner with fused silica wool (Restek Corporation, Bellefonte, PA, USA). Helium gas (Praxair, Mississauga, Ontario, Canada) with a purity of 99.999% was used as the carrier gas, with a flow rate of 1.5 mL/min for all analyses. The TOF-MS was operated at an acquisition rate of 200 Hz and scanned from 35–600 amu. ChromaTOF software, version 3.32, (LECO Corporation, St. Joseph, MI, USA) was used for data acquisition, SSCenter software, version 1.0.19.0, (J&X Technologies, Shanghai, China) was used for controlling the SSM platform, and ChromSpace, version 1.3, (Markes International, Llantrisant, UK) was used for data processing. A different software package was used for data processing, since the ChromaTOF software only acquired raw, one-dimensional data with the SSM modulator and was incapable of creating a two-dimensional chromatogram. The entry hot zone of the SSM was set at a +30 °C offset, following the oven temperature program, and capped at 320 °C. The exit hot zone was set at a +120 °C offset, following the oven temperature program, and capped at 320 °C. The cold zone began at 9 °C, then ramped down to −50 °C for 28.8 min at a rate of 50 °C/min, then ramped back to 9 °C for 57 min at a rate of 20 °C/min. A 6 s modulation period was used for all analyses.

3. Results and Discussion

3.1. Group-Type Identification

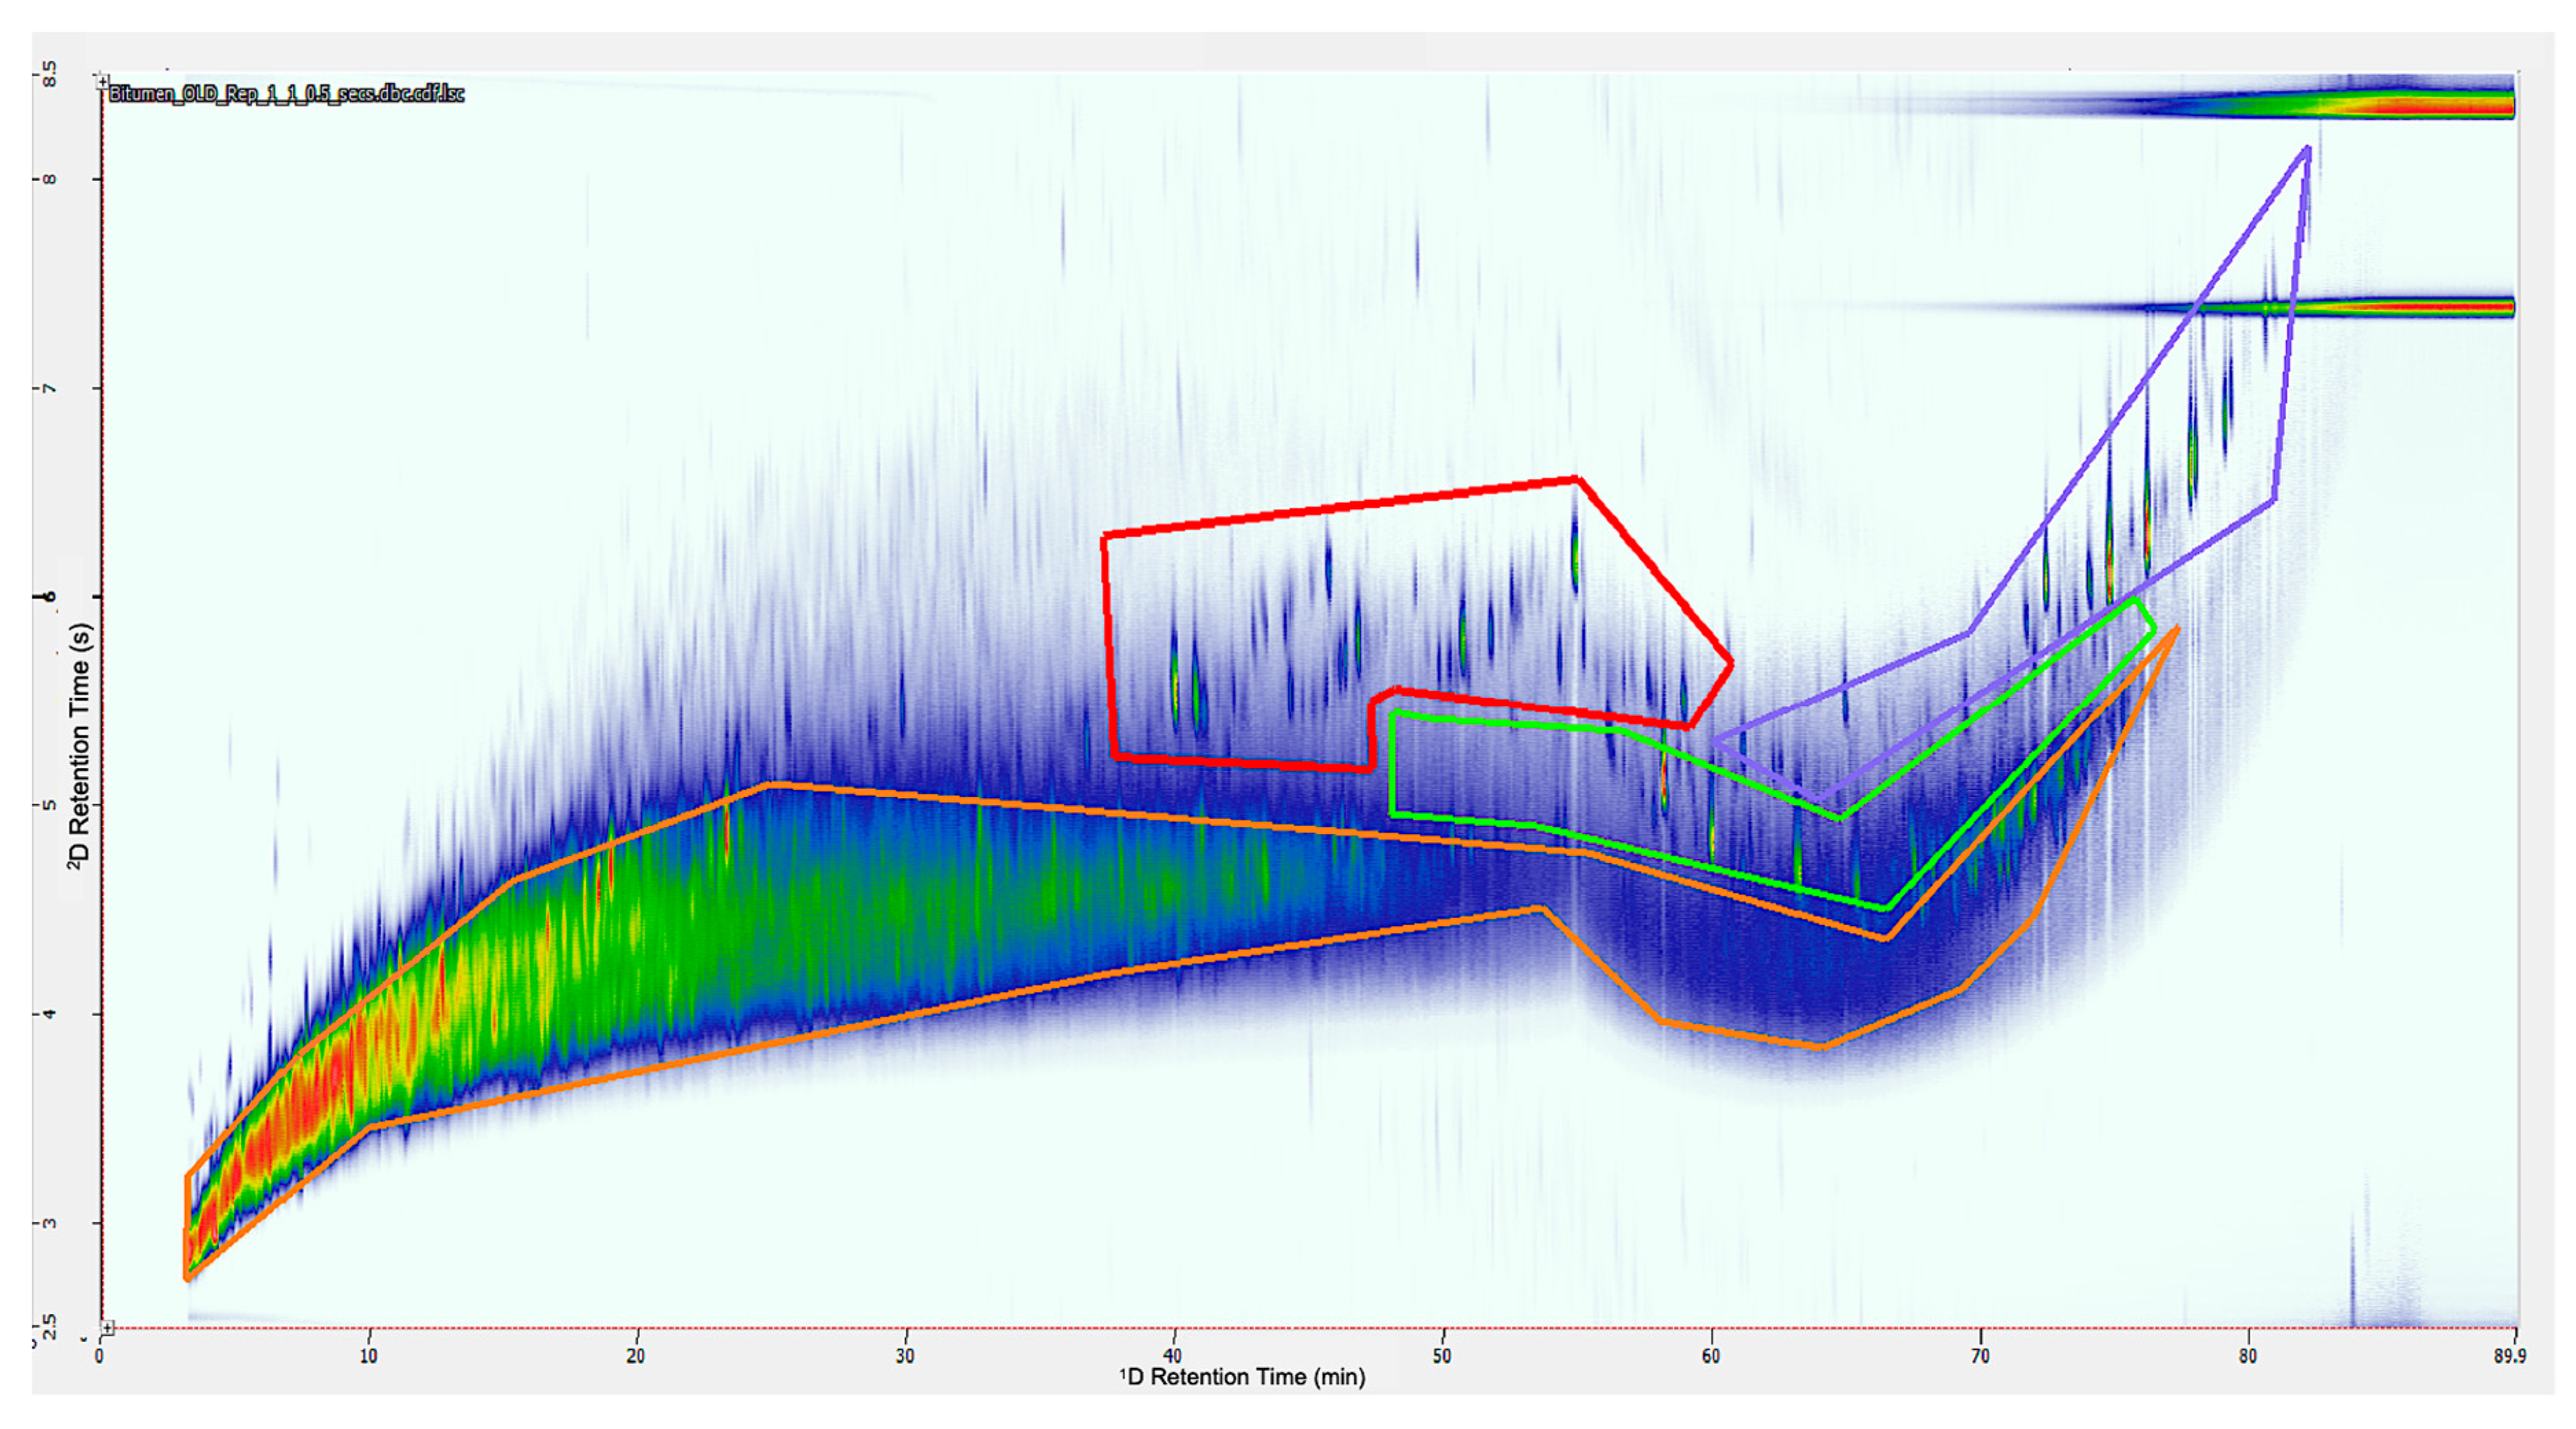
One of the key features of the two-dimensional contour plots is the “roof-tile” effect created by the placement of homologous groups within the two-dimensional space. With a nonpolar 1D stationary phase, the separation of non-polar compounds is based on volatility, while the semi-polar 2D stationary phase separates analytes based on their polarity. As compounds of similar nature and chemical composition elute in a contour plot, they appear in similar regions, allowing group type identification. Total ion and extracted ion chromatograms were analyzed to perform a broad group type analysis using m/z 85 (paraffins), m/z 177 and 191 (demethylated terpanes and cyclic terpanes, respectively), m/z 191 (hopanes), and m/z 217 (alkylated steranes) [3,16,17]. Despite the same characteristic m/z, terpanes and hopanes were differentiated from one another based on their position within the 2D space. With a normal column configuration, terpanes elute before hopanes within the 2D [3]. As seen in Figure 3, the bitumen sample had been separated into four general groups based on EICs. The paraffins (orange) could be found at the bottom of the separation space, eluting first within the 2D space. Due to their non-polar nature, they did not have significant retention when analyzed on a semi-polar column. The terpanes (green), steranes (red) and hopanes (purple) had similar retention on the non-polar 1D column, making identification with 1D GC difficult. Each group had more retention on the semi-polar 2D column, allowing for clear distinction between the groups within the 2D space. This ordered nature is advantageous for homologous groups, especially when reference standards are limited or not available for positive identification.
It is important to note the somewhat unusual shape of the chromatogram. The first inflection point at approximately 55 min was due to the change in the oven temperature ramp from 2° C/min to 4 °C/min. Additionally, the exit hot zone of the SSM reached the isothermal hold of 320 °C, the upper temperature limit for the modulation column, at approximately 55 min. Subsequently, the entry hot zone continued to increase alongside the GC oven at an offset of 30 °C. The entry hot zone did not reach an isothermal state until approximately 78 min. The odd shape after 55 min was most likely due to the difference in the GC oven temperature in comparison to the entry and exit hot zones of the SSM. Without the use of consumable cryogenics, the SSM performed group type identification to differentiate the main classes of compounds relevant in bitumen analysis.

3.2. Biomarker Analysis

The exploration and identification of biomarkers is an increasingly popular task in geochemical and petrochemical analyses. Their complex structure provides details on the parent organic molecules due to the little to no change in structure that occurs in sediments, rocks and crude oils over time, which helps determine oil’s origin and maturity [18]. Understanding the origin and biochemistry of these biomarkers is important to distinguish the different life forms and environmental habitats that contributed to the source rock, sediment and petroleum [18]. There are three domains of life which distinguish the origin of a biomarker: archae, eubacteria and eukarya [18]. Archae and eubacteria are classified as prokaryotes, characterized by their biochemistry and habitats in which they grow and further classified based on their simple morphology. Eukarya is classified as eukaryotes, characterized by their morphology. Prokaryotes consist of millions of unicellular species [18]. Eukaryotes contain a membrane-bound nucleus and complex organelles [18]. Examples of eukaryotes include algae, protozoa and fungi. Another important distinction between prokaryotes and eukaryotes is the type of lipid membrane [18]. Prokaryotes use hopanoids within the lipid membrane, while eukaryotes utilize steranes. This accounts for the large presence of steranes and hopanes in petroleum. Ultimately, lipids are the principle source of many compounds in petroleum, including the common saturated biomarkers [18].
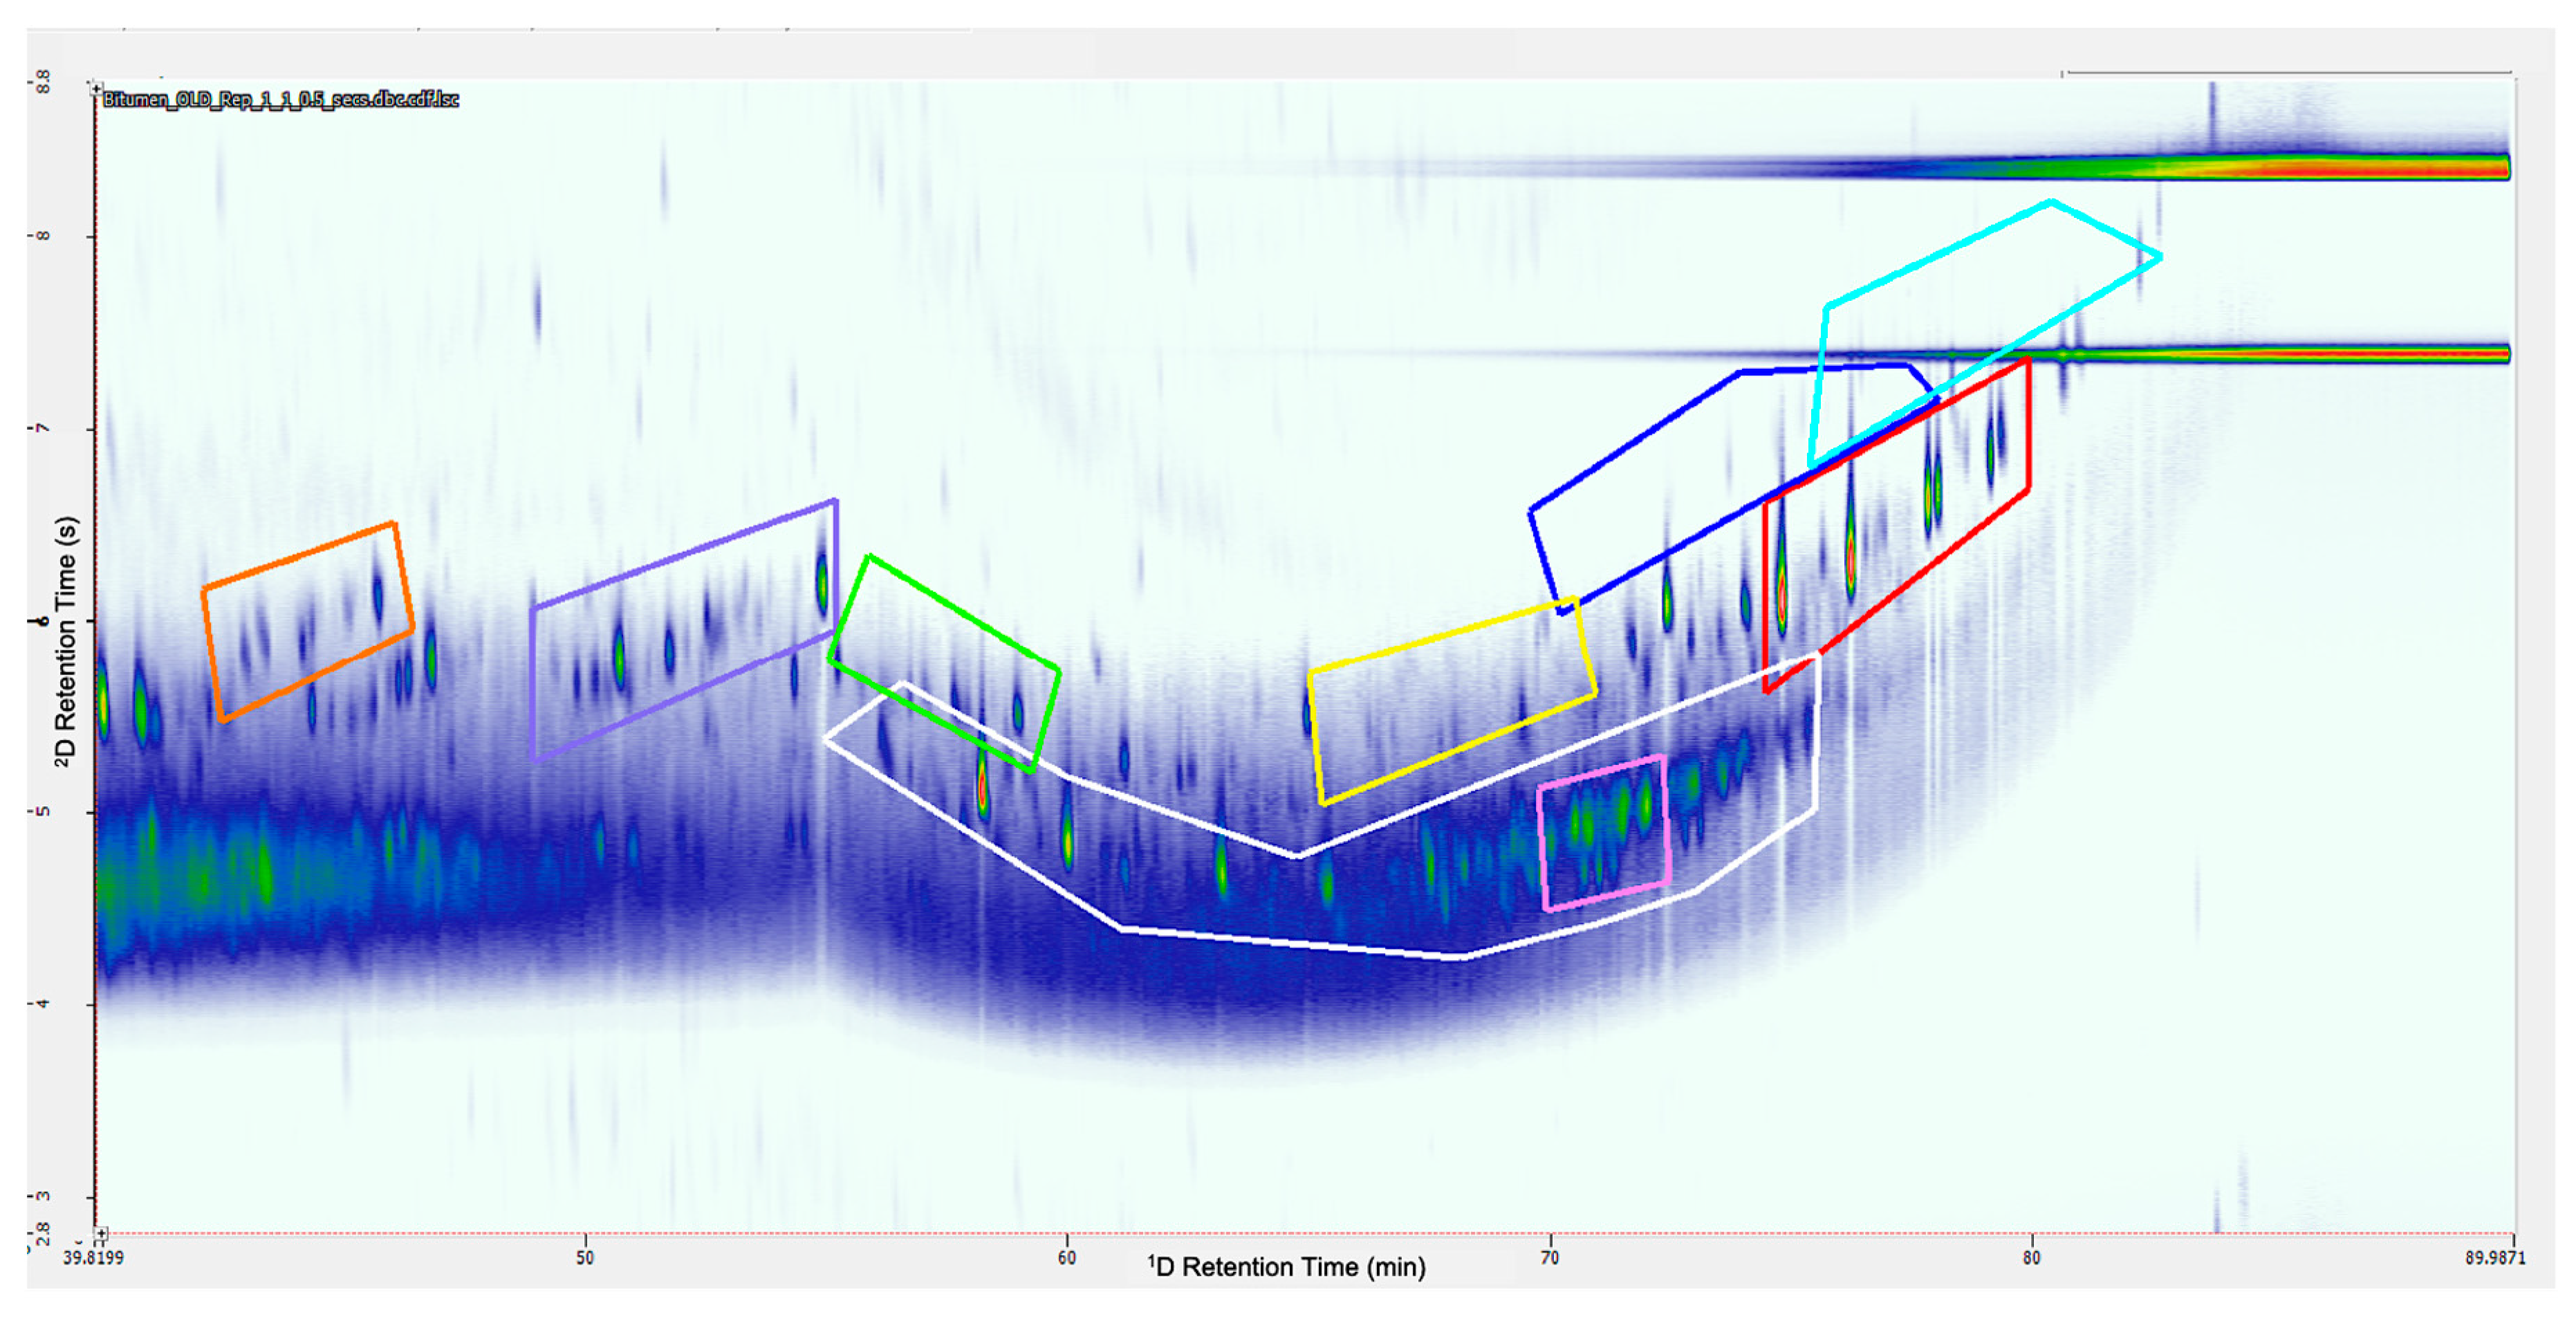
To further break down the general groups identified in Section 3.1, EICs specific to characteristic biomarkers were used to tentatively identify homologous groups. Three series of alkyl steranes, (1) C2 & C3, (2) C4 & C5 and (3) C6, were identified, indicated by the orange, purple and green boxes in Figure 4, respectively. Specifically, m/z 245 and 246 (C2 & C3), m/z 287 and 288 (C4 & C5) and m/z 301 and 302 (C6) were used. These compounds were of relatively high abundance within the chromatogram and easy to identify visually since they were not at trace levels. Typically, these compounds are at low abundance and difficult to detect due to coelutions with other steranes and methyl steranes [16]. Their presence can be used for oil-source rock correlations for origin determination [16,19]. Cyclic terpanes, including the tri-, tetra- and penta-series, were tentatively identified with m/z 191, noted as the white box in Figure 4 [3,16]. As a late eluting group in the 1D and an early eluting group in the 2D, the compounds have a relatively non-polar nature. This allowed for differentiation of the terpanes from the hopanes, based on the roof-tile effect. These compounds were found in high abundance. All species contributed to the terpane fingerprint in order to relate source rocks to oil samples, as well as to evaluate the thermal maturity and biodegradation of the oil [19]. It is suggested that most terpanes in petroleum samples originate from prokaryotic bacteria [19]. Methyl steranes were differentiated from alkyl steranes by monitoring the ions at m/z 231, indicated as the teal box in Figure 4 [4,16]. Found at trace levels, these compounds were not easy to identify in the TIC. The EIC assisted in making their presence more prominent. Methyl steranes have been suggested to assist in differentiating between marine versus non-marine bacteria [19]. Diasteranes were identified by m/z 259, indicated as the pink box in Figure 4 [3,18]. As seen in Figure 4, these compounds lie within a section labeled as cyclic terpanes. Even with GC×GC, the separation of diasteranes from cyclic terpanes was not achieved. By using EIC with diagnostic ions, these two groups were identified, showing the power of the additional dimension of information that TOFMS brings to the analysis. A high diasteranes/sterane ratio within crude oils has been shown to be the result of high thermal maturity and/or high biodegradation [19]. Monoaromatic sterane stencils used m/z 253 (yellow box), while triaromatic sterane stencils used m/z 231 (blue box) as seen in Figure 4 [17,18]. The monoaromatic steranes were found in slightly higher amounts than the triaromatic steranes. The latter species were difficult to visualize in the TIC, and EIC was required to confirm their presence within the sample. Due to biodegradation, the monoaromatic and triaromatic steranes are found in smaller quantities when compared to methylhopanes [17]. The monoaromatic species have been connected to determining the type of eukaryotic bacteria that was present in the deposition environment of the oil sample [19]. Additionally, the triaromatic species are said to be more sensitive to thermal maturity, since they originate from the aromatization of monoaromatic species, which causes them to lose a methyl group [19]. The final group, methyl hopanes, was identified by m/z 205 (red) [6]. These compounds were found in high abundance and easily identified. They are helpful in determining the type of prokaryotic source input of the deposition environment [19]. The focusing effect provided by the SSM produced narrow second dimension peaks, resulting in increased resolution for the separation of compounds that would typically co-elute. Granularity was evident within the biomarker region of a complex bitumen sample without the use of cryogens.

3.3. Biomarker Identification

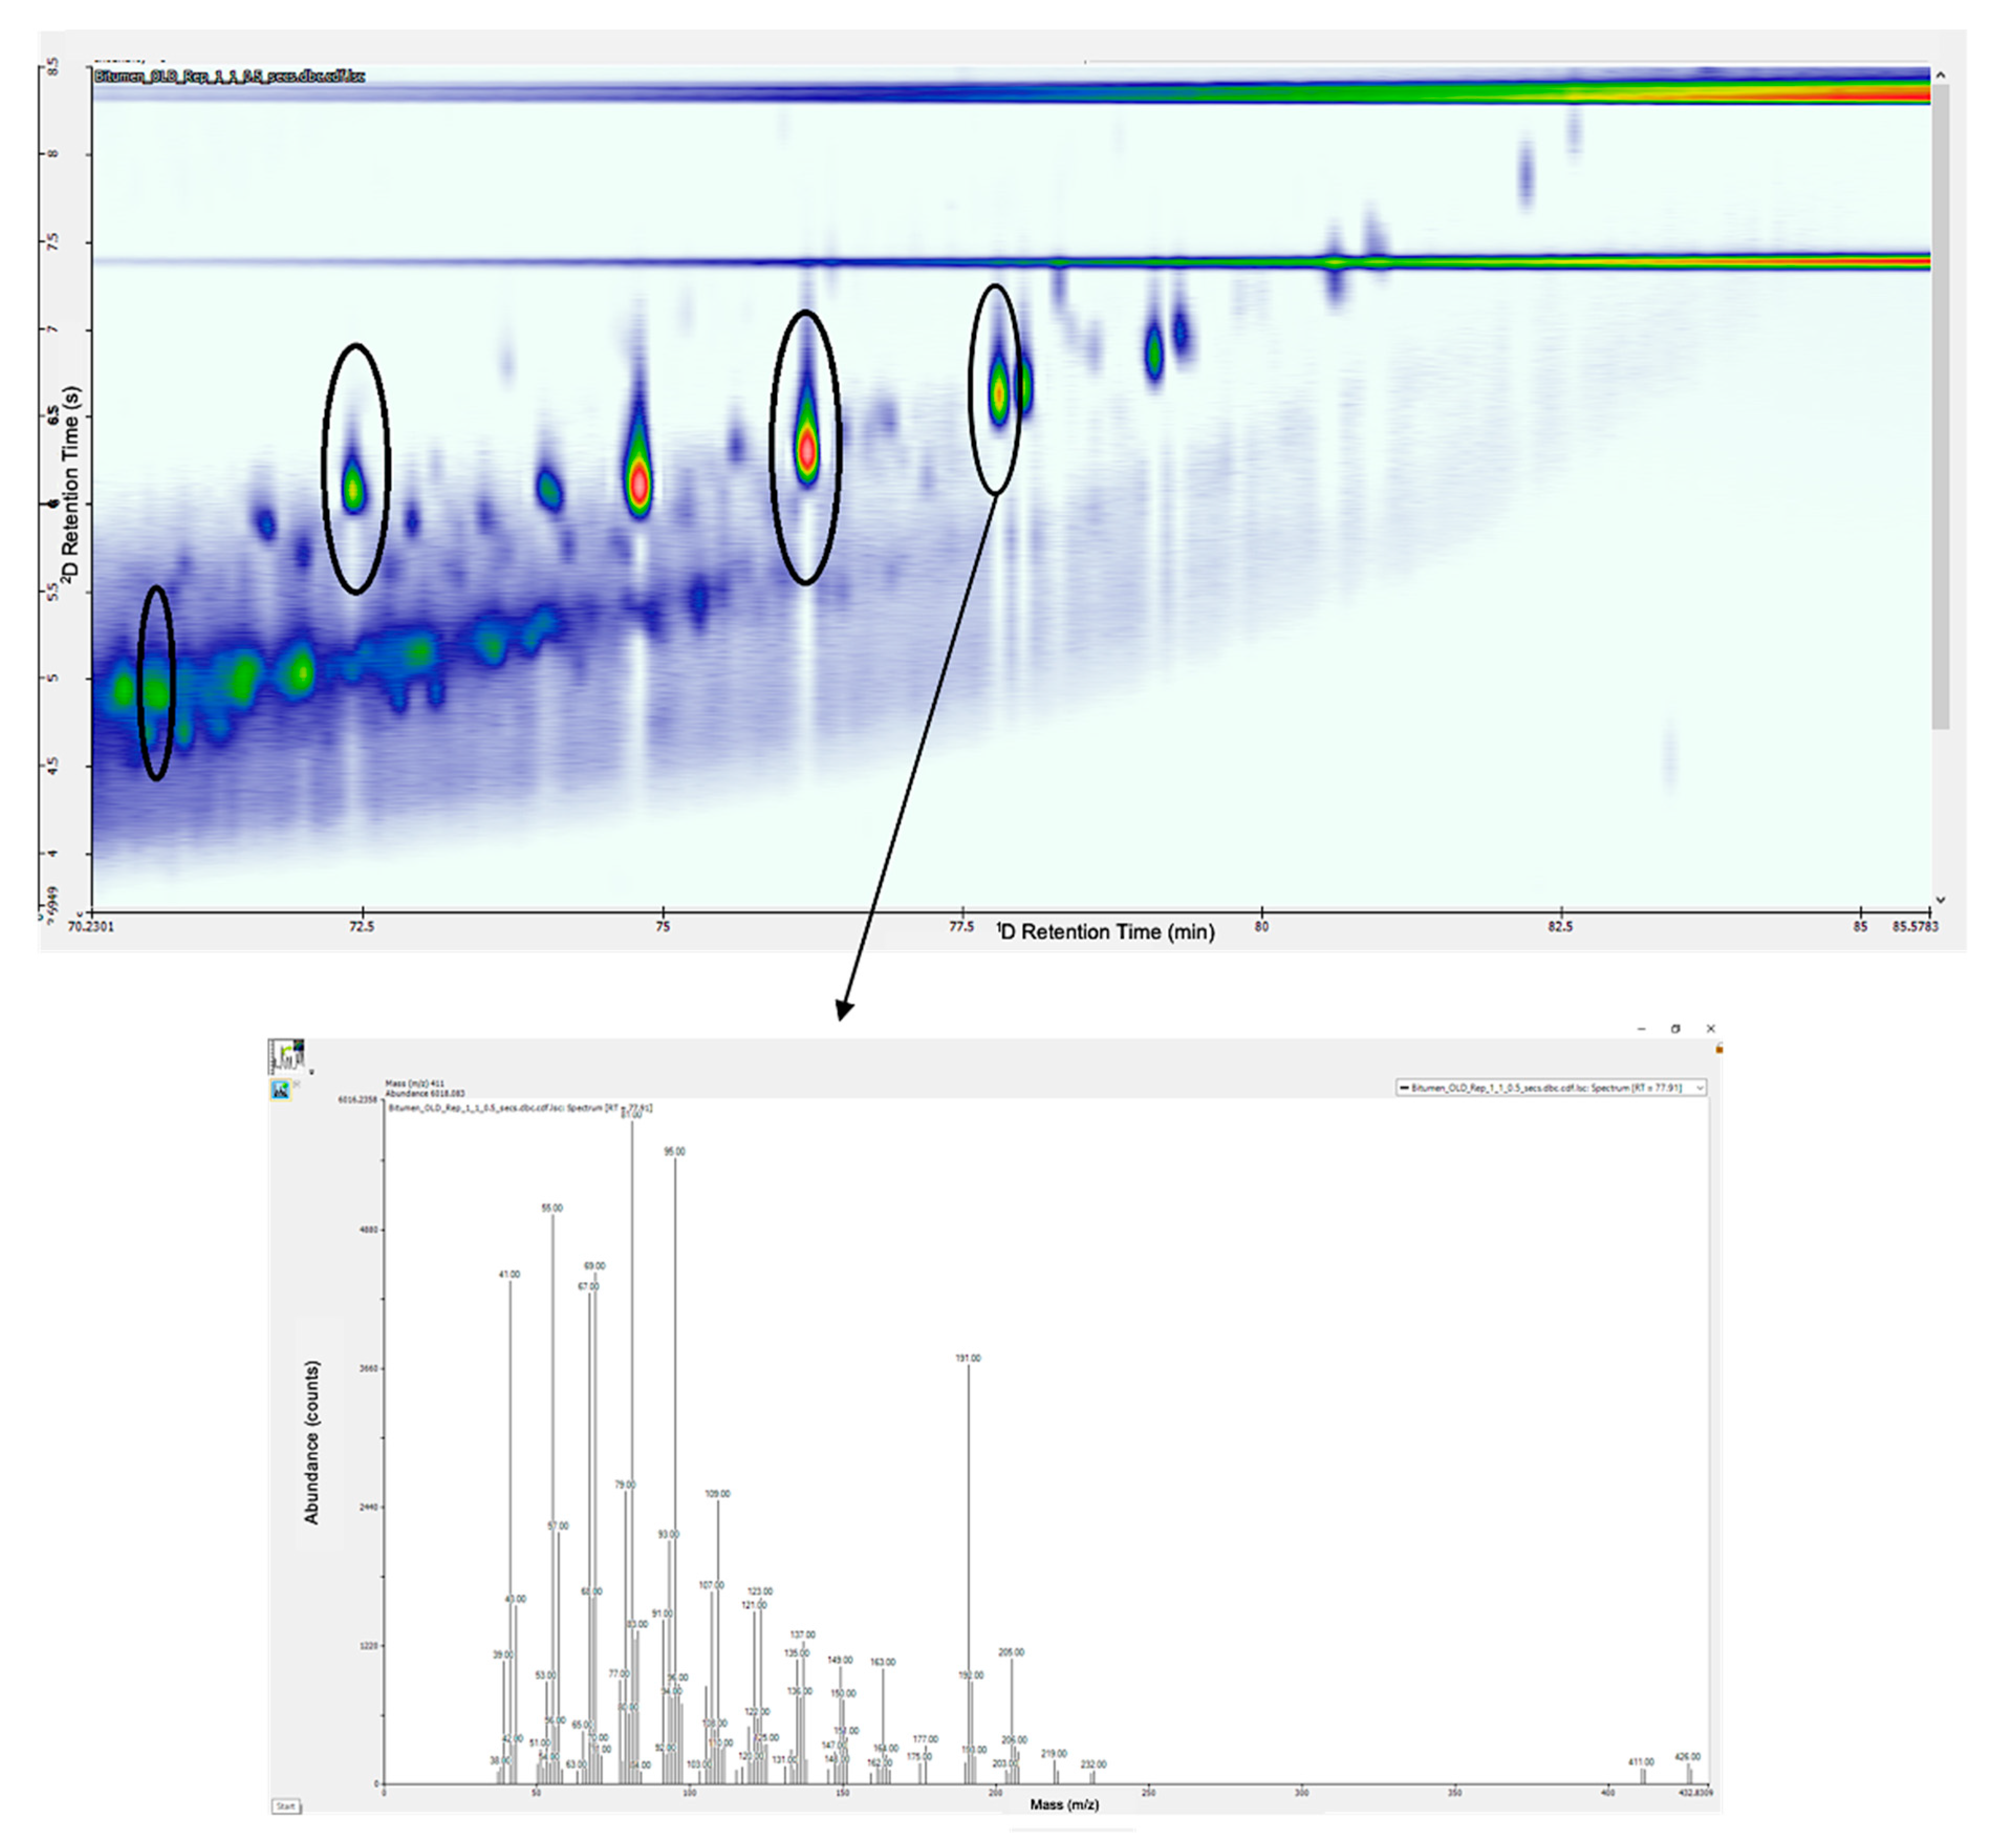
Tentative identification of three specific established biomarkers; 24-ethyl-5 α (H)-14 β (H), 17 β (H)-20R-cholestane (C29 α β β -20), 17 α (H)-22,29,30-trisnorhopane (Tm) and 17 α (H)-21 β (H)-hopane (H30), was carried out based on EIC and confirmation of the molecular ion peak. All three biomarkers were identified in the cyclohexane extract of the oil sand bitumen sample. As seen in Figure 5A, C29 α β β -20, eluting at a 1D retention time of about 71 min was initially identified when evaluating the m/z 217 for steranes in the group analysis. The compound identity was confirmed based on an analogous mass spectrum found in the literature [6]. EICs assisted in extracting the individual compounds since cyclic terpanes and diasteranes were found in low abundances and overlapping within the biomarker region. Typically, the C29 α α α -20 isomer ratios are specific for the immature-to-mature range and will increase proportionally with thermal maturity [6]. However, it is suggested that the C29 α β β -20 can be used in combination with the C29 α α α -20 to determine the levels of thermal maturity [6]. Additionally, the ratio of diasteranes has been used in distinguishing crude oil from carbonate and shale source rocks.
Figure 5B displays the mass spectrum for the characteristic hopane Tm, based on the EIC for m/z 191 and corresponding mass spectra found in the literature [6]. This compound is of great significance due to its use in determining the thermal maturity based on the ratio between Tm and 18 α (H)-22,29,30-trisnorneohopane (Ts). When the ratio Ts/(Ts + Tm) increases, the oil is determined to be more mature due to the greater thermal stability of Ts compared to Tm [6,20]. A high ratio may also be indicative of bitumen from a hypersaline source rock [19]. The Tm species was extremely prominent in the oil sands bitumen; however, an authentic standard or further mass spectral investigation would be required to ensure Ts was not present.
The final compound, H30, was tentatively identified using the same EIC m/z 191 as Tm; however, the molecular ion was different, as seen in Figure 5C [6]. Upon further investigation, this compound was tentatively identified as one of three petroleum biomarkers, namely 17 β -21 β -hopane and 17 β -21 α (H)-hopane, within a stereoisomeric series of hopanes ranging from C27–C35 [18]. H30 is characteristic of greater thermodynamic stability when compared to the other series and the β β series are typically not found in petroleum due to their thermal instability during catagenesis [18]. The presence of H30 was distinct within the bitumen oil sands and was identified based on the corresponding mass spectra published in the literature [6]. This compound is indicative of bacteriohopanetetrol and bacteriohopanes as precursors in source rocks and crude oil [18]. However, this compound is similar in nature to gammacerane, a non-hopanoid triterpane, which contains the same formula (C30H52), molecular ion of m/z 412, and diagnostic fragment ion of m/z 191 [18]. This compound has been found to be more resistant to biodegradation than hopanes and is highly specific to water-column stratification during source-rock deposition [19]. When large amounts of gammacerane are present in crude oil, it is indicative of hypersaline conditions during deposition [19]. Without an authentic standard, positive identification of this compound could not be confirmed.
A noteworthy compound was detected within the methyl hopane region, as seen in Figure 6; however, it could not be identified. Initially, the compound was believed to be 2 α -methyl-hopane C31 (2 α MH C31), based on the EIC m/z 205 and identification in the literature [5]. Research shows that 2 α MH is indicative of oxygen producing cyanobacteria and commonly found in samples of marine origin [5,19]. On the other hand, it has also been shown that thermally mature oils from carbonate source rocks have the highest 2 α MH indices, due to 2 α MH requiring cracking from kerogen to be present, which is an uncommon process in immature bitumen [19]. After further assessment, it was clear that the ratio of m/z 191 and 205 did not agree with that of 2 α MH C31. Furthermore, the oil sands bitumen sample did not contain an m/z 259 ion. With a higher retention in both dimensions compared to the previously identified hopanes and an intense m/z 191 fragment ion in comparison to the m/z 205 fragment, the compound was tentatively classified as a C31 late eluting terpane [4]. The SSM performed comparably in the tentative identification of specific characteristic biomarkers through detailed trace analysis.

3.4. Evaluation of Modulator Performance

The SSM was found to be comparable to the cryogenic platforms for group type analysis and tentative identification of characteristic biomarkers, without the use of cryogenic consumables. Despite this advantage, the limitations and drawbacks of this platform must be understood. The cryogen-free versions help reduce the operating cost, but the modulation volatility range is reduced. For example, LECO’s cryogen-free thermal modulator can modulate compounds in a range from C8 to C40. For the SSM, the modulation volatility range can be optimized by choosing a proper modulation column. However, due to the limited ranges of volatilities available, it may be difficult to achieve a complete separation with a single modulation column. With four varying modulation columns, the platforms can be optimized accordingly; however, this might require the column to be changed for each application. The HV series used for the analysis of bitumen provided a sufficient modulation range to characterize the majority of the sample. It was somewhat limited in the biomarker region due to the upper modulation range of C30. When directly compared to the upper modulation range of a cryogen-free LECO system, the SSM was limited. The cryogen-free versions of cryogenic modulator platforms have a range of C8 to C40 [21,22]. On the other hand, cryogenic modulators cover a modulation range of approximately C4 to at least C40 or higher [21,23].
In comparison to non-moving cryogenic thermal platforms, the SSM might be less robust due to the moving parts that could lead to column breakage and more routine maintenance. Graphite rollers were implemented by the manufacturer to facilitate the movement of the modulation column and reduce the wear of the polyimide exterior coating. According to the manufacturer, the rollers should be replaced every 100,000 modulations as preventative maintenance [13]. Repeated movement of the modulation column also limits its lifetime to approximately 500,000–1,000,000 modulations, which requires the users to change the column for preventative maintenance [13]. The additional routine maintenance required for the continuous operation of the SSM is its drawback. The potential of modulation column breakage, if it is not replaced according to the maintenance schedule, could lead to issues with detectors under the vacuum, such as the mass spectrometer. Despite these drawbacks, the SSM does not require cryogenic consumables to obtain narrow peak widths, resulting in reduced operating costs. Additionally, the modulator can be easily installed on an existing GC system, allowing for a smooth transition from a one-dimensional to a two-dimensional separation. Understanding the advantages and disadvantages of various modulation platforms is critical when determining the appropriate modulator for a given task.

4. Conclusions

Cryogen-free thermal modulation was successfully used with GC×GC-TOFMS for the analysis of bitumen oil sands for the first time. Without the need for expensive cryogens, the SSM offers an alternative platform with comparable performance to other commercial thermal interfaces. Total group and biomarker analyses were performed to differentiate classes of homologous compounds within a complex matrix. Detailed characterization of these groups was performed using extracted ion chromatograms for diagnostic m/z ions. Distinguishing biomarkers, including 24-ethyl-5 α (H)-14 β (H), 17 β (H)-20R-cholestane (C29 α β β -20), 17 α (H)-22,29,30-trisnorhopane (Tm) and 17 α (H)-21 β (H)-hopane (H30) were tentatively identified based on EIC and confirmation of the molecular ion. Their determination is vital in evaluating the thermal maturity, source rock and oil origin, and possible precursor bacteria and biodegradation processes involved. Overall, GC×GC-TOFMS with an SSM platform can be applied for the analysis of biomarkers in bitumen.

Author Contributions

Conceptualization, methodology and writing H.B.; experiments H.B. and K.T.C.; writing—review and editing, supervision and funding acquisition, T.G. All authors have read and agreed to the published version of the manuscript.

Funding

This research was funded by Natural Sciences and Engineering Research Council of Canada (NSERC).

Acknowledgments

J&X Technologies is gratefully acknowledged for the loan of the SSM modulator.

Conflicts of Interest

The authors declare no conflict of interest. The funders had no role in the design of the study; in the collection, analyses, or interpretation of data; in the writing of the manuscript, or in the decision to publish the results.

References

  1. Afework, B.; Hanania, J.; Jenden, J.; Stenhouse, K.; Donev, J. Energy Education-Bitumen, University of Calgary. 2018. Available online: https://energyeducation.ca/encyclopedia/Bitumen (accessed on 30 June 2019).
  2. Canada’s Oil & Natural Gas Producers. Oil Sands. Available online: https://www.capp.ca/canadian-oil-and-natural-gas/oil-sands (accessed on 30 June 2019).
  3. Aguiar, A.; Silva Junior, A.I.; Azevedo, D.A.; Aquino Neto, F.R. Application of comprehensive two-dimensional gas chromatography coupled to time-of-flight mass spectrometry to biomarker characterization in Brazilian oils. Fuel 2010, 89, 2760–2768. [Google Scholar] [CrossRef]
  4. Aguiar, A.; Aguiar, H.G.M.; Azevedo, A.; Aquino Neto, F.R. Identification of Methylhopane and Methylmoretane series in Ceara Basin Oils, Brazil, using comprehensive two-dimensional gas chromatography coupled to time-of-flight mass spectrometry. Energy Fuels 2011, 25, 1060–1065. [Google Scholar] [CrossRef]
  5. Silva, R.S.; Aguiar, H.G.; Rangel, M.D.; Azevedo, D.A.; Awuino Neto, F.R. Comprehensive two-dimensional gas chromatography with time of flight mass spectrometry applied to biomarker analysis of oils from Colombia. Fuel 2011, 90, 2694–2699. [Google Scholar] [CrossRef] [Green Version]
  6. Forsythe, J.C.; Omerantz, A.E.; Seifert, D.J.; Wang, K.; Chen, Y.; Zuo, Y.; Nelson, R.K.; Reddy, C.M.; Schimmelmann, A.; Sauer, P.; et al. A geological model for the origin of fluid compositional gradients in a large Saudi Arabian oilfield: An investigation by two-dimensional gas chromatography (GC×GC) and asphaltene chemistry. Energy Fuels 2015, 29, 5666–5680. [Google Scholar] [CrossRef]
  7. J&X Technologies. Analysis of the Chemical Composition of Kerosene by GC×GC-FID (Document No. E103); J&X Technologies: Shanghai, China, 2018. [Google Scholar]
  8. J&X Technologies. Group Analysis of Light Cycle Oil (LCO) by Comprehensive Two-Dimensional Gas Chromatography (Document No. E101); J&X Technologies: Shanghai, China, 2018. [Google Scholar]
  9. J&X Technologies. Group Analysis of Diesel by Comprehensive Two-Dimensional Gas Chromatography (Document No. E102); J&X Technologies: Shanghai, China, 2018. [Google Scholar]
  10. Zoccali, M.; Giocastro, B.; Tranchida, P.Q.; Mondello, L. Use of a recently developed thermal modulator within the context of comprehensive two-dimensional gas chromatography combined with time-of-flight mass spectrometry: Gas flow optimization aspects. J. Sep. Sci. 2019, 42, 691–697. [Google Scholar] [CrossRef] [PubMed]
  11. Wang, T.; Zhang, C.; Zhao, R.; Zhu, C.; Yang, C.; Liu, C. Solvent extraction of bitumen from oil sands. Energy Fuels 2014, 28, 2297–2304. [Google Scholar] [CrossRef]
  12. Wu, J.; Dabros, T. Process for Solvent Extraction of Bitumen from Oil Sand. Energy Fuels 2012, 26, 1002–1008. [Google Scholar] [CrossRef]
  13. J&X Technologies. Solid State Modulator for Comprehensive Two-Dimensional Gas Chromatography (GC×GC) SSM 1800/1810 Installation and Operation; J&X Technologies: Shanghai, China, 2019. [Google Scholar]
  14. Luong, J.; Guan, X.; Xu, S.; Gras, R.; Shellie, R. Thermal independent modulator for comprehensive two-dimensional gas chromatography. Anal. Chem. 2016, 88, 8428–8432. [Google Scholar] [CrossRef] [PubMed]
  15. J&X Technologies. Principles of SSM. Available online: http://www.jnxtec.com/page111?_1=en (accessed on 4 March 2019).
  16. Walters, C.C.; Wang, F.C.; Higgins, M.B.; Madincea, M.E. Universal biomarker analysis using GCxGC with dual FID and ToF-MS (EI/FI) detection. Org. Geochem. 2018, 115, 57–66. [Google Scholar] [CrossRef]
  17. Nardella, F.; Landi, N.; Degano, I.; Colombo, M.; Serradimigni, M.; Tozzi, C.; Ribechini, E. Chemical investigations of bitumen from Neolithic archaelogical excavations in Italy by GC/MS combined with principal component analysis. Anal. Methods 2019, 11, 1449–1459. [Google Scholar]
  18. Peters, K.E.; Walters, C.C.; Moldowan, J.M. The Biomarker Guide: Volume 1 Biomarkers and Isotopes in the Environment and Human History; Cambridge University Press: Cambridge, UK, 2005. [Google Scholar]
  19. Peters, K.E.; Walters, C.C.; Moldowan, J.M. The Biomarker Guide: Volume 2 Biomarkers and Isotopes in Petroleum Exploration and Earth History; Cambridge Univeristy Press: Cambridge, UK, 2005. [Google Scholar]
  20. Scarlett, A.G.; Despaigne-Diaz, A.I.; Wilde, S.A.; Grice, K. An examination by GC×GC-TOFMS of organic molecules present in highly degraded oils emerging from Caribbean terrestial seeps of Cretaceous age. Geosci. Front. 2019, 10, 5–15. [Google Scholar] [CrossRef]
  21. LECO Corporation. LECO’s GC×GC Utilizing a Consumable-Free Modulator and Second Column Modulation; LECO Corporation: St. Joseph, MI, USA, 2013; Available online: https://www.leco.com/component/edocman/?task=document.viewdoc&id=1161&Itemid=1161 (accessed on 30 June 2019).
  22. ZOEX Corporation. Introducing the NEW ZX-2 Closed Cycle Refrigeration Thermal Modulated GC×GC System. Available online: http://zoex.com/wp-content/uploads/2012/07/ZX2-Product-Specs.pdf (accessed on 30 June 2019).
  23. ZOEX Corporation. ZX-1 Thermal Modulation GC×GC System. Available online: http://zoex.com/wp-content/uploads/2012/07/ZX1-Product-Specs.pdf (accessed on 30 June 2019).
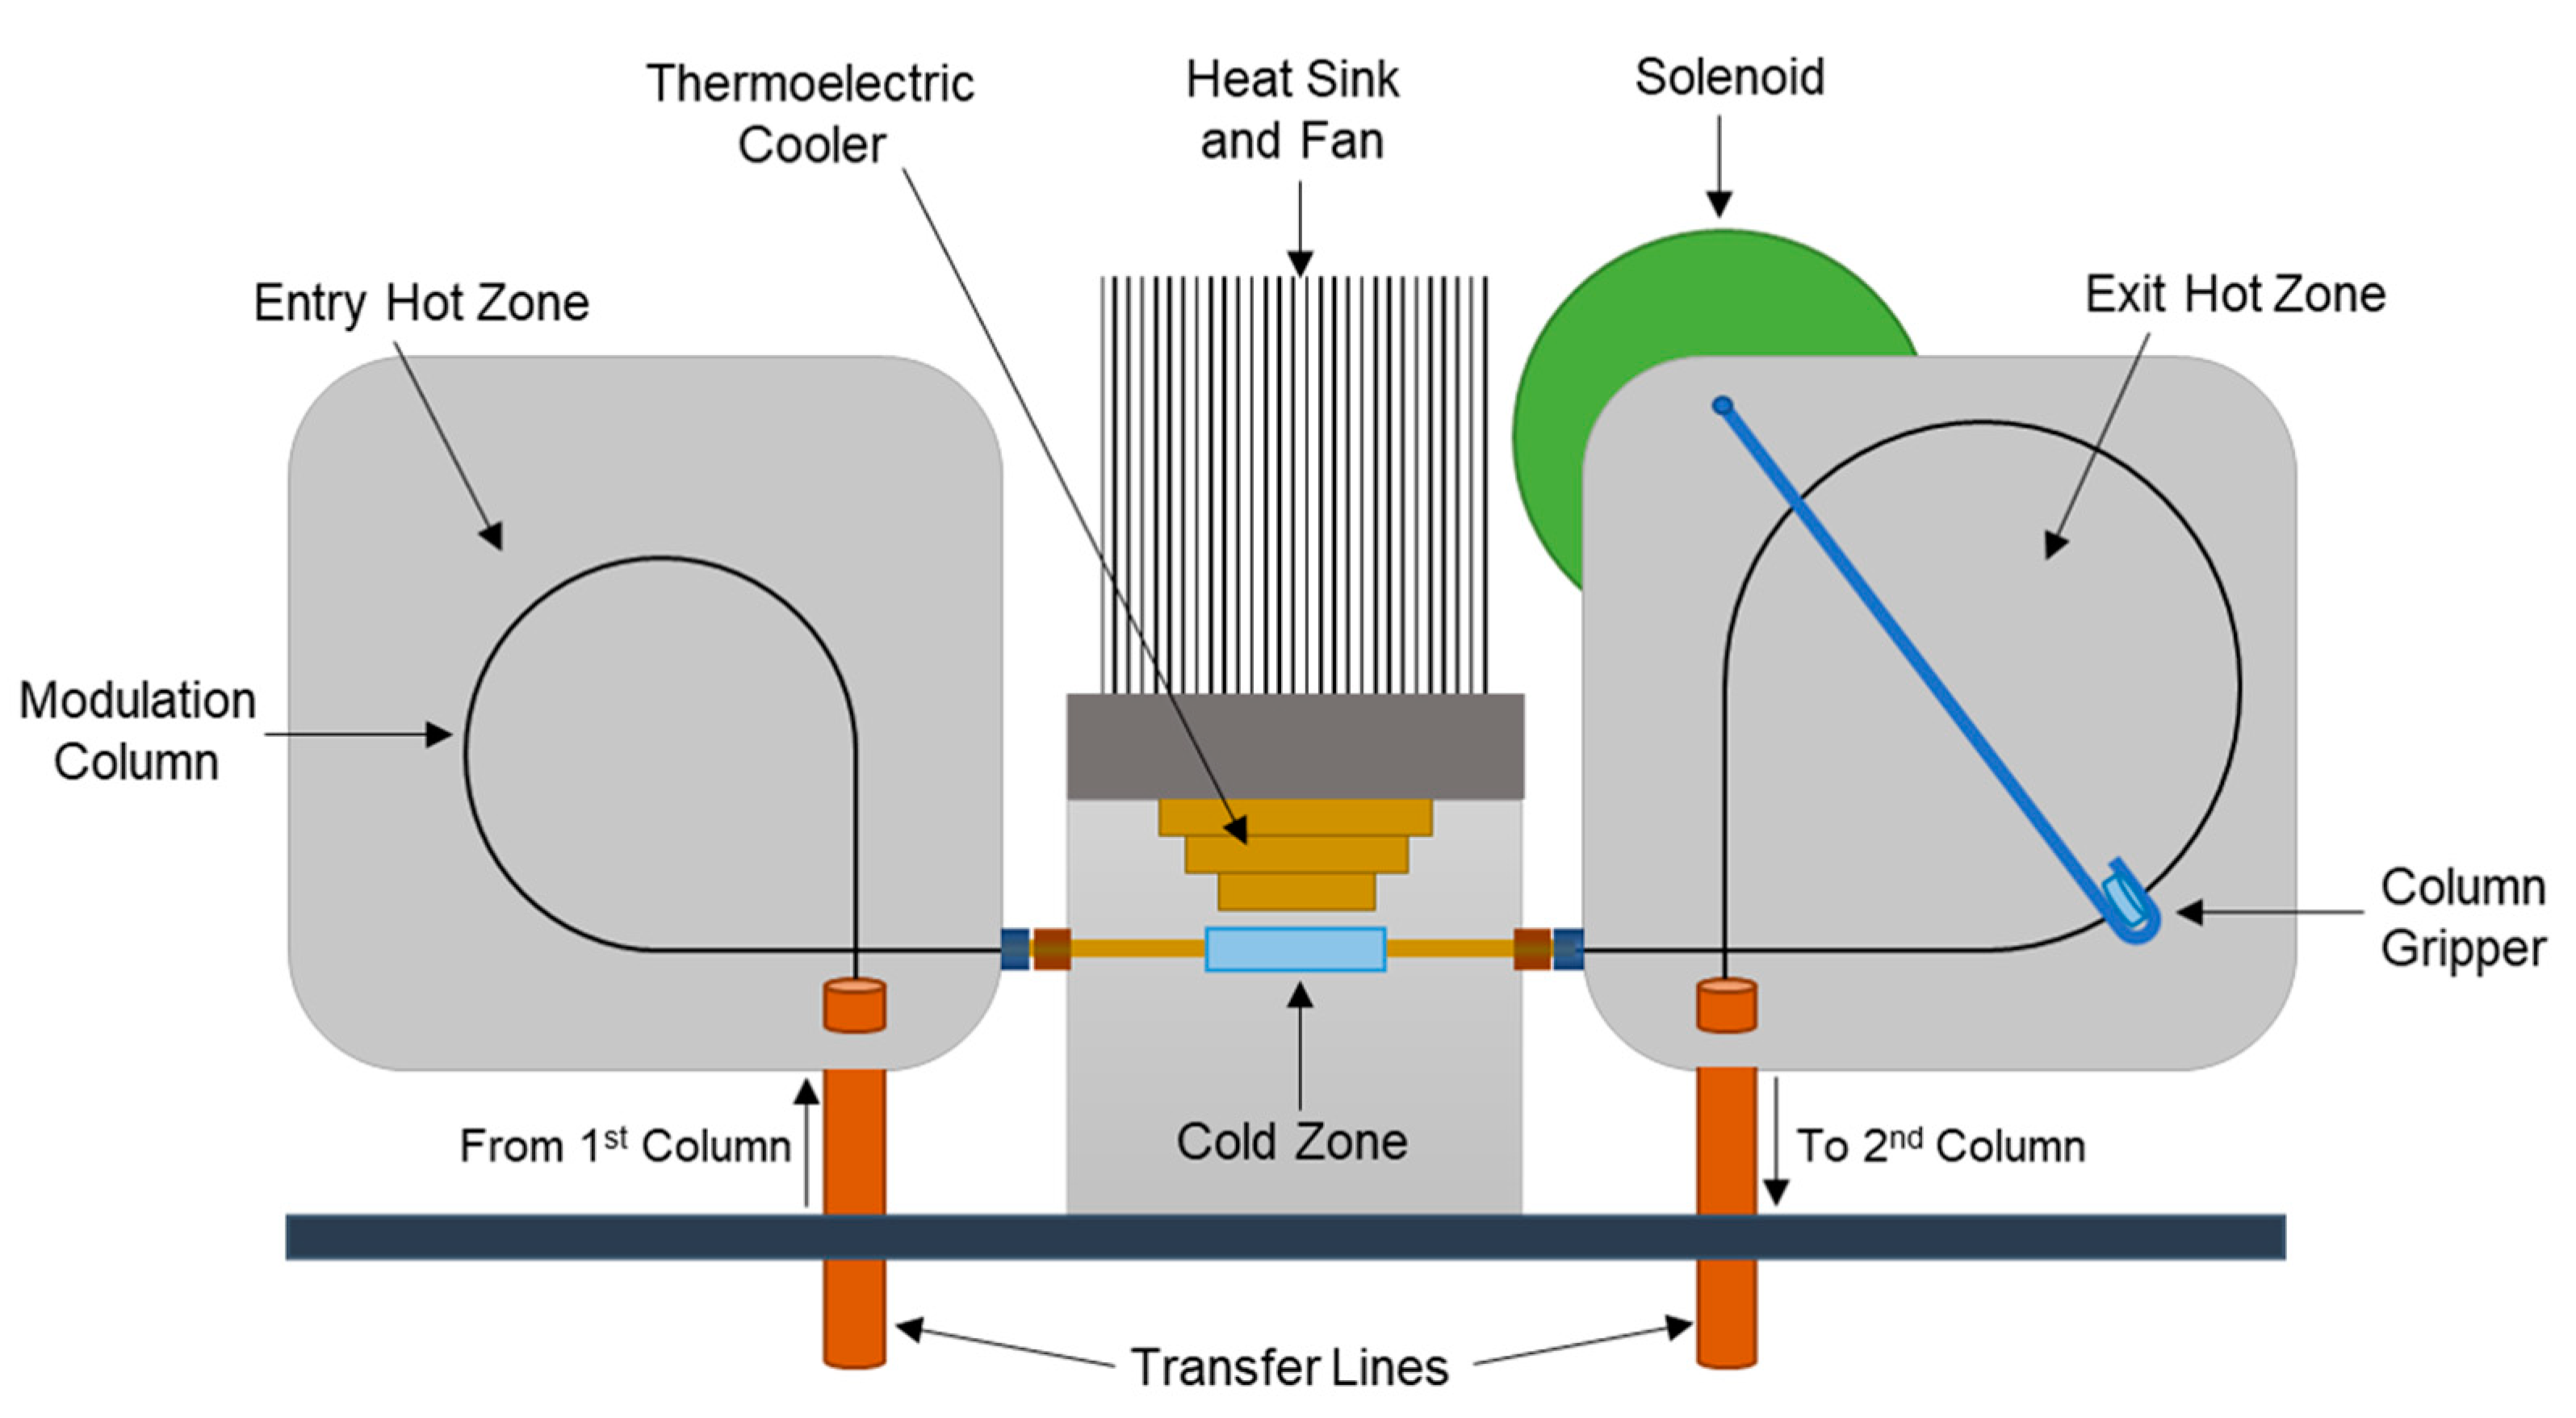
Figure 1. Schematic of the solid-state modulator, based on Reference [13].
Separations 07 00013 g001
Figure 2. Diagram of dual-stage modulation in the SSM, based on Reference [13,15].
Separations 07 00013 g002
Figure 3. Group type identification of bitumen oil sands extracted with cyclohexane. The various colored boxes correspond to specific groups: paraffins (orange), alkylated steranes (red), terpanes (green) and hopanes (purple).
Separations 07 00013 g003
Figure 4. Biomarker analysis of bitumen oil sands extracted with cyclohexane. The colored boxes correspond to various biomarker groups: C2 & C3 alkylated steranes (orange), C4 & C5 alkylated steranes (purple), C6 alkylated steranes (green), cyclic terpanes (white), diasteranes (pink), monoaromatic steranes (yellow), triaromatic steranes (blue), methyl hopanes (red) and methyl steranes (teal).
Separations 07 00013 g004
Figure 5. Tentative identification of three characteristic biomarkers in the biomarker region of the cyclohexane extract. The compounds (A) 24-ethyl-5 α (H)-14 β (H), 17 β (H)-20R-cholestane (C29 α β β -20) (B) 17 α (H)-22,29,30-trisnorhopane (Tm), and (C) 17 α (H)-21 β (H)-hopane (H30) were identified by EIC and molecular ion peak.
Separations 07 00013 g005
Figure 6. Mass spectrum of a C31 late eluting terpane found in the cyclohexane bitumen oil sands extract.
Separations 07 00013 g006