Article

Estimating Diphenylamine in Gunshot Residues from a New Tool for Identifying both Inorganic and Organic Residues in the Same Sample

by
Ana Isabel Argente-García
1,
Lusine Hakobyan
1,
Carmen Guillem
2 and
Pilar Campíns-Falcó
1,*
1
MINTOTA Research Group, Departament de Química Analítica, Facultat de Química, Universitat de València, Dr. Moliner 50, Burjassot, 46100 Valencia, Spain
2
Institut de Ciència dels Materials (ICMUV), Universitat de València, P.O. Box 22085, 46071 Valencia, Spain
*
Author to whom correspondence should be addressed.
Separations 2019, 6(1), 16; https://doi.org/10.3390/separations6010016
Submission received: 10 January 2019 / Revised: 15 February 2019 / Accepted: 26 February 2019 / Published: 19 March 2019
(This article belongs to the Special Issue Five Years of Separations: Feature Paper 2018)

Abstract

:
A method involving the collection and determination of organic and inorganic gunshot residues on hands using on-line in-tube solid-phase microextraction (IT-SPME) coupled to miniaturized capillary liquid chromatography with diode array detection (CapLC-DAD) and scanning electron microscopy coupled to energy dispersion X-ray (SEM-EDX), respectively, for quantifying both residues was developed. The best extraction efficiency for diphenylamine (DPA) as the main target among organic residues was achieved by using a dry cotton swab followed by vortex-assisted extraction with water, which permits preservation of inorganic residues. Factors such as the nature and length of the IT-SPME extractive phase and volume of the sample processed were investigated and optimized to achieve high sensitivity: 90 cm of TRB-35 (35% diphenyl, 65% polydimethylsiloxane) capillary column and 1.8 mL of the processed sample were selected for the IT-SPME. Satisfactory limit of detection of the method for analysis of DPA deposited on shooters’ hands (0.3 ng) and precision (intra-day relative standard deviation, 9%) were obtained. The utility of the described approach was tested by analyzing several samples of shooters’ hands. Diphenylamine was found in 81% of the samples analyzed. Inorganic gunshot residues analyzed by SEM-EDX were also studied in cotton swab and lift tape kit samplers. Optical microscopy was used to see the inorganic gunshot residues in the cotton swab samplers. The lift tape kits provided lesser sensitivity for DPA than dry cotton swabs—around fourteen times. The possibility of environmental and occupational sources could be eliminated when DPA was found together with inorganic residues. Then, the presence of inorganic and organic residues in a given sample could be used as evidence in judicial proceedings in the forensic field.

1. Introduction

Chemical and physical evidence such as gunshot residues (GSRs) from firearms discharge may provide valuable forensic information [1,2]. Gunshot residues are organic and inorganic components in nature, which can be deposited on a shooter’s body, mainly onto the index fingers and thumbs of the hands, after discharging a firearm [3]. A suspect can be successfully identified if GSRs are reliably analyzed. Thus, the detection of these compounds plays an important role in the field of forensic science. Inorganic gunshot residues (IGSRs) are usually spherical particles mainly composed of Ba, Pb, and Sb [4]. Other elements such as Ca, Al, Cu, Fe, Zn, Ni, Si, and K can also be found [5], although they are more prevalent in the environment than Pb, Ba, and Sb [6]. The size of these particles is usually from 0.5 µm to 10 µm, although sizes up to 100 µm have also been reported [7]. The presence of these metallic particles has been traditionally confirmed by scanning electron microscopy coupled to the energy dispersion X-ray (SEM-EDX) technique due to its non-destructive capability to perform both morphological and elemental analyses [8,9]. However, the analysis of IGSRs has its limitations. False positive results can be produced from inorganic particles derived from environmental and occupational sources [10,11,12,13], which is a problem when considering IGSRs as evidence in judicial proceedings in the forensic field. The analysis of organic gunshot residues (OGSRs) in the same sample could provide complementary information that could strengthen the probative value of a forensic sample. Organic components originate mostly from the propellant, and their composition depends on the commercial brand and ammunition type.
An important component of gun propellants is diphenylamine (DPA), which is used as a stabilizer in order to prevent the decomposition of explosive products like nitrocellulose and nitroglycerine, both of them present in many smokeless powders used as propellants [14]. Thus, this stabilizer may remain on a shooter’s hands, and it may be used as an indicator of gunshot residues [15]. Diphenylamine detection could provide valuable evidence of firearm discharge for the identification of suspects in firearm-related crimes.
The low amount of DPA remaining on a shooter’s hands requires highly-sensitive analytical techniques for its detection. In order to improve the sensitivity, many methods include off-line sample treatment, which involves time-consuming and tedious steps. Table 1 presents several methods used for extraction and determination of DPA that remains on the hands. The main drawback of the reported methods is the low detection limit required, taking into account the sampling and extraction process, time of analysis, and greenness of the procedure.
On-line sample pre-treatment has become an interesting alternative as green analytical chemistry indicates. In this context, our research group has successfully applied in-tube solid-phase microextraction (IT-SPME) in the analysis of a variety of analytes and matrices [19,20]. In-tube solid-phase microextraction typically uses a capillary column internally coated with extractive phase, which can be different in nature in function of the physical-chemical properties of the analytes [19,20], in order to extract, concentrate, and clean-up the sample. When IT-SPME is coupled to a miniaturized liquid chromatograph, important improvements in terms of sensitivity, selectivity, automation, and waste minimization can be achieved. Although mass spectrometry (MS) coupled to gas chromatography (GC) or liquid chromatography (LC) offers suitable sensitivity, the chromatographic techniques can present issues. Thermal degradation of DPA can occur by GC and the wide range of polarities of compounds present in GSRs can limit the LC. Some methods have also successfully identified DPA using several MS techniques without any chromatographic system such as tandem mass spectrometry (MS–MS) [16], desorption electrospray ionization-mass spectrometry (DESI-MS) [17], nanoelectrospray ionization mass spectrometry (nESI-MS) [21], and ion mobility spectrometry (IMS) [22]. However, IT-SPME coupled to capillary liquid chromatography (CapLC) contributes to increase the sensitivity and sample clean-up in an on-line way. Additionally, the miniaturization of the LC technique (i.e., low column dimensions, low flow rates, low amount of wastes) contributes also to achieve improved sensitivity, which can permit the use of diode array UV-detectors (DADs), which cost less than an MS detector.
In the present work, a shooters’ hands sampling was carried out using dry cotton swabs followed by short vortex-assisted extraction of DPA from cotton with water. Additionally, on-line IT-SPME-CapLC-DAD was employed, for the first time to our knowledge, for the DPA determination. Other samplers were also studied, but their extraction capacities were lower than that achieved by a dry cotton swab. Several parameters such as capillary length and coating, as well as extraction conditions, were optimized for the on-line system. On the basis of the results obtained, a new approach is proposed for the detection of DPA from shooters’ hands, which integrates simple, rapid, and green extraction followed by on-line clean-up and preconcentration of samples. The method permits to carry out the analysis of IGSRs by SEM-EDX after the DPA extraction, in order to confirm the presence of inorganic gunshot residues on shooters’ hands as well. Optical microscopy can be used for identifying particles with a spherical shape and size up to 20 µm in a cotton swab due to the presence of gunpowder particles, and it was proved that SEM-EDX can be applied after extracting DPA from the swab. The other aim of this work was to examine the morphology and elemental composition and distribution of GSR particles collected with the lift tape kits, the typical police collector, which provided lesser sensitivity in the DPA analysis (around fourteen times less). The possibility of environmental and occupational sources could be eliminated when DPA was found together with IGSRs. Both analyses can be used as evidence in judicial proceedings in the forensic field [23].

2. Materials and Methods

2.1. Materials

All the reagents were of analytical grade. Acetonitrile (ACN) HPLC grade was supplied by Prolabo (Fontenay-sous-Bois, France). Ethanol, acetone, and DPA were purchased from Scharlau (Barcelona, Spain). Stock standard solution of DPA (10 μg/mL) was prepared by dissolving an adequate amount of DPA in acetonitrile. Working solutions of this compound were prepared by dilution of the stock solution with water. Ultrapure water was obtained from a Nanopure II system (Sybron, Barnstead, UK). All solutions were stored in the dark at 4 °C.
Cotton swabs (100% cotton; 0.03 g of the amount of cotton on each tip) from a local market, double-sided carbon adhesive tape (8 mm wide × 0.16 mm thick × 1 cm long; Ted Pella Inc. Redding, CA, US), and tape lift kits (Adhesive Lifts GRA 200, Sirchie Finger Print Laboratories, Youngsville, NC, USA) were employed as sample collectors. Polydimethylsiloxane (PDMS) Sylgard® 184 Silicone Elastomer Kit containing Sylgard® 184 silicone elastomer base and Sylgard® 184 silicone elastomer curing agent, provided by Dow Corning (Midland, MI, USA) and tetraethyl orthosilicate (TEOS) purchased from Sigma–Aldrich (St. Louis, MO, USA), PDMS, and TEOS were used to prepare several samplers. Polydimethylsiloxane base was mixed with TEOS under vigorous magnetic stirring for 10 min at room temperature. Then, a PDMS curing agent was added with a weight ratio of 1:10 to the PDMS base under magnetic stirring for 10 min at room temperature. Finally, 0.02 g of that blend was deposited on well-plates, and then was cured at 30 °C for hours or a day, depending on the film composition (as TEOS increases, curing time increases too). Several weight ratios of PDMS/TEOS were tested (100/0, 50/50, 30/70). The thickness of the film was 1 mm and the diameter was 15 mm.

2.2. Apparatus and Chromatographic Conditions

The capillary chromatographic system used consisted of a capillary liquid chromatography pump (Agilent 1100 Series, Waldbronn, Germany), a high-pressure six-port valve (7725 Reodhyne, Rohnert Park, CA, USA), an on-line degasser, and an UV-Vis photodiode array detector (Agilent, 1260 Series) equipped with an 80-nL flow cell. The detector was linked to a data system (Agilent, HPLC ChemStation) for data acquisition and calculation. The absorption spectra were recorded between 190 and 400 nm and the chromatograms were monitored at 280 nm. A Zorbax SB-C18 capillary analytical column (150 mm × 0.5 mm i.d., 5 μm particle diameter) was employed for the chromatographic separation (Agilent, Waldbronn, Germany). The mobile phase used was a mixture of acetonitrile:water in gradient elution mode: the initial acetonitrile content was 70% during 1 min, increased to 100% until 12 min, and maintained at 16 min, and then from 16 min to 20 min at 70% acetonitrile. The mobile phase flow rate was 10 µL min−1. All solutions were filtered with 0.45-µm nylon membranes (Teknokroma, Barcelona, Spain) before use.
An ultrasonic bath (300 W, 40 kHz, Sonitech, Guarnizo, Spain) and a ZX3 vortex mixer (40 Hz) from VELP Scientifica (Usmate Velate, Italy) were employed for the lixiviation of the DPA from the sample collectors. An optical microscope (ECLIPSE E200LED MV Series, Nikon Corporation, Tokyo, Japan) under bright-field illumination and using a 10× objective was used to see the collection of inorganic particles on the cotton swab. Nis Elements 4.20.02 software (Nikon Corporation) was used for acquiring the images. In order to test the presence and morphology of IGSRs, scanning electron microscopy (SEM) images were obtained with Hitachi S-4800 FEG (Tokyo, Japan) and Philips XL30 operating at 20 Kv for tape lift kit and cotton swab samples. Au/Pd coating was required. Elemental analysis was performed by an EDX analysis system incorporated into the microscope.

2.3. IT-SPME Procedure

The setup used in this work corresponded to that developed for in-valve IT-SPME [19,20]. The stainless-steel injection loop of a six-port injection valve was replaced with an extractive capillary. Several gas chromatography capillary columns (0.32 mm i.d.) were tested as extractive capillaries. The columns used were TRB-5, TRB-20, TRB-35, TRB-50 (Teknokroma, Barcelona, Spain) and Zebron ZB-WAXplus (Phenomenex, Torrence, CA, USA). For coating details, see Table 2. Segments from 30 to 90 cm of these columns were directly tested for IT-SPME. Capillary connections to the valve were facilitated by the use of 2.5-cm sleeves of 1/16 in polyether ether ketone (PEEK) tubing; 1/16 in PEEK nuts and ferrules were used to complete the connections. In load valve position, 1800 µL of sample was manually passed through the capillary column by means of a 1000-µL precision syringe. A clean-up step was also carried out by processing 120 µL of ultrapure water after the sample loading. Finally, when the valve was manually rotated to the injection position, the analyte was desorbed in dynamic mode from the coating of the extractive capillary and transferred to the analytical column by the mobile phase. The valve was maintained in this position until the end of the chromatogram.

2.4. Shooting and Collection of GSRs from Hands

Test shots were carried out by police officers in an indoor range at Police Headquarters of Valencian Community (Valencia, Spain) under typical shooting practice conditions. Personal information was not recorded. The shots were fired with 9-mm Heckler & Koch pistols, model USP Compact (Oberndorf/Neckar, Germany), which is the most commonly used firearms among police forces in Spain. Each volunteer police officer fired a total number of 25 shots (regulatory number of shots). Only one of these police officers fired 12 shots because his pistol jammed. In order to avoid contamination, each police officer fired with his own firearm and did not touch other surfaces with their hands during the analysis. Gunshot residue samples were collected from the shooters’ hands immediately after discharging the firearm. Sampled zones of the hands are shown in Figure 1. For each police officer, both hands, right and left (palm and back), were sampled after shooting. Two techniques for GSR collection from hands were carried out: swabbing and tape lifting. Swabbing was performed by scrubbing the hand with one of the tips of a cotton swab, which was stored in a 5-mL glass vial with a fitted cap to prevent contamination from other compounds in the air. Note that cotton swabs were not moistened in any solvent before sampling. The tape lift kit consisted of a metal stub equipped with a carbon adhesive tape inserted in a plastic vial with a tightly fitted cap. For the sampling, the metal stub was passed over the surface of the hand and then was returned to the vial. Once all the collected samples were placed back into their vials and capped, they were transported to the lab and were stored at room temperature awaiting analysis. A total of 11 shooters were sampled by swabbing and the other five shooters were sampled by tape lifting, which consisted of a total of 21 swab samples and six tape samples (see Analysis of Samples in the Results and Discussion section for identifying the samples). Additional swab samples from each volunteer police officer before test shots were also analyzed as blanks (hands were not previously washed).

2.5. Sample Treatment for DPA Analysis

Several solvents (water, acetone, ethanol), samplers (cotton swabs, carbon-based tapes, PDMS-TEOS based samplers), extraction techniques (non-assisted, ultrasound-assisted, and vortex-assisted extraction) and time extraction (up to 20 min) were tested in order to find the proper sampling procedure. Three µL of 10 µg/mL in 2 mL of water with different (A) extraction modalities and (B) sample collectors were assayed by IT-SPME-CapLC-DAD. Each sample was analyzed in triplicate and all assays were carried out at ambient temperature.
In order to obtain the solid DPA from standard solutions, a volume (3 µL) of DPA solution (10 µg/mL) in acetonitrile (ACN) was deposited on a glass slide. Then, the solvent was evaporated to dryness at room temperature and solid DPA was collected carefully by scrubbing the glass slide with a cotton swab. After sample collection, the tip of the cotton swab was placed into a storage vial containing 2 mL of water, so that the cotton was completely wetted. Diphenylamine was extracted from the swab under vortex condition for 20 s at ambient temperature. Next, the swab was used in the analysis of inorganic residues, and 1800 µL of the solution was loaded into the IT-SPME capillary of the LC system. The same procedure was used for the other samplers assayed. The complete procedure for the DPA analysis is shown in Figure 1.

2.6. IGSRs Analysis by SEM/EDX and Optical Microscopy

In order to confirm the presence of GSRs in cotton swabs, the gunpowder grains were visually and microscopically identified before chromatographic analysis. For the IGSR particle analysis from the tape lift kits and from cotton swabs, SEM images, EDX spectrums, and X-ray maps were carried out. For cotton swab samplers, besides metallization with Au/Pd coating, silver lac was used for painting the sample. Magnification varied between 50 and 500× according to the particle size. Once the particle was located, an elemental analysis was carried out to determine the major components of the particle. The size, shape, and morphology of the particles were also recorded.

3. Results and Discussion

3.1. Optimization of the IT-SPME and Chromatographic Conditions

Experiments were performed in order to optimize the DPA extraction by IT-SPME, as well as the subsequent chromatographic analysis. Initially, two mobile-phase compositions in isocratic elution were tested, 60:40 and 70:30 ACN: water (v/v). As can be seen in Figure 2A, both compositions were adequate to desorb DPA from the IT-SPME extractive capillary. However, a decrease in retention time and narrower peaks were achieved with the increase of ACN and flow rate of the mobile phase. A gradient elution program (See Section 2.2 for optimum conditions) with 100% of ACN during 4 min was employed as cleaning solvent.
In-tube solid-phase microextraction was performed using a capillary column as the loop of the injection valve. The analytes were extracted during sample loading and were transferred to the analytical column with the mobile phase by changing the valve position. This configuration was advantageous in order to achieve suitable limit of detection (LOD) for detecting DPA deposited on shooters’ hands. Herein, several assays were carried out to optimize the extraction step. The nature of the extractive phase, the length of the capillary column, and the volume of the sample processed were evaluated. Five phases for IT-SPME were assayed: 5, 20, 35, 50% diphenyl–95, 80, 65, 50% polydimethylsiloxanes, respectively, and 100% polyethylene glycol (PEG) (See Table 2). Figure 2B compares the analytical response (mean peak area) for DPA (5 ng/mL) with the different capillaries (30-cm length) when the volume of standard processed was 800 µL. As can be seen, the TRB-35 phase provided higher analytical responses for DPA. This suggests that the higher percentage of diphenyl groups in the extractive phase led to an increase in analytical response. It can be deduced that extraction involves π–π interactions with DPA, whose structure possesses two aromatic rings. However, TRB-50 provided a decrease on the peak area, and this effect was attributed to the increment on the polarity of the extractive phase, and so the affinity towards the DPA decreased (log Kow = 3.5). The same effect may occur by PEG capillary due to its higher polarity. Thus, the TRB-35 capillary column was selected as the best extractive phase for further experiments.
The effect of the capillary length on the analytical response (peak area) was also studied by processing 800 µL of working solution of DPA (5 ng/mL) with TRB-35 capillaries of 30, 60, and 90 cm. Figure 2C shows the increment of the analytical response with the length of the capillary, thus, the amount of analyte extracted also increased. The peak area for DPA improved 40% and 47% with the capillary columns of 60 and 90 cm, respectively, compared with the capillary of 30 cm. Capillaries longer than 90 cm did not improve the analytical response. The TRB-35 of 90 cm was chosen as the optimal capillary column length.
Sample volumes processed up to 4 mL at 5 ng/mL of DPA solution were studied. The results obtained are depicted in Figure 2D. As can be seen, a remarkable increase of analytical response (peak area) with the increase of the sample volume was observed up to 2 mL. The signal increased very slightly from 2 to 4 mL, and 2 mL was chosen as the optimum sample volume for further experiments. However, it was found that the swabs used in the present study absorbed about 125 µL of contact solution. According to this observation, further experiments were carried out by processing 1800 µL remaining in the vial.
The extraction efficiencies of the proposed methodology were estimated by comparing the amount of analyte extracted, which is the amount of the analyte transferred to the analytical column, with the total amount of analyte passed through the extraction capillary. The amount of analyte extracted was established from the peak areas in the resulting chromatograms and from the calibration equations constructed through the direct injection of 72 μL of analyte standard solutions of different concentrations. This volume is the inner volume of the TRB-35 capillary of 90 cm used for IT-SPME. The absolute extraction efficiency obtained was 7% which is in accordance with those reported for this technique [19,20]. Although low extraction efficiencies (absolute recoveries) were achieved by IT-SMPE, the analytical responses were improved significantly owing to the large volumes of sample that can be processed through the capillary column. In addition, a clean-up step was tested after sample loading by introducing 120 µL of nanopure water before changing the valve to the inject position. Significant loss of analyte was not observed; thus, clean-up was applied in order to remove fibers or compounds from cotton which could remain inside the capillary column. It was also tested to filter the solutions of DPA extracted from cotton swab through 0.45-μm nylon membranes. Nevertheless, the analyte was retained on the nylon filter. Hence, samples were not filtered before injection.

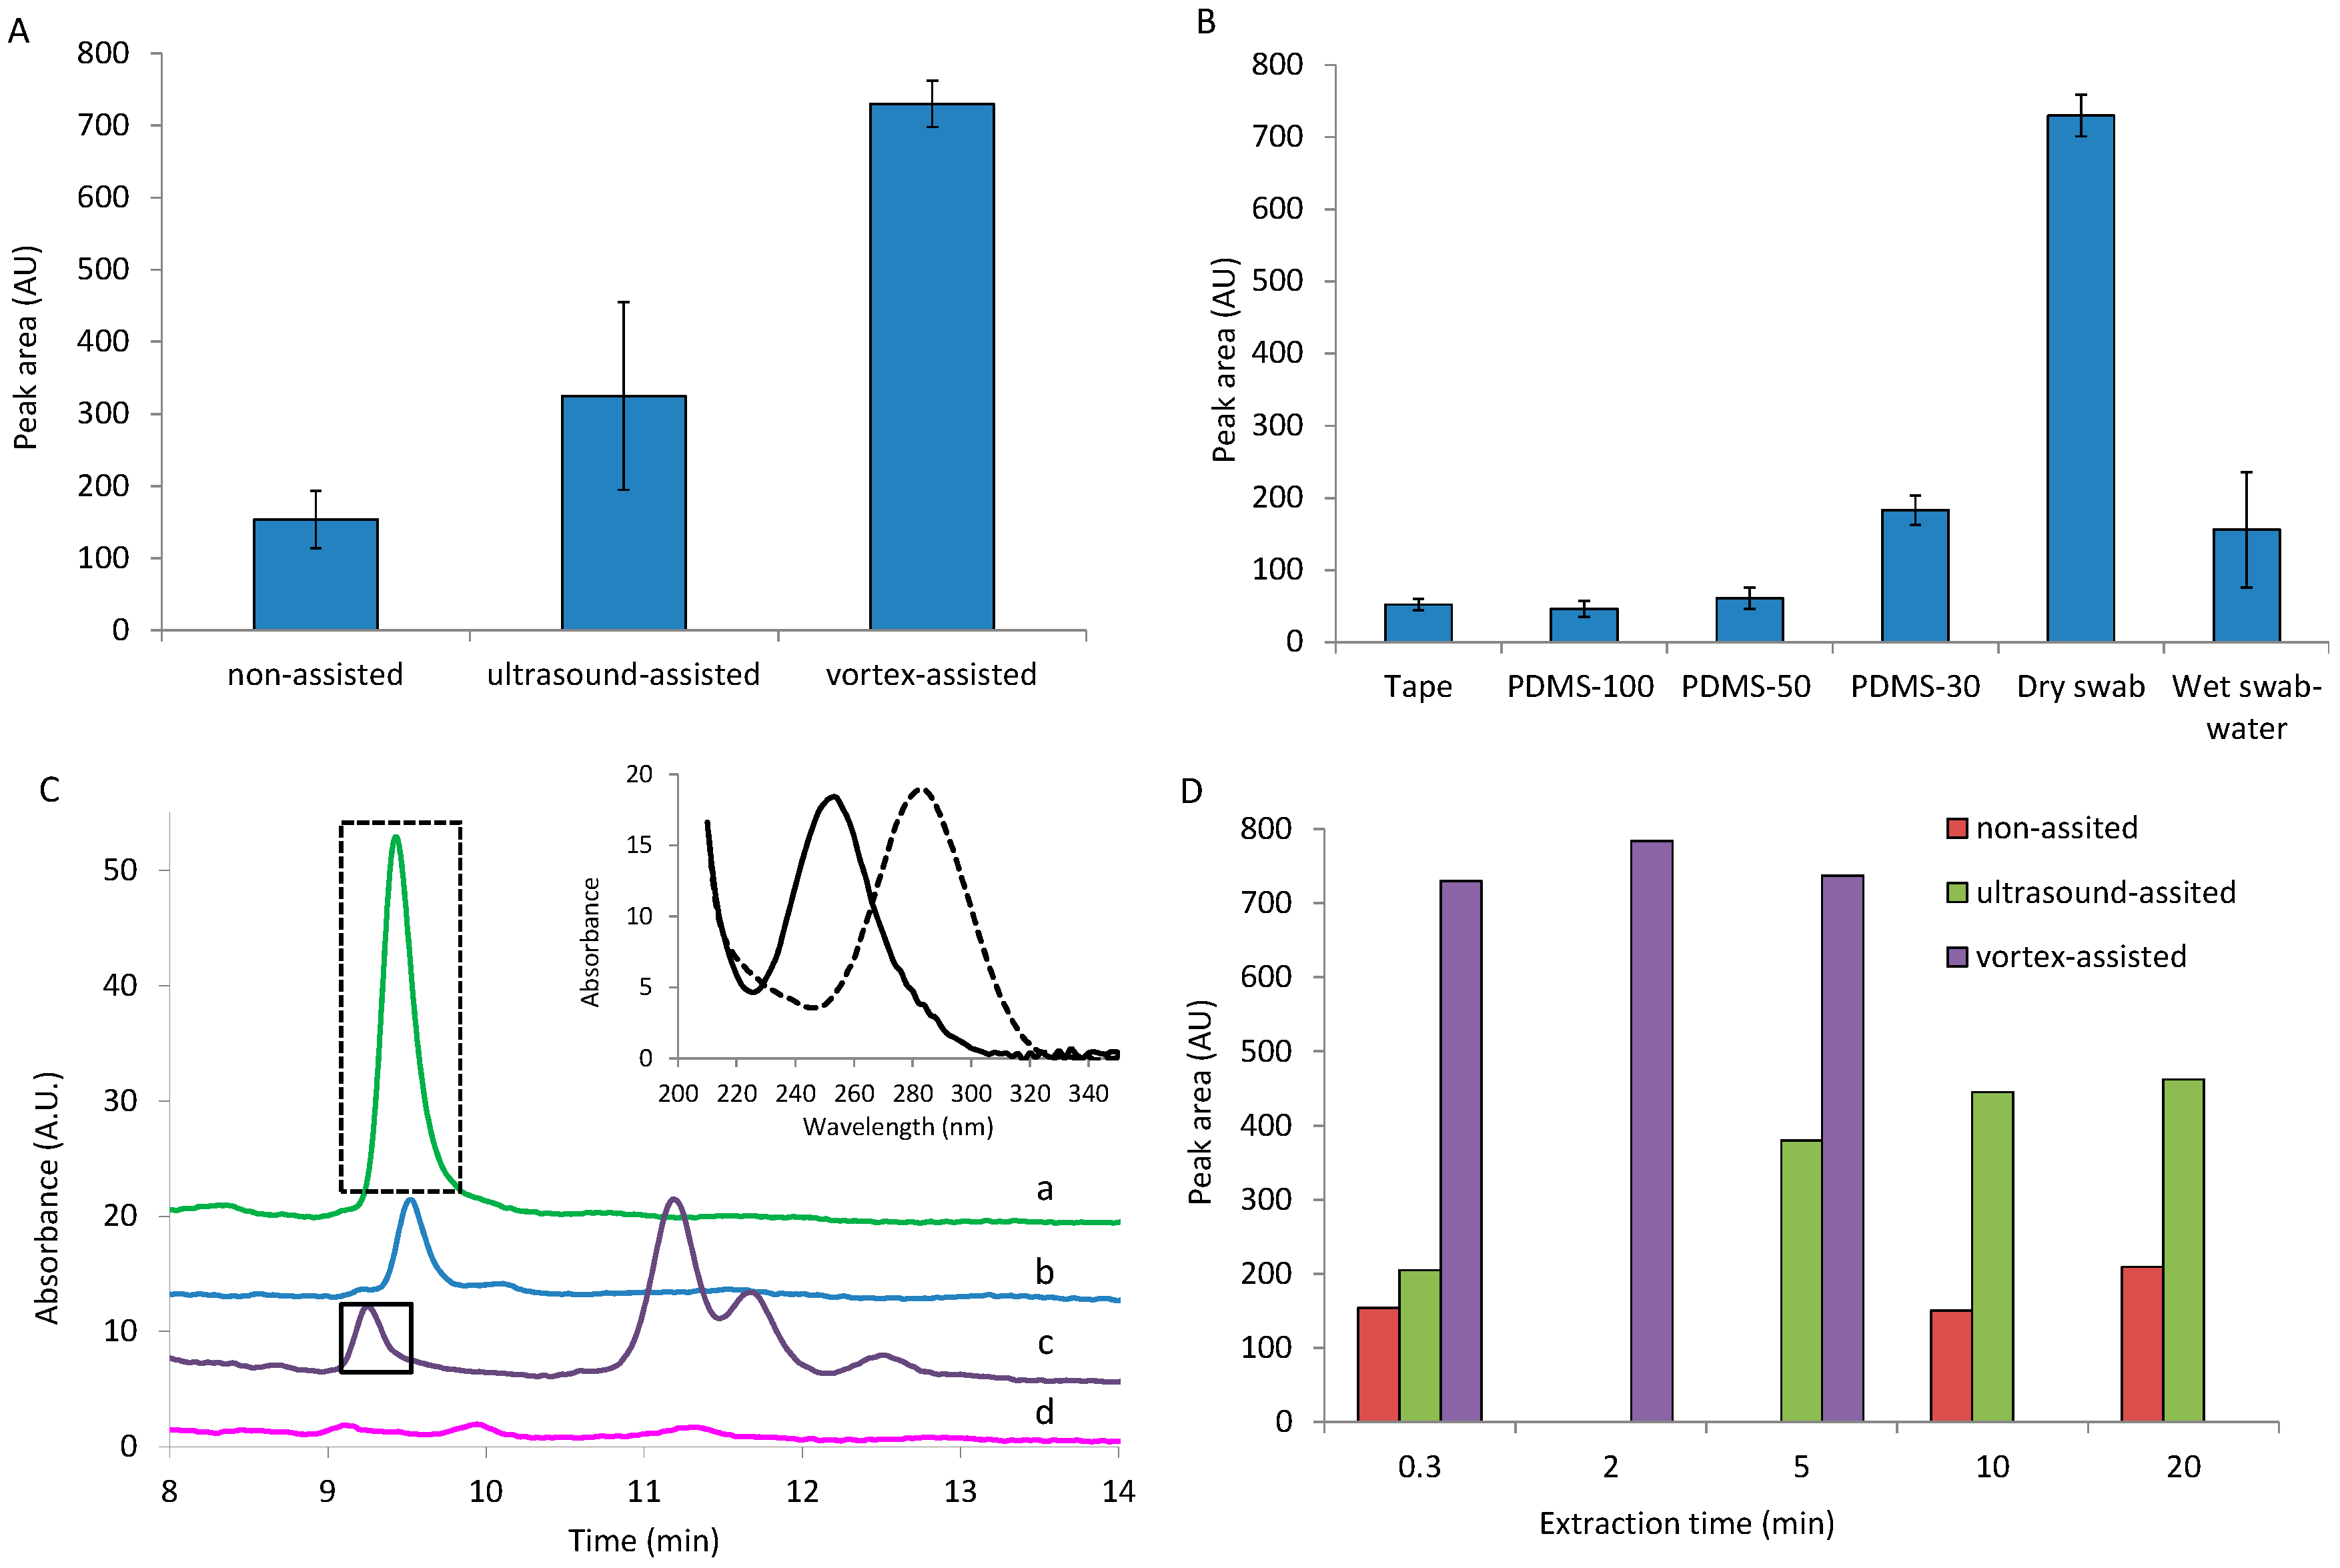
3.2. Optimization of DPA Extraction from Hands

3.2.1. DPA Extraction from Collector

The first step considered to optimize DPA extraction was to find an appropriate extraction procedure for DPA from the collector. For this aim, non-assisted, ultrasound-assisted, and vortex-assisted extraction of the analyte from a cotton swab sampler were tested. Three µL of 10 µg/mL DPA working solution (prepared in ACN to favor evaporation) was spread on a glass slide. After it was air evaporated to dryness, a dry cotton swab was used to collect DPA from the slide. The tip of the cotton swab was introduced into a vial containing 2 mL of water under the three abovementioned extraction modes for 5 min (See Section 2.6 for more details). Vortex-assisted extraction offered the best results in terms of both analytical response (peak area) and relative standard deviations (RSDs), as can be seen in Figure 3A. For evaluating the extraction efficiencies, the peak area ratios between non-assisted and assisted extractions were calculated, ratios of 2 and 5 were obtained for ultrasound and vortex, respectively. Moreover, the results provided a satisfactory RSD of 9% for extraction by vortex but not by ultrasounds with 32% of RSD. From these results, we concluded that the best extraction of DPA from the sampler was vortex-assisted extraction.

3.2.2. DPA Collecting

Several sampling tools were tested for DPA collection from shooters’ hands. In a first attempt, 3 µL of 10 µg/mL DPA working solution was dropped on a glass slide. After it was air evaporated to dryness, solid DPA was collected by several sampling tools: adhesive tape lifts; PDMS-based devices at several PDMS: TEOS proportions (100:0, 50:50, and 70:30); and dry cotton swabs and wet cotton swabs with non-skin-toxic solvents such as water, acetone, and ethanol. According to the 24.
European Chemicals Agency (ECHA) database [24], methanol and acetonitrile were not used due to their harmfulness and toxicity in contact with the skin, respectively. After, the samplers were in contact with 2 mL of water under vortex conditions. Figure 3B compares the mean peak areas of DPA extracted from slides and their RSDs to determine the suitability of the several sampling devices tested. The dry cotton swab achieved the highest analytical response with suitable precision. The adhesive tape lift, which was used in the tape lift kits, showed an analytical response about 14 times lower than the dry cotton swabs. Similar loss of peak area was observed with the pure PDMS-based device. However, increases of analytical response were achieved when the TEOS proportion increased in the composition device. In the case of the PDMS: TEOS (30:70) device, the analytical response was improved by four times, compared with the response with the pure PDMS device. This effect can be attributed to the increment of the device hydrophilicity as a function of the TEOS amount, suggesting the improvement of analyte extraction from device to the aqueous solution. When the cotton swab was wet with water and ethanol, the analytical response decreased 80% and 97%, respectively, compared with the response obtained by a dry swab. It could be due to the wet swab spreading the analyte on the slide surface instead of collecting it; RSD > 30% were obtained indicating the difficulty in controlling the analyte collection. When acetone was used as the extractive solvent, DPA was not detected but a small chromatographic peak at a retention time slightly lower than that of the analyte was observed (Figure 3C). As can be confirmed by the spectra depicted in the Figure 3C inset, this peak could be differentiated from the analyte peak by retention time and spectrum, and it could correspond to some compound from the cotton swab. From these results, a dry cotton swab was chosen as the best sampling collector of DPA from shooters’ hands for further work.
Peak areas of DPA were obtained for different extraction times under vortex-assisted extraction of the dry cotton swab sampler: 20 s, 2 and 5 min, as can be seen in Figure 3D and non-significant differences on peak areas were observed. Worse results were achieved with non-assisted and ultrasound-assisted extractions even under higher extraction times. Therefore, 20 s as extraction time was selected by using vortex to extract DPA from hands to suitable level in a short time frame.

3.2.3. Effect of Extraction Solvent on the DPA Extraction from the Sampler

The capacity of three solvents to remove the DPA residues from cotton swabs was investigated: acetonitrile, ethanol, and water. Mixtures of 90:10 water, ACN and water, and ethanol and 100% water were tested. Fifty-one percent and 85% decreases in peak area were observed when ethanol and ACN, respectively, were present in the extraction solvent (See Figure 4). This suggests that the analyte was probably non-retained on the IT-SPME capillary column. Moreover, high peaks were observed at a retention time slightly lower than that corresponding to the analyte. These peaks were not detected when the analysis was carried out in solution, suggesting they were due to compounds extracted from cotton. Note that ethanol was the solvent which extracted more interfering compounds. However, water offered the best results in terms of extraction and reduced interferences, as well as it is a greener solvent. Hence, water was chosen as optimum extraction solvent.

3.3. Analytical Performance of DPA Determination

Relevant analytical parameters such as calibration equations, linear working range, limit of detection (LOD), limit of quantification (LOQ), and precision are shown in Table 3, for both solution and swab-vortex extraction procedures. Satisfactory linearity for the working concentrations was achieved. The LODs and LOQs were calculated experimentally from solutions containing concentrations providing signal/noise of 3 and 10, respectively. Limit of detection and LOQ for the swab-vortex extraction were 0.15 ng/mL and 0.5 ng/mL, respectively. Converted into the equivalent amount of DPA injected onto the system, the LOD and LOQ were 0.3 ng and 1 ng, respectively. These results showed that the sensitivity reached with the proposed procedure is suitable for detecting DPA on shooters´ hands and the observed LODs improved the published ones shown in Table 1. The precision was suitable at the working concentration levels tested, with intra- and inter-day relative standard deviations of 9% and 15%, respectively (n = 4). The precision of the retention times was also estimated obtaining RSD values of 1.5% and 2.5% for intra- and inter-day, respectively (n = 3, concentration = 15 ng/mL). Satisfactory results for the study in solution were obtained as depicted in Table 3. To test the extraction efficiency of DPA from samples (including sample collection by cotton swab and extraction from swab to water), the peak area of solution obtained after extraction (2 µL of 10 µg/mL DPA spread on a glass slide followed by the protocol described in Section 2.6) was compared with the peak area obtained for the equivalent concentration in solution directly injected (5 ng/mL of DPA). The extraction efficiency estimated was 37 ± 5%. A recovery study of spiked samples at 10 ng/mL was performed and the value obtained was 108 ± 16%.

3.4. Analysis of Samples

Several samples collected from hands of police officers after shooting tests (See Section 2.5) were analyzed by the optimized procedure. Additionally, the same procedure as described for shooting hands (See Section 2.6) was carried out for the hands of each police officer before shooting to obtain blank samples. The samples were analyzed without identification of volunteers. Figure 5 shows the chromatograms for the hands of a shooter (sample 2A) and a non-shooter and the UV-Vis spectra of a standard sample. Diphenylamine was identified in samples by their concordance between retention time (9.4 min) and UV–Vis spectra of DPA from the library. As can be seen in Figure 5, the chromatogram of a blank showed no peak interferences at the retention time of DPA.
Quantification of the samples was carried out based on the regression equation previously obtained (See Table 3). Table 4 shows the samples screened and the quantification results. With a total of twenty-one swab samples and six tape kit samples, DPA was found and quantified in seventeen swab samples (81% of all swab samples analyzed). In the literature, few studies of DPA are focused on hands and LODs reported are higher to that provided by the proposed method (See Table 1). In this work, the amount of DPA found on hands exceeded LOQ, providing forensic evidence for the presence of DPA. The paired t-test was used to evaluate statistical differences between both hands of a shooter, left and right. The α value obtained at a 95% significant level was higher than 0.05 (p-value = 0.232). From these results, we can conclude that the results from both hands of a shooter were statistically equivalent.

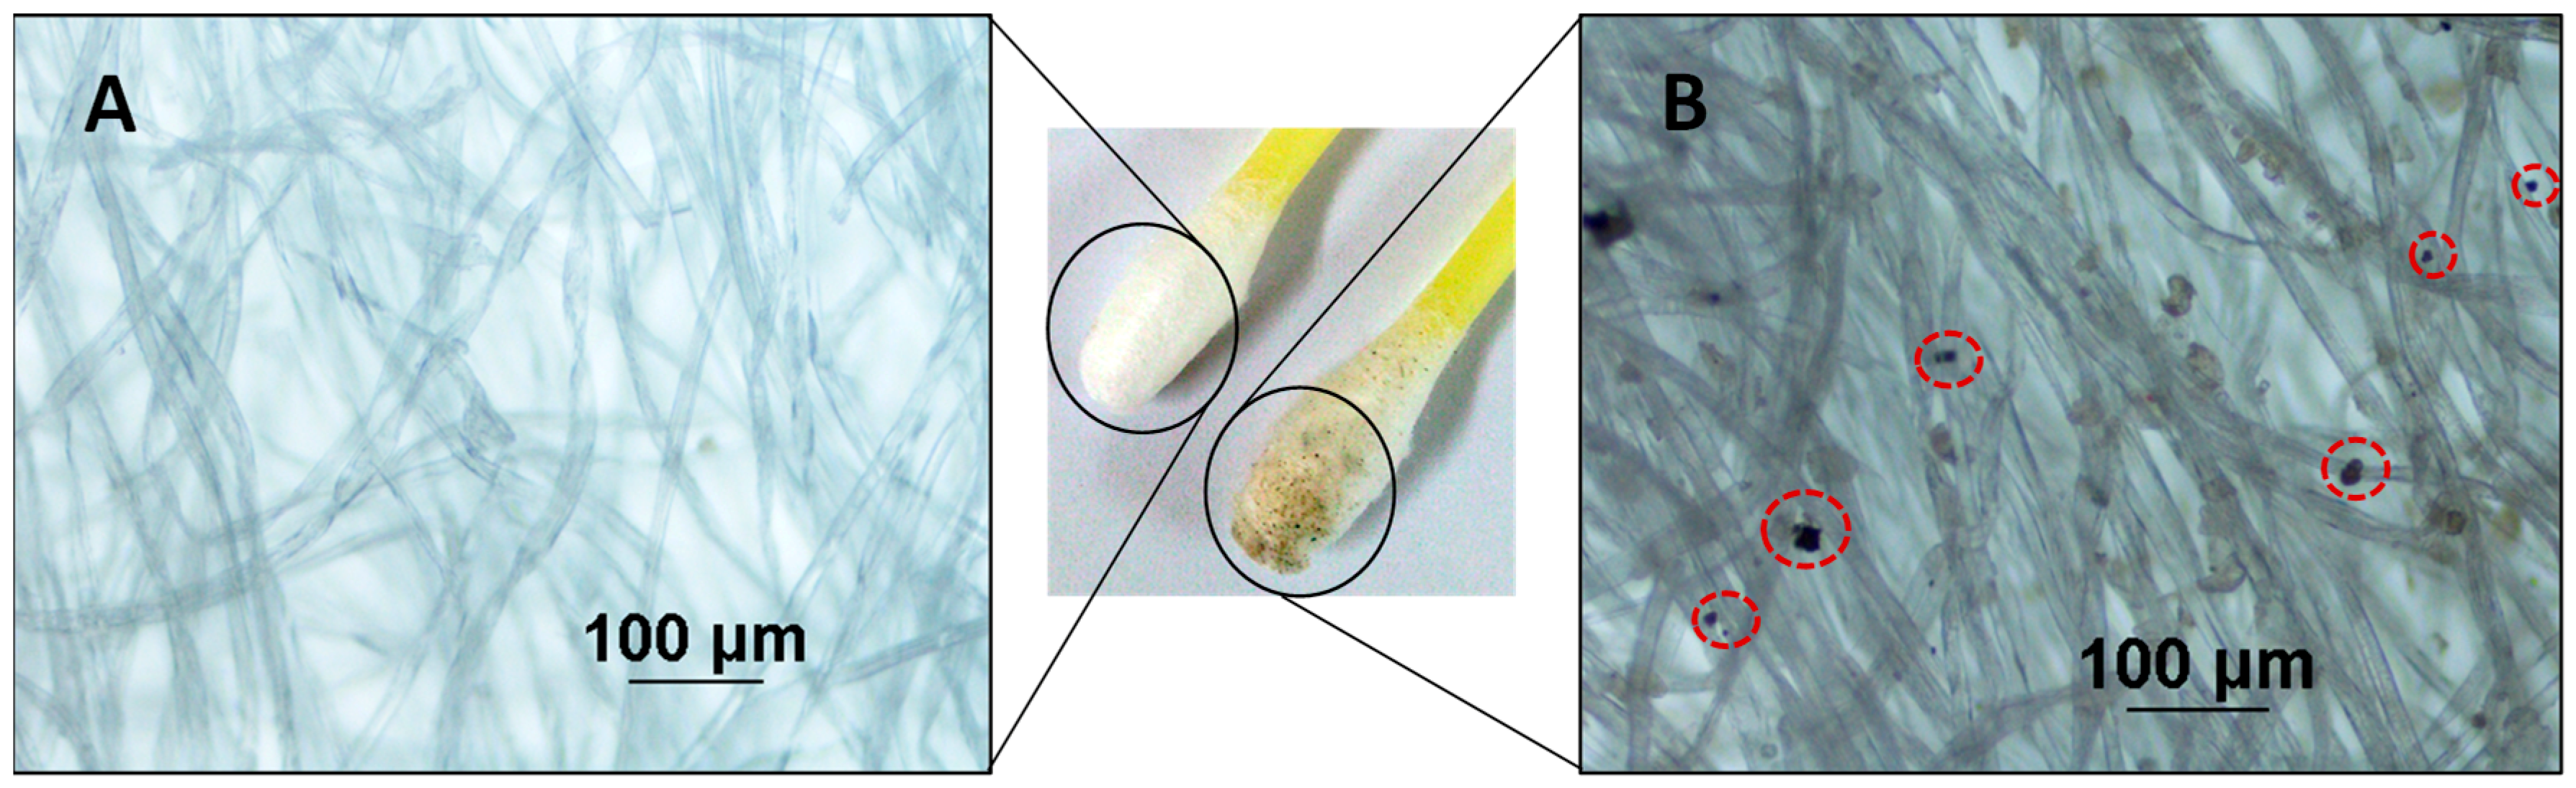
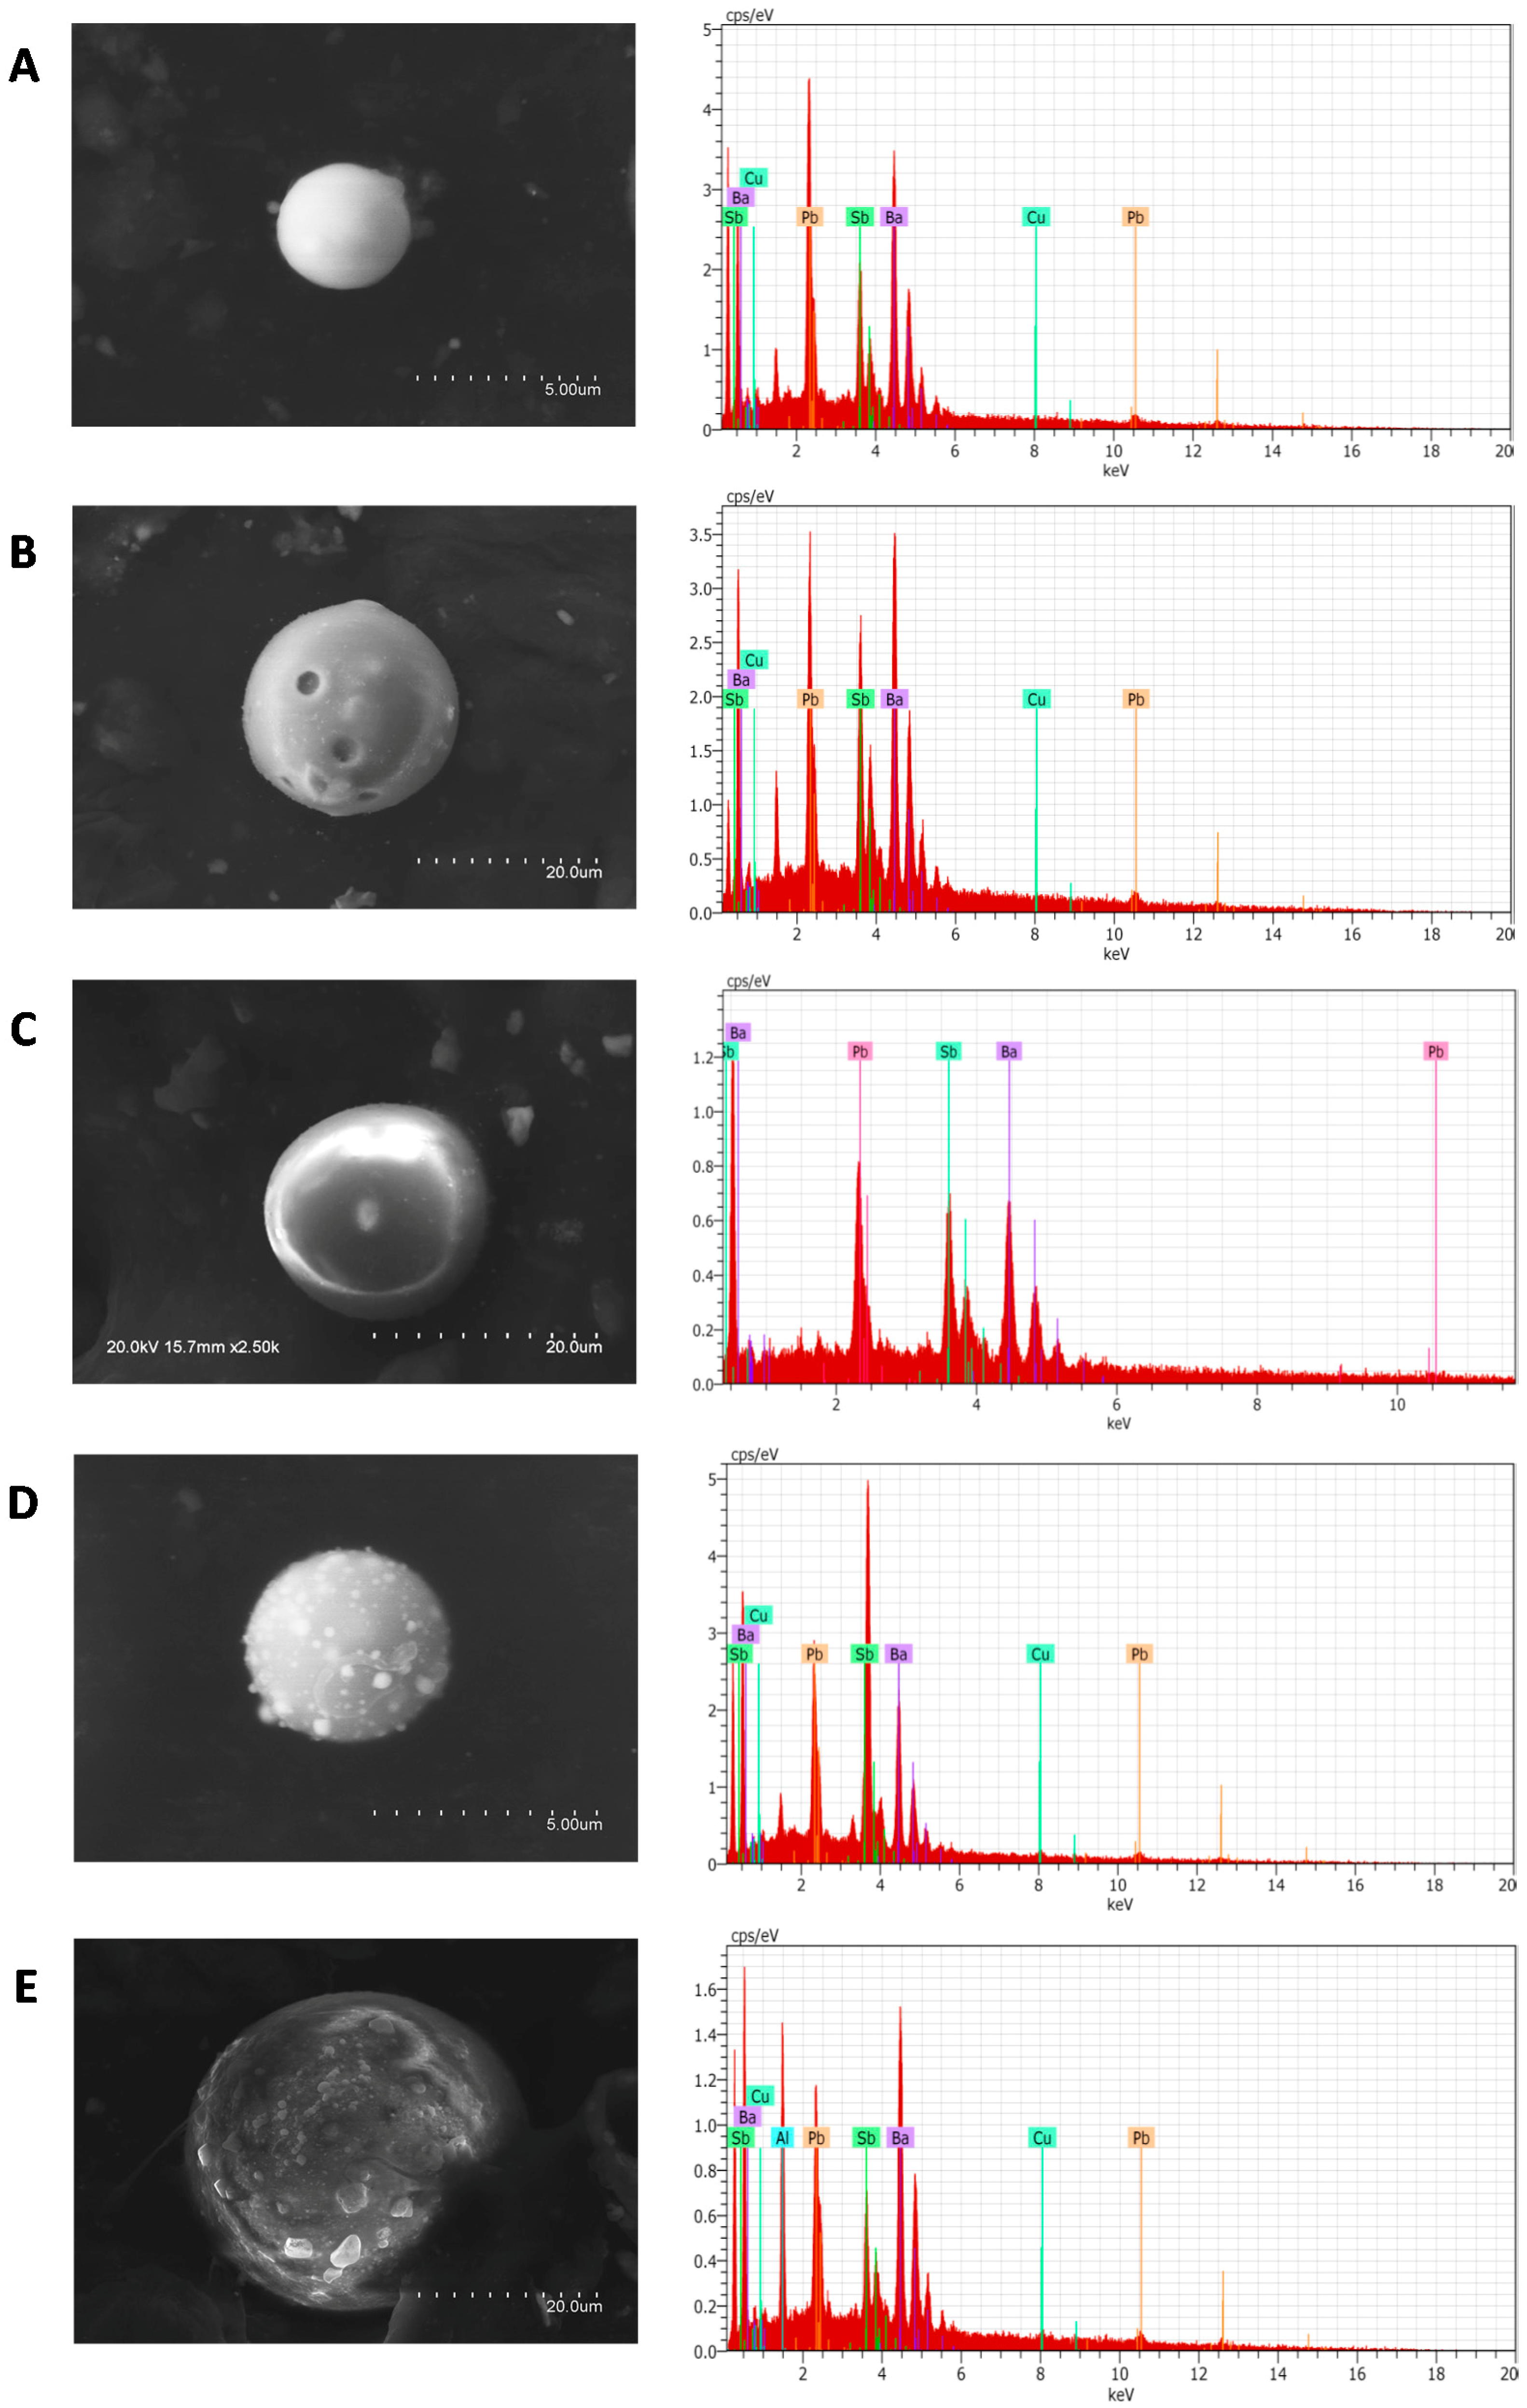
3.5. IGSR Particles’ Identification

As can be seen in Figure 6, the presence of GSR particles remaining on cotton swabs can be confirmed by naked eye and optical microscopy before chromatographic analysis. Clean fibers of the cotton swab can be seen after sampling a non-shooter’s hand (See Figure 6A). However, gunpowder particles with a typical spherical shape and size up to 20 µm [8] were observed between cotton fibers (see red circles) after sampling a shooter’s hand (Figure 6B). It is worth mentioning that this non-destructive microscopic analysis allows the subsequent DPA chromatographic analysis too.
Figure 7 shows the same cotton sample (sample 2A) shown in Figure 6 but characterized by SEM/EDX after DPA extraction. This was possible due to the presence of some gunpowder particles remaining on the cotton swabs after the DPA was extracted. Figure 7 shows a typical IGSR particle with a spherical shape and 38 µm size in accordance with References [6,7]. As can be observed in the elemental analysis, the predominant elements were Ba (46%) and Sb (44%), as reported in the literature for IGSRs [4]. Both inorganic and organic compounds were identified on shooters’ hands by SEM/EDX and chromatography, respectively. Hence, the presence of GSRs on the hands of shooters was confirmed.
The other aim of this work was to examine the morphology and elemental composition and distribution of GSR particles collected with the lift tape kits, the typical police collector. Only particles which can be identified as GSR by their composition and morphology were selected for SEM/EDX analysis. Roughly 6–7 particles per sample were studied as can be seen in Table 5. As reported in Reference [8], this number of particles is approximately equivalent to the particles that can be recovered on a shooter’s hand at a forensic scene. A portion between 3–40% of the total surface of the sample was explored to find this number of particles, depending on the sample. Figure 8 and Figure 9 show the morphology and elemental data of particles found on adhesive tapes collected after shooting. Most of the particles observed were spherical. Less than 20% of particles found had an irregular shape, probably due to being distorted after shooting. As shown, particles had different surfaces such as smooth, bumpy or covered with craters with or without a metallic shine. More than 60% of the particles found had a smooth surface. Their morphology was an effect of conditions taking place during the firing. Particles can be perforated, capped, broken or stemmed. Results of the SEM/EDX analysis of GRS particles found on the tapes from shooters’ hands are displayed in Table 5.
As observed in Table 5, most of the particles had the characteristic elemental composition of GSRs, which was mainly based on Pb, Sb, and Ba; 35 particles contained on average 61% Ba, 30% of Sb, and 9% Pb, and other two particles contained 95% Pb and 97% Sb, probably from bullets, shells or cartridges. Moreover, some particles also contained other elements such as Al, Cu, and Fe at trace levels. About 66% of samples contained traces of Cu, 20% Al, and 3% Fe, while 12% of them contained both Al and Cu. Nevertheless, these minority elements cannot be considered evidence of firing a gun. Even though these particles had similar elemental composition, their size varied over a range from 3 to 30 µm according to the bibliography [4,6,7].
Spatial distribution of the Sb, Pb, and Ba of GSR particles shown in Table 5 was observed by X-ray mapping using colors to represent the elemental distribution. In this case, Sb appears red, Pb is green, and Ba is blue. Figure 9 shows the X-ray mapping of sample 21K together with its corresponding SEM image. Figure 9B gives the merging of Figure 9C–E. As can be seen, the GSR particle presented the three elements Sb, Ba, and Pb together. Thus, these mapping results were in accordance with the previous elemental composition studied (see Table 5). The results obtained by SEM/EDX can be considered as indicative of IGSR particles on shooters’ hands.

4. Conclusions

This work proposes the sampling of gunshot residues on shooters’ hands using dry cotton swabs followed by vortex-assisted extraction with water over a short time (20 s). Aqueous samples were directly processed in the miniaturized IT-SPME-CapLC-DAD system for on-line clean-up and preconcentration of the sample and for quantization of the amount of diphenylamine as targeted organic residue. It is worth mentioning that non-toxic solvents and low-cost materials were employed. The efficiencies of the IT-SPME were tested for several compositions and lengths of the extractive phase, as well as sample volume processed in order to improve the sensitivity. The highest analytical responses were obtained for the longest TRB-35 capillaries (90 cm) were more likely due to π–π interactions and 1.8 mL of processed volume. The proposed approach is a rapid, green, and cost-effective option for detecting DPA on the hands of shooters. The sustainability of an analytical method is governed by minimization of toxic solvents, reduction of wastes, and employment of energy-efficient and cost-effective methodologies, but also on maintaining the reliability of the performance parameters, such as sensitivity, precision, and accuracy [25,26]. In two previous papers [27,28] our group demonstrated that IT-SPME-CapLC-DAD achieves the minimization of the sample pre-treatment step, analysis time, and wastes, the reduction of the analysis costs, and thus, improvement of the analytical and environmental performance. Satisfactory LOD (0.3 ng) and precision (RSD intra-day = 9%, RSD inter-day = 14%) were achieved.
In order to test the utility of the method for real cases, several shooters’ hands were sampled by dry cotton swabs and processed by IT-SPME-CapLC-DAD. The results showed that DPA was found and quantified in 81% of samples. Additionally, IGSRs inspection of swab samples was carried out by optical microscopy in order to confirm the presence of gunshot residues on shooters’ hands, which were analyzed by SEM-EDS after DPA extraction. Furthermore, some shooters’ hands were sampled by a tape lift kit, which is the typical police sampler, but DPA extraction was fourteen times lesser than that achieved by the dry cotton swab sampler. Morphology, elemental composition, and distribution of the IGSRs particles were also studied. Then, improved results were obtained by the proposed sampling method as indicated above. If organic compounds are detected in combination with inorganic compounds, higher probative value can be achieved, and false positives/negatives can also be reduced for discriminating shooters’ hands. In this work, a sensitive chromatographic method to detect the organic compound DPA can be combined with IGSR analysis by SEM-EDS in order to obtain valuable evidence of GSRs deposited on hands of a suspected shooter. Therefore, the proposed method is helpful to determine whether a person has fired a gun in a forensic investigation.

Author Contributions

All authors designed and performed part of the experiments, analyzed the data, and wrote the paper.

Acknowledgments

The authors are grateful to the EU-FEDER/MINCIU-AEI of Spain (project CTQ2017-90082-P) and Generalitat Valenciana (PROMETEO 2016/109) for the financial support received and to Police Headquarters of Valencian Community (Valencia, Spain) for the sampling.

Conflicts of Interest

The authors declare no conflict of interest. The founding sponsors had no role in the design of the study; in the collection, analyses, or interpretation of data; in the writing of the manuscript, and in the decision to publish the results.

References

  1. Firearms and the Internal Security of the EU: Protecting Citizens and Disrupting Illegal Trafficking; The European Data Protection Supervisor (EDPS): Brussels, Belgium, 2013.
  2. Xu, J.; Murphy, S.L.; Kochanek, K.D.; Bastian, B.A.; Rep, N.V.S. Deaths: Final Data for 2009. Natl. Vital Stat. Rep. 2016, 64, 1–117. [Google Scholar]
  3. Salles, M.O.; Naozuka, J.; Bertotti, M. A forensic study: Lead determination in gunshot residues. Microchem. J. 2012, 101, 49–53. [Google Scholar] [CrossRef] [Green Version]
  4. Tarifa, A.; Almirall, J.R. Fast detection and characterization of organic and inorganic gunshot residues on the hands of suspects by CMV-GC-MS and LIBS. Sci. Justice 2015, 55, 168–175. [Google Scholar] [CrossRef] [PubMed]
  5. Bernal Morales, E.; Revilla Vázquez, A.L. Simultaneous determination of inorganic and organic gunshot residues by capillary electrophoresis. J. Chromatogr. A 2004, 1061, 225–233. [Google Scholar] [CrossRef]
  6. Dalby, O.; Butler, D.; Birkett, J.W. Analysis of gunshot residue and associated materials—A review. J. Forensic Sci. 2010, 55, 924–943. [Google Scholar] [CrossRef] [PubMed]
  7. Schwoeble, A.J.; Exline, D.L. Gunshot Methods in Current Methods in Gunshot Residue Analysis; CRC Press: London, UK, 2000. [Google Scholar]
  8. Bailey, M.J.; Kirkby, K.J.; Jeynes, C. Trace element profiling of gunshot residues by PIXE and SEM-EDS: A feasibility study. X-Ray Spectrom. 2009, 38, 190–194. [Google Scholar] [CrossRef]
  9. Brożek-Mucha, Z. Trends in analysis of gunshot residue for forensic purposes. Anal. Bioanal. Chem. 2017, 409, 5803–5811. [Google Scholar] [CrossRef] [PubMed]
  10. Farokhcheh, A.; Alizadeh, N. Determination of diphenylamine residue in fruit samples using spectrofluorimetry and multivariate analysis. LWT—Food Sci. Technol. 2013, 54, 6–12. [Google Scholar] [CrossRef]
  11. Grima, M.; Butler, M.; Hanson, R.; Mohameden, A. Firework displays as sources of particles similar to gunshot residue. Sci. Justice 2012, 52, 49–57. [Google Scholar] [CrossRef] [PubMed]
  12. Oommen, Z.; Pierce, S.M. Lead-free primer residues: A qualitative characterization of Winchester WinCleanTM, Remington/UMC LeadLessTM, Federal BallistiCleanTM, and Speer Lawman CleanFireTM handgun ammunition. J. Forensic Sci. 2006, 51, 509–519. [Google Scholar] [CrossRef] [PubMed]
  13. Blakey, L.S.; Sharples, G.P.; Chana, K.; Birkett, J.W. Fate and Behavior of Gunshot Residue—A Review. J. Forensic Sci. 2017, 63, 9–19. [Google Scholar] [CrossRef] [PubMed]
  14. Burleson, G.L.; Gonzalez, B.; Simons, K.; Yu, J.C.C. Forensic analysis of a single particle of partially burnt gunpowder by solid phase micro-extraction-gas chromatography-nitrogen phosphorus detector. J. Chromatogr. A 2009, 1216, 4679–4683. [Google Scholar] [CrossRef] [PubMed]
  15. Mei, H.; Quan, Y.; Wang, W.; Zhou, H.; Liu, Z.; Shi, H.; Wang, P. Determination of Diphenylamine in Gunshot Residue by HPLC-MS/MS. J. Forensic Sci. Med. 2016, 2, 18. [Google Scholar] [CrossRef]
  16. Tong, Y.; Wu, Z.; Yang, C.; Yu, J.; Zhang, X.; Yang, S.; Wen, Y. Determination of diphenylamine stabilizer and its nitrated derivatives in smokeless gunpowder using a tandem MS method. Analyst 2001, 126, 480–484. [Google Scholar] [CrossRef] [PubMed]
  17. Morelato, M.; Beavis, A.; Ogle, A.; Doble, P.; Kirkbride, P.; Roux, C. Screening of gunshot residues using desorption electrospray ionisation-mass spectrometry (DESI-MS). Forensic Sci. Int. 2012, 217, 101–106. [Google Scholar] [CrossRef] [PubMed]
  18. Laza, D.; Nys, B.; De Kinder, J.; Kirsch-De Mesmaeker, A.; Moucheron, C. Development of a Quantitative LCMS⁄MS Method for the Analysis of Common Propellant Powder Stabilizers in Gunshot Residue. J. Forensic Sci. 2007, 52, 842–850. [Google Scholar] [CrossRef] [PubMed]
  19. Moliner-Martinez, Y.; Herráez-Hernández, R.; Verdú-Andrés, J.; Molins-Legua, C.; Campíns-Falcó, P. Recent advances of in-tube solid-phase microextraction. TrAC–Trends Anal. Chem. 2015, 71, 205–213. [Google Scholar] [CrossRef]
  20. Serra-Mora, P.; Moliner-Martínez, Y.; Molins-Legua, C.; Herráez-Hernández, R.; Verdú-Andrés, J.; Campíns-Falcó, P. Trends in online in-tube solid phase microextraction. In Comprehensive Analytical Chemistry; Elsevier: Amsterdam, The Netherlands, 2017; Chapter 14; Volume 76, pp. 427–461. [Google Scholar]
  21. Scherperel, G.; Reid, G.E. Waddell Smith, R. Characterization of smokeless powders using nanoelectrospray ionization mass spectrometry (nESI-MS). Anal. Bioanal. Chem. 2009, 394, 2019–2028. [Google Scholar] [CrossRef] [PubMed]
  22. Arndt, J.; Bell, S.; Crookshanks, L.; Lovejoy, M.; Oleska, C.; Tulley, T.; Wolfe, D. Preliminary evaluation of the persistence of organic gunshot residue. Forensic Sci. Int. 2012, 222, 137–145. [Google Scholar] [CrossRef]
  23. Gandy, L.; Najjar, K.; Terry, M.; Bridge, C. A novel protocol for the combined detection of organic, inorganic gunshot residue. Forensic Chem. 2018, 8, 1–10. [Google Scholar] [CrossRef]
  24. European Chemicals Agency (ECHA). Available online: https://echa.europa.eu/es/information-on-chemicals/registered-substances (accessed on 31 January 2019).
  25. Galuszka, A.; Konieczka, P.; Migaszewski, Z.M.; Namiesnik, J. Analytical eco-scale for assessing the greenness of analytical procedures. TrAC-Trend. Anal. Chem. 2012, 37, 61–72. [Google Scholar] [CrossRef]
  26. Plotka-Wasylka, J. A new tool for the evaluation of the analytical procedures: Green Analytical Procedure Index. Talanta 2018, 181, 204–209. [Google Scholar] [CrossRef] [PubMed]
  27. Pla-Tolós, J.; Serra-Mora, P.; Hakobyan, L.; Molins-Legua, C.; Moliner-Martinez, Y.; Campins-Falcó, P. A sustainable on-line CapLC method for quantifying antifouling agents like irgarol-1051 and diuron in water samples: Estimation of the carbon footprint. Sci. Total Environ. 2016, 560–570, 611–618. [Google Scholar] [CrossRef] [PubMed]
  28. Jornet-Martínez, N.; Bocanegra-Rodríguez, S.; González-Fuenzalida, R.A.; Molins-Legua, C.; Campíns-Falcó, P. In Situ Analysis Devices for Estimating the Environmental Footprint in Beverages Industry. In Processing and Sustainability of Beverages; Grumezescu, A.M., Holban, A.M., Eds.; Elsevier: Amsterdam, The Netherlands, 2019; Volume 2, Chapter 9; pp. 275–317. [Google Scholar]
Figure 1. Schematic diagram of the steps for DPA analysis: (A) web and palm of the hand sampling (zone sampling in blue), (B) vortex-assisted extraction, and (C) IT-SPME-capillary liquid chromatography (CapLC) system.
Separations 06 00016 g001
Figure 2. Effect of (A) acetonitrile percentage and flow rate of mobile phase (800 µL at 7 ng/mL of DPA, TRB-35, 30 cm); (B) nature of the IT-SPME phase (800 µL at 5 ng/mL of DPA, capillary length 30 cm, optimum mobile phase); (C) capillary length (800 µL at 5 ng/mL of DPA, TRB-35, optimum mobile phase); and (D) sample volume processed (5 ng/mL of DPA, TRB-35, capillary length 90 cm, optimum mobile phase) in IT-SPME versus peak area of DPA. For more details, see the main text.
Separations 06 00016 g002
Figure 3. Comparison of peak areas obtained for standard solution (3 µL of 10 µg/mL in 2 mL of water, 15 ng/mL) with different (A) extraction modalities with dry swab samplers, (B) sample collectors, and (C) solvents to wet cotton swabs (at 10 ng/mL): dry (a), water (b), acetone (c), and ethanol (d), together with normalized spectra (inset) of DPA (black dashed line) and unknown compounds (black solid line), and (D) extraction time with dry swab samplers. For other experiment details, see main text.
Separations 06 00016 g003
Figure 4. Chromatograms of blanks (dashed lines) and standard solution of 5 ng/mL DPA (solid lines) obtained with different extraction solvents: water (a), 90:10 water: ethanol (b), and 90:10 water: acetonitrile (c). Experimental conditions were the optimized once (see main text for more explanation).
Separations 06 00016 g004
Figure 5. Chromatograms obtained for sample 2A (black solid line) and blank of non-shooter’s hand (black dashed line). The inserts correspond to the matching of the spectra of DPA found (blue line) in reference to the standard in the library (red line).
Separations 06 00016 g005
Figure 6. Visual and microscopic (10× magnification) inspection of cotton swab after sampling a non-shooter’s hand (A) and after sampling a shooter’s hand, sample 2A (B).
Separations 06 00016 g006
Figure 7. (a) Scanning electron microscopy SEM image and (b) Energy dispersion X-ray EDX spectra of inorganic gunshot residue found on a swab sample (sample 2A) after shooting.
Separations 06 00016 g007
Figure 8. SEM images (left) and EDX spectra (right) of non-spherical particles found on tapes used to collect GSRs after shooting a pistol: sample 22K.2 (A), sample 25N.3 (B), sample 21K.1 (C), sample 25N.2 (D).
Separations 06 00016 g008
Figure 9. (A) SEM image (B) overlay X-ray map of singles X-ray of Sb (C); Pb (D), and Ba (E) of particle found on a tape used to collect GSRs on hands after firing a gun.
Separations 06 00016 g009
Table 1. Comparison of reported methods for determining diphenylamine (DPA) on a shooter’s hands. The method proposed in this work was also included for comparison (On-line in-tube solid phase microextraction coupled to capillary liquid chromatography with diode array detection (IT-SPME-CapLC-DAD).
Technique/Limit of Detection (LOD)DPA ExtractionDPA Amount on HandsMobile Phase; Flow; Injection VolumeOrganic SolventsRef.
High-performance liquid chromatography -tandem mass spectrometry/0.3 ng/mL (solution)DPA was extracted with cotton swab soaked with acetone, which was evaporated and DPA was dissolved in 0.1 mL methanol.˂Limit of quantitation (LOQ)Methanol-water (90:10); 800 µL/min; 10 µLMethanol and acetone as extractive solvents and mobile phase[15]
Gas chromatography- mass spectrometry/3 ngDPA was extracted with cotton swab moistened in water, the swab was heated and capillary microextraction made≈1 ng ˂ LOQ-Water as extractive solvent[4]
Tandem Mass Spectrometry/1 ng/mL (solution)Cotton swab soaked with methanol to extract DPA from the hand and dilution to 1 mL of methanolNot studied0.1 mL/min; 20 µLMethanol as extractive solvent[16]
Mass spectrometry/-Dabbing an adhesive coated aluminum stub over the handsNot detected4 µL/minWater:methanol 0.1% formic acid as solvent spray[17]
Liquid chromatography- tandem mass spectrometry/34,000 ngCotton swab moistened with isopropyl alcohol:water, 75:25, which was introduced in a tube with 3.2 mL of the mixture and centrifuged. The aliquot was diluted five times with deionized water. SPEC C18 cartridges were conditioned with 250 µL of isopropyl alcohol and deionized water. 5000 µL of aqueous samples were loaded. The sorbent was rinsed with 250 µL of deionized water and dried. The analytes were eluted in acetonitrile:water:methyl alcohol, 80:10:10; 200 µL0.29–83 nmol/LAcetonitrile: methanol: water, acidified by 0.1% of formic acid; 200 µL/min; 20 µLIsopropylalcohol as extraction solvent, methanol and acetonitrile for mobile phase[18]
Capillary electrophoresis/2387 ng/mL (solution)Hands were swabbed by a cotton swab embedded in a solvent. The analyte was recuperated by sonication into 2 mL of solvent. Liquid extraction was carried out with 2 mL of ethyl acetate and 50 µL of ethylene glycol; the solvent was evaporated under dry nitrogen. The residues were reconstituted with diaminocyclohexane tetraacetic acid, and borateNot detected-Diaminocyclohexane tetraacetic acid and sodium dodecyl sulfate as sampling solvents[5]
IT-SPMS-CapLC-DAD/0.15 ng/mL (solution)
0.3 ng by cotton swab
DPA was extracted from hands by cotton swab and then DPA was extracted to 2 mL of water under vortex conditions (20 s)˂LOD-16.5 ngAcetonitrile:
water gradient; 10 µL/ min; 72 µL
Water as extractive solvent. Acetonitrile as mobile phaseThis work
Table 2. Characteristics of capillary columns employed during the in-tube solid-phase microextraction (IT-SPME).
Extractive CapillaryCoatingCoating Thickness (µm)
TRB-55% diphenyl-95% polydimethylsiloxane3
TRB-2020% diphenyl-80% polydimethylsiloxane3
TRB-3535% diphenyl-65% polydimethylsiloxane3
TRB-5050% diphenyl-50% polydimethylsiloxane3
Zebron ZB-WAXpluspolyethylene glycol1
Table 3. Analytical data for DPA determination by IT-SPME-CapLC-DAD; a: ordinate, b: slope, sa and sb: standard deviation of the ordinate and slope, respectively, R2: determination coefficient. Limit of detection (LOD) and limit of quantitation (LOQ).
Linear Range
(ng mL−1)
y = a + bx (ng mL−1)Precision as % RSD
(n = 4, 15 ng mL−1)
LOD
(ng mL−1)
LOQ
(ng mL−1)
a ± sab ± sbR2Intra-DayInter-Day
Solution0.15–50−7 ± 57144 ± 20.9995100.050.15
Swab-vortex0.5–25−13 ± 2449.2 ± 1.70.9949140.150.5
Table 4. Samples screened and quantification of results of DPA on hands determined by the optimized extraction procedure followed by IT-SPME-CapLC-DAD. * Tape lift kit samples quantified by a regression equation with a slope 14 times lower than that obtained for a regression equation by the cotton swab. ** On shooters’ hands.
Police OfficerSampleHandNumber of ShotsDPA Concentration (ng **)
A1 Aleft254.4
2 Aright3.8
B3 Bleft122.7
4 Bright1.9
C5 Cleft253.0
6 Cright3.8
D7 Dleft252.8
8 Dright˂LOD
E9 Eleft252.5
10 Eright3.2
F11 Fleft2516.5
12 Fright13.4
G13 Gleft25˂LOD
14 Gright˂LOD
H15 Hleft254.9
16 Hright˂LOD
I17 Ileft258.4
18 Iright9.5
J19 Jleft258.0
20 Jright4.3
K *21 Kleft25˂LOD
22 Kright˂LOD
L23 Lleft and right251.4
M *24 Mleft and right 253.6
N *25 Nleft and right256.6
O *26 Oleft and right256.9
P *27 Pleft and right25˂LOD
Table 5. Summary of shape, surface, and elemental composition of GRS particles found on tape lift kits from shooters’ hands.
SampleGSR ParticleShapeSurfaceElemental Composition (%)
MajorMinor/Trace
BaSbPbCuAlFe
21K21K.1IrregularNonmetallic bumpy62.533.24.3X
21K.2SphericalNonmetallic smooth62.425.711.9X
21K.3SphericalNonmetallic bumpy65.918.815.3X
21K.4SphericalNonmetallic bumpy46.840.213.0X
21K.5SpheroidalNonmetallic smooth65.714.819.5X
21K.6SphericalNonmetallic smooth87.511.11.4X
21K.7SphericalNonmetallic bumpy58.428.812.8X
22K22K.1SphericalMetallic smooth61.533.55.0X
22K.2IrregularMetallic bumpy98.80.70.5
22K.3SphericalNonmetallic smooth48.037.314.7
22K.4SphericalMetallic smooth57.037.15.9X
22K.5SphericalMetallic smooth61.832.75.5X
22K.6SphericalMetallic smooth79.016.84.2X
22K.7SphericalNonmetallic with hollows50.633.416.0X
24M24M.1SphericalMetallic smooth63.034.82.1
24M.2SphericalMetallic smooth63.230.66.3
24M.3SphericalNonmetallic bumpy0.096.73.3 X
24M.4SphericalMetallic smooth60.437.22.3 X
24M.5SphericalNonmetallic smooth51.134.514.3XX
24M.6SphericalMetallic smooth69.220.310.5XX
24M.7SphericalMetallic smooth54.837.37.9XX
25N25N.1SphericalMetallic smooth68.824.76.4 X
25N.2IrregularNonmetallic bumpy72.017.810.2X
25N.3SpheroidalMetallic bumpy63.330.06.7
25N.4SphericalMetallic smooth53.039.77.4X
26O26O.1SphericalMetallic smooth63.634.22.2
26O.2SphericalMetallic smooth61.735.23.0 X
26O.3IrregularNonmetallic bumpy40.033.826.2
26O.4SphericalMetallic smooth0.34.994.9X
26O.5SphericalMetallic smooth62.731.26.3
26O.6SphericalMetallic smooth50.635.813.6
27P27P.1SphericalNonmetallic bumpy53.538.38.2XX
27P.2SphericalNonmetallic bumpy57.430.911.7X
27P.3SphericalNonmetallic smooth60.236.92.9X
27P.4SphericalNonmetallic smooth57.630.911.5X
27P.5SpheroidalNonmetallic bumpy48.930.720.5X
27P.6SphericalNonmetallic bumpy61.331.77.0X

