Article

Perfluoroalkyl Substance Assessment in Turin Metropolitan Area and Correlation with Potential Sources of Pollution According to the Water Safety Plan Risk Management Approach

1
Società Metropolitana Acque Torino S.p.A.—Centro Ricerche, Corso Unità d’Italia 235/3, 10127 Torino, Italy
2
Università di Torino, Dipartimento di Chimica, Via Pietro Giuria 5, 10125 Torino, Italy
*
Authors to whom correspondence should be addressed.
Separations 2019, 6(1), 17; https://doi.org/10.3390/separations6010017
Submission received: 14 December 2018 / Revised: 25 January 2019 / Accepted: 28 February 2019 / Published: 19 March 2019

Abstract

:
Per and polyfluoroalkyl substances (PFASs) are a huge class of Contaminants of Emerging Concern, well-known to be persistent, bioaccumulative and toxic. They have been detected in different environmental matrices, in wildlife and even in humans, with drinking water being considered as the main exposure route. Therefore, the present study focused on the estimation of PFAS in the Metropolitan Area of Turin, where SMAT (Società Metropolitana Acque Torino S.p.A.) is in charge of the management of the water cycle and the development of a tool for supporting “smart” water quality monitoring programs to address emerging pollutants’ assessments using multivariate spatial and statistical analysis tools. A new “green” analytical method was developed and validated in order to determine 16 different PFAS in drinking water with a direct injection to the Ultra High Performance Liquid Chromatography tandem Mass Spectrometry (UHPLC-MS/MS) system and without any pretreatment step. The validation of this analytical method resulted in really low Quantification Limits (5 ng L−1), in satisfying recoveries (70%–102%) and in a good linearity (R2 = 0.99) for every compound. Among the results, only 4 compounds and only 6% of the samples showed a pollution level higher than the limits of and Quantification (LOQ). Finally, the correlation study between the assessment findings and the industrial sites which serve as potential sources of pollution in the monitored area was carried out.

1. Introduction

Per- and polyfluoroalkyl substances (PFASs) are manufactured organic chemicals that have been widely used over the past decades. They belong to the unique category of fluorosurfactants, which the carbon chain of hosts a substitution of hydrogen with fluorine that builds up the hydrophobic part of the surfactant [1,2]. The two primary commercial production processes to synthetize PFAS are the electrochemical fluorination and the telomerisation, but since 2002, only the telomerisation processes are still used. Generally, perfluorinated compounds (PFCs) like perfluoroalkyl sulfonamides and fluorotelomer alcohols can be degraded naturally under aerobic conditions to perfluoroalkyl carboxylates (PFCAs) and perfluoroalkyl sulfonates (PFSAs) [3] that have been detected in various environmental matrices, like water, soil and air as well as in food, animals and humans [4]. PFAS (PFCAs and PFSAs) represent a huge group of different molecules with unique physicochemical properties, such as extreme hydrophilic and lipophilic character; thermal and chemical stability, making them valuable components for many industrial; and commercial applications. Their key characteristic of having one of the strongest chemical bonds (C–F) in their carbon chain makes them very stable, and they cannot degrade naturally or under heat, acids and oxidation [4,5]. PFASs are, therefore, perfect ingredients for many products with stain-resistant, waterproof or nonstick properties. Among them, there are firefighting foams, food packages, stain-resistant and waterproof fabrics for clothes and carpets, painting materials, etc.
Another way to categorize these compounds is based on their perfluorocarbon chain length. According to the nomenclature given by Buck et al. [5], they are referred to as a long chain and a short chain. The long chain substances include either perfluoroalkyl carboxylates (PFCAs) with eight atoms of carbon or more or perfluoroalkane sulfonates (PFSAs) with at least six atoms of carbon [6] (Table A1). As this category is known to be more bioaccumulative, their replacement with the shorter chained compounds has been pursued in the last couple of decades. However, both kinds are very stable and persistent in the environment as well as toxic, and due to their occurrence and fate in the environment, they have been characterized as Contaminants of Emerging Concern (CECs) [7]. Sources of PFAS in the aqueous environment are landfill leachate, industrial and municipal wastewater treatment plants, dry and wet atmospheric deposition, soil and street surface runoff [6]. Due to their stability properties, they are detected also in drinking water, which is one of the major ways of exposure that poses threats to humans [8,9]. Therefore, it is of great significance to find techniques for effectively removing them from water and of paramount importance to prevent the contamination; according to the framework of the Water Safety Plan (WSP) approach in order to protect human health, it is necessary to evaluate the risks along the drinking water supply system (from the catchment to the consumer). In line with the forthcoming National and European drinking water regulation, SMAT (Società Metropolitana Acque Torino S.p.A.)—the company in charge of the water cycle management in the Turin Metropolitan Area (Italy)—is adopting the Water Safety Plan.
The aim of this study was to assess PFAS occurrence in the Metropolitan Area of Turin in order to estimate the pollution levels and to understand the contaminants’ stability properties. Pursuing the application of green analytical chemistry, a quantitative analytical method for evaluating seventeen different perfluorinated compounds in water samples, without any preconcentration step, was developed and validated. Commonly, PFASs used in consumer products are complex mixtures of many compounds that provide different specific features [10]. For this reason, in this method, we decided to target seventeen linear perfluoroalkyl substances, with a chain length ranging from four to eighteen carbon atoms in order to also investigate the variety of their properties. Among the literature, after years of research on the field of perfluoroalkyl substances, only three methods are reported using a direct injection analysis [11,12,13]; all of them target less than 17 compounds, and they have a longer analysis time than the one reported in this study. A book chapter by Dasu, Kempisty and Mills [3] has reported an overview of the analytical methods that occur for the determination of PFASs in environmental matrices and, more specifically, in different types of water. Even if all the listed methods report low quantitation levels, they used an extraction-pretreatment step [14,15,16,17,18]. Moreover, most of them focused on less number of target compounds (in comparison with those included in our method), and no great differences occurred between them. Furthermore, very few standard methods (Table A6) are reported in the literature for the determination of PFASs in water samples, and only one of them ASTM (American Society for Testing and Material) does not use any pretreatment step but does not refer to drinking water. On the other hand, both the standard ISO 25101:2029(E) method and the EPA (United States Environmental Protection Agency) 537 method, that are concerned with drinking water, use an solid phase extraction (SPE) extraction step and focus on less number of compounds than our “green” method that with direct injection achieved very low Quantitation Limits for all the 16 targets.
Moreover, an estimation study of potential pollution sources was carried out by searching the correlation between the assessment findings and the industrial sites—which represent the major source of pollution, as well as the civilian airports and the wastewater treatment plants—using spatial analysis and multivariate statistical analysis tools. The aim was also to develop a statistical framework for investigating whether the presence of PFASs in the water is associated with the number of source points within a watershed in order to develop a tool for supporting “smart” water quality monitoring programs for emerging pollutants. Water quality monitoring programs are usually set according to the numbers of inhabitants or to the volume of water supplied.

2. Materials and Methods

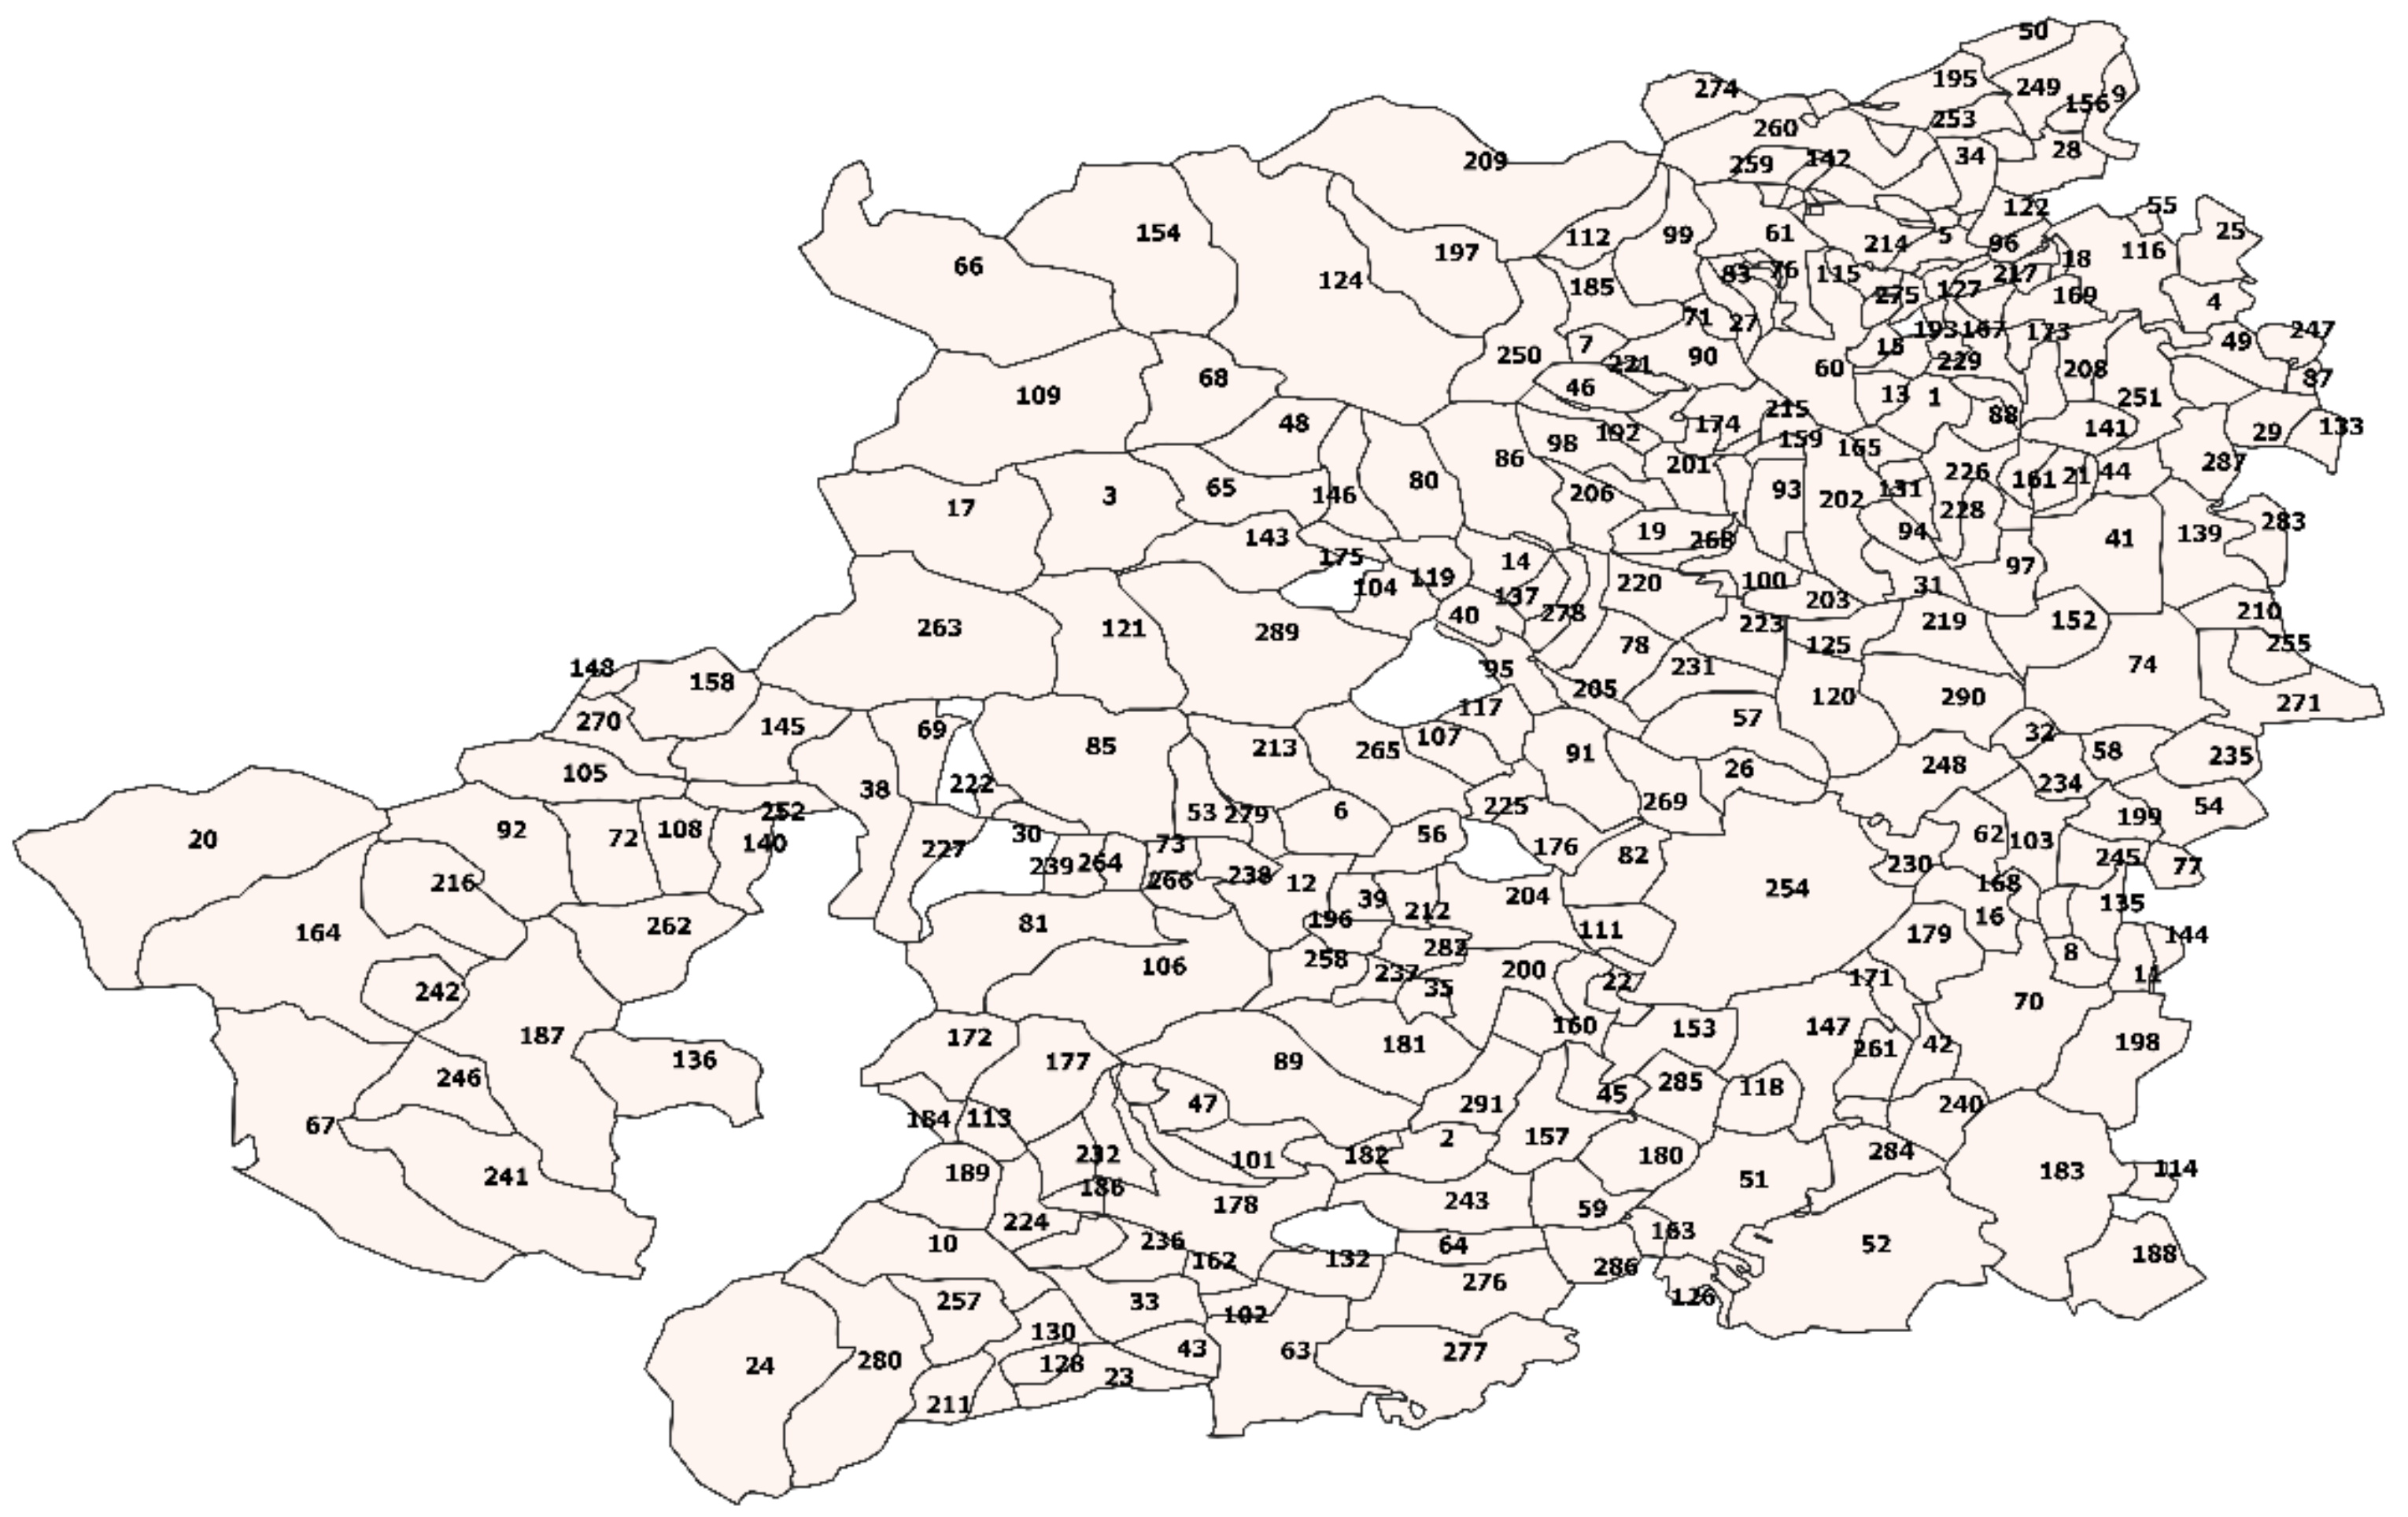
2.1. Study Area and Sampling

SMAT is the company in charge of the water cycle management in the Metropolitan Area of Turin (Piedmont, Italy), supervising 293 municipalities (Figure A3, Table A5) and supplying a population of about 2.3 million inhabitants. In this study, 930 samples were collected from the 291 municipalities managed by SMAT, including 5% of surface, 19% of underground and 76% of drinking water. The sampling campaign and the analysis were carried out from March 2018 until October 2018. Due to the fact that PFASs have a wide range of applications, care needs to be taken during the sampling in order to avoid any contamination or concentration loss. For this reason, polypropylene bottles WM (wide mouth) with caps (volume 125 mL) were used as sample containers, purchased from SciLabware Limited (Stoke-on-Trent, Staffordshire, ST4 4RJ, United Kingdom). Although PFASs are very stable and not degradable at room temperature, the samples were stored at 4 °C prior the analysis (performed within 15 days), in order to prevent the biodegradation of matrix interferences that can affect the recovery of the analytes.

2.2. Reagents and Chemicals

A mix (PFAC-MXB) of seventeen PFASs was examined in this study containing compounds with various carbon chain lengths (between four to eighteen atoms of carbon): thirteen linear perfluoroalkylcarboxylic acids and four perfluoroalkylsulfonates (details in Table 1). The standard mix solution PFAC-MXB was purchased from Wellington Laboratories (Guelph, ON, Canada) with chemical purities of >98% and a concentration of 2000 ng mL−1 in Methanol/Water <1% for every individual perfluoroalkylcarboxylic acid and perfluoroalkylsulfonate. Another mix (MPFAC-MXA) containing seven mass-labelled (13C) perfluoroalkylcarboxylic acids and two mass-labelled (18O and 13C) perfluoroalkylsulfonates was used as internal standards (details in Table 1). The mix solution MPFAC-MXA was purchased from Wellington Laboratories (Guelph, Ontario, Canada) with chemical impurities >98% and a concentration of 2000 ng mL−1 in Methanol/Water <1% for every individual mass-labelled perfluoroalkylcarboxylic acid and mass-labelled perfluoroaklylsulfonate and with isotopic impurities of 99% per 13C and >94% per 18O. UHPLC-grade Methanol was purchased from Sigma-Aldrich, Co (St. Louis, MO, USA), MilliQ was obtained from MilliPore (MA, USA) and Ammonium acetate for LC-MS LiChropur® was purchased from Merck KGaA (Darmstadt, Germany).

2.3. Sample Preparation

The samples were injected directly into the analytical system without any pretreatment step. A filtration step was not necessary as the samples—mostly drinking water—were not contaminated with soils or suspended organic matter. Two working standard solutions—in 50% Methanol/50% Water for the first and in 100% Water for the second—were prepared with a dilution from each of the two stock solutions and used for the calibration. The purchased solutions were stored at 4 °C in the fridge, while the other four were stored at room temperature. A volume of 700 μL of each sample was transferred into 0.7 mL Polypropylene Short Thread Micro-Vials (purchased from CPS Analitica for Chemistry, Milan, Italy), and 1 μL of the Internal Standard mix (50 ng L−1) was added.

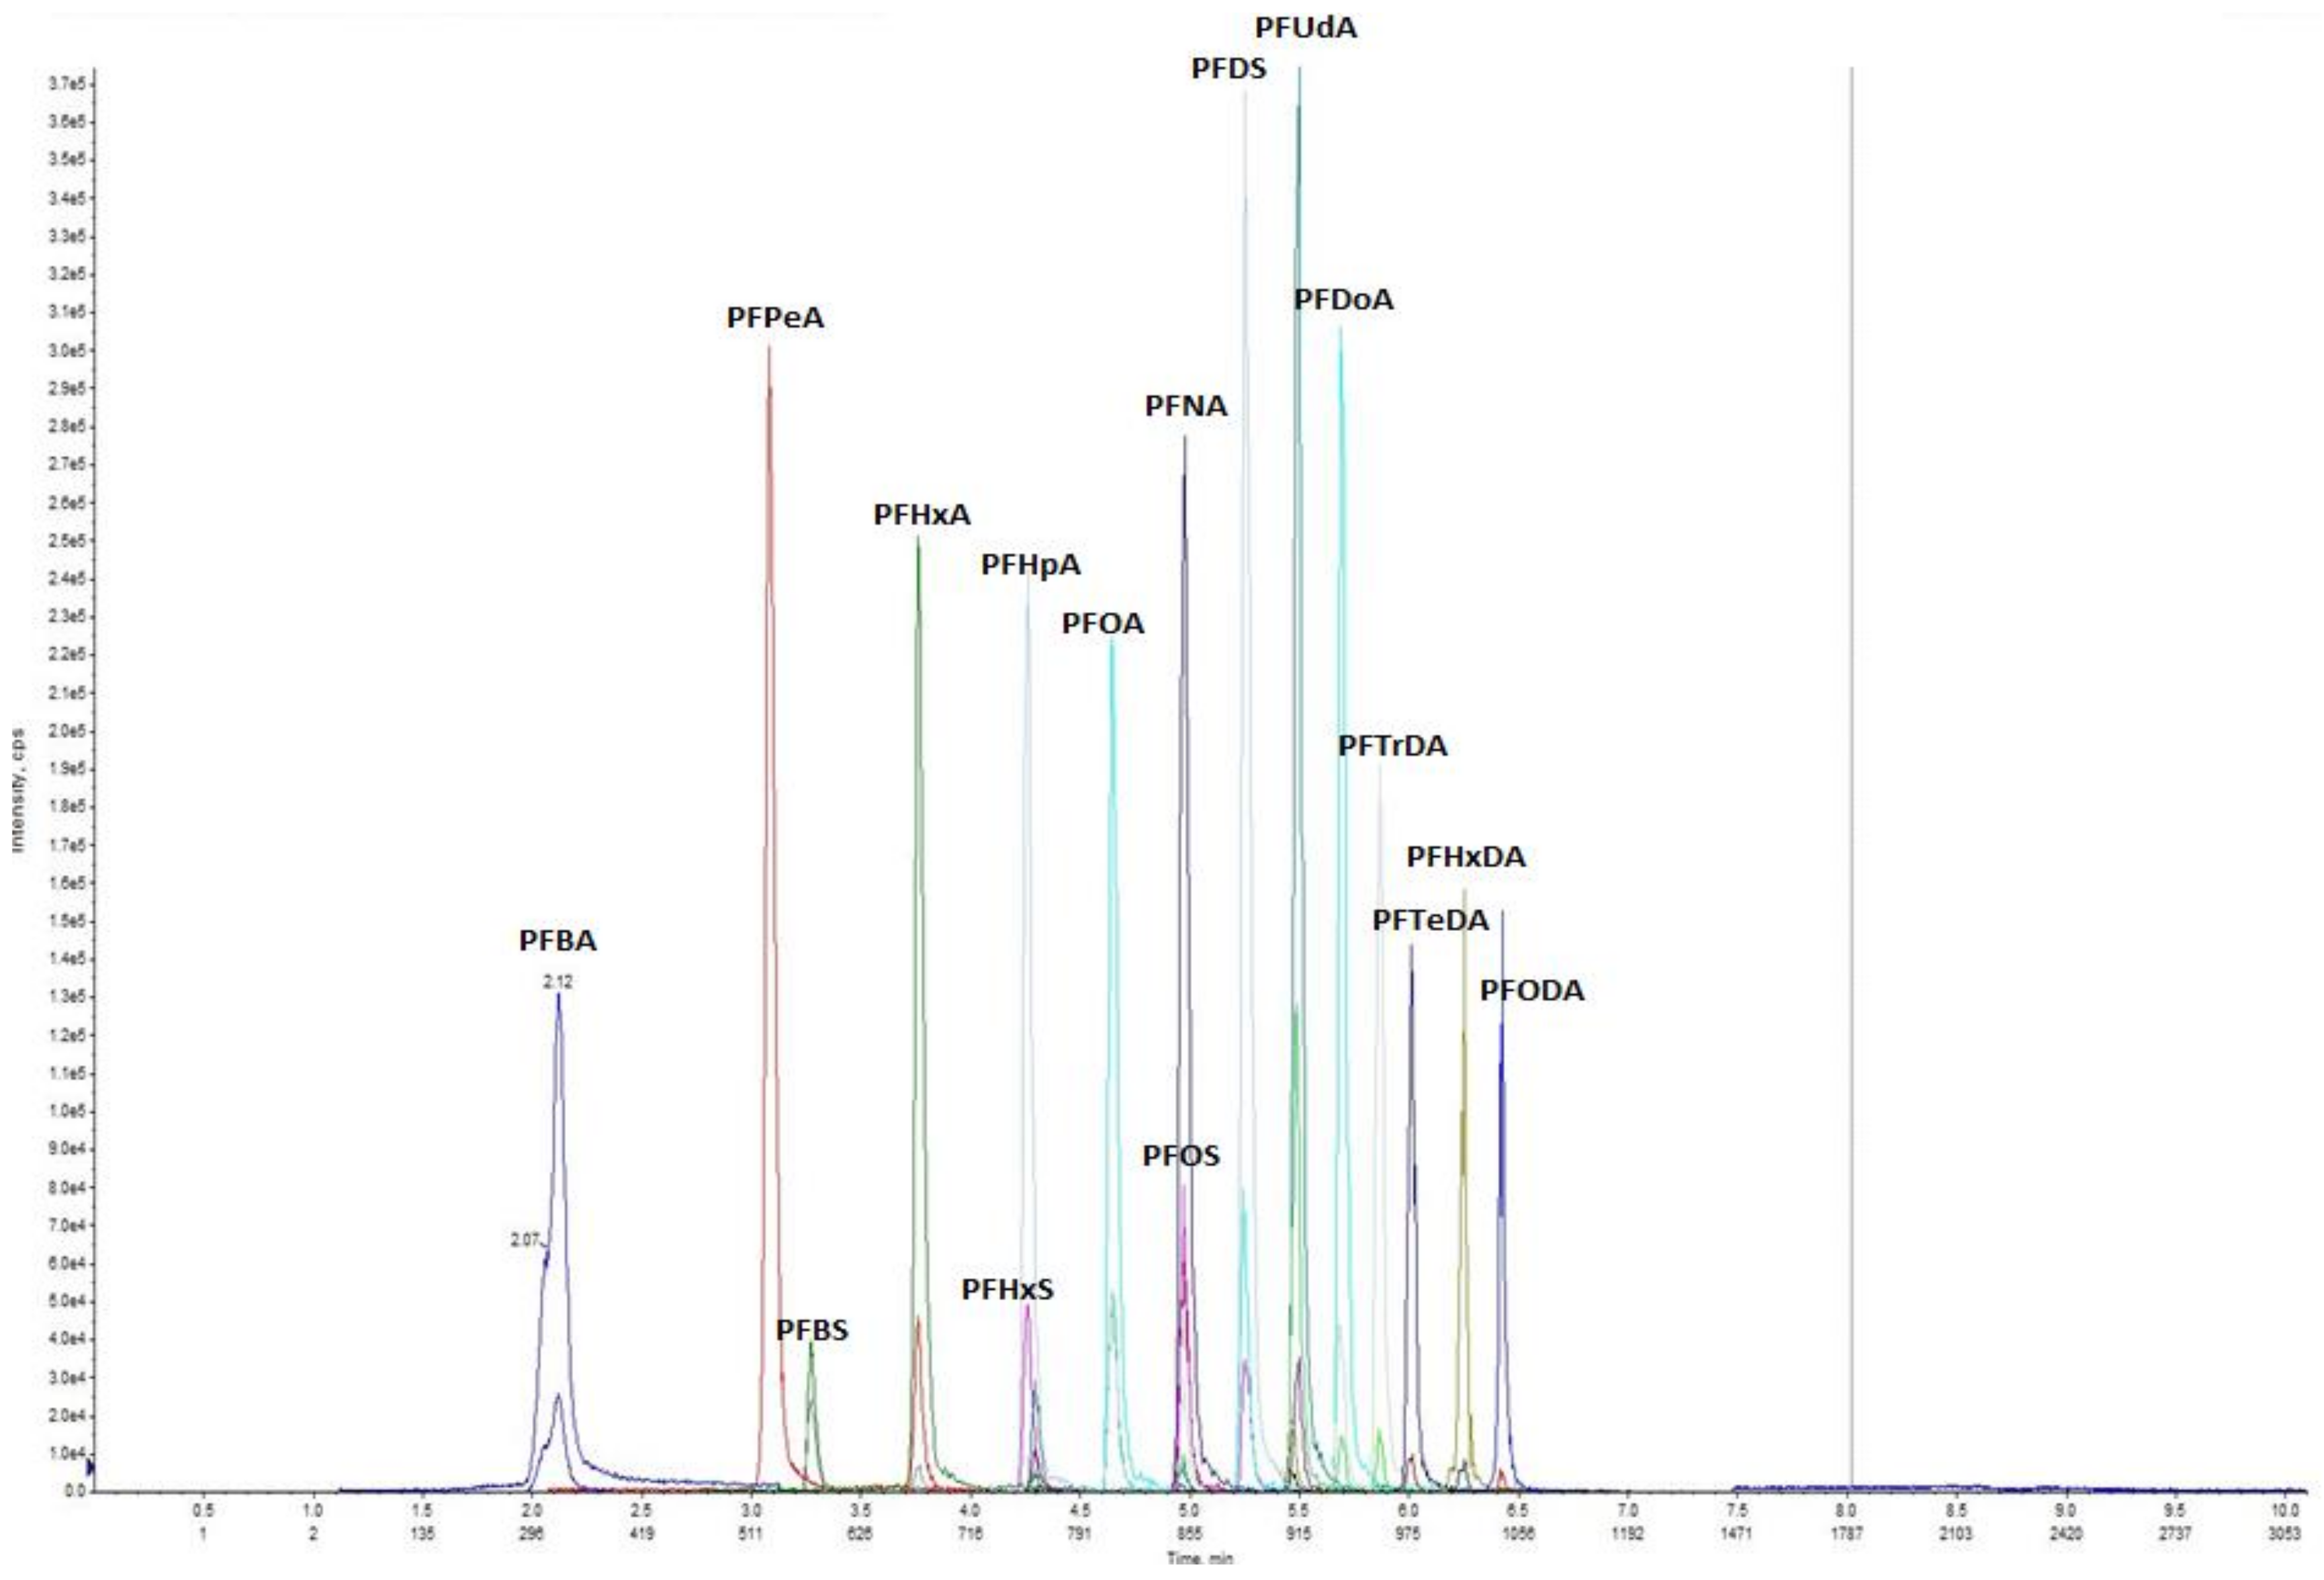
2.4. Instrumental Analysis

Analyses were carried out using the SCIEX QTRAP® 6500 system (SCIEX, Framingham, MA, USA) with a Thermo Scientific Dionex UltiMate 3000 UHPLC system and a RS-3000 autosampler (Dionex Softron GmbH, Germering, Germany). The UHPLC instrument was equipped with a Luna® C18 (2) HPLC Column (5 µm particle size, 30 mm × 2.0 mm; Phenomenex Inc., Torrance, CA, USA) installed between the eluent mixer and the autosampler, in order to delay the potential contamination originating from the UHPLC system. The chromatographic separation was achieved using a Luna® Omega PS C18 HPLC Column (1.6 µm particle size, 50 mm × 2.1 mm; Phenomenex Inc., Torrance, CA, USA)—heated to 40 °C—by injecting a 50 µL sample volume at a mobile phase consisted of a mixture of 20 mM Ammonium Acetate in water (A) and Methanol (B), lasting a total time of 12 min. The gradient profile, with a flow rate of 0.550 mL/min, started with 98% A and 2% B, increasing to 100% B in 6 min, and, after keeping this ratio for 1.5 min, reversed into the initial conditions (Table A2). The QTRAP® 6500 system was operated in Negative Electrospray Ionization Mode (ESI) (parameters used: gas temperature at 350 °C, curtain gas and collision gas pressure of 30 psi and Ionspray voltage of −4500 V), using Multiple Reaction Monitoring (MRM) scan mode, where Q1 and Q3 were set to more than one single mass allowing specific fragment ions from specific parent molecular ions to be detected [19]. The parameters for the ESI source and MRM are summarized in Table A3 and Table A4. The chromatograms and spectra were processed using the Analyst 1.6.2 software (SCIEX, Framingham, MA, USA).

2.5. Method Validation and Quality Assurance

A validation process was carried out in order to assure the applicability of the developed method. The validation parameters included precision, accuracy, linearity, recovery and limits of Detection (LOD) and Quantification (LOQ). The ISO/IEC 17025 accreditation requirements and, in particular the ones set by Accredia, the Italian National System for the Accreditation of Laboratories were used as guidelines of the method’s validation. Six-point calibration curves were built, and for each point, fifteen replicates were analysed. The quantitation was performed using the MultiQuantTM 3.0.3 software (SCIEX, Framingham, MA, USA).
In addition, blank and quality control samples were analysed in order to ensure the best performance of the instrument during the analysis. The quality control samples were prepared by mixing the standard solution with MilliQ water at a final concentration of 50 ng L−1 and spiked with 50 ng L−1 of the internal standard mix. In the batch, their analysis was performed after the linear calibration curve (range 5–120 ng L−1), used for the quantification and after every ten samples.

2.6. Spatial and Statistical Analysis

A spatial analysis was used to develop a framework for predicting the potential pollution levels in specific municipalities, based on the industrial activities and waste water treatment plants (WWTPs) that are close to the sampling points. In our study, information about 176 industrial sites (Figure A1) and 800 WWTPs present in the studied territory were taken from Arpa Piemonte [20,21], and in particular, the geographical data (coordinates in WGS 84 system and maps of the area) used were downloaded from the Diva-Gis [22] platform. The QGIS 3.4 software was used in order to find a correlation between industrial sites and WWTPs within a radius of 5 km that could be potential sources of pollution and sampling points with concentrations above the Limits of Quantification. Because of the lack of information available concerning emerging pollutants employed by the industrial sites, this led us to choose them according to their sector of activities and to products known to potentially employ PFASs. Multivariate spatial regression models [23] were developed for the areas where PFASs were detected, in order to evaluate the correlations with the potential point sources of pollution selected. We used the GeoDa 1.12 software in order to build the Ordinary Least Squares (OLS) and the Spatial Regression models. The Moran’s I statistic was used to test for spatial autocorrelation between the area units, while the Akaike info criterion was used to check which of the two models is stronger in predicting the correlation between the potential point sources and the positive polluted areas [24].

3. Results and Discussion

3.1. Cross Contamination

As stated above, PFASs have many different applications, so that cross contamination at trace levels of PFAS even from laboratory equipment’s which contain fluoropolymers will have a large impact on the accuracy and validity of the analytical results, especially in analytical methods performing at nanograms per liter (or parts per trillion; ppt) of sensitivity [11]. In order to minimize these effects, online SPE-LC-MS/MS methods have been developed for PFAS determination in water [12]. Although, the direct injection method, due to the absence of extraction and cleanup steps, is the best choice to avoid background contamination during all the analysis steps, a meticulous and methodical manipulation of the samples is necessary. Teflon and glass materials were avoided throughout the analysis, as well as a filtration step, even if it was not necessary for the drinking water, in order to minimize any contamination of the samples. Furthermore, a smaller HPLC column was added between the pump and the injector in order to delay any possible contamination originating from the solvents, meaning substances that can be coeluted with the target compounds [12,13,14,15].

3.2. Method Optimization

Spiked water samples analysed without any pretreatment step and by direct injection proved unsuccessful as the results showed la ow recovery for the longer chain compounds. Therefore, taking into account the different chemical properties among the seventeen target compounds, we optimized the choice of solvent added to the samples according to the reports of the EPA 537 method. Varying the solvents’ percentage ratio in both the working standards (Section 2.2), we reached satisfying results by preparing the standard solutions in 50% Methanol/50% Water.
Chromatographic conditions were optimized as well. A Luna® Omega PS C18 HPLC Column was used for the analysis, but the best chromatographic separation was achieved after using another C18 column (Luna® C18 (2) HPLC Column) as an isolator to separate the target compounds in the analytical samples from those potentially present in solvents. Moreover, as stated above, a gradient elution of the mobile phase containing a Methanol and Ammonium Acetate solution was used for the analysis. Firstly, an elution starting with 40% Methanol and 60% Ammonium Acetate in water (5 mM) increasing to 100% Methanol and returning at the initial conditions within 6 min was tried. The separation of the longer chain compounds was satisfactory with these conditions, but some of the shorter chain PFASs were co-eluted at the beginning of the chromatogram (Figure A2). For this reason, the best analyte’s separation and shape of the peaks were achieved by increasing to a 20 mM the concentration of the Ammonium Acetate solution and by varying the analysis time and the gradient analysis profile.
In a PFAS analysis, the use of isotopically labelled internal standards is endorsed in order to ensure the best results. The added concentration of the internal standard was 50 ng L−1. In order to calculate the PFAS concentration in the samples, the ratio between the areas of the compounds’ peaks and that of the internal standards were used.

3.3. Validation Study

A calibration curve with six points of final concentrations 5, 10, 25, 50, 90 and 120 ng L−1 was built by mixing different amounts of the mix B (concentration 1 μg L−1) and MilliQ water and by adding to everything 50 ng L−1 of the internal standard solution. The quantitative data were analysed using statistical modules in order to define the linearity, accuracy, precision and recovery as well as the Limits of Detection and Quantification.

3.3.1. Linearity

Linearity is based on the linear regression analysis of the obtained quantitative data. Six-point calibration curves were built in the 5–120 ng L−1 concentration range. The regression coefficients (R2) were calculated by laying out the ratio between the target peak area, the relative Internal Standard (IS) peak area and the concentrations. A 1/x concentration-weighting factor was used in order to give more emphasis to the lower concentrations and to ensure the best assay performance [23]. Good coefficient results (R2 0.99) (Table 2) were obtained for the short chain compounds, indicating a good linear correlation, as well as for longer chain compounds, as the coefficients for perfluoro-n-tridecanoic acid (PFTrDA), perfluoro-n-tetradecanoic acid (PFTeDA) and perfluoro-n-octadecanoic acid (PFODA) were greater than 0.98.

3.3.2. Accuracy, Recovery and Precision

The measurement of the systematic and random errors is a crucial step of the method’s validation. According to the ISO/IEC 17025, the required values for precision are RSD ≤ 20% and for a recovery within the range of 70%–120%. The variability and reproducibility of the results were calculated for each point of the calibration curve, giving results obeying the requirements; in Table 2, only those for 50 ng L−1 are reported. Similarly, the accuracy of the method, based on the trueness of the results, was satisfying the criterion ≤30% for every point of the calibration curve and for every analyte (Table 2). Sodium-1-decanesulfonate (PFDS) was the only compound that did not have good validation results, leading us to exclude it from our method. The recovery of the compounds was also checked in spiked real water samples, obtaining satisfying results (Table 3).

3.3.3. Limits of Detection and Quantification

The Limits of Detection and Quantification for each analyte were determined based on the results obtained from the 15 replicates of the six-point calibration curves. The LOD was calculated by multiplying 3.3 times the standard deviation of the y-intercepts and by dividing by the slope of the calibration curve, as stated in the ICH (International Conference on Harmonisation) Method. Similarly, the LOQ was 10 times the standard deviation of the y-intercepts and was divided by the slope of the calibration curve. The obtained results for the LOQs of the target PFAS varied from 3 (for shorter chain compounds) to 8 ng L−1 (for longer chain compounds). However, for the practical and data processing uniformity as a Limit of Quantification for every compound (as stated also in the ASTM D7979-17 method), the lowest point of the calibration curve satisfying for the accuracy and precision the criteria of less than 30% (considering the 15 replicates) was adopted In this way, for every compound, the LOQ is 5 ng L−1 (Table 2).

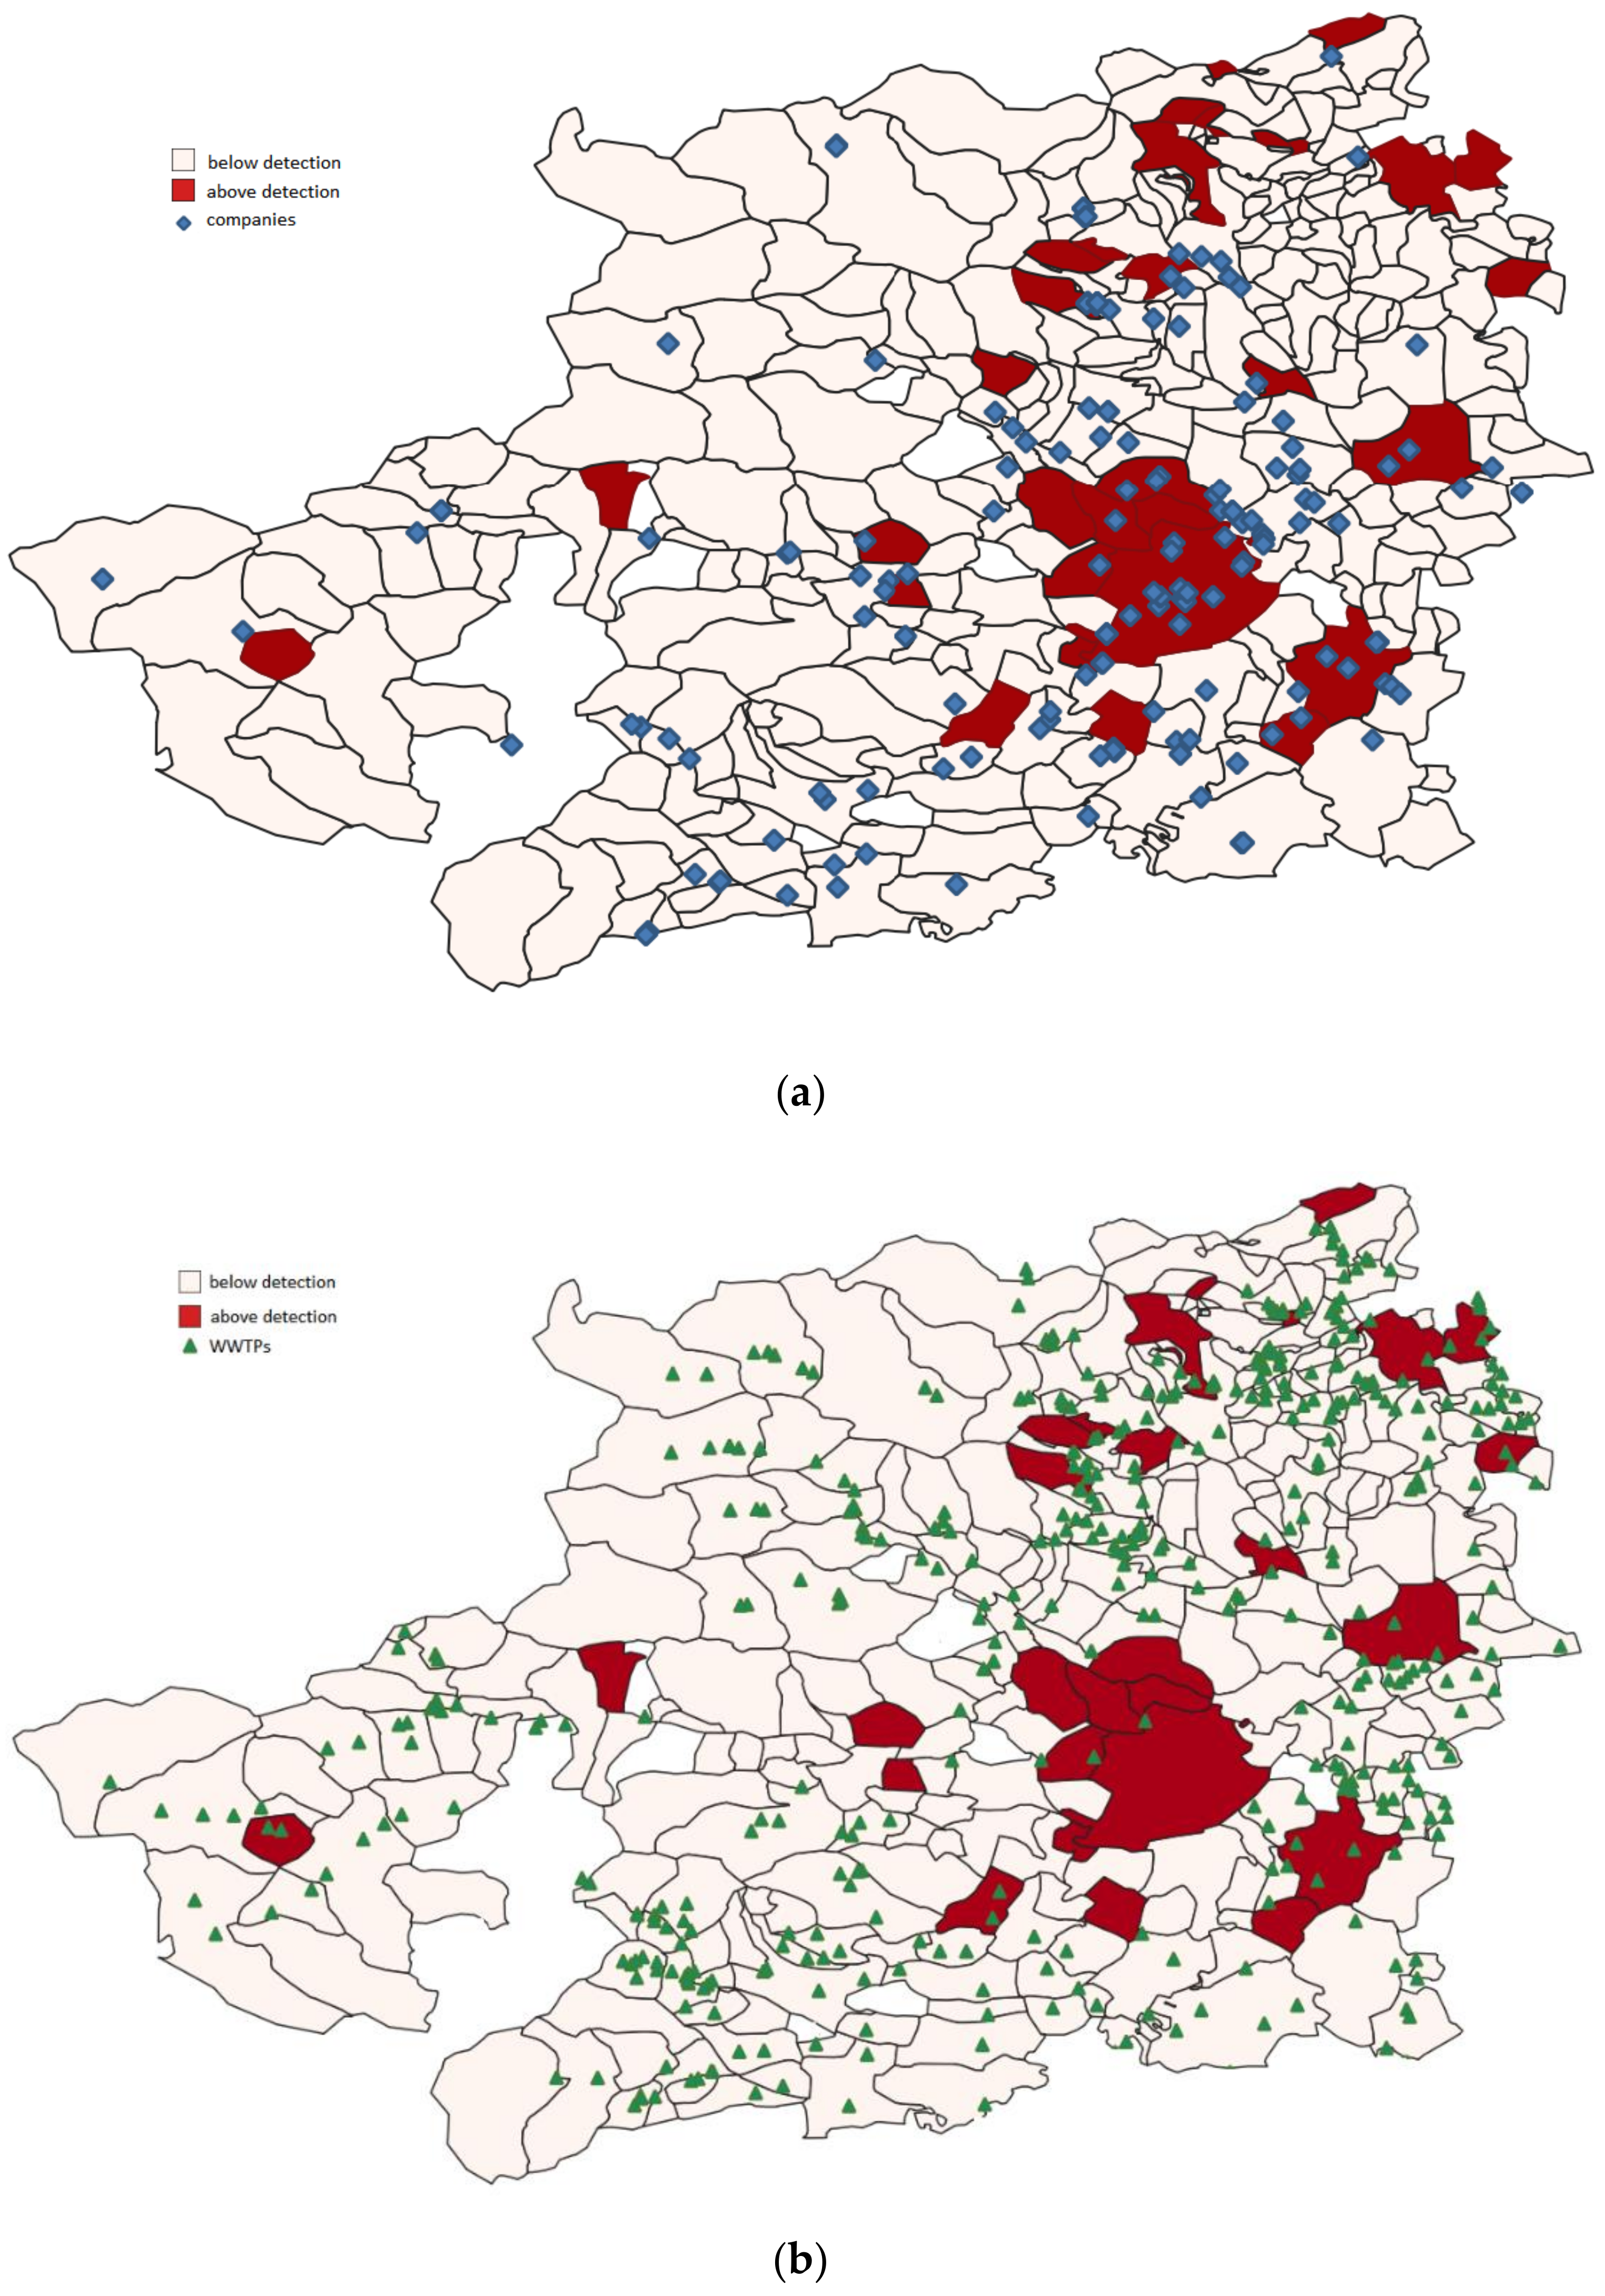
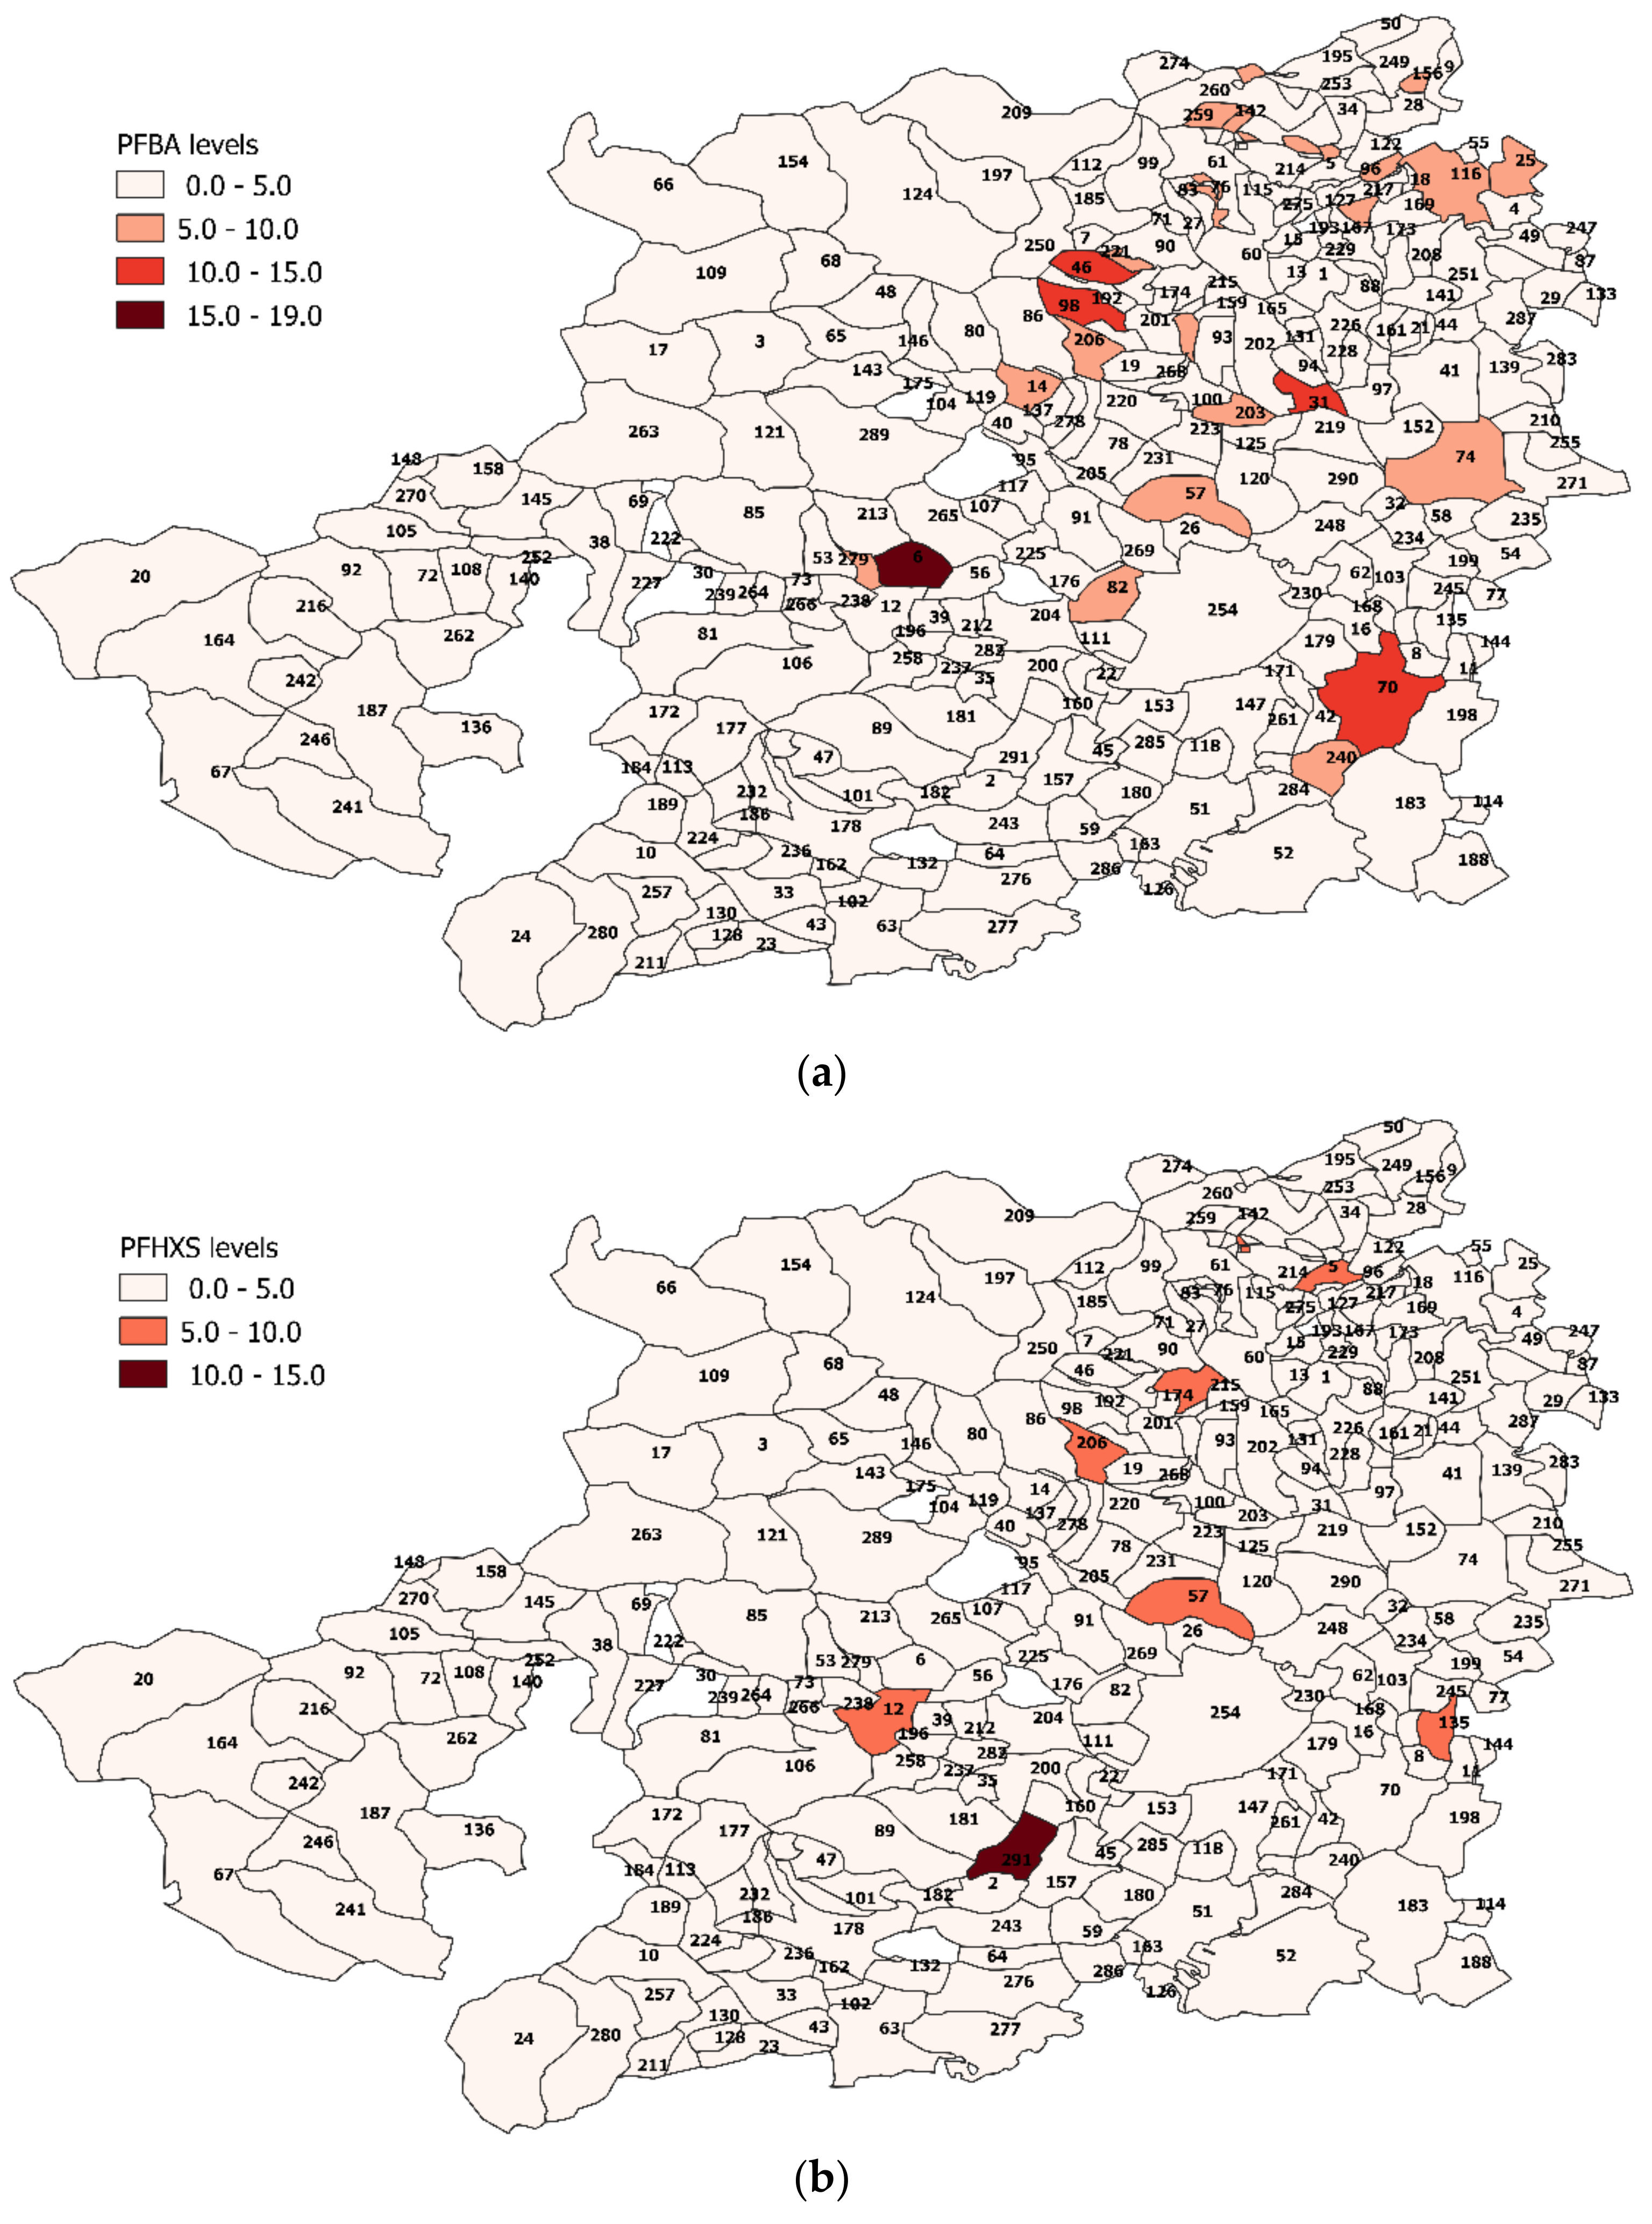
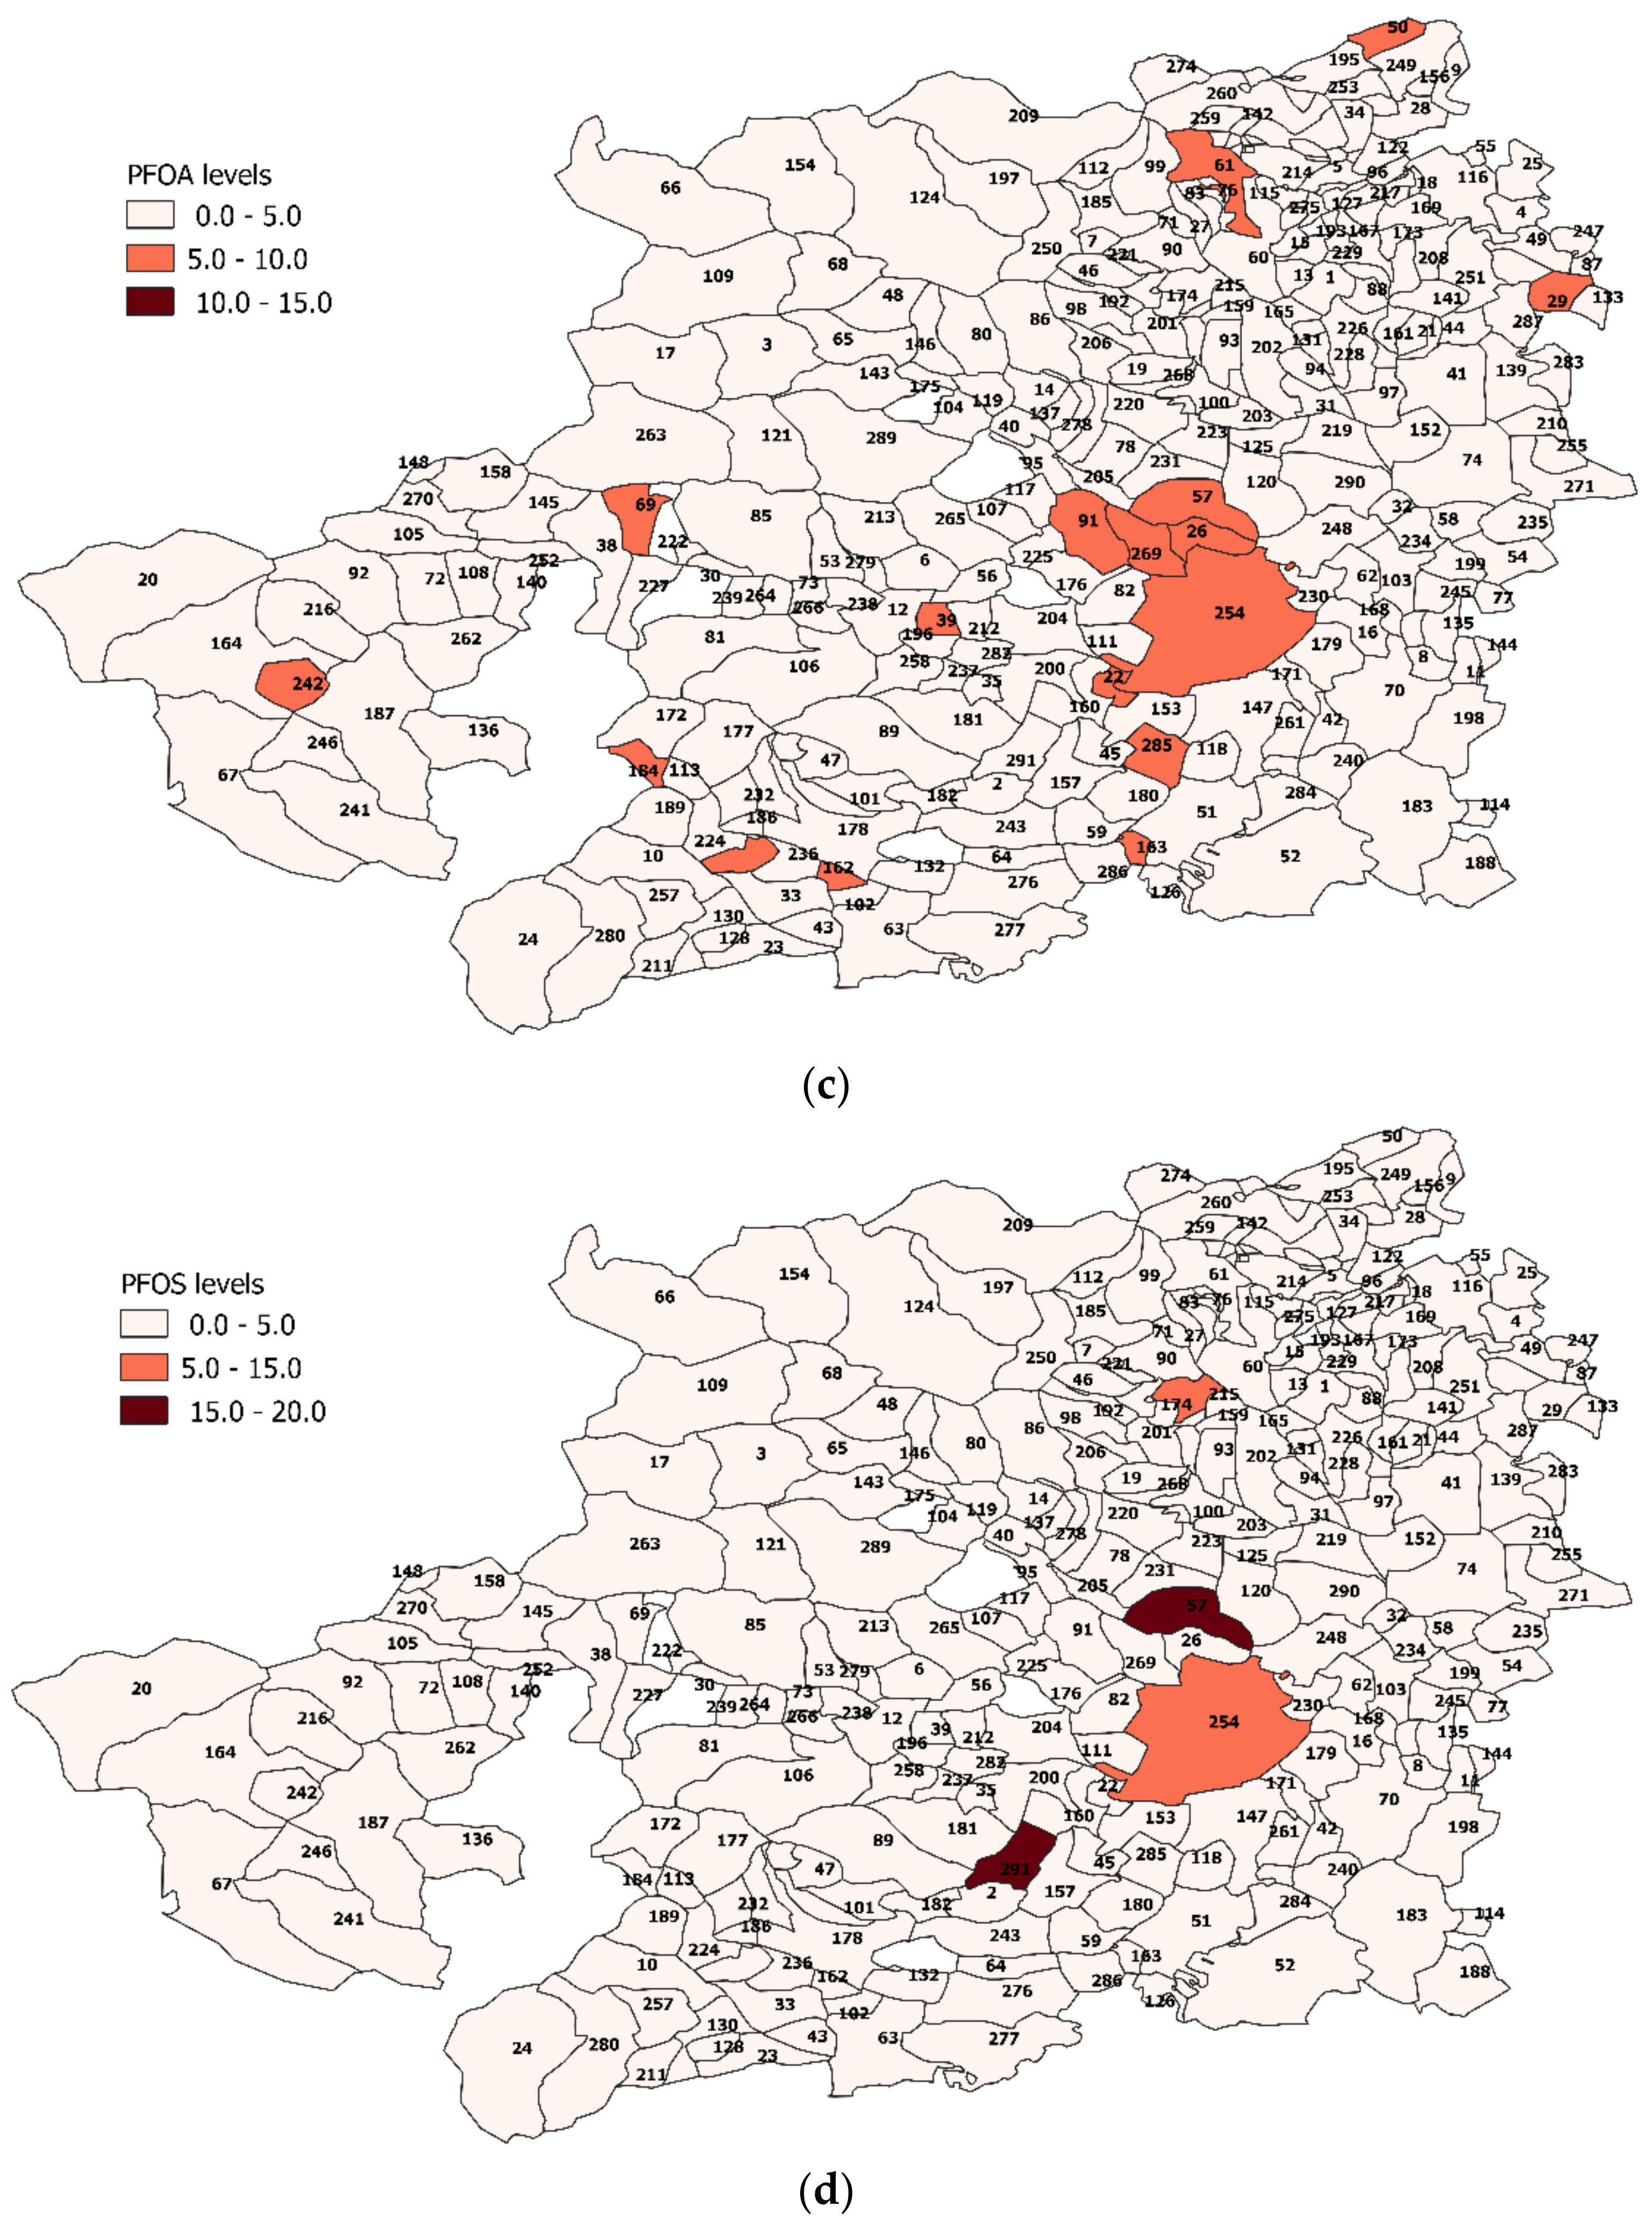
3.4. PFAS Assessment in Turin Metropolitan Area

The developed method was applied for the estimation of PFAS pollution in the Metropolitan Area of Turin. Taken from all stages of the water supply system (from the catchment till the tap) through a sampling campaign organized by SMAT were 930 samples. Among the samples, 5% of them were surface, 19% were underground and 76% were drinking water samples. As a sum of the sixteen target PFASs, the highest detected concentration was 57 ng L−1. Only four out of the sixteen compounds monitored were detected in the area in concentrations above the Limit of Quantification (5 ng L−1): Perfluoro-n-butanoic acid (PFBA), perfluoro-1-hexane [18O2] sulfonate (PFHxS), perfluoro-n-octanoic acid (PFOA) and sodium perfluoro-1-octanesulfonate (PFOS) (Figure 1). The highest detected concentration for PFBA was 19 ng L−1, while for PFHxS and PFOA, it was 15 ng L−1 and 9 ng L−1, respectively. The highest detected concentration among the four compounds was for PFOS, 23 ng L−1, and as a finding was in contrast with the results from other methods which report as a general finding that concentrations of carboxylates were higher than those of sulfonates [23]. All the results are lower than the drinking water performance values set from the Italian Ministry of Health (30 ng L−1 for PFOS and 500 ng L−1 as sum of PFAS) and are reported in the Revision of the Drinking Water European Directive (100 ng L−1 as single and 500 ng L−1 as sum of PFAS).
Among the assessment findings, the highest pollution rates were detected near industries and Wastewater Treatment Plants (WWTPs) as could be expected. Moreover, only in one municipality were all the four compounds detected together, and that was near the airport where, as it is known from the literature, aqueous film-forming foams (AFFF)—foams with fluorinated chemicals—can be used [3].

Spatial Analysis Results

Only 54 out of the 930 samples analysed were detected with a concentration of PFAS above the quantification limit. A correlation study between the positive sampling points and the companies or the wastewater treatment plants (WWTPs) that are surrounding them within 5 km was carried out. The results showed that around areas where PFASs were detected more industrial sites or WWTPs exist than those that showed no pollution.
The spatial regression models explain 8%–66% of the variance in the water samples for the four PFAS compounds that were detected. Increasing PFBA concentrations are positively associated with the number of industrial sites and the WWTPs that are present in the surrounding area of the sampling point, and this relationship resulted in being statistically significant (p < 0.001), which is the strongest statistical association across the positive sampling points and the point sources. On the contrary, the other three compounds showed a positive correlation with the industrial sites but a negative association with the waste water treatment plants, and that relationship showed also a lack of statistical significance (p > 0.05) (Table 4). This indicates that PFAS releases from WWTPs are important but less significant than those from industries, and it is consistent with results obtain from Hu et al. [24]. These results can be explained because of the low number of sampling points with a concentration above the quantification limit for these three compounds available (for PFHxS, only 7 out of the 930 samples were positive, whereas for PFOS, only 6 out of the 930 were positive).
Nevertheless, the small number of polluted samples harden the statistical analysis, as for this process, a large number of data is required. The results obtained from the spatial analysis showed that one independent variable (industrial sites) is a significant predictor for all the detected PFAS compounds and can be taken into account in order to guide the future choice of the sampling points presenting a higher risk factor. Instead, the independent variable WWTPs is a significant predictor only for the PFBA pollution (PFBA was the more frequent detected pollutant), indicating that the other three compounds are most probably released from the industries and not the WWTPs that occur in the area.
The spatial analysis performed was challenging due to the lack of information available. Geospatial data for many potentially important PFAS point sources are lacking as well as information about the companies’ production processes. Moreover, there are no data about the employment of this class of substances (as PFAS are not regulated yet) or the airborne emissions, in order to value the importance of atmospheric releases. Finally, there are no information about where and if the intake of the water supply is upstream from point source of pollution, and so on.

4. Conclusions

A new “green” validated method for determining 16 different PFAS in drinking water samples is presented. The key characteristic of this method, which makes it unique, is the absence of a pretreatment or preconcentration step and a direct injection into the UHPLC system coupled to a triple quadrupole mass spectrometer. Even the numerous difficulties faced in order to achieve the best performance, good recovery results—which were within the range reported in the standards’ requirements—and really low Quantification Limits (5 ng L−1) were achieved. Even if this method is oriented to be applied only for drinking water samples, it provides the analyte with a high sensitivity in determining PFASs at very low concentrations—a scale of nanograms per liter (or parts per trillion; ppt).
Another aim of this study was the PFAS assessment in the Metropolitan Area of Turin which was carried out using this method in order to estimate the pollution in the area. Among the results, only four compounds were detected above the limits of quantification and only in 6% of the analysed samples. Nevertheless, despite the low detected pollution rates, a correlation study in order to estimate the potential sources of this pollution was carried out. Instead of performing a “blind” monitoring water quality control, a spatial analysis is a useful tool in order to guide the future choice of the sampling points presenting a higher risk factor as well as the inputs to support the surveillance and water quality control activities. It has to be taken into account that PFASs include thousands of compounds, and as a result, the chemical analysis alone cannot cover the complete assessment of the potential pollution with this kind of contaminants; the same can be said for other classes of emerging pollutants. Considering the costs, the effort and the environmental impact of the chemical analysis for emerging pollutants’ assessment, the “smart” monitoring program is much more better performing due to the prioritization of the site at major risks. However, the low number of data beyond the limit of quantification and the lack of information about the industrial activities which can cause pollution in the area provided us some satisfactory preliminary results. Further study is ongoing for addressing and collecting more information in order to enrich the results.
From the lessons learned in this study, it is important to highlight that the strengthening of the cooperation and active participation of the Regional Health and Environmental Protection Agencies, Water Companies and Stakeholders are crucial strategies for risk management in the watershed, as only a great number of data and information can give statistically significant results.

Author Contributions

Conceptualization, R.B. and P.C.; methodology, D.P. and S.M.; software, D.P. and S.M.; validation, D.P., S.M. and G.C.; formal analysis, D.P. and S.M.; investigation, D.P. and S.M.; data curation, D.P. and S.M.; writing—original draft preparation, D.P.; writing—review and editing, P.C. and R.B.; visualization, R.B.; supervision, R.B.; project administration, R.B.; funding acquisition, R.B. and P.C.

Funding

This paper is part of a project that has received funding from the European Union’s Horizon 2020 research and innovation program under the Marie Sklodowska-Curie Grant Agreement No 765860 (AQUAlity).

Acknowledgments

The authors wish to thank Francesco Barsotti for his contribution and support.

Conflicts of Interest

The authors declare no conflict of interest.

Appendix A

Table A1. The categorization according the chain length [3].
Perfluoroalkane Sulfonates (PFSA)Perfluoroalkyl Carboxylates (PFCA)
Short Chain
n ≤ 5
e.g., PFBS
Long Chain
n ≥ 6
e.g., PFHxS, PFOS and PFDS
Short Chain
n ≤ 7
e.g., PFBA, PFPeA, PFHxA and PFHpA
Long Chain
n ≥ 8
e.g., PFOA, PFNA, PFDA, PFUdA, PFDoA, PFTrDA, PFTeDA, PFHxDA and PFODA
Table A2. LC Gradient conditions.
Time (min)Flow Rate (mL/min)A %B %
0.0000.550982
0.0000.550982
0.5000.550982
1.0000.5507030
6.0000.5500100
7.5000.5500100
7.6000.550982
10.0000.550982
Table A3. Electrospray Ionization Mode (ESI) source parameters.
ParameterValue
PolarityNegative
Curtains Gas30 psi
Collision Gas30 psi
Ionspray Voltage−4500 V
Temperature350 °C
GS150 psi
GS255 psi
Table A4. Multiple Reaction Monitoring (MRM) transitions and the retention time (RT) for analytes and internal standards.
CompoundQ1 m/zQ3 m/zRT
PFBA2131692.1
PFPeA2632193.1
PFHxA1312693.8
PFHpA3633194.3
PFOA4133694.6
PFNA4634195.0
PFDA5134696.9
PFUdA5635195.5
PFDoA6135695.7
PFTrDA6636195.9
PFTeDA7136696.0
PFHxDA8137696.3
PFODA9138696.5
L-PFBS299993.3
L-PFHxS399994.3
L-PFOS499995.0
L-PFDS599995.4
MPFHxS403104.3
MPFOS503995.0
MPFBA2171722.1
MPFHxA3152703.8
MPFOA4173724.6
MPFNA4684234.9
MPFDA5154705.2
MPFUdA5655205.5
MPFDoA6155705.7
Figure A1. A map of the pollution levels of PFAS as a sum (limit 10 ng L−1) and the selected point sources present in the studied area: (a) industrial sites and (b) waste water treatment.
Separations 06 00017 g0a1
Figure A2. A typical chromatogram.
Separations 06 00017 g0a2
Table A5. A list of the municipalities monitored and the samples analysed.
Municipality
Name ID
Number IDSamples AnalysedMunicipality
Name ID
Number IDSamples Analysed
AGLIE’11MONCALIERI14721
AIRASCA21MONCENISIO1481
ALA DI STURA36MONTALDO TORINESE1493
ALBIANO D’IVREA43MONTALENGHE1501
ALICE SUPERIORE52MONTALTO DORA1511
ALMESE611MONTANARO1522
ALPETTE72NICHELINO1536
ANDEZENO82NOASCA1544
ANDRATE91NOLE 1553
ANGROGNA102NOMAGLIO1562
ARIGNANO111NONE1572
AVIGLIANA127NOVALESA1581
BAIRO131OGLIANICO1593
BALANGERO143ORBASSANO1602
BALDISSERO CANAVESE151ORIO CANAVESE1612
BALDISSERO TORINESE163OSASCO1622
BALME172OSASIO1632
BANCHETTE181OULX1642
BARBANIA192OZEGNA1651
BARDONECCHIA201PANCALIERI1661
BARONE CANAVESE212PARELLA1672
BEINASCO229PAVAROLO1682
BIBIANA231PAVONE CANAVESE1691
BOBBIO PELLICE242PECCO1701
BOLLENGO253PECETTO TORINESE1712
BORGARO TORINESE2612PEROSA ARGENTINA1721
BORGIALLO271PEROSA CANAVESE1732
BORGOFRANCO D’IVREA283PERTUSIO1741
BORGOMASINO291PESSINETTO1752
BORGONE SUSA304PIANEZZA1768
BOSCONERO317PINASCA1771
BRANDIZZO323PINEROLO1781
BRICHERASIO331PINO TORINESE1791
BROSSO341PIOBESI TORINESE1801
BRUINO357PIOSSASCO18110
BURIASCO361PISCINA1821
BUSANO372POIRINO1835
BUSSOLENO383POMARETTO1842
BUTTIGLIERA ALTA392PONT CANAVESE1855
CAFASSE402PORTE1861
CALUSO412PRAGELATO1871
CAMBIANO422PRALORMO1882
CAMPIGLIONE FENILE432PRAMOLLO1891
CANDIA CANAVESE449PRAROSTINO1902
CANDIOLO451PRASCORSANO1912
CANISCHIO462PRATIGLIONE1921
CANTALUPA471QUAGLIUZZO1932
CANTOIRA483QUASSOLO1946
CAPRIE494QUINCINETTO1952
CARAVINO503REANO1962
CAREMA515RIBORDONE1976
CARIGNANO526RIVA PRESSO CHIERI1983
CARMAGNOLA532RIVALBA1991
CASALBORGONE542RIVALTA DI TORINO2002
CASCINETTE D’IVREA553RIVARA2011
CASELETTE565RIVAROLO CANAVESE20210
CASELLE TORINESE575RIVAROSSA2032
CASTAGNETO PO582RIVOLI2045
CASTAGNOLE PIEMONTE592ROBASSOMERO2051
CASTELLAMONTE608ROCCA CANAVESE2061
CASTELNUOVO NIGRA615ROLETTO2071
CASTIGLIONE TORINESE623ROMANO CANAVESE2082
CAVOUR631RONCO CANAVESE2099
CERCENASCO641RONDISSONE2101
CERES655RORA’2112
CERESOLE REALE664ROSTA2121
CESANA TORINESE671RUBIANA2138
CHIALAMBERTO685RUEGLIO2142
CHIANOCCO691SALASSA2152
CHIERI704SALBERTRAND2162
CHIESANUOVA711SALERANO CANAVESE2171
CHIOMONTE721SAMONE2182
CHIUSA DI SAN MICHELE732SAN BENIGNO CANAVESE2193
CHIVASSO748SAN CARLO CANAVESE 2202
CICONIO751SAN COLOMBANO BELMONTE2211
CINTANO761SAN DIDERO2222
CINZANO771SAN FRANCESCO AL CAMPO2231
CIRIE’ 788SAN GERMANO CHISONE2241
CLAVIERE 791SAN GILLIO2258
COASSOLO TORINESE 802SAN GIORGIO CANAVESE2262
COAZZE812SAN GIORIO DI SUSA2273
COLLEGNO8213SAN GIUSTO CANAVESE2281
COLLERETTO CASTELNUOVO833SAN MARTINO CANAVESE2292
COLLERETTO GIACOSA841SAN MAURIZIO CANAVESE2302
CONDOVE851SAN MAURO TORINESE2312
CORIO862SAN PIETRO VAL LEMINA2321
COSSANO CANAVESE872SAN PONSO2331
CUCEGLIO882SAN RAFFAELE CIMENA2342
CUMIANA891SAN SEBASTIANO DA PO2351
CUORGNE’903SAN SECONDO DI PINEROLO2361
DRUENTO918SANGANO2375
EXILLES921SANT’AMBROGIO DI TORINO2384
FAVRIA932SANT’ANTONINO DI SUSA2399
FELETTO942SANTENA2402
FIANO951SAUZE DI CESANA2411
FIORANO CANAVESE962SAUZE D’OULX2422
FOGLIZZO972SCALENGHE2432
FORNO CANAVESE983SCARMAGNO2446
FRASSINETTO998SCIOLZE2451
FRONT1002SESTRIERE2461
FROSSASCO1012SETTIMO ROTTARO2472
GARZIGLIANA1021SETTIMO TORINESE24811
GASSINO TORINESE1036SETTIMO VITTONE2491
GERMAGNANO1041SPARONE2501
GIAGLIONE1052STRAMBINO2511
GIAVENO10610SUSA2529
GIVOLETTO1073TAVAGNASCO2533
GRAVERE1081TORINO25454
GROSCAVALLO1091TORRAZZA PIEMONTE2551
GROSSO1101TORRE CANAVESE2562
GRUGLIASCO1117TORRE PELLICE2573
INGRIA1121TRANA2581
INVERSO PINASCA1131TRAUSELLA2592
ISOLABELLA1141TRAVERSELLA2606
ISSIGLIO1152TROFARELLO2611
IVREA11616USSEAUX2621
LA CASSA1172USSEGLIO2637
LA LOGGIA1188VAIE2643
LANZO TORINESE1193VAL DELLA TORRE2655
LEINI’1205VALGIOIE2663
LEMIE1211VALPERGA2673
LESSOLO1223VAUDA CANAVESE2681
LEVONE1232VENARIA REALE26930
LOCANA12415VENAUS2701
LOMBARDORE1252VEROLENGO2713
LOMBRIASCO1263VESTIGNE’2722
LORANZE’1274VIALFRE’2731
LUGNACCO1282VICO CANAVESE2741
LUSERNA SAN GIOVANNI1291VIDRACCO2752
LUSERNETTA1301VIGONE2761
LUSIGLIE’1312VILLAFRANCA PIEMONTE2771
MACELLO1321VILLANOVA CANAVESE2781
MAGLIONE1331VILLAR DORA2793
MAPPANO1341VILLAR PELLICE2805
MARENTINO1354VILLAR PEROSA2811
MASSELLO1361VILLARBASSE2827
MATHI 1372VILLAREGGIA2832
MATTIE1384VILLASTELLONE2843
MAZZE’1391VINOVO2856
MEANA DI SUSA1402VIRLE PIEMONTE2861
MERCENASCO1411VISCHE2872
MEUGLIANO1422VISTRORIO2881
MEZZENILE1434VIU’2893
MOMBELLO DI TORINO1442VOLPIANO2905
MOMPANTERO1451VOLVERA2916
MONASTERO DI LANZO1462
Figure A3. A map of the municipalities monitored in this study.
Separations 06 00017 g0a3
Table A6. A comparison of standard methods for PFAS analysis [3].
Standard MethodEPA 537ISO 25101:2029(E)ASTM D7979-16ASTM D7868-14
Sample volume250 mL500 mL5 mL2 g
Sample matrixDrinking waterDrinking water, groundwater, surface water and seawaterWater; wastewater sludge, influent and effluentSolid and biosolid
AnalytesPFAS and FOSAAs 14 PFASPFOS and PFOAPFAS, FOSAAs, FTSs, n:2 FTUCAs and FTCAsPFAS, FOSAAs, FTSs, n:2 FTUCAs and FTCAs
PreservationTrizma for buffering and removal of free chlorineSodium thiosulfate pentahydrate for removal of free chlorineNoneNone
Holding timeBefore extraction: 14 days refrigerated at ≤6 °C Postextraction: 28 days at room temperature14 days at 4 ± 2 °C28 days at 0–6 °C28 days at 0–6 °C
Extraction MethodSPE-WAX (SPE Weak anion exchange)SPEDirect injectionSolvent extraction followed by filtration using polypropylene filters
Analytical instrumentLC-MS/MS (liquid chromatography tandem with mass spectrometry)LC-MS/MS and LC/MSLC-MS/MSLC-MS/MS
Reporting limits2.9–14 ng/L2–10,000 ng/L10–400 ng/L25–1000 ng/L

References

  1. Haukås, M.; Berger, U.; Hop, H.; Gulliksen, B.; Gabrielsen, G.W. Bioaccumulation of per- and polyfluorinated alkyl substances (PFAS) in selected species from the Barents Sea food web. Environ. Pollut. 2007, 148, 360–371. [Google Scholar] [CrossRef] [PubMed]
  2. Hedlund, J. Per- and Polyfluoroalkyl Substances (PFASs) in Swedish Waters. 10 June 2016. Available online: https://stud.epsilon.slu.se/9187/ (accessed on 13 December 2018).
  3. Dasu, K.; Kempisty, D.M.; Millis, M.A. Per- and polufluoroalkyl substance analysis to support site characterization, exposure, and risk management. In Perfluoroalkyl Substances in the Environment | Theory, Practice, and Innovation, 1st ed.; Series: Environmental and occupational health series; Kempisty, D.M., Xing, Y., Racz, L., Eds.; CRC Press Taylor & Francis: Boca Raton, FL, USA, 2018; pp. 35–66. ISBN 9781498764186. [Google Scholar]
  4. Xiao, F. Emerging poly- and perfluoroalkyl substances in the aquatic environment: A review of current literature. Water Res. 2017, 124, 482–495. [Google Scholar] [CrossRef] [PubMed]
  5. Buck, R.C.; Franklin, J.; Berger, U.; Conder, J.M.; Cousins, I.T.; De Voogt, P.; Jensen, A.A.; Kannan, K.; Mabury, S.A.; van Leeuwen, S.P. Perfluoroalkyl and polyfluoroalkyl substances in the environment: Terminology, classification, and origins. Integr. Environ. Assess. Manag. 2011, 7, 513–541. [Google Scholar] [CrossRef] [PubMed]
  6. Ahrens, L. Polyfluoroalkyl compounds in the aquatic environment: A review of their occurrence and fate. J. Environ. Monit. 2011, 13, 20–31. [Google Scholar] [CrossRef] [PubMed]
  7. Krafft, M.P.; Riess, J.G. Selected physicochemical aspects of poly- and perfluoroalkylated substances relevant to performance, environment and sustainability—Part one. Chemosphere 2015, 129, 4–19. [Google Scholar] [CrossRef] [PubMed]
  8. Zhang, W.; Zhang, Y.; Taniyasu, S.; Yeung, L.W.; Lam, P.K.; Wang, J.; Li, X.; Yamashita, N.; Dai, J. Distribution and fate of perfluoroalkyl substances in municipal wastewater treatment plants in economically developed areas of China. Environ. Pollut. 2013, 176, 10–17. [Google Scholar] [CrossRef] [PubMed]
  9. Paul, A.G.; Jones, K.C.; Sweetman, A.J. A first global production, emission, and environmental inventory for perfluorooctane sulfonate. Environ. Sci. Technol. 2009, 43, 386–392. [Google Scholar] [CrossRef] [PubMed]
  10. Kotthoff, M.; Bücking, M. Four chemical trends will shape the next decade’s directions in perfluoroalkyl and polyfluoroalkyl substances research. Front. Chem. 2018, 6, 103. [Google Scholar] [CrossRef] [PubMed]
  11. Wolf, S.T.; Reagen, W.K. Method and validation for the analysis of perfluorinated compounds in water by pre-sampling isotope dilution-direct injection-LC/MS/MS. Anal. Methods 2013, 5, 2444–2454. [Google Scholar] [CrossRef]
  12. Gosettia, F.; Chiuminatto, U.; Zampieri, D.; Mazzucco, E.; Robotti, E.; Calabrese, G.; Gennaro, M.C.; Marengo, E. Determination of perfluorochemicals in biological, environmental and food samples by an automated on-line solid phase extraction ultra high performance liquid chromatography tandem mass spectrometry method. J. Chromatogr. A 2010, 1217, 7864–7872. [Google Scholar] [CrossRef] [PubMed]
  13. Furdui, V.I.; Crozier, P.W.; Reiner, E.J.; Mabury, S.A. Trace level determination of perfluorinated compounds in water by direct injection. Chemosphere 2008, 73, S24–S30. [Google Scholar] [CrossRef] [PubMed]
  14. Ciofi, L.; Renai, L.; Rossini, D.; Ancillotti, C.; Falai, A.; Fibbi, D.; Bruzzoniti, M.C.; Santana-Rodriguez, J.J.; Orlandini, S.; Del Bubba, M. Applicability of the direct injection liquid chromatographic tandem mass spectrometric analytical approach to the sub-ng L−1 determination of perfluoro-alkyl acids in waste, surface, ground and drinking water samples. Talanta 2018, 176, 412–421. [Google Scholar] [CrossRef] [PubMed]
  15. Gu, H.; Liu, G.; Wang, J.; Aubry, A.-F.; Arnold, M.E. Selecting the correct weighting factors for linear and quadratic calibration curves with least-squares regression algorithm in bioanalytical LC-MS/MS assays and impacts of using incorrect weighting factors on curve stability, data quality, and assay performance. Anal. Chem. 2014, 86, 8959–8966. [Google Scholar] [PubMed]
  16. Taniyasu, S.; Kannan, K.; So, M.K.; Gulkowska, A.; Sinclair, E.; Okazawa, T.; Yamashita, N. Analysis of fluorotelomer alcohols, fluorotelomer acids, and short- and long-chain perfluorinated acids in water and biota. J. Chromatogr. A 2005, 1093, 89–97. [Google Scholar] [CrossRef] [PubMed]
  17. Yamashita, N.; Kannan, K.; Taniyasu, S.; Horii, Y.; Okazawa, T.; Petrick, G.; Gamo, T. Analysis of perfluorinated acids at parts-per-quadrillion levels in seawater using liquid chromatography-tandem mass spectrometry. Environ. Sci. Technol. 2004, 38, 5522–5528. [Google Scholar] [CrossRef] [PubMed]
  18. Wille, K.; Bussche, J.V.; Noppe, H.; De Wulf, E.; Van Caeter, P.; Janssen, C.R.; De Brabander, H.F.; Vanhaecke, L. A validated analytical method for the determination of perfluorinated compounds in surface-, sea- and sewagewater using liquid chromatography coupled to time-of-flight mass spectrometry. J. Chromatogr. A 2010, 1217, 6616–6622. [Google Scholar] [CrossRef] [PubMed]
  19. Pasáková, I.; Klimeš, J.; Sochor, J.; Hrabálek, A. Optimization of HPLC chromatographic conditions for determination of Transkarbam 12 and its degradation products. J. Pharm. Biomed. Anal. 2006, 42, 136–142. [Google Scholar] [CrossRef] [PubMed]
  20. GeoPortale ARPA Piemonte. Available online: http://webgis.arpa.piemonte.it/geoportale/ (accessed on 10 October 2018).
  21. Story Map Series. Available online: http://webgis.arpa.piemonte.it/monitoraggio_qualita_acque_mapseries/monitoraggio_qualita_acque_webapp/ (accessed on 13 October 2018).
  22. DIVA-GIS | Free, Simple & Effective. Available online: http://www.diva-gis.org/ (accessed on 11 November 2018).
  23. Gamerman, D.; Moreira, A.R.B. Multivariate spatial regression models. J. Multivar. Anal. 2004, 91, 262–281. [Google Scholar] [CrossRef]
  24. Hu, X.C.; Andrews, D.Q.; Lindstrom, A.B.; Bruton, T.A.; Schaider, L.A.; Grandjean, P.; Lohmann, R.; Carignan, C.C.; Blum, A.; Balan, S.A.; et al. Detection of poly- and perfluoroalkyl substances (PFASs) in U.S. drinking water linked to industrial sites, military fire training areas, and wastewater treatment plants. Environ. Sci. Technol. Lett. 2016, 3, 344–350. [Google Scholar] [CrossRef]
Figure 1. The pollution levels for the detected compounds in the study area: (a) PFBA detected levels (ng L−1); (b) PFHxS detected levels (ng L−1); (c) PFOA detected levels (ng L−1); and (d) PFOS detected levels (ng L−1).
Separations 06 00017 g001aSeparations 06 00017 g001b
Table 1. The target compounds and related internal standards.
Target Compounds (PFAC-MXB)Internal Standard Compounds (MPFAC-MXA)
Full NameAbbreviationFull NameAbbreviation
Perfluoro-n-butanoic acidPFBAPerfluoro-n-[13C4]butanoic acidMPFBA
Perfluoro-n-pentanoic acidPFPeAPerfluoro-n-[1,2-13C2]hexanoic acidMPFHxA
Perfluoro-n-hexanoic acidPFHxAPerfluoro-n-[1,2-13C2]hexanoic acidMPFHxA
Perfluoro-n-heptanoic acidPFHpAPerfluoro-n-[1,2-13C2]hexanoic acidMPFHxA
Perfluoro-n-octanoic acidPFOAPerfluoro-n-[1,2,3,4-13C4]octanoic acidMPFOA
Perfluoro-n-nonanoic acidPFNAPerfluoro-n-[1,2,3,4,5-13C5]nonanoic acidMPFNA
Perfluoro-n-decanoic acidPFDAPerfluoro-n-[1,2-13C2]decanoic acidMPFDA
Perfluoro-n-undecanoic acidPFUdAPerfluoro-n-[1,2-13C2]undecanoic acidMPFUdA
Perfluoro-n-dodecanoic acidPFDoAPerfluoro-n-[1,2-13C2]dodecanoic acidMPFDoA
Perfluoro-n-tridecanoic acidPFTrDAPerfluoro-n-[1,2-13C2]dodecanoic acidMPFDoA
Perfluoro-n-tetradecanoic acidPFTeDAPerfluoro-n-[1,2-13C2]dodecanoic acidMPFDoA
Perfluoro-n-dexadecanoic acidPFHxDAPerfluoro-n-[1,2-13C2]decanoic acidMPFDA
Perfluoro-n-octadecanoic acidPFODAPerfluoro-n-[1,2-13C2]decanoic acidMPFDA
Potassium perfluoro-1-butanesulfonateL-PFBSSodium perfluoro-1-hexane [18O2] sulfonateMPFHxS
Sodium perfluoro-1-hexanesulfonateL-PFHxSSodium perfluoro-1-hexane [18O2]sulfonateMPFHxS
Sodium perfluoro-1-octanesulfonateL-PFOSSodium perfluoro-1-[1,2,3,4-13C4] octanesulfonateMPFOS
Sodium-1-decanesulfonateL-PFDSSodium perfluoro-1-hexane [18O2]sulfonateMPFHxS
Table 2. The statistical analysis results.
CompoundsSpike ng L−1Accuracy %Recovery %Precision %LinearityLOQ
PFBA 150−8.691.383.1320.9975
PFBS50−4.295.782.8990.9975
PFPeA501.3101.281.6730.9995
PFHxA50−5.294.842.8160.9985
PFHxS 150−3.996.126.0650.9975
PFHpA50−4.795.283.6320.9995
PFOA 150−3.796.284.3570.9985
PFOS 150−8.092.041.9560.9925
PFNA50−9.690.384.8190.9995
PFDA50−14.485.587.5910.9955
PFUdA50−5.394.729.6370.9985
PFDoA50−7.292.788.7150.9995
PFTrDA50−26.873.2217.5260.9895
PFTeDA50−30.069.9813.7580.9875
PFHxDA50−15.184.8815.9710.9955
PFODA50−13.786.345.4770.9805
PFDS50−51.348.6815.7760.9975
1 The compounds detected in the samples in concentrations higher than the Limit of Quantification.
Table 3. The recovery results from spiking in real water samples.
Real Sample 1Real Sample 2Real Sample 3Real Sample 4
CompoundsSpike ng L−1Recovery %Recovery %Recovery %Recovery %
PFBA 150107.52106.0690.84107.05
PFBS50106.92107.2290.76103.90
PFPeA50108.22105.8590.53109.99
PFHxA50104.96106.8991.69107.11
PFHxS 150104.96106.7390.88105.98
PFHpA50102.19102.9392.57105.56
PFOA 150103.63114.7492.09107.14
PFOS 15095.9297.3186.3396.11
PFNA50106.18102.7897.41104.91
PFDA5095.2990.2281.9390.39
PFUdA5093.4983.0181.5780.78
PFDoA5093.19100.7396.9897.45
PFTrDA5097.8987.6282.7397.13
PFTeDA50101.0384.8994.6288.16
PFHxDA50100.61101.1984.50101.98
PFODA5086.6390.1687.9193.71
PFDS5072.2675.3152.2874.51
1 The compounds detected in the samples in concentrations higher than the Limit of Quantification.
Table 4. The spatial regression models for PFAS concentrations in drinking water.
CompoundsIndustrial SitesWWTPsλ1R2
PFBA
coefficient1.13710.27950.0920.66
p-value 0.0010.0010.05
PFHxS
coefficient0.1688−0.01180.03290.30
p-value 0.0020.5230.07
PFOS
coefficient0.2859−0.01230.08220.08
p-value 0.0010.5270.07
PFOA
coefficient0.6166−0.03110.15860.24
p-value 0.001−0.1510.07
1 The spatial error term coefficient showing spatial influence.

