Article

Establishing SI-Traceability of Nanoparticle Size Values Measured with Line-Start Incremental Centrifugal Liquid Sedimentation

1
European Commission, Joint Research Centre, 2440 Geel, Belgium
2
National Measurement Institute, 36 Bradfield Road, Lindfield, NSW 2070, Australia
3
National Physical Laboratory, Hampton Road, Teddington TW11 0LW, UK
*
Author to whom correspondence should be addressed.
Separations 2019, 6(1), 15; https://doi.org/10.3390/separations6010015
Submission received: 21 December 2018 / Revised: 20 February 2019 / Accepted: 25 February 2019 / Published: 12 March 2019
(This article belongs to the Special Issue Analytic Techniques for Nano- and Microparticles Analysis)

Abstract

:
Line-start incremental centrifugal liquid sedimentation (disc-CLS) is a powerful technique to determine particle size based on the principles of Stokes’ law. As most input quantities of the Stokes equation cannot be easily determined for typical instruments used for this method, an alternative method which depends on calibrating the sedimentation time scale with reference particles has become common practice. Unfortunately, most of these calibration materials (calibrants) come with limited information regarding their metrological reliability (e.g., lack of measurement uncertainties and traceability statements, incomplete measurand definitions). As a consequence, routine particle size results obtained by disc-CLS are mostly only traceable to the calibrant used, and effective comparisons can only be made for those results originating from measurements performed with the same types of calibrants. In this study, we discuss the concept of metrological traceability and demonstrate that particle size results obtained by disc-CLS can be traceable to the ultimate metrological reference, i.e., the unit of length in the International System of Units (SI), the meter. Using the example of two colloidal silica certified reference materials, we describe how laboratories can realize metrological traceability to the SI by simplifying complex traceability networks.

1. Introduction

Intensive research efforts to understand and control the unique properties of nanoparticles have resulted in increased numbers of applications in many areas, including medical diagnostic and therapeutic systems, energy, agriculture, environment, and consumer products. As the technology matures and relevant regulatory frameworks emerge, there is an increasing need for establishing physical and documentary standards to ensure that measurements of nanoparticle properties can be made with a quantifiable level of confidence in their accuracy and are thus comparable, or interchangeable, across space and time. An important component in achieving this confidence is the establishment and demonstration of the metrological traceability of the results of such measurements to the International System of Units, the SI. According to the International Vocabulary of Metrology (VIM), metrological traceability is the property of a measurement result whereby the result can be related to a reference through a documented unbroken chain of calibrations, each contributing to the measurement uncertainty [1]. Limited metrological traceability may impede agreements related to commerce, trade and regulation.
Line-start centrifugal liquid sedimentation (CLS), also known as differential or disc centrifugal sedimentation or disc centrifuge photosedimentometry (hence the abbreviation used in this article: disc-CLS), is a widely used technique for the characterization of nanoparticles. Its popularity is mainly due to the relatively low capital and operational costs (compared to, for example, electron microscopy) and the ultra-high size resolving power that allows distinguishing, for example, populations of individual particles from populations of small agglomerated particles [2]. To obtain an effective separation of the particles according to their size and effective (buoyant) density, the disc cavity is partly filled with a carrier fluid that has a radial density (and viscosity) gradient. This gradient often consists of a water-sucrose solution of varying sucrose concentration. Once the gradient is stabilized, a small volume of a dilute sample suspension is injected at the center of the optically transparent disc, which is rotated at a high rotational speed (e.g., up to 24,000 revolutions per minute). Driven by the resulting centrifugal force field, the particles will sediment radially outward through the density gradient with a velocity which is a function of their size and effective density, with larger and denser particles moving faster than smaller and less dense particles. The sedimentation times of the separated particles are measured by a photodetector when they pass a laser beam near the outside edge of the disc. The transit or sedimentation times can be converted to light extinction-weighted Stokes diameters using a modified form of Stokes’ law (Equation (1)) [3],
d St , p = 18   η   ln ( M / S ) ( ρ p ρ f ) ω 2 t p
where dSt,p is the Stokes diameter of a particle detected after a transit time tp; M and S are, respectively, the ending (detection) and starting (inner liquid surface) radii of rotation; η and ρf are, respectively, the average dynamic viscosity and the average density of the carrier fluid between S and M; ρp is the effective particle density; and ω is the angular frequency of the disc. If the particles have morphologies which differ from ideally spherical, solid particles, which is mostly the case for industrially relevant materials, then dSt,p is the equivalent Stokes diameter (i.e., the diameter of a solid sphere with the same settling velocity).
Equation (1) results from the assumption of a constant density and viscosity for the fluid between S and M. The fact that a gradient of densities and viscosities is required to maintain stability introduces some uncertainty and requires analysis. For example, the viscosity of a gradient may change by 10% or more from the initial to the final position, meaning that the particle velocity differs quite significantly from the velocity expected from Equation (1) at the start and the end of the gradient. Whether the radius-of-rotation-weighted mean viscosities and densities are appropriate values or not requires examination. Using the assumption of linear gradients in density and viscosity, it is possible to obtain closed-form solutions to the integral equation and demonstrate that this is usually a good assumption. Serious errors only occur if the density of the particle is close to the fluid density at the position of the detector. For the particles and gradients in this work, the relative error in diameter is less than 0.1%, and would only exceed 1% for particles with density 1.06 g/cm3 or less. The equation for sedimentation in a linear gradient is provided in the Supplementary Information.
The measurement model presented in Equation (1) is valid for individual solid spherical particles of known density which settle over a well-defined distance in a liquid medium of known dynamic viscosity and density. It must be noted that due to solvation effects, the density of the particles during centrifugation can be significantly lower than the density of the bulk particles. Therefore, the effective particle density (if known) should be used.
If the values of the different input parameters mentioned above can all be unambiguously related to their relevant SI units, then the obtained particle size results (Stokes diameters) of the solid spherical particles will be metrologically traceable to the SI unit of length, the meter. Establishing metrological traceability is a prerequisite for comparing measurement results which are obtained in different laboratories and at different times [4,5].
However, most of the equation’s input quantity values do not remain constant during a measurement sequence: the dispersion liquid of the injected samples accumulates on top of the density gradient and thus continuously changes the ratio between M and S. Due to this dilution effect, the average density and viscosity of the fluid the particles pass through is decreasing gradually until the gradient is no longer steep enough to maintain a stable sedimentation (typically up to 8 h of operation). Furthermore, commercial disc-CLS instruments, which are available today, do not have the capability of measuring and controlling the temperature of the liquid inside the disc. As a result, possible temperature variations, which can occur over time, can significantly alter the physical properties of the density gradient through which the particles travel as well as the temperature-dependent particle properties. Most of these challenges can be remedied by calibrating the method’s sedimentation time scale with spherical reference particles prior to each sample measurement. In that case, the measurement model mentioned above can be simplified (Equation (2)),
d St , p = d cal ( ρ cal ρ f ) t cal ( ρ p ρ f ) t p
where dcal and ρcal are the particle size and the mean effective particle density values assigned to the calibration material, and tcal is the sedimentation time of the calibration particles.
Materials consisting of spherical particles of polyvinyl chloride (PVC) with assigned particle size and particle density values, supplied by the main manufacturer of disc-CLS instruments (CPS Instruments, Inc., Prairieville, LA, USA) are used almost exclusively for the calibration of the sedimentation time scale. The suitability and reliability of these calibrants have been validated in a previous study [6]. In that study, the particle size and effective particle density of selected PVC calibrants were experimentally determined using different validated methods. The results confirmed, on the one hand, that different types and batches of PVC calibrants are very consistent with respect to their effective particle density (i.e., 1.385 g/cm3), and, on the other hand, they also demonstrated that the assigned modal particle diameter and particle density values are accurate within 5% and 3.5% respectively (at a 95% confidence level). Thanks to the use of these PVC calibration particles, the disc-CLS method [7] has now become an important part of today’s nanoparticle characterization toolbox. Although the reliability of the PVC calibration materials has thus been demonstrated [6], the actual comparability of the measured particle size results obtained for routine test samples is; however, limited because the critical properties (i.e., particle size and particle density) of the used calibration particles (PVC or other), have often not been characterized in a metrologically sound manner. For example, the “particle size” measurand is not always unambiguously defined, and uncertainties and traceability statements are often not given by the calibrant manufacturer. As a result, particle size measurement results obtained by the commonly used disc-CLS method (Equation (2)) are mostly only traceable to the property values of the calibrant used and not to the SI unit of length (Figure 1), which is the ultimate metrological reference of the particle size traceability network.
To allow comparison of particle size results obtained by disc-CLS methods which have been calibrated with different calibrants (e.g., PVC vs. non-PVC), one must be sure that both particle measurement results are traceable to a common metrological reference such as the SI unit of length. If the assigned particle size and effective particle density of both calibrants are SI-traceable, then particle size results obtained on the unknown test samples will be also SI-traceable. If the traceability of the calibrants is not demonstrated by the manufacturer (which is mostly the case) then the end user will need to characterize the calibration particles in an SI-traceable manner. As shown in Figure S1 of the Supplementary Information, such a characterization is likely to require significant resources which may only be available for the in-depth characterization of a long-lasting calibration material. In other words, characterization of different calibration materials is usually too time consuming and costly for testing laboratories. Moreover, one could question whether the elaborated traceability network (Figure S1) remains really unbroken if, for example, the particle size of the calibration material is determined using an analytical method which employs a different particle size measurand (e.g., light extinction-weighted Stokes diameter from disc-CLS vs. number-weighted area-equivalent diameter from electron microscopy) [8]. Also, PVC particles are rather soft, and it has been reported that their size can be altered upon exposure to the electron beam and high vacuum environment in electron microscopes [9].
In the work presented here, we demonstrate that Stokes diameter results of silica nanoparticles as measured with the calibrated or routine disc-CLS method (Equation (2)) can be made directly traceable to the SI unit of length without the need for end users to demonstrate that the property values of the particle calibrants used are SI-traceable. To do so, we have established a reference measurement system that is based on the concepts of metrological traceability and measurement uncertainty, the application of colloidal silica certified reference materials (CRMs), a reference measurement procedure (Equation (1)) and the end user’s routine measurement procedure (Equation (2)). Finally, we explain how the colloidal silica CRMs can be used by the end users to simplify or shorten certain sections of the traceability network and how they form an effective anchoring point in the traceability to the SI unit of length.

2. Materials and Methods

2.1. Chemicals

Sucrose powder for density gradient ultracentrifugation applications and n-dodecane of analytical grade were purchased from Merck KGgA (Darmstadt, Germany).

2.2. Calibration Material

A water-based suspension of PVC particles, purchased from CPS Instruments, Inc. (Prairieville, LA, USA), was used to calibrate the sedimentation time scale according to Equation (2). The PVC calibrant had an assigned particle size value of (264 ± 13) nm and particle density of (1.385 ± 0.048) g/cm3. The indicated uncertainties, which correspond to a confidence level of about 95%, were estimated during a previous study [6]. 50 μL of calibration material was injected before each sample measurement.

2.3. Certified Reference Materials

Two colloidal silica CRMs, labelled as ERM®-FD102 and ERM®-FD304, were provided by the European Commission’s Joint Research Centre, JRC (Geel, Belgium). Both CRMs are aqueous suspensions of near-spherical silica nanoparticles that come with certified values and uncertainties for different measurands, including light extinction-weighted modal Stokes diameters obtained by line-start and homogeneous incremental CLS. ERM-FD102 has a distinct bimodal size distribution and the certified equivalent diameter values of (23.9 ± 2.0) nm and (88 ± 7) nm are valid for a mean effective (buoyant) particle density of 2.0 g/cm3. ERM-FD304 has a monomodal size distribution, and its certified equivalent diameter value of (33.0 ± 3.0) nm is valid for a particle density of 2.305 g/cm3. The assigned uncertainty values correspond to a confidence level of about 95%. For each disc-CLS measurement, sub-samples of 200 μL were taken from the undiluted CRMs using plastic syringes. The exact volume injected was determined by weighing the syringe before and after injection.

2.4. Disc-CLS Conditions and Method

The Disc-CLS instrument used was a Disc CentrifugeTM model DC20000 (CPS Instruments, Inc., Prairieville, LA, USA). The instrument was operated at a rotational speed of 20,000 revolutions per minute. The optically transparent disc has an inner diameter of 95.15 mm and an inner width of 6.4 mm. Due to the assembly tolerances and a slight outward bulge of the disc’s faces at high rotational speed, the inner width of the disc typically expands to 6.5 mm (personal communication CPS Instruments, Inc.). A metal rim attached to the outside edge of the disc provides reinforcement against radial expansion, leaving an uncertainty of the inner radius of 12.5 μm, which purely reflects the machining tolerance. The optical system consisted of a photodetector and a laser diode with a nominal wavelength of 405 nm. The photodiode was positioned at a radial distance of (43.0 ± 0.5) mm from the center of the disc. The radial position of the photodiode was determined experimentally by injecting known volumes of water into the empty disc while constantly rotating at 20,000 revolutions per minute. The signal response of the detector changed significantly when the water, accumulating in the disc, reached the position of the detector. Based on the total volume of water injected, and on the inner dimensions of the disc, the radial position of the detector could be determined. The carrier fluid contained a density gradient constructed from sucrose solutions of (20.0 ± 0.1) g/kg and (80.0 ± 0.1) g/kg, respectively.
The sucrose solutions were prepared gravimetrically using an SI-traceably calibrated analytical balance. The density gradient was built by injecting 9 × 1.6 mL of sucrose mixtures each containing a lower concentration of sucrose. To reduce evaporation of the density gradient, approximately 0.5 mL of n-dodecane was injected on top of the density gradient. To facilitate the formation of a stable density gradient, an equilibration period of about 30 min was applied. The density and viscosity of the sucrose solutions were preliminary determined at temperatures ranging from 20 °C to 38 °C using a temperature controlled Stabinger Viscometer SVM 3001 with integrated oscillating density measuring cell (Anton Paar GmbH, Graz, Austria). The density meter was calibrated with deionized water. The 20 g/kg sucrose solution was measured in fourfold while the 80 g/kg sucrose solution was measured in triplicate. The experimentally determined dynamic viscosity and density results are depicted in Figure S2 of the Supplementary Information.
The disc-CLS instrument was operated in a laboratory whose ambient temperature was maintained at (20 ± 1) °C, following the documentary standard ISO 13318-2 [7]. Since the instrument cannot be run in a calibration-free mode, each measurement was calibrated by injecting 0.05 mL of a PVC calibration material with assigned values of the particle diameter and particle density of 264 nm and 1.385 g/cm3, respectively. These values, which have been assigned by CPS Instruments, Inc., are based on particle size measurements conducted with disc-CLS, gravitational sedimentation and dynamic light scattering. Six independent replicates of each colloidal silica CRM were analyzed under repeatability conditions within a time frame of maximum 5 h to ensure optimal conditions of the gradient during measurement. The raw measurement data were plotted as light extinction-weighted particle size distributions with a linearly scaled abscissa. The modal value of the Stokes diameter distribution was used as the characteristic value.
At the end of the measurement sequence, the temperature of the density gradient was measured by immersing an SI-traceably calibrated bead wire thermocouple (Type K), connected to an Extech TM500 temperature datalogger (Extech Instruments Corp., Waltham, MA, USA).

3. Results and Discussion

3.1. Particle Size Analysis by Disc-CLS

The DC20000 disc-CLS instrument cannot be run in a calibration-free mode. Therefore, the colloidal silica CRMs were first analyzed using the routine method (Equation (2)) which is based on calibrating the sedimentation time scale of each measurement. This was done by injecting 50 μL of PVC reference particles before each sample injection. To directly calculate particle size results according to Stokes’ law, the raw and uncorrected particle sedimentation time data were exported and converted into their equivalent light extinction-weighted Stokes particle diameters by applying Equation (1). The reliability of this mathematical conversion depends on how reliable the different input quantity values of Equation (1) can be determined. If the inner dimensions of the disc and the radial position of the photodetector are known, then the physical properties of the density gradient through which the particles travel can be calculated straightforwardly. It must be noted that these physical properties are only valid for the very first measurement performed with the pristine density gradient. With the injection of every new sample, a growing layer of water-based sample dispersant accumulates on top of the sucrose density gradient (Figure S3) that affects the average viscosity, 〈η〉, and the average density, 〈ρf〉, of the carrier fluid, consisting of the sucrose gradient and the water layer, through which the particles travel. For each subsequent measurement, the new position of the inner liquid surface was calculated from the known volume of sample and calibrant injected, and the variable method parameters 〈η〉 and 〈ρf〉 were re-assessed using the method of linear extrapolation (Equation (S5)). The initial properties of the density gradient, together with all other key method parameters and calculated Stokes diameters, are listed in Table 1. A complete overview of all replicates is given in Table S1 of the Supplementary Information.
Since the sedimentation time data were acquired using the routine disc-CLS method, particle size results from the two methods can be readily compared. As can be seen from the two sets of light extinction-weighted particle size distributions (PSD) which are depicted in Figure 2, the modal diameters, which correspond to the local maxima of the distributions, are consistent with the certified values of the CRMs within their uncertainties. Hence, it can be concluded that, at least for the silica nanoparticles used in the presented study, both the routine and the reference methods provide accurate and equivalent results. Nevertheless, the modal diameters determined using the reference method are systematically lower than those obtained with the routine method. This bias, which is about 6.5%, is similar for the three nanoparticle populations. An overview of the mean and expanded uncertainty (confidence level of 95%) values calculated from the six replicate results is given in Table 2. The uncertainty values of the results obtained by the routine disc-CLS method were estimated using the bottom-up approach presented in [6]. The expanded uncertainties of the results from the reference disc-CLS method were estimated using the uncertainty budget data presented further in this article.

3.2. Metrological Traceability

Establishing traceability to a common and recognized metrologically valid reference allows measurement results to be compared across space and time. Different types of metrological references exist, with all providing a different level of metrological traceability (Figure 3).
As described in the introduction section, the frequently used routine disc-CLS method is often calibrated with poorly characterized calibrants, and the metrological traceability of the obtained particle size measurement results is therefore limited to the property values (particle size and density) of the used calibrant (chain C). Traceability to a calibration artifact is not unusual and may be perfectly suitable for a given purpose. However, measurement results obtained with different types of calibrants (e.g., PVC vs. non-PVC) cannot be compared with each other in the given situation. A higher level of traceability may be achieved if the routine method is fully validated and if a suitable CRM is analyzed on a regular basis. If CRMs are produced using metrologically valid procedures, such as those described in ISO Guide 34 [10], then the assigned certified property values are considered to be reliable estimates of the ‘true’ values. In that case, the CRM will provide a metrologically solid anchoring point that directly links the end user’s measurement result in the metrological reference of the certified value (chain B). For the colloidal silica case study, ERM-FD102 and ERM-FD304 have been produced according to ISO Guide 34. However, the certified values were established on the basis of an intercomparison study among expert laboratories that mostly used routine disc-CLS methods calibrated with PVC reference particles. As a result, the certified values are only traceable to the assigned values of the PVC calibrants. For the colloidal silica case study, this means that chain B and chain C provide an equal level of traceability. In establishing the highest level of traceability (chain A), we will demonstrate that the particle size values measured with the reference disc-CLS method can be traceable to the SI unit of length. The relevant aspects needed for achieving SI-traceability are discussed in the following sections.

3.2.1. Measurand Definition

One of the most basic steps of any measurement, and consequently of any traceability network, is an unequivocal or explicit definition of the measurand or the quantity intended to be measured [1]. In particular, in the field of particle size analysis, different techniques apply different physical measurement principles which determine different equivalent diameters. For a meaningful comparison of particle size results, a detailed specification of the measurand is of utmost importance [8]. Particle size results obtained with disc-CLS can be evaluated on the basis of light extinction, particle volume (or mass) and particle number. Particle size results expressed on a volume and number basis are more meaningful than results expressed in terms of light extinction. The conversion of volume-based distributions into particle number-based distributions is straightforward as it only requires the size and density of the particles. However, the conversion of the raw light extinction-weighted data into particle volume-weighted data is a real challenge because accurate knowledge of the critical input parameter, namely the complex refractive index of nanoparticles, is mostly not available [11]. To exclude the potential influence of such unknown uncertainties on the measurement uncertainties of particle size results from disc-CLS, only the light extinction-weighted Stokes diameter was considered during the certification campaigns of the colloidal silica CRMs. Consequently, to allow a meaningful comparison with the certified values, we only report light extinction-weighted results in this study.
Particle size results are often presented as a representative value that is derived from a characteristic parameter (e.g., median, mean, mode) of the particle size distribution. These distributions are either plotted as a density distribution (linear abscissa) or as a transformed density function (logarithmic abscissa) [12]. A commonly reported characteristic value of a distribution is the mode as it can be easily determined with a relatively low uncertainty [13]. A detailed specification of the disc-CLS measurand that was evaluated in this study is summarized in Table 3 [8].

3.2.2. Traceability Network

To establish the highest level of traceability (chain A in Figure 3), one must demonstrate that all input quantity values that significantly affect the accuracy of the final measurement result are traceable to the relevant SI units. The arrangement of the different input quantities and their relation with the measurement model (Equation (1)) is elaborated in the traceability network depicted in Figure 4. The individual links of the traceability network which are critical for establishing traceability to the SI unit of length are explained below.
  • The density of the sucrose solutions was measured using an oscillating-type density meter. The working principle of this technique is based on the well-known law of harmonic oscillation [14]. The glass U-tube is excited to vibrate at the resonance or characteristic frequency of the introduced sample, which depends on its mass. The density of the sample under investigation is calculated using cell constants previously determined by measuring resonance frequencies when the sample cell is filled with a calibrant (e.g., water, ethanol, iso-octane, toluene), which are certified for density [15]. Measurement results obtained with an oscillating-type density meter are traceable to the SI units of length and mass through calibration with suitable SI-traceable calibrants [16]. The cell constants used in the calculation of the density are temperature and pressure dependent. However, the uncertainties of the temperature and pressure calibrations are assumed to be negligible compared to the uncertainties of the input quantities of the Stokes’ equation. Hence, the traceability chains of the temperature and pressure calibrations are omitted from the disc-CLS traceability network in Figure 4.
  • The average dynamic viscosity values of the density gradient (between the detector’s position M and the inner liquid surface S) were calculated from the inner disc dimensions, the viscosity results that were obtained experimentally for the individual sucrose solutions (Figure S2) and from the known volumes of each sucrose carrier fluid component used for constructing the density gradient. Viscosity results are temperature dependent, and it can be assumed that the uncertainty mainly depends on the accuracy of the temperature controller. The viscosity measurements were performed at controlled temperatures using a rotational viscometer. The temperature controller of the viscometer was SI-traceably calibrated by the manufacturer with ITS-90 fixed points [17].
  • The angular frequency of the disc-CLS instrument was verified by the manufacturer using an SI-traceably calibrated tachometer.
  • The radial position of the photodetector (distance M) was measured using a paper strip with integrated SI-traceable length scale that was especially designed by the manufacturer for the given purpose. The measured distance was confirmed experimentally based on the inner dimensions of the disc (personal communication CPS Instruments, Inc.) and by injecting known volumes of water until a significant change of the signal response of the detector was recorded.
  • The radial positions of the inner liquid surface (distance S) were determined based on the inner dimensions of the disc, the known volume of the sucrose density gradient and the known volumes of sample (+calibrant) injected during a measurement sequence. The effective volumes were determined gravimetrically using an SI-traceably calibrated balance and using the known density of water at 20 °C.
  • The effective (buoyant) density of the silica nanoparticles was determined experimentally using isopycnic velocity interpolation and multi-velocity sedimentation approaches [6,18,19]. The measurement principle is based on the creation of a density gradient in an optically transparent cell. The particles to be analyzed migrate through the density gradient until they reach the zone where the density of the gradient matches the effective density of the particles. The zone of particle accumulation is detected optically. The density gradient can be constructed in an SI-traceable manner (temperature controlled, liquids of known density); hence, the effective density of the nanoparticles can also be considered to be SI-traceable.
  • The sedimentation times of the particles, which are measured using the integrated computer clock, correspond to the time intervals between the start of measurement and the detection of a particle population (e.g., modal value of a PSD). SI-traceability of these time interval measurements can be established, for example, by accessing an SI-traceable Network Time Protocol service over a data network or by using a calibrated stopwatch.

3.2.3. Measurement Uncertainties for Results of CRMs

In the previous section, we showed SI-traceability of particle size results, obtained with the reference disc-CLS method, by relating each input quantity value of the underlying measurement model to its relevant SI unit. As can be seen from the VIM’s definition of metrological traceability, however, the traceability network alone is insufficient to allow a meaningful comparison of measurement results without also specifying the measurement uncertainty. Indeed, each measurement unit that occurs in the traceability network has been practically realized from laboratory measurements whose results are imperfect estimates of the different measurands. These imperfections arise from both systematic and random uncertainties. To allow for meaningful comparisons, the final measurement result must be accompanied by a realistically estimated measurement uncertainty that combines the significant uncertainty contributions from the different input quantity values. The input quantities whose uncertainties are considered to have a significant influence on the combined uncertainty, uc(dSt,p), of the output quantity or the measurand, dSt,p, are arranged in the fishbone diagram shown in Figure 5. The relative uncertainties related to the main branches of the fishbone diagram are estimated according to the procedures described in the Guide to the Expression of Uncertainty in Measurement (GUM) [20]. Considerations for estimating each uncertainty component are discussed below.
  • For similar types of disc-CLS instruments, Kamiti and co-workers have demonstrated, using a tachometer, that the rotational speed is accurate within 0.4% [21]. This value is considered to be a realistic estimate of the relative standard uncertainty for the angular frequency, u(ω).
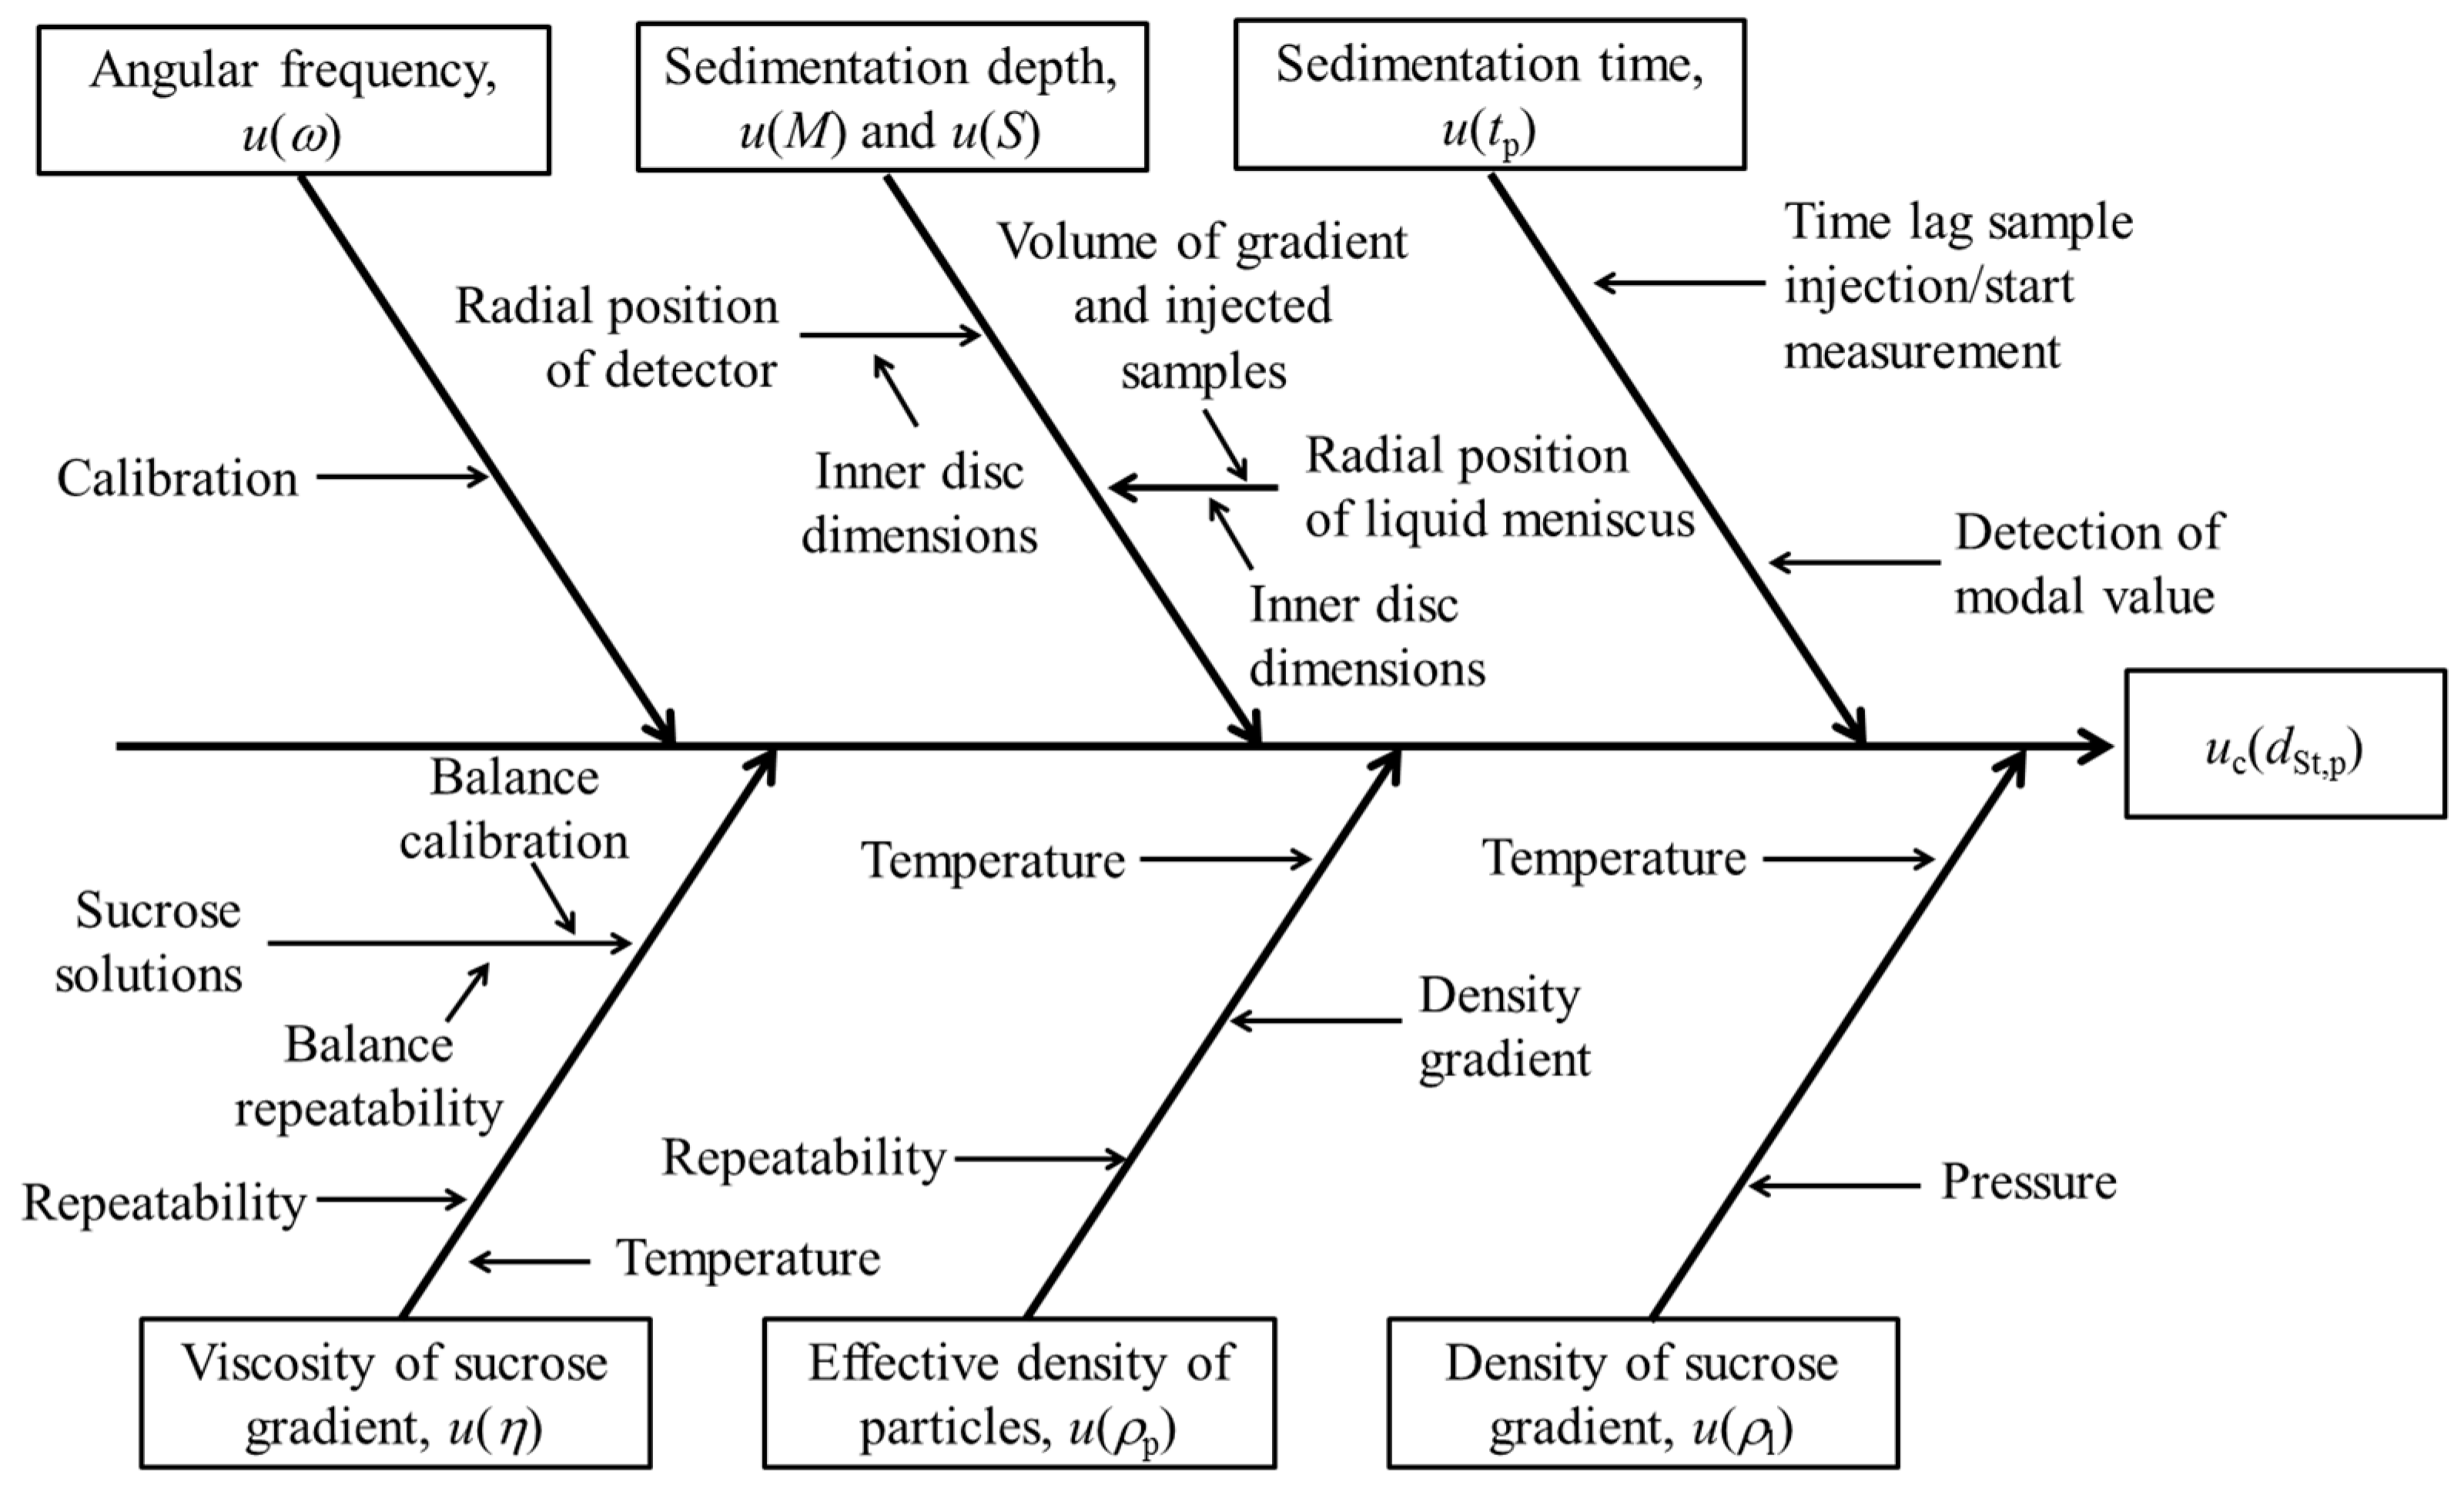
  • Among the different uncertainty sources shown in the fishbone diagram, temperature is considered to be the most important factor affecting the average viscosity of the gradient. The instrument, however, does not allow for the on-line monitoring of the gradient’s temperature during sample analysis. Instead, the temperature of the gradient can only be measured manually by immersing a temperature sensor in the carrier fluid immediately after having stopped the instrument. We conservatively consider that the measured temperature agrees with the temperature of the equilibrated gradient (during operation) within ±0.5 °C. For the given temperature variation, and using the experimental viscosity data shown in Figure S2, the average viscosity of the pristine gradient has a range of 0.018 mPa s. The experimental viscosity measurements were performed under intermediate precision conditions (different days). For both types of sucrose solutions, the standard deviation calculated from the replicate results at 30 °C was 0.043 mPa s. Considering that the effect of temperature on the viscosity follows a rectangular probability distribution (with a half-width of 0.009 mPa s), the absolute standard uncertainty for the average viscosity of the sucrose gradient, u(η), is estimated according to Equation (3),
    u ( η ) = 0.043 2 + 0.009 3 2
    For an average viscosity of 0.907 mPa s, the relative standard uncertainty corresponds to 4.8%.
  • Using the approach explained for estimating the uncertainty of the average viscosity, a standard combined uncertainty of 0.0002 g/cm3 was estimated for the average density of the sucrose gradient by combining the standard deviation (0.0001 g/cm3) of the density results at 30 °C and the half-width (0.0001 g/cm3) of the rectangular distribution when assuming a temperature fluctuation of ±0.5 °C. For an average density of the sucrose gradient of 1.0067 g/cm3, the relative standard uncertainty, u(ρf)/ρf, corresponds to 0.01%.
  • The radial position of the photodetector (M) was determined to be located 4.25 cm from the center of the disc. The distance was confirmed using a paper strip specifically designed by the manufacturer for this purpose. A standard uncertainty, u(M), of 0.05 cm, or 1.18% in relative terms, is considered realistic.
  • The radial position of the inner liquid surface (S) of the sucrose gradient depends on the total volume of the two sucrose solutions injected and on the injected volumes of the samples. The gradient is created by injecting nine 1.6 mL volumes of a mixture of 20 g/kg and 80 g/kg sucrose solutions and one 0.5 mL volume of n-dodecane.
    The sucrose solutions were injected using disposable plastic syringes with a volume scale graduated in 0.1 mL intervals. If the syringes are carefully filled with liquid, i.e., by avoiding air bubbles, then a volume accuracy of ±0.05 mL can be achieved for each injection. In this case, the effective volume of the sucrose gradient (+0.5 mL of n-dodecane) in the disc is expected to be between 14.40 mL and 15.40 mL, corresponding to S values of 3.93 cm and 3.87 cm, respectively. Based on the half-width (0.06 cm) calculated from the values for S, and assuming a triangular probability distribution, the relative standard uncertainty is about 0.6%.
    Sub-sampling and sample injection were performed using disposable plastic syringes with a volume scale graduated in 0.01 mL intervals. For each measurement, a nominal volume of 0.20 mL of the undiluted silica CRM was injected. Based on repeated sampling and injection experiments, the uncertainty associated with the effective sample volume has been estimated to be 3.43% or 0.01 mL. The relative standard uncertainty, u(S)/S, is estimated according to Equation (4):
    u ( S ) / S = 3.43 2 + 0.6 2
  • A relative standard uncertainty, u(ρp)/ρp, of 2.50% for the effective density of silica nanoparticles has been determined in a previous study [6].
  • The uncertainty associated with the sedimentation time, u(tp), of the silica nanoparticles is assumed to comprise a contribution related to the actual start of the time recording (time lag between manually starting the measurement and sample injection) and a contribution related to the measurement of the time at which the modal value occurs. The time lag between sample injection and the start of the measurement is estimated to be in the range of 0.1 s to 0.5 s. Compared to the relatively long measurement time required for silica nanoparticles, this short time lag can be assumed negligible, and the uncertainty mainly depends on the repeatability of the time measurements of the modal value. Throughout a measurement sequence, the volume of the carrier fluid increases and thus also the sedimentation times. The relationship between sedimentation time and the number of injected replicates is linear. To estimate the uncertainty, u(tp), the sedimentation times are normalized using the slope of the linear relationship. Based on the half-width (0.4 s and 12.4 s for the large and small nanoparticle populations of ERM-FD102), and by considering a triangular probability distribution, the relative standard uncertainties of the sedimentation time are 0.3% and 0.7%, respectively for the large and small nanoparticle populations.
According to the guidelines described in the GUM, and for the given measurement model (Equation (1)), the relationship between output quantity, dSt,p, and the input quantities, ω, η, ρp, M, S, ρf, and tp, can be expressed as in Equation (5):
d St , p = f ( ω , η , M , S , ρ f , ρ p , t p )
To evaluate the combined uncertainty, uc(dSt,p), the GUM applies the law of propagation of uncorrelated uncertainties as follows (Equation (6)):
u c 2 ( d St , p ) = ( f ω ) 2 · u 2 ( ω ) + ( f η ) 2 · u 2 ( η ) + ( f ρ f ) 2 · u 2 ( ρ f ) + ( f ρ p ) 2 · u 2 ( ρ p ) + ( f M ) 2 · u 2 ( M ) + ( f S ) 2 · u 2 ( S ) + ( f t p ) 2 · u 2 ( t p ) + u 2 ( t p )
where ∂f/∂xi is the so-called sensitivity coefficient for the input quantities xi, which is the partial derivative of dSt,p with respect to xi. It is a measure of how much the measurement result of the measurand dSt,p is affected by changes in the input quantity, xi. An overview of the standard uncertainties that contribute to the combined uncertainty of a single measurement result of ERM-FD102, obtained by the reference disc-CSL method, is given in Table 4 (population of small particles) and Table 5 (population of large particles). A similar uncertainty budget for ERM-FD304 is given in Table S2 of the Supplementary Information. It must be noted that the tabulated quantity values are only applicable to the very first sample injected in a pristine sucrose gradient. After the first sample injection, the average viscosity and density of the carrier fluid, as well as the distance between the inner liquid surface and the center of the disc, need to be adjusted according to the sample and calibrant volume(s) injected. In relative terms, both combined uncertainties correspond to about 5.5%. In expressing the uncertainty at a confidence level of about 95%, the latter is multiplied by a coverage factor, k = 2, resulting in a relative expanded uncertainty of about 11%. The relative expanded (k = 2) uncertainty of a single replicate result of ERM-FD304 is about 8%.

3.2.4. Implications for End Users

The aspects of metrological traceability and measurement uncertainty are gaining attention, in particular, within the frame of accreditation to, for example, ISO/IEC 17025, which nowadays is often required by laboratory customers [22]. Our results show that the reference disc-CLS method can provide accurate particle size results directly linked to the SI unit of length, the meter. Unfortunately, as discussed in the previous sections, most input quantity values of the underlying measurement model (Equation (1)) need to be continuously reassessed throughout a measurement sequence as they change with each new sample injection. This major drawback makes the reference method less user-friendly, particularly for routine measurements where a high sample throughput may be required. Hence, for most analytical tasks, the routine disc-CLS method is the most preferred option. A direct link to the SI unit of length is possible if the sedimentation time scale is calibrated with SI-traceable calibrants. Unfortunately, such calibrants are as yet unavailable, and the use of non-SI-traceable calibrants breaks the traceability network, and thus measurement results cannot be compared with each other.
A simple and efficient way for end users to ‘repair’ or shorten the broken traceability network is by analyzing fit-for-purpose and SI-traceable CRMs at regular time intervals. If the data obtained on these CRMs are not significantly different from the certified values, then it can be said that the CRM provides a metrologically solid anchoring point in the traceability network of the end users measurement procedure. The expanded measurement uncertainty (k = 2) of the routine result, U, is then based on a combination of the individual standard uncertainties of the different input quantities of the measurement model (Equation (7)), complemented with the standard uncertainty, uCRM, of the certified value of the CRM (Equations (8) and (9)):
u c 2 ( d St , p ) = ( f d cal ) 2 · u 2 ( d cal ) + ( f ρ cal ) 2 · u 2 ( ρ cal ) + ( f ρ f ) 2 · u 2 ( ρ f ) + ( f ρ p ) 2 · u 2 ( ρ p ) + ( f t cal ) 2 · u 2 ( t cal ) + ( f t p ) 2 · u 2 ( t p )
u 2 = u c 2 ( d St , p ) + u CRM 2
U = k · u
When selecting a CRM for simplifying the traceability network, one must ensure that the certified value embodied in the CRM is truly SI-traceable and that there are no conflicts concerning the measurand definition. Only if those two requirements are fully met, the CRM will provide an effective anchoring point in the traceability network of the end user’s method. Equations (7)–(9) provide a general approach for propagating different uncertainties based on the underlying measurement model. However, the end user should always carefully check which uncertainty contributions are included in uCRM. For example, the uncertainty of the disc-CLS certified value of ERM-FD102 contains relative standard uncertainty contributions of 2.5% and 2.2% for the effective density of silica nanoparticles and for the use of different PVC calibrants, respectively. As explicitly stated in Section 4.3.10 of the GUM [20], double-counting of uncertainty components must be avoided. As a result, the corresponding individual standard uncertainties (u(ρcal), u(dcal) and u(ρp)) should, in this example, be taken out of Equation (7).

4. Conclusions

Due to the lack of calibration materials with SI-traceable property values, particle size results obtained by the popular routine disc-CLS method are only traceable to the property values of the used calibrant. Such a low level of metrological traceability hampers the comparability of results, particularly if measurements are conducted with different types of calibrants. In this study, we have demonstrated that the highest level of traceability, i.e., to the SI unit of length, can be achieved via two alternative routes.
The first route requires the disc-CLS method to be operated in the calibration-free mode (reference method). In practice, this means that the particle size is calculated according to Stokes’ law. However, the application of Stokes’ law is strongly complicated by the fact that each input quantity value needs to be accurately assessed for each new sample injection. This measurement requirement is a major constraint, hence making the reference method a less preferred option for routine laboratories which typically need to analyze samples at a high throughput. Despite the many scientific challenges, and to the best of our knowledge, the results presented in this study demonstrate for the first time that the reference method can yield accurate results for CRMs, which consist of near-spherical silica nanoparticles with equivalent diameters in the range of 20 nm to 90 nm and effective densities in the range of 2.0 g/cm3 to 2.3 g/cm3. The certified values for disc-CLS embodied in the CRMs are the result of intercomparison studies among expert laboratories. Since most of these laboratories used the routine disc-CLS method in combination with non-traceable PVC calibrants, the certified values are only traceable to those PVC calibrants and not the SI. The data presented now show that the results obtained with the reference method agree with the certified values. On that basis, the metrological traceability statement of the certified values for the particle size measured by disc-CLS could be upgraded from traceable to “the size values provided for the PVC calibrants supplied by CPS Instruments, Inc.” to “the International System of Units (SI)” for the colloidal silica CRMs.
Instead of using the complex and less user-friendly reference method, the second route is based on the routine method complemented with measurements on colloidal silica CRMs whose certified values have now been demonstrated to be SI-traceable. These CRMs are, on the one hand, valuable metrological tools which allow end users to demonstrate that the performance of their disc-CLS method is free from significant measurement biases or systematic errors. On the other hand, the proven link to the SI unit of length provides an effective anchoring point and simplifies the traceability network, making the routine results via the certified values of the CRMs directly SI-traceable and thus comparable across space and time.

Supplementary Materials

The following are available online at https://www.mdpi.com/2297-8739/6/1/15/s1, Figure S1: Metrological traceability network attempting to link disc-CLS particle size measurement results to the SI unit of length through PVC calibration particles characterized by transmission electron microscopy and isopycnic velocity interpolation sedimentation, Figure S2: Temperature dependence of dynamic viscosity (open squares) and density (solid squares) of 20 g/kg (a) and 80 g/kg (b) sucrose solutions. The error bars correspond to the standard deviation; dashed lines represent linear fits, Figure S3: Simplified schematic of the functioning hollow disc (front view) of a disc-CLS instrument. The disc is partly filled with a carrier fluid which comprises a radial density and viscosity gradient after stabilization. The dilute sample is injected at the center of the disc (solid black circle). Particles travel radially outward through the density/viscosity gradient (dark blue ring) and sedimentation times are recorded by the photodetector (black solid square) whose radial position is given by the dotted black circle. A ring of water-based dispersant liquid (light blue ring) is formed on top of the density/viscosity gradient, Equation (S1): sedimentation velocity of a particle in a centrifugal field, Equation (S2): Stokes law when considering a linear gradient in viscosity and density, Equation (S3): calculation of the fluid density term, Equation (S4): calculation of the fluid viscosity term, Equation (S5): Linear extrapolation of the average density of carrier fluid, Table S1: Overview of key parameters (all replicates) for the direct calculation of Stokes diameter results using the reference disc-CLS method, Table S2: Uncertainty budget for a single disc-CLS measurement (reference method) of ERM-FD304.

Author Contributions

Conceptualization, J.H. and G.R.; Investigation and methodology, V.K., Writing—original draft preparation, V.K.; Review and editing, V.A.C., J.H., C.M., A.G.S. and G.R.

Funding

This research received no external funding.

Acknowledgments

We thank Stephen Fitzpatrick (CPS Instruments, Inc.) for the discussions and advice regarding the application of the reference disc-CLS method. We also acknowledge Emmanuel Duh (JRC) for proofreading the manuscript.

Conflicts of Interest

The authors declare no conflict of interest.

Abbreviations and Symbols

CRMcertified reference material
dcalassigned particle size of calibrant
dSt,pStokes diameter of test particles
Disc-CLSdisc centrifugal liquid sedimentation
GUMGuide to the Expression of Uncertainty in Measurement
ISOInternational Organization for Standardization
ITS-90International Temperature Scale of 1990
JRCJoint Research Centre of the European Commission
kcoverage factor
Mradial position of the detector
Nnormal distribution
PSDparticle size distribution
PVCpolyvinyl chloride
Rrectangular distribution
Sradius of the inner liquid surface
SIInternational System of Units
tcalsedimentation time of the calibration particles
tpsedimentation time of the test particles
Ttriangular distribution
ustandard uncertainty (confidence level 68%)
uccombined uncertainty (confidence level 68%)
Uexpanded uncertainty (confidence level 95%)
VIMVocabulary of Metrology
xiquantity
ηaverage dynamic viscosity between M and S
ρcalassigned mean effective particle density of calibrant
ρfaverage density of the carrier fluid between M and S
ρpeffective particle density
ωangular frequency of the disc

References

  1. International Organization for Standardization (ISO); International Electrotechnical Commission (IEC). ISO/IEC Guide 99: 2007 International Vocabulary of Metrology—Basic and General Concepts and Associated Terms (VIM); ISO: Geneva, Switzerland, 2007. [Google Scholar]
  2. Gollwitzer, C.; Bartczak, D.; Goenaga-Infante, H.; Kestens, V.; Krumrey, M.; Minelli, C.; Pálmai, M.; Ramaye, Y.; Roebben, G.; Sikora, A.; et al. A comparison of techniques for size measurement of nanoparticles in cell culture medium. Anal. Methods 2016, 8, 5272–5282. [Google Scholar] [CrossRef] [Green Version]
  3. International Organization for Standardization (ISO). ISO 13318-1 Determination of Particle Size Distribution by Centrifugal Liquid Sedimentation Methods—Part 1: General Principles and Guidelines; ISO: Geneva, Switzerland, 2001. [Google Scholar]
  4. EURACHEM/CITAC. Traceability in Chemical Measurement—A Guide to Achieving Comparable Results in Chemical Measurement. Available online: https://www.eurachem.org/index.php/publications/guides/trc (accessed on 5 October 2018).
  5. International Union of Pure and Applied Chemistry (IUPAC). Metrological traceability of measurement results in chemistry: Concepts and implementation. Pure Appl. Chem. 2011, 83, 1873–1935. [Google Scholar] [CrossRef]
  6. Kestens, V.; Coleman, V.A.; De Temmerman, P.-J.; Minelli, C.; Woehlecke, H.; Roebben, G. Improved metrological traceability of particle size values measured with line-start incremental centrifugal liquid sedimentation. Langmuir 2017, 33, 8213–8224. [Google Scholar] [CrossRef] [PubMed]
  7. International Organization for Standardization (ISO). ISO 13318-2 Determination of Particle Size Distribution by Centrifugal Liquid Sedimentation Methods—Part 2: Photocentrifuge Method; ISO: Geneva, Switzerland, 2007. [Google Scholar]
  8. Kestens, V.; Roebben, G.; Herrmann, J.; Jamting, Å.K.; Coleman, V.A.; Minelli, C.; Clifford, C.A.; De Temmerman, P.-J.; Mast, J.; Junjie, L.; et al. Challenges in the size analysis of a silica nanoparticle mixture as candidate certified reference material. J. Nanopart. Res. 2016, 18, 171. [Google Scholar] [CrossRef] [PubMed]
  9. McDonald, S.A.; Daniels, C.A.; Davidson, J.A. Determination of the true size of poly(vinyl chloride) latices by electron microscopy using a vertical shadowing technique. J. Colloid Interface Sci. 1977, 59, 342–349. [Google Scholar] [CrossRef]
  10. International Organization for Standardization (ISO). ISO Guide 34 General Requirements for the Competence of Reference Material Producers; ISO: Geneva, Switzerland, 2009. [Google Scholar]
  11. Bohren, C.F.; Huffmann, D.R. Absorption and Scattering of Light by Small Particles, 2nd ed.; Wiley-VCH Verlag GmbH & Co. KGaA: Weinheim, Germany, 2007; ISBN 9780471293408. [Google Scholar]
  12. International Organization for Standardization (ISO). ISO 9276-1 Representation of Results of Particle Size Analysis—Part 1: Graphical Representation; ISO: Geneva, Switzerland, 1998. [Google Scholar]
  13. Babick, F. Characterisation of colloidal suspensions. In Suspensions of Colloidal Particles and Aggregates, 1st ed.; Valverde Millán, J.M., Ed.; Springer International Publishing: Cham, Switzerland, 2016; Volume 3, pp. 8–9. ISBN 9783319306612. [Google Scholar]
  14. International Organization for Standardization (ISO). ISO 15212-1 Oscillation-Type Density Meters—Part 1: Laboratory Instruments; ISO: Geneva, Switzerland, 1998. [Google Scholar]
  15. Fehlauer, H.; Henning, W. Density reference liquids certified by the Physikalisch-Technische Bundesanstalt. Meas. Sci. Technol. 2006, 17, 10. [Google Scholar] [CrossRef]
  16. McLinden, M.O.; Splett, J.D. A liquid density standard over wide ranges of temperature and pressure based on toluene. J. Res. Natl. Inst. Stand. Technol. 2008, 113, 26–67. [Google Scholar] [CrossRef]
  17. Preston-Thomas, H. The international temperature scale of 1990 (ITS-90). Metrologia 1990, 27, 3–10. [Google Scholar] [CrossRef]
  18. International Organization for Standardization (ISO). ISO 18747-1 Determination of Particle Density by Sedimentation Methods—Part 1: Isopycnic Interpolation Approach; ISO: Geneva, Switzerland, 2018. [Google Scholar]
  19. International Organization for Standardization (ISO). ISO/FDIS 18747-2 Determination of Particle Density by Sedimentation Methods—Part 2: Multi-Velocity Approach; ISO: Geneva, Switzerland, 2019. [Google Scholar]
  20. International Organization for Standardization (ISO). ISO Guide 98-3 Uncertainty of Measurement—Part 3: Guide to the Expression of Uncertainty in Measurement (GUM:1995); ISO: Geneva, Switzerland, 2008. [Google Scholar]
  21. Kamiti, M.; Boldridge, D.; Ndoping, L.M.; Remsen, E.E. Simultaneous absolute determination of particle size and effective density of submicron colloids by disc centrifuge photosedimentometry. Anal. Chem. 2012, 84, 10526–10530. [Google Scholar] [CrossRef] [PubMed]
  22. International Organization for Standardization (ISO); International Electrotechnical Commission (IEC). ISO/IEC 17025 General Requirements for the Competence of Testing and Calibration Laboratories; ISO: Geneva, Switzerland, 2017. [Google Scholar]
Figure 1. Metrological traceability network linking a particle size measurement result of a test sample obtained by the routine disc-CLS method (after calibration with PVC reference particles) to the particle size and particle density values assigned to the PVC calibration material. In this network, and in other schemes further discussed in this manuscript, the dotted rounded groups indicate measurement procedures, while the square boxes represent tools, reference materials and accepted literature/reference values. The different input quantities of the measurement functions are grouped in rounded shaded boxes with solid borders.
Separations 06 00015 g001
Figure 2. Overlay of representative light extinction-weighted PSDs of colloidal silica ERM-FD102 (a) and ERM-FD304 (b) obtained by the routine (black curves) and reference (gray curves) disc-CLS methods. The vertical dashed lines correspond to the certified ranges of the modal diameters for the two CRMs. The ordinates correspond to the natural logarithm of the ratio of the incident (I0) and transmitted light intensity (I).
Separations 06 00015 g002
Figure 3. A simplified representation of different traceability chains, each providing a different level of traceability.
Separations 06 00015 g003
Figure 4. Metrological traceability network linking a particle size measurement result of a test sample obtained by the routine disc-CLS method (after calibration with PVC reference particles) to the SI unit of length (meter) via particle size results of silica CRMs obtained by the reference disc-CLS method.
Separations 06 00015 g004
Figure 5. Fishbone diagram illustrating the potential sources of uncertainty for particle size measurements performed with the reference disc-CLS method.
Separations 06 00015 g005
Table 1. Overview of key parameters (first replicate) for the direct calculation of Stokes diameter results using the reference disc-CLS method.
CRMdst,p1η2ρf2ρp3MSωtp
[nm][Pa s][g/cm3][g/cm3][cm][cm][rad/s][s]
ERM-FD102
Population 122.50.00911.00702.04.253.872094688
Population 283.70.00911.00702.04.253.87209450
ERM-FD30431.00.00951.00792.34.253.882094285
1 Light extinction-weighted modal Stokes diameter. 2 At a temperature of 30.0 °C (ERM-FD102) and 27.8 °C (ERM-FD304). 3 As stated on the CRM certificates.
Table 2. Comparison of particle size results (mean ± expanded uncertainty) determined by routine and reference disc-CLS methods.
CRMParticle Size 1 [nm]
RoutineReference
ERM-FD102
Population 124.7 ± 2.523.1 ± 2.8
Population 290.1 ± 9.084.2 ± 10.1
ERM-FD30433.3 ± 3.131.1 ± 3.6
1 Light extinction-weighted modal Stokes diameter.
Table 3. Relevant features of the disc-CLS measurands.
FeatureDescription
Physical principleSedimentation rate measurement
TechniqueDisc-CLS (line-start incremental mode)
Detection systemTurbidity of an ensemble of particles with the same sedimentation rate
Data analysisRoutine method: conversion of time to particle size through sedimentation time scale calibration
Reference method: conversion of sedimentation time to particle size through Stokes’ law
Type of diameterSphere-equivalent Stokes diameter
Type of weightingLight extinction
Type of distributionDensity distribution
Representative valueMode
Table 4. Uncertainty budget for a single disc-CLS measurement (reference method) of nominally 80 nm silica nanoparticles (ERM-FD102).
Quantity, xi [unit]Quantity ValueStandard Uncertainty, u(xi)Distribution Type 1Contribution ∂f/∂xi·u(xi) [nm]
Angular frequency, ω [rad/s]20949N−0.34
Average viscosity of the carrier fluid between M and S, η [Pa s]0.00910.0004N & R2.05
Average density of the carrier fluid between M and S, ρf [g/cm3]1.00700.0001N & R<0.01
Radial position photodetector, M [cm]4.250.05N1.39
Radial position of inner liquid surface, S [cm]3.870.03T & N3.76
Density silica, ρp [g/cm3]2.00.05N−2.14
Sedimentation time silica, tp [s]48.20.2T−0.15
Stokes diameter, dSt,p [nm]83.7Combined measurement uncertainty, uc(dSt,p) [nm]5.0
Expanded (k = 2) measurement uncertainty, U [nm]10.0
1 N, normal; R, rectangular; T, triangular.
Table 5. Uncertainty budget for a single disc-CLS measurement (reference method) of nominally 20 nm silica nanoparticles (ERM-FD102).
Input Quantity, xi [unit]Quantity ValueStandard Uncertainty, u(xi)Distribution Type 1Contribution ∂f/∂xi·u(xi) [nm]
Angular frequency, ω [rad/s]20949N−0.09
Average viscosity of the carrier fluid between M and S, η [Pa s]0.00910.0004N & R0.55
Average density of the carrier fluid between M and S, ρf [g/cm3]1.00700.0001N & R<0.01
Radial position photodetector, M [cm]4.250.05N0.37
Radial position of inner liquid surface, S [cm]3.870.03T & N−0.84
Density silica, ρp [g/cm3]2.00.05N−0.57
Sedimentation time silica, tp [s]6755.1T−0.09
Stokes diameter, dSt,p [nm]22.5Combined measurement uncertainty, uc(dSt,p) [nm]1.3
Expanded (k = 2) measurement uncertainty, U [nm]2.7
1 N, normal; R, rectangular; T, triangular.

