Abstract
Classification of un-weathered ignitable liquids is a problem that is currently addressed by visual pattern recognition under the guidelines of Standard Test Method for Ignitable Liquid Residues in Extracts from Fire Debris Samples by Gas Chromatography-Mass Spectrometry, ASTM E1618-14. This standard method does not separately address the identification of substrate pyrolysis patterns. This report details the use of a Kohonen self-organizing map coupled with extracted ion spectra to organize ignitable liquids and substrate pyrolysis samples on a two-dimensional map with groupings that correspond to the ASTM-classifications and separate the substrate pyrolysis samples from the ignitable liquids. The component planes give important information regarding the ions from the extracted ion spectra that contribute to the different classes. Some additional insight is gained into grouping of substrate pyrolysis samples based on the nature of the unburned material as a wood or non-wood material. Further subclassification was not apparent from the self-organizing maps (SOM) results.
1. Introduction
Fire debris samples are currently classified according to ASTM E1618-14 which makes use of the total ion chromatogram, extracted ion chromatogram, and target compounds [1]. Ignitable liquid residues are classified as one of the following seven classes given by ASTM E1618-14: gasoline (GAS), petroleum distillates (PD), isoparaffinic products (ISO), aromatic products (AR), naphthenic-paraffinic products (NP), normal alkanes products (NORMA), and oxygenated solvents (OXY). The chromatographic profiles and the relative presence of the major compound types are used to classify the ignitable liquid (IL) residue. Ignitable liquids that are not characteristic of these individual classes are assigned to the miscellaneous category (MISC) and have characteristics of multiple classes, or lack class characteristics. Even with the guidelines given by ASTM E1618-14, determining the presence of IL residues is still a tedious manual pattern recognition process for the analyst and is highly subjective in nature. To counteract this, automated chemometric methods have been developed that use the covariance map and the total ion spectrum (TIS) [2,3,4,5,6,7]. The TIS is the time averaged mass spectrum across the total chromatographic profile and allows for comparison within or between labs due to the absence of variation in the chromatographic time component. Similarities among TIS from the same ASTM E1618-14 class also facilitates classification which would be much more difficult if shifts in chromatographic retention time were represented in the data set [5,6]. This work makes use of the extracted ion spectrum (EIS), a subset of the TIS, which is generated using the ions in Table 2 of ASTM E1618-14. These ions are representative of the major compounds types present in each of the ASTM classes and include: alkanes, cycloalkanes/alkenes, aromatics, indanes, condensed ring aromatics, ketones, and alcohols (Table 1).

Table 1.
Compound type with associated ions commonly observed in the electron ionization spectra from the components in ignitable liquids and substrate pyrolysis products.
It has been shown previously that ignitable liquids in all ASTM E1618-14 classes, with the exception of MISC, group according to their ASTM class designations using the EIS of ASTM ions and self-organizing maps (SOM) [2]. This work extends a previous report from [2] by using SOM to examine the relationship of substrates and IL from the National Center for Forensic Science (NCFS) Substrate and Ignitable Liquid Reference Collection (ILRC) databases [8,9]. Other previous reports of the use of SOM in the chemical domain have been to classify plastic samples based on their mechanical properties [10], to predict the retention time behavior in liquid chromatography [11], and to examine the effect of weathering on the relationship between various lighter fluids [12].
In this work the EIS from a total of 653 samples from the ILRC and Substrate databases were used as an input to an SOM to analyze the relationship of substrates with each of the ASTM classes.
2. Materials and Methods
Self-organizing maps are a type of artificial neural network used for the dimensionality reduction and visualization of large datasets [13]. SOM consist of a grid of neurons or “prototypes” that are represented by a randomly initialized weight vector. Each weight vector consists of one weight for each factor in the input vector. Samples are presented to the map during a training phase with a defined number of iterations. During each training iteration an input vector representing a sample is presented to the map and the prototype vector that is the most similar will be selected as the winning neuron or best matching unit. The similarity of the input sample to each neuron is assessed by calculating the Euclidean distance between them. The neighborhood function defines the extent that the weight vectors of the surrounding neurons will be updated with respect to the distance from the winning neuron. After the map has been trained, the samples that were used in the training phase can be projected onto the map and visualized to examine their relationship in two-dimensional space. This results in a two-dimensional map that preserves the relationship of the original data structure based on the similarity between sample feature vectors.
The training data for the SOM is comprised of the EIS of 653 samples from both the NCFS Substrate and ILRC databases [8,9]. The EIS is generated using the 29 ions given in Table 1, as previously described [2]. Each EIS was normalized so that the most abundant ion had an intensity equal to one. A total of 475 neat liquids from the ILRC database were chosen and are designated by their ASTM class: GAS, AR, ISO, NORMA, NP, PD, and OXY. Ignitable liquids designated as miscellaneous were not used in this study due to their diverse nature and lack of class characteristics. A total of 178 substrates designated as SUB were used from the Substrate Database. The ILRC and Substrate Databases were created and are maintained by the National Center for Forensic Science in collaboration with the Scientific Working Group for Fire and Explosions (SWGFEX). The classification of the ignitable liquids in the ILRC represent a consensus class assignment by a committee of practicing fire debris analysts. Substrates were produced using a two-minute burn by the modified destructive distillation method and extracted according to ASTM E1412. Sample preparation and instrumental parameters are described in previous work [7]. A grid size of 225 neurons, 112,500 training epochs, and a neighborhood radius of 13 were chosen as SOM parameters and are the same as described in [2]. All calculations were performed using the R language and environment for statistical computing, version 3.5.1 [14]. The SOM and associated plots were generated in R using the Kohonen package [15].
The SOM performance was validated by two methods. First, validation of the unsupervised training was accomplished by examination of the map to determine if adjacent cells contained samples from the same ASTM E1618 class, or SUB samples. The second method of validating the SOM was to project 50 new samples onto the map and determine the percentage correct classification for each class. The 50 samples were comprised of 40 samples that had been weathered by 25% reduction in volume. A similar application has been demonstrated by Mat Desa et al. [12]. The remaining 10 samples were created by new substrate burns.
3. Results
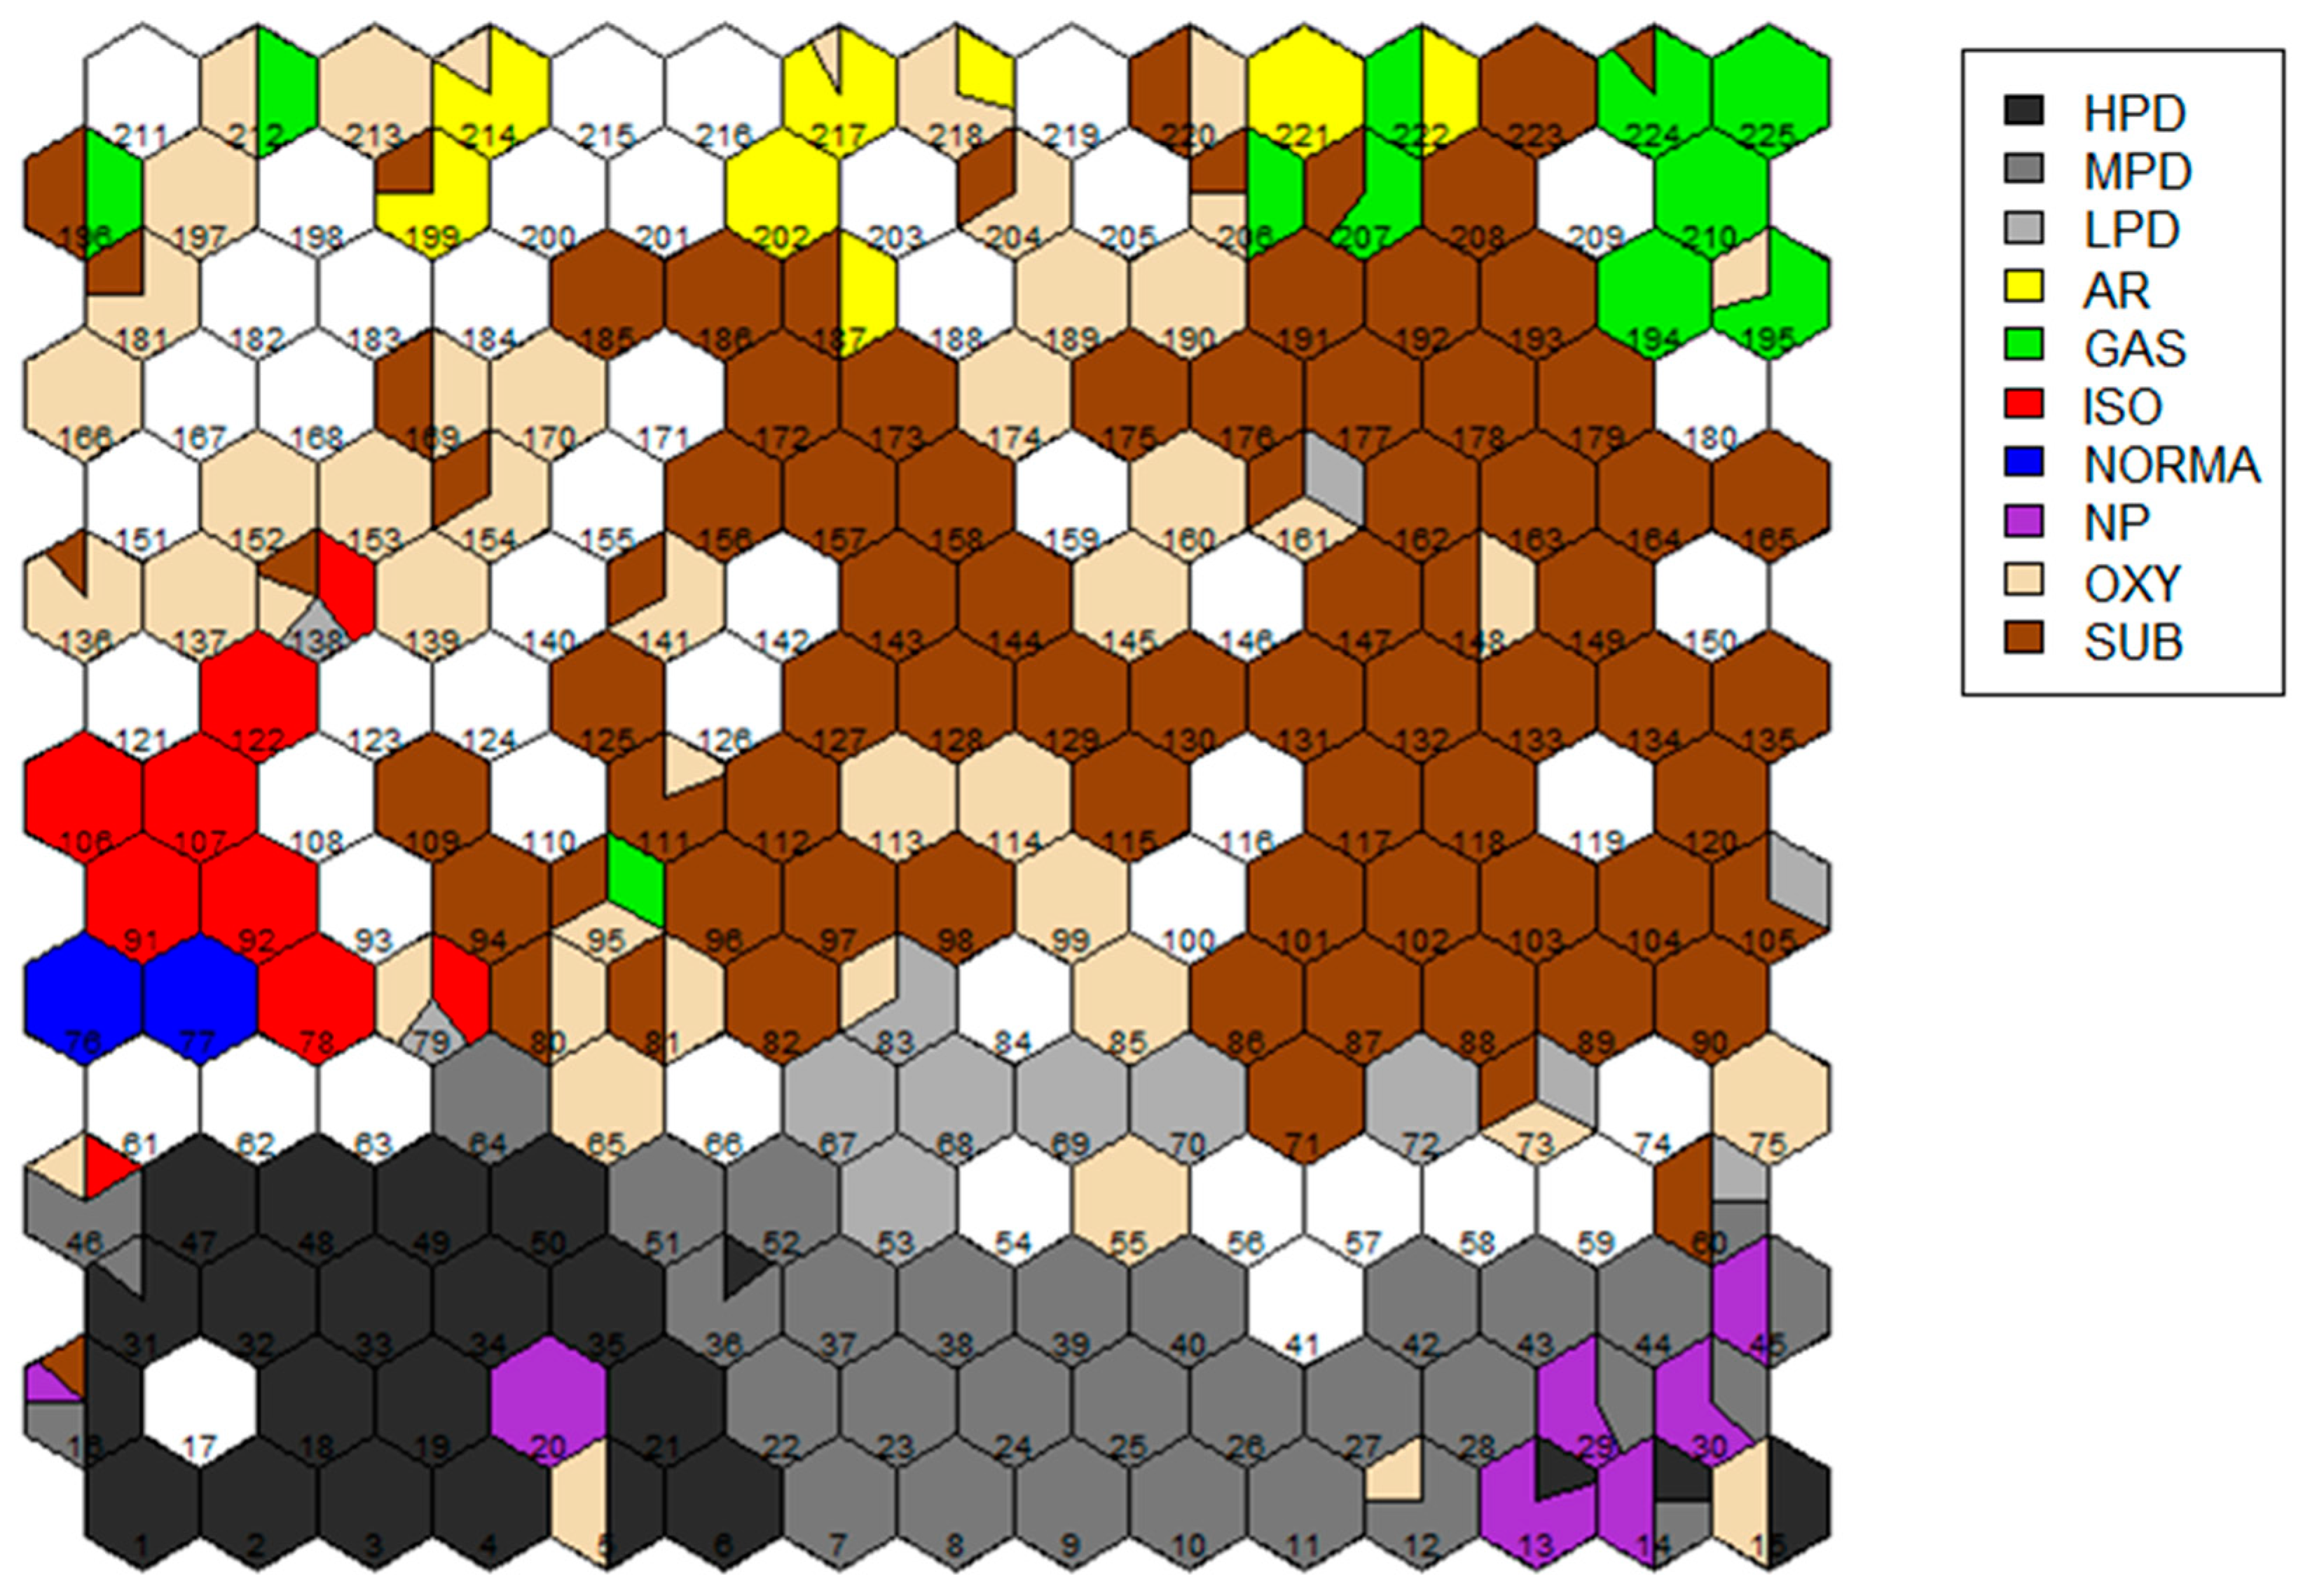
Results from the study are depicted in Figure 1, Figure 2, Figure 3 and Figure 4. Figure 1 shows the trained SOM and projected samples. The neurons are colored according to their ASTM designation(s). For example, in the top right corner of the map, the neuron is shaded green and is representative of a neuron that only had GAS samples mapped to it. If a neuron serves as the best matching unit for more than one class it is colored to reflect the proportion of each class. To visualize the PD class more effectively, it can be subdivided on the SOM based on the carbon range of the components: light (LPD), medium (MPD), and heavy (HPD). Neurons that did not have samples projected onto them are shaded white and are “empty”. The numbers in each cell serve to identify the cell and have no other significance.
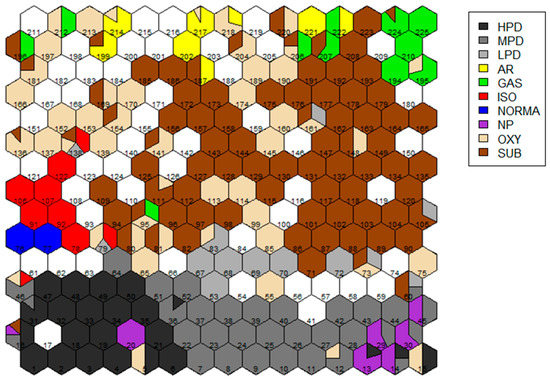
Figure 1.
The trained SOM with neurons colored according to their ASTM class designations. See the color legend.
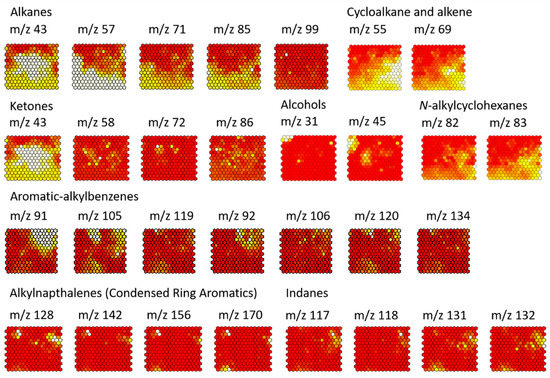
Figure 2.
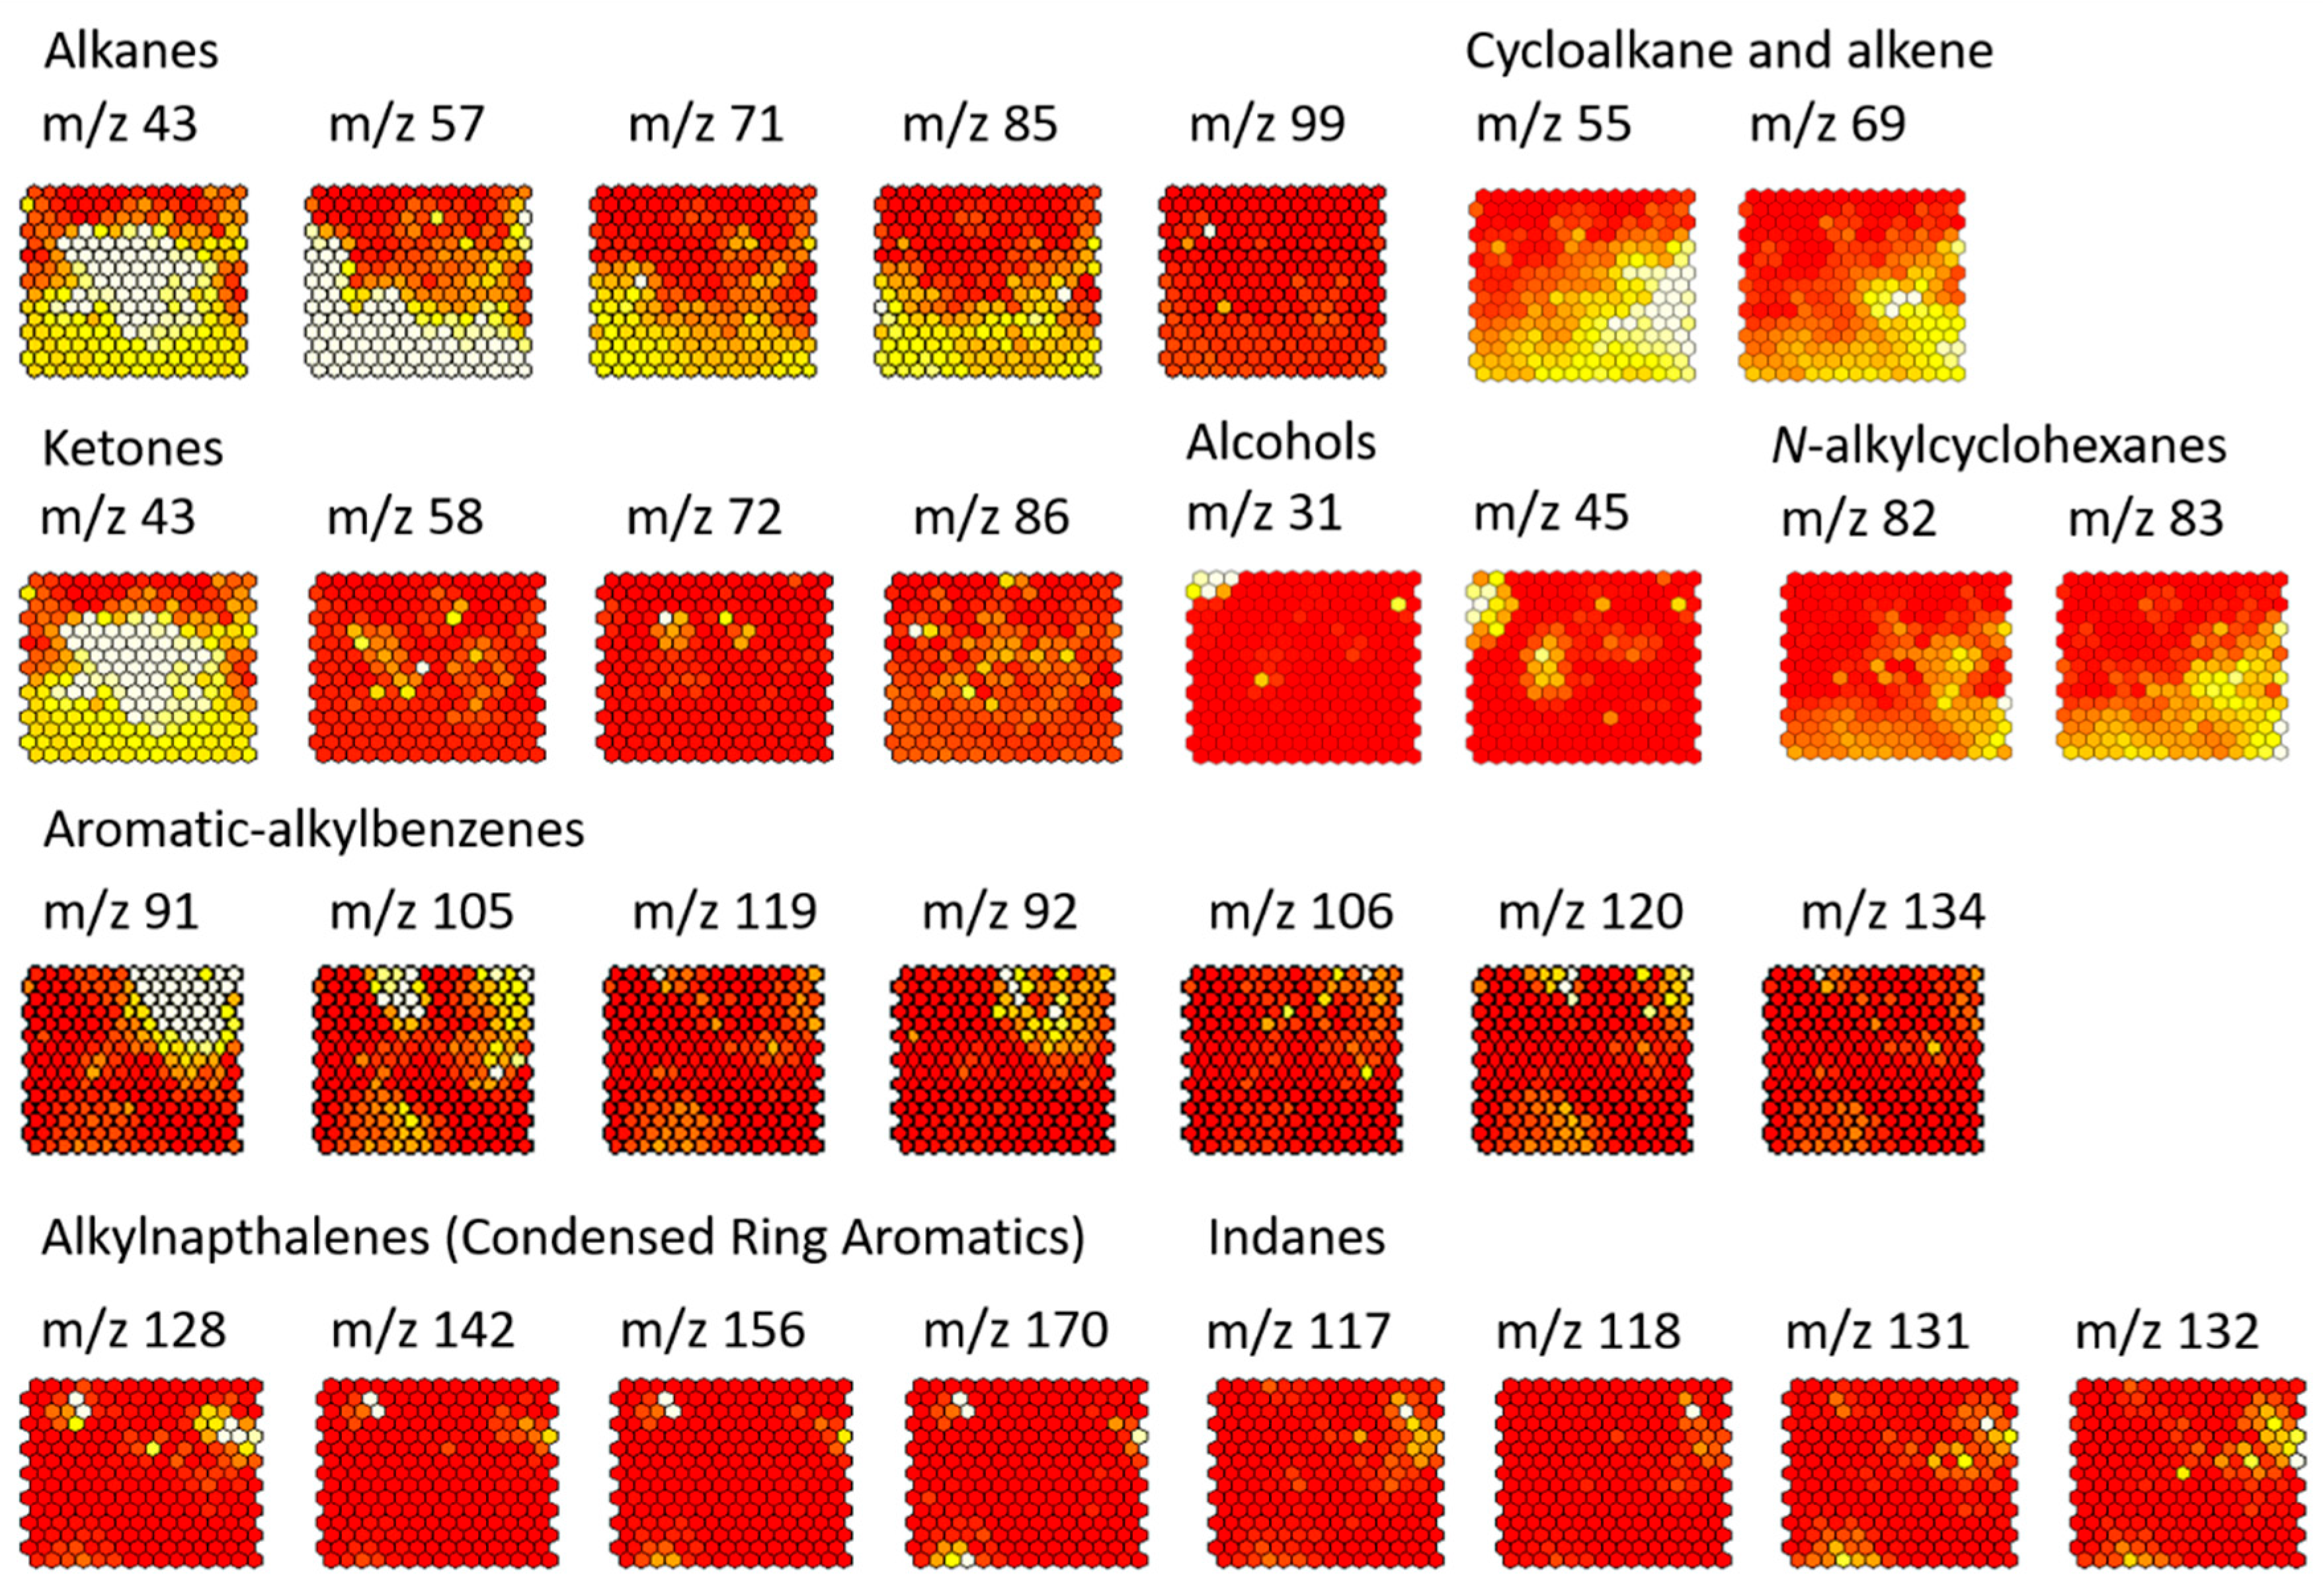
Component planes for the ions in the extracted ion spectra. The component planes are grouped according to their common ion type. Neurons that are shaded lighter indicate high weight components and neurons that are darker indicate lower weight components.
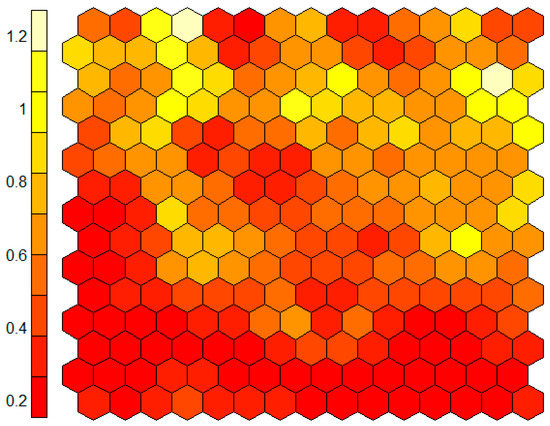
Figure 3.
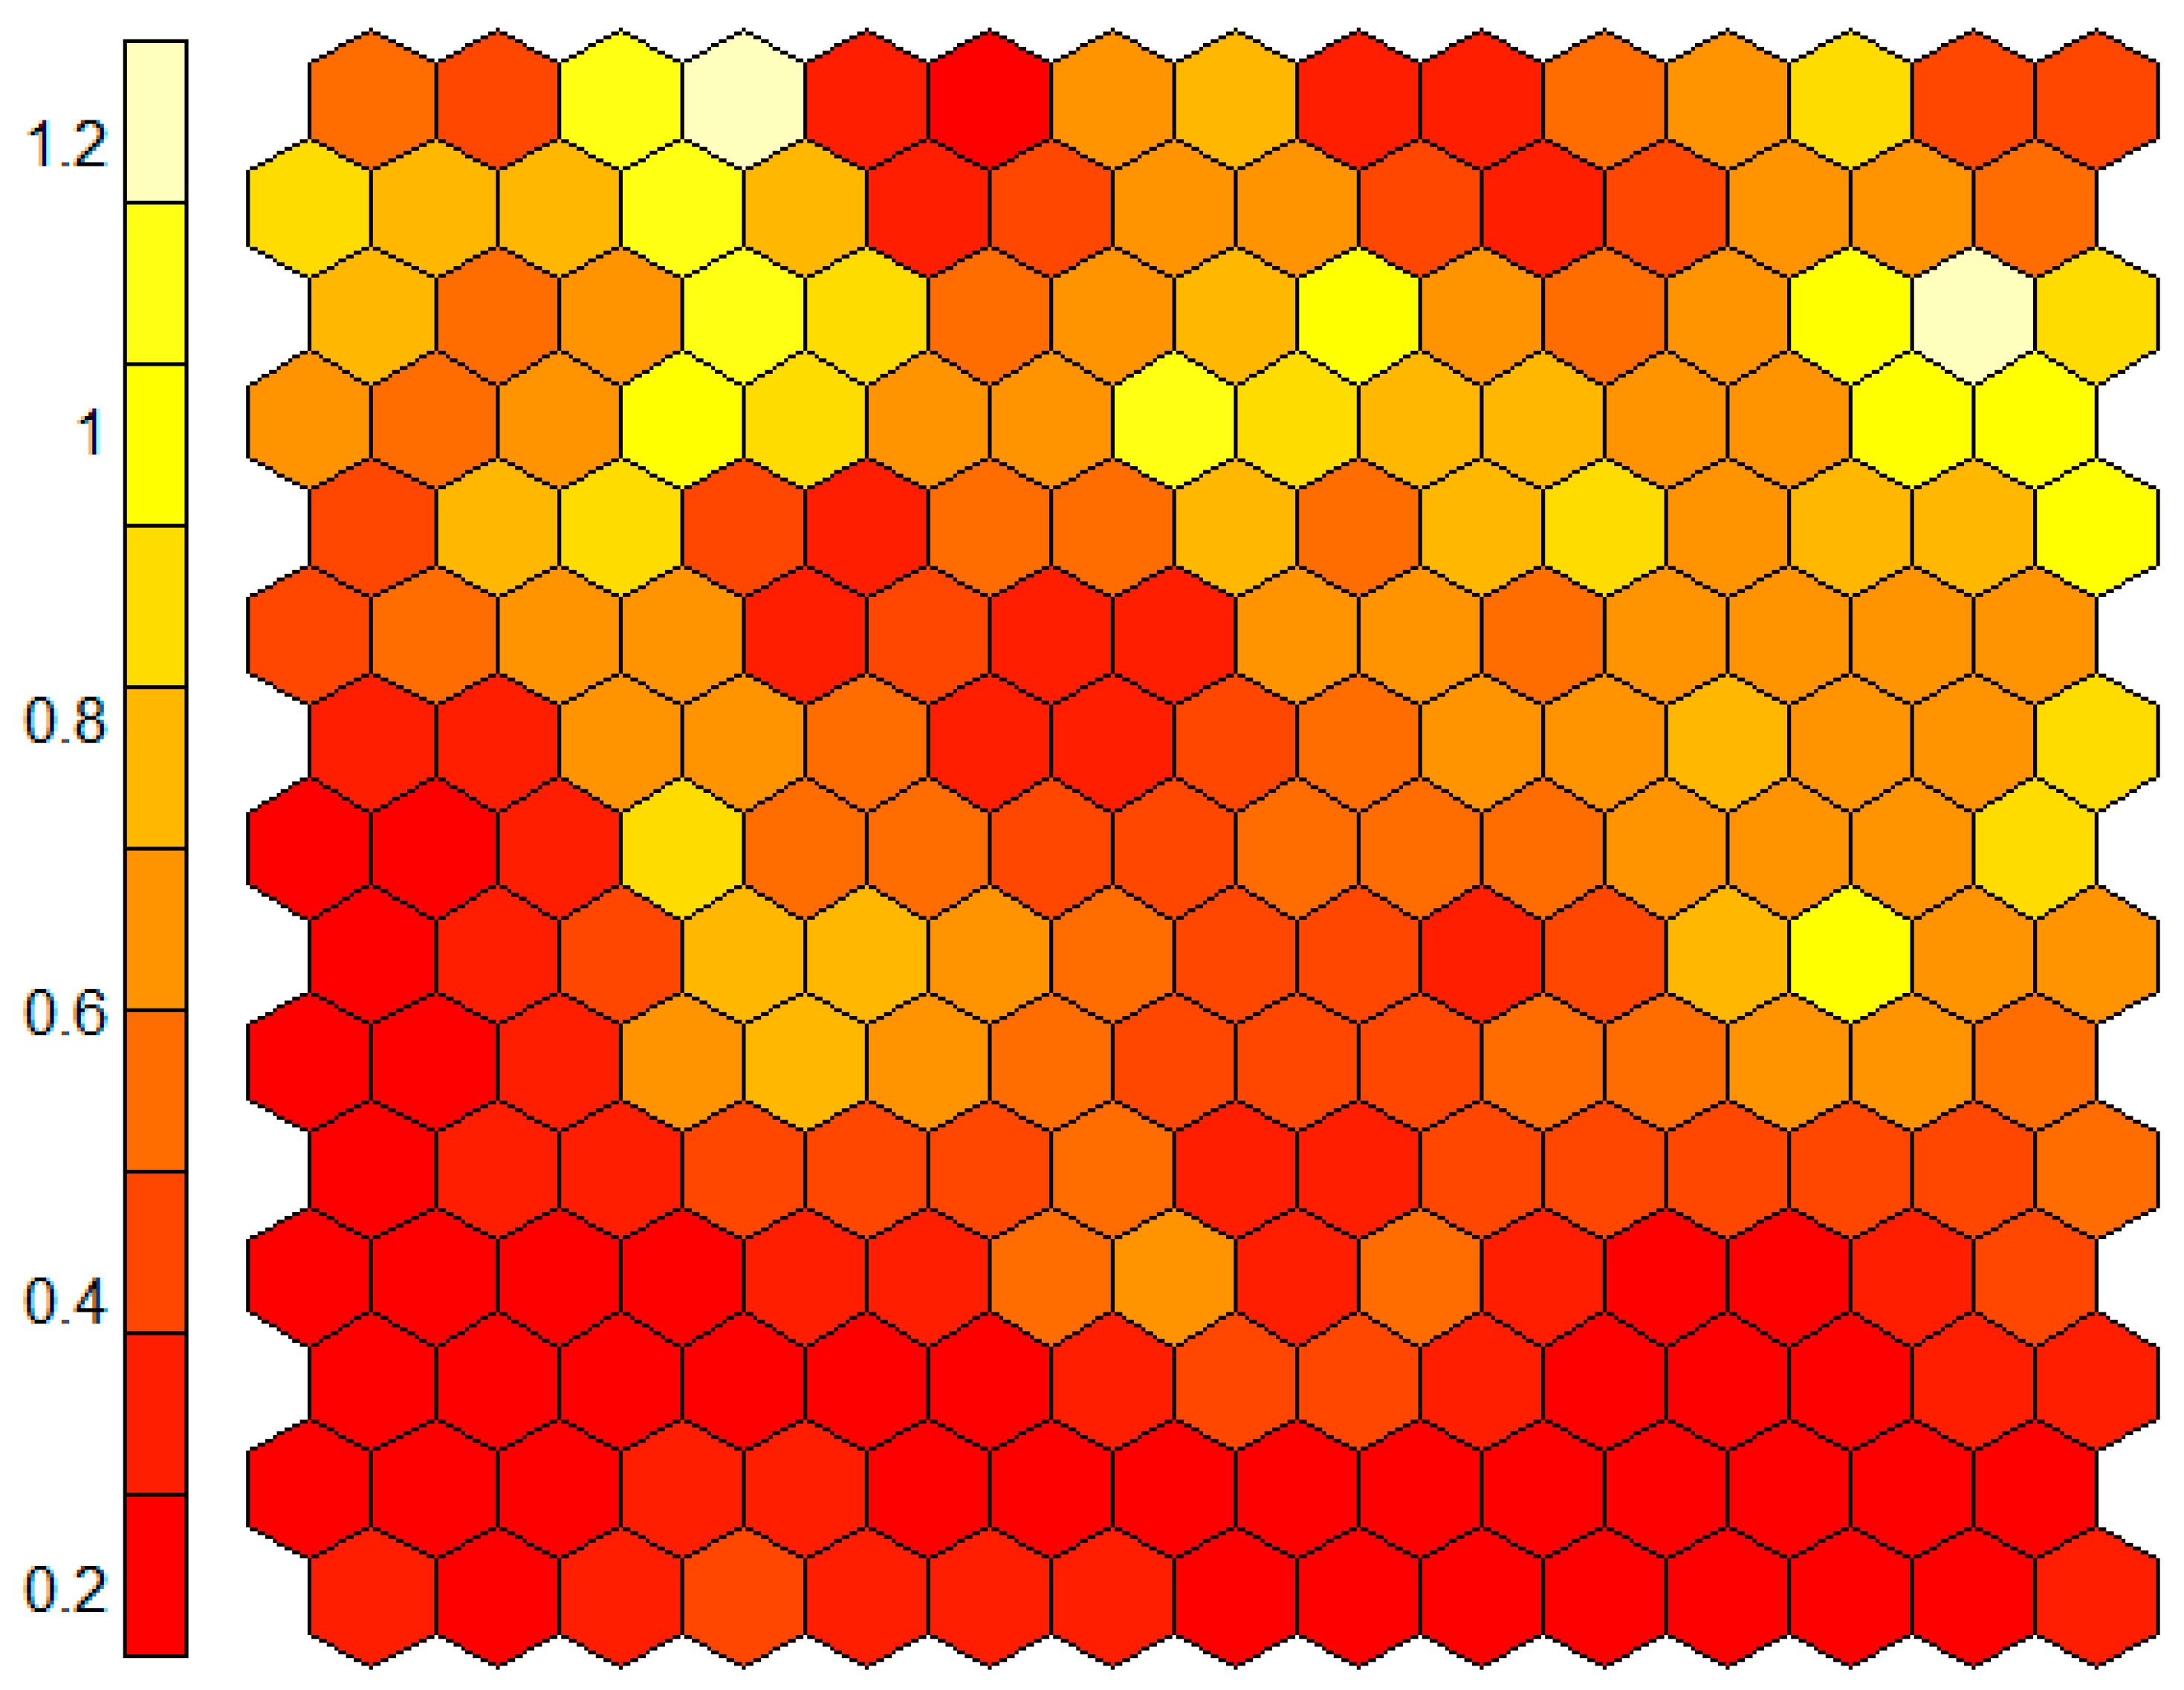
U-matrix showing the relative distance between neurons in the trained map.
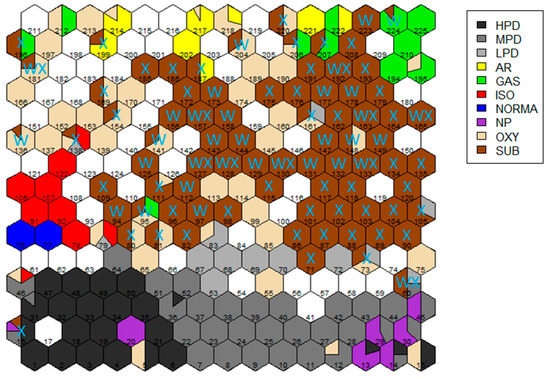
Figure 4.
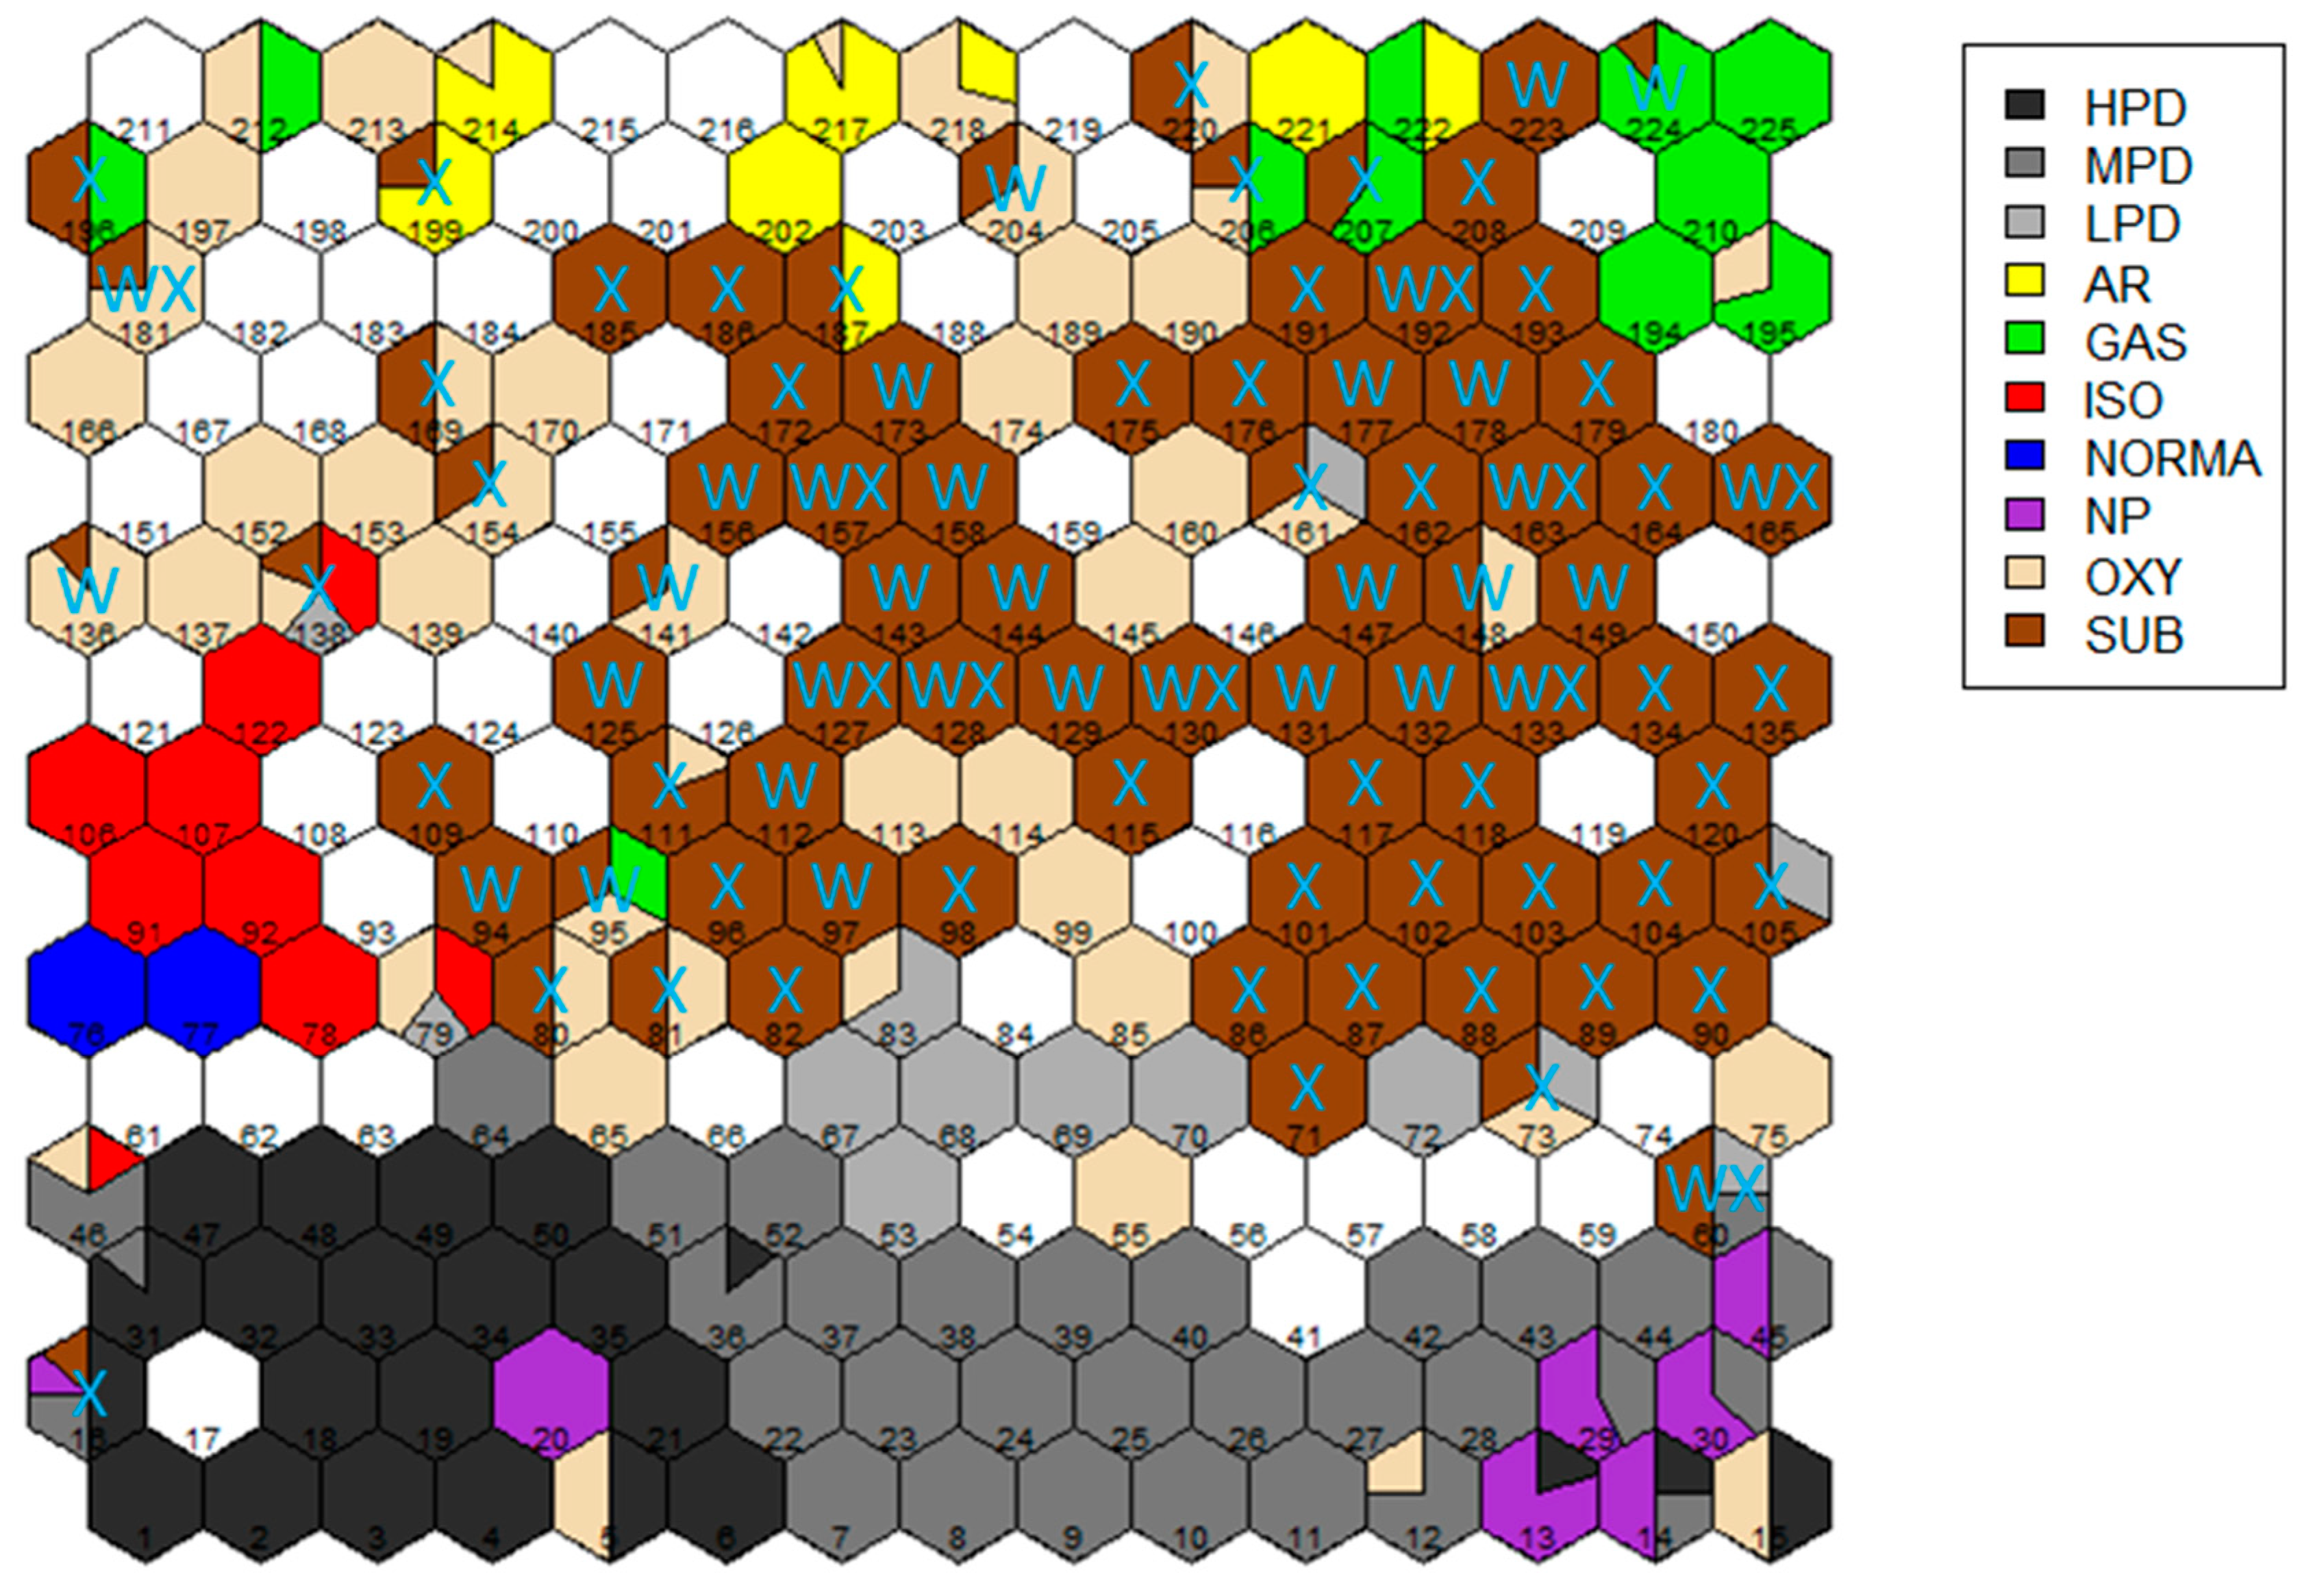
The trained SOM with neurons labeled according to the type of substrates mapped to them. Neurons labeled X denote a non-wood-based substrate and neurons labeled W indicate a wood derived product. Neurons that are labeled WX had both substrate types mapped to them.
The groupings on the map in Figure 1 can perhaps be visualized more precisely using the component planes. Each component plane is representative of an individual weight vector component for each neuron on the map. The relative intensity of these components can be compared to visualize the correlation between one or more variables on the map. The component planes for each of the input variables is shown in Figure 2 and the ions are grouped by the compound type from ignitable liquids or substrate pyrolysis that likely produced them in electron ionization mass spectra. Neurons that are shaded white represent a high intensity for the corresponding component and neurons shaded red represent a low intensity for that component. Yellow and orange shaded neurons represent intermediate intensities, with the yellow shading representing the higher intensity of the two colors.
The mapping plot in Figure 1 does not allow for the relative distances between neurons to be visualized and, therefore, the distance relationship between samples and classes that are mapped to these neurons are not readily clear from Figure 1. The structure of groupings within the SOM may be examined more closely using the unified distance matrix or U-matrix, shown in Figure 3. The U-matrix represents the sum of normalized Euclidean distances between the weight vectors that represent each neuron and those of the neurons surrounding them. Neurons shaded white are surrounded by neurons that have a large difference in one or more components of their weight vectors. Neurons that do not have a large distance to their neighbors will have similar weight vectors and are shaded red to indicate that they are closer in the mapping space.
Each SUB-associated cell in the SOM can be directly related to one or more type of substrate material. One example of these relationships is, wood (W) and non-wood-based (X) materials, which are mapped back onto the SOM cells that contain pyrolyzed substrates in Figure 4.
The results from projection of the validation samples onto the SOM are given in Table 2. The classes specified in columns correspond to the ground-truth for each sample and the class specifications for the rows reflect the projected classifications. Projected classifications are determined by the class or classes associated with each cell in the trained SOM. For example, if a SUB sample projects onto cell 172, this would be a correct assignment. Likewise, if a SUB sample projected into cell 207, this would also be considered a correct assignment since cell 207 in the trained SOM had both GAS and SUB class samples assigned. If any sample projected into an empty cell in the SOM, it is considered a failure to assign, which is treated as an incorrect assignment.

Table 2.
Validation sample assignment results.
4. Discussion
Figure 1 shows how the samples were mapped by the trained SOM. Based on the coloring of the cells, distinct groupings can be seen for most of the ASTM E1618-14 ignitable liquid classes and for the substrates. Neurons representing AR and GAS samples are primarily at the top and upper-right corner of the map respectively, however, the cells associated with AR solvents are not tightly clustered. A few GAS samples are also distributed into two cells in the upper-left corner of the map and partially surrounded by cells containing OXY compounds. The gasolines occupying these cells are E85 (ethanol containing) GAS samples. ISO and NORMA neurons are along the left edge of the SOM. The immediate proximity of these two classes is understood based on the similar fragmentation patterns of the chemical types that constitute these classes. Previous hierarchical clustering of ignitable liquids based on the total ion spectrum also found an association between the ISO and NORMA classes [6]. In a previous study of the clustering of ignitable liquids by SOM, without inclusion of SUB samples, the ISO and NORMA classes were also closely associate on the map [2], indicating that the addition of SUB samples has not significantly impacted the mapping of these two IL classes.
The cells associated with NP liquids are primarily in the lower-right corner of the map and share neurons corresponding to the MPD and HPD subclasses of the petroleum distillate (PD) class. The HPD and MPD occupy a large fraction of the lower three rows of the map, with the HPD samples primarily in the lower-left corner. In previous SOM analysis of ignitable liquids [2], the MPD cells were associated in two clusters that surrounded the HPD cluster. One of the two MPD clusters was characterized by aromatized MPD, while the other cluster was characterized by the presence of de-aromatized MPD [2]. This division is not obvious in Figure 1; however, the component planes for m/z 105, 119 and 120 in Figure 2 show a slightly increased abundance of these ions at the HPD/MPD interface. Most of the LPD samples are associated with a cluster of cells adjacent to the MPD in the lower half of the map. The continued clustering of the petroleum distillates in Figure 2 demonstrates that including substrate pyrolysis samples in the SOM has not interfered with the clustering of these ASTM E1618-14 classes.
Oxygenates contain a major “oxygenated” component (i.e., alcohol, ketone, etc.) by ASTM E1618-14 definition [1], and do not show any clear clustering tendency on the SOM map. The OXY-occupied cells are dispersed throughout the map in a pattern that is interspersed with the SUB-occupied cells. The relationship between the SUB- and OXY-occupied cells can be understood based on the significant fraction of oxygen containing partial combustion products that are generated in the burning/pyrolysis of substrates. The SUB neurons show a broad grouping within the center and right-hand side of the map. The SUB-occupied cells are surrounded by the other ignitable liquid classes, except for OXY liquids, which were discussed above.
The component planes for the various ions are shown in Figure 2. Component planes are grouped by associated compound type from which they derive and show the ions that are primarily responsible for the groupings seen in Figure 1. The component plane for m/z 43 is prominent in both the alkanes (corresponding to CH3CH2CH2+) and the ketones (corresponding to the acylium ion, CH3CO+), and the distribution of intensities visually reinforces separation of the distillates from the oxygenates and SUB pyrolysates. The m/z 45 component plane has high intensity in the upper left corner of the map, in the area where alcohols make a significant contribution. Similar distributional interpretations can be assigned to other component planes that show areas of high intensity. Notably, the component planes that appear to give the largest contributions to the cells occupied by SUB are m/z 43, 55, and 91. There is a high intensity on neurons associated with both GAS and SUB in component planes m/z 91 and 105, which is understood based on the significant contributions of aromatic compounds to gasoline and many substrate pyrolysis products. Interestingly, neurons in the m/z 55 component plane show somewhat higher intensities on SUB associated neurons than PD associated neurons. The m/z 69 component plane has the highest intensity on SUB associated neurons. Component planes associated with indane ions are primarily represented by SUB associated neurons. Some of the component planes in Figure 2 (i.e., m/z 99, 134,142, 156 and 170) show minimal variation across the map and low relative intensity. These ions could possibly be dropped from the list of features used to cluster the samples.
The U matrix, Figure 3, shows the distance between adjacent cells. When distinct boundaries exist between classes, this is observed as a set of lighter colored cells (i.e., yellow to white) running through the map and dividing the distinctly different classes. Distinct boundaries are not clearly observed in Figure 3, even though clustering by ASTM E1618-14 ignitable liquid types and substrates are observed in Figure 1. More distinct boundaries were observed between some ignitable liquid groups in [2]. This result is interpreted to indicate that while the SOM continues to group samples into the ASTM E1618-14 classes separately from most substrate pyrolysis samples, the differences between samples are becoming less distinct, as reflected in the Euclidean distances across all samples.
While the ignitable liquid classes, as defined by ASTM E1618-14, are organized on the SOM and have been shown to organize by class using hierarchical clustering [6], organization of the pyrolysis products from different substrates has not previously been addressed. Some rough groupings of substrates (i.e., those having similar material types and producing pyrolysis products that exhibit similar ions under electron ionization) were observed by mapping the product types back onto the SOM. Figure 4 shows a tendency to form two groupings within the substrates for wood and non-wood-based materials. A distinct cluster of non-wood materials is observed slightly below the map center along the right edge. This clustering corresponds to high intensities in the component planes for ions from alkenes/cycloalkanes and cyclohexane/n-alkylcyclohexanes (i.e., m/z 55, 69, 82, and 83).
As described above, the SOM groups samples from the same ASTM E1618-14 class in a reasonable fashion and substrate samples also cluster. The SOM also projects a set of validation samples with an overall 96% accuracy, see Table 2. The 25% weathered samples from each ASTM E1618-14 class are assigned with 100% accuracy. Eighty percent of the 10 SUB samples are assigned correctly. One of the validation samples, comprised of burned carbonless paper, incorrectly assigned to a cell in the trained SOM that contained only ISO class solvents. No explanation is offered for this assignment. A cherry hardwood substrate sample assigned to an empty cell, number 140, in the trained SOM. The empty cell was flanked by cells in the trained SOM that contained SUB and OXY samples. This assignment is perhaps not difficult to understand given the nature of the assignments to the surrounding cells.
The SOM presented here and in previous work demonstrates a clear ordering of ignitable liquid classes as defined under ASTM E1618-14 [1,2,6]. The map organization of substrates reinforces gross differences in material type, however, given the complex nature of composite manmade materials, a more compositionally refined clustering cannot be assigned at this time. Similarly, attempts to project known ground truth fire debris samples onto the SOM did not result in easily interpretable results. In those tests, samples of a pyrolyzed substrate containing progressively increasing amounts of a partially evaporated liquid did not project onto the SOM in such a way as to produce a clear path between the respective SUB and IL samples. Although the mixed composition of the samples results in total ion spectra that reflect a linear mixture of the SUB and IL which comprise the sample, there is no guarantee that the corresponding extracted ion spectra will coincide with a set of codebook vectors falling on a smooth curve between the IL and SUB. This may be attributed, in part, to the use of partially evaporated IL to produce the known ground truth mixed samples. Partially evaporated IL samples were not used to create the SOM. However, previous work by Nic Daeid and co-workers found that a SOM trained on features comprising 51 characteristic peaks from lighter fluid chromatograms could be used to correctly assign evaporated fluids to the proper manufacturer [12]. Unlike the previous SOM works on lighter fluids and ignitable liquids, which showed clear boundaries between classes when viewing the U matrix [2,12], such clear boundaries were not observed in this work.
5. Conclusions
The EIS corresponding to the ions in Table 2 of ASTM E1618-14 lead to groupings by a self-organizing map that are consistent with the ASTM-defined classes when substrate pyrolysis samples are introduced [1]. Substrate pyrolysis samples roughly organize along a split between the wood and non-wood-based products. Samples comprised of both IL and SUB, and exposed to progressively greater extents of burning failed to project onto clearly defined paths on the SOM, which is partially attributed to evaporation of the IL during the burning process.
Author Contributions
Conceptualization: M.E.S., M.R.W., and N.T.; methodology: N.T.; software: N.T.; validation: N.T. and M.R.W.; formal analysis: M.E.S., M.R.W., and N.T; investigation: N.T.; resources: M.E.S. and M.R.W.; data curation: N.T. and M.R.W.; writing—original draft preparation: N.T.; writing—review and editing: M.E.S. and M.R.W.; visualization: N.T.; supervision: M.E.S. and M.R.W.; project administration: M.E.S. and M.R.W.; funding acquisition: M.E.S. and M.R.W.
Funding
This project was supported by Award Number 2017-IJ-CX-0023 awarded by the National Institute of Justice, Office of Justice Programs, U.S. Department of Justice. The opinions, findings, and conclusions or recommendations expressed in this presentation are those of the authors and do not necessarily reflect those of the Department of Justice.
Conflicts of Interest
The authors of this report have no conflicts of interest. The funders had no role in the design of the study; in the collection, analyses, or interpretation of data; in the writing of the manuscript; or in the decision to publish the results.
References
- International, A. ASTM E1618-14, Standard Test Method for Ignitable Liquid Residues in Extracts from Fire Debris Samples by Gas Chromatography-Mass Spectrometry; ASTM International: West Conshohocken, PA, USA, 2014. [Google Scholar]
- Frisch-Daiello, J.L.; Williams, M.R.; Waddell, E.E.; Sigman, M.E. Application of self-organizing feature maps to analyze the relationships between ignitable liquids and selected mass spectral ions. Forensic Sci. Int. 2014, 236, 84–89. [Google Scholar] [CrossRef] [PubMed]
- Sigman, M.E.; Williams, M.R. Covariance mapping in the analysis of ignitable liquids by gas chromatography/mass spectrometry. Anal. Chem. 2006, 78, 1713–1718. [Google Scholar] [CrossRef] [PubMed]
- Sigman, M.E.; Williams, M.R. Assessing evidentiary value in fire debris analysis by chemometric and likelihood ratio approaches. Forensic Sci. Int. 2016, 264, 113–121. [Google Scholar] [CrossRef] [PubMed]
- Sigman, M.E.; Williams, M.R.; Castelbuono, J.A.; Colca, J.G.; Clark, C.D. Ignitable liquid classification and identification using the summed-ion mass spectrum. Instrum. Sci. Technol. 2008, 36, 375–393. [Google Scholar] [CrossRef]
- Waddell, E.E.; Frisch-Daiello, J.L.; Williams, M.R.; Sigman, M.E. Hierarchical cluster analysis of ignitable liquids based on the total ion spectrum. J. Forensic Sci. 2014, 59, 1198–1204. [Google Scholar] [CrossRef] [PubMed]
- Williams, M.R.; Sigman, M.E.; Lewis, J.; Pitan, K.M. Combined target factor analysis and bayesian soft-classification of interference-contaminated samples: Forensic fire debris analysis. Forensic Sci. Int. 2012, 222, 373–386. [Google Scholar] [CrossRef] [PubMed]
- Ignitable Liquids Reference Collection and Database. Available online: https://ilrc.ucf.edu/ (accessed on 2 July 2018).
- Substrates Database. Available online: http://ilrc.ucf.edu/substrate/index.php (accessed on 2 July 2018).
- Lloyd, G.R.; Brereton, R.G.; Duncan, J.C. Self organising maps for distinguishing polymer groups using thermal response curves obtained by dynamic mechanical analysis. Analyst 2008, 133, 1046–1059. [Google Scholar] [CrossRef] [PubMed]
- Kittiwachana, S.; Wangkarn, S.; Grudpan, K.; Brereton, R.G. Prediction of liquid chromatographic retention behavior based on quantum chemical parameters using supervised self organizing maps. Talanta 2013, 106, 229–236. [Google Scholar] [CrossRef] [PubMed]
- Desa, W.N.; Nic Daeid, N.; Ismail, D.; Savage, K. Application of unsupervised chemometric analysis and self-organizing feature map (SOFM) for the classification of lighter fuels. Anal. Chem. 2010, 82, 6395–6400. [Google Scholar] [CrossRef] [PubMed]
- Kohonen, T. The self-organizing map. Proc. IEEE 1990, 78, 1464–1480. [Google Scholar] [CrossRef]
- R Core Team. R: A Language and Environment for Statistical Computing; Version 3.5.1; R Foundation for Statistical Computing: Vienna, Austria, 2018. [Google Scholar]
- Wehrens, R.; Buydens, L.M. Self- and super-organizing maps in R: The Kohonen package. J. Stat. Softw. 2007, 21, 1–19. [Google Scholar] [CrossRef]
© 2018 by the authors. Licensee MDPI, Basel, Switzerland. This article is an open access article distributed under the terms and conditions of the Creative Commons Attribution (CC BY) license (http://creativecommons.org/licenses/by/4.0/).

