Communication

Sampling Dynamics for Volatile Organic Compounds Using Headspace Solid-Phase Microextraction Arrow for Microbiological Samples

by
Kevin E. Eckert
1,
David O. Carter
2 and
Katelynn A. Perrault
1,*
1
Laboratory of Forensic and Bioanalytical Chemistry, Forensic Sciences Unit, Division of Natural Sciences and Mathematics, Chaminade University of Honolulu, 3140 Waialae Ave., Honolulu, HI 96816, USA
2
Laboratory of Forensic Taphonomy, Forensic Sciences Unit, Division of Natural Sciences and Mathematics, Chaminade University of Honolulu, 3140 Waialae Avenue, Honolulu, HI 96816, USA
*
Author to whom correspondence should be addressed.
Separations 2018, 5(3), 45; https://doi.org/10.3390/separations5030045
Submission received: 10 August 2018 / Revised: 21 August 2018 / Accepted: 27 August 2018 / Published: 10 September 2018

Abstract

:
Volatile organic compounds (VOCs) are monitored in numerous fields using several commercially-available sampling options. Sorbent-based sampling techniques, such as solid-phase microextraction (SPME), provide pre-concentration and focusing of VOCs prior to gas chromatography–mass spectrometry (GC–MS) analysis. This study investigated the dynamics of SPME Arrow, which exhibits an increased sorbent phase volume and improved durability compared to traditional SPME fibers. A volatile reference mixture (VRM) and saturated alkanes mix (SAM) were used to investigate optimal parameters for microbiological VOC profiling in combination with GC–MS analysis. Fiber type, extraction time, desorption time, carryover, and reproducibility were characterized, in addition to a comparison with traditional SPME fibers. The developed method was then applied to longitudinal monitoring of Bacillus subtilis cultures, which represents a ubiquitous microbe in medical, forensic, and agricultural applications. The carbon wide range/polydimethylsiloxane (CWR/PDMS) fiber was found to be optimal for the range of expected VOCs in microbiological profiling, and a statistically significant increase in the majority of VOCs monitored was observed. B. subtilis cultures released a total of 25 VOCs of interest, across three different temporal trend categories (produced, consumed, and equilibrated). This work will assist in providing foundational data for the use of SPME Arrow in future microbiological applications.

Graphical Abstract

1. Introduction

The sampling and analysis of volatile organic compounds (VOCs) is crucial to the success of a number of fields and industries, including the food and fragrance industries [1,2], environmental monitoring [3,4,5,6,7], and plant ecology [8,9]. The value of VOCs is also more recently emerging in numerous other fields such as forensic science [10,11], biomedical disease detection [12,13], and archaeology [14,15,16,17], where methodologies are adopted from other industries to provide significant steps forward in understanding and aiding human science. Headspace sampling is often used in these fields because analytes can easily be separated from their matrices in an effective manner with minimal contact and/or contamination. After collection, VOCs are analyzed using gas chromatography–mass spectrometry (GC–MS), which is well suited for volatile analysis because separations are conducted in the gas phase. Minimal sample preparation is required for VOC analyses, as volatiles can be trapped and introduced into the instrument without the introduction of solvents or lengthy purification steps. To date, numerous sampling techniques exist to sample VOCs. Direct analysis techniques can be used, such as collecting the sample into an air canister, polymer bag, or container; subsequently, injection can be achieved by injection using a gastight syringe, air server, or dynamic headspace attachment. In these methods, an aliquot of gas or air containing VOCs is collected and/or introduced directly into the GC–MS. This allows for very volatile compounds to be targeted, but does not provide significant benefits for sample enrichment and focusing [18]. This can sometimes lead to poor chromatographic characteristics, such as peak overloading or reduced repeatability.
Sorbent-based sampling techniques are often preferential due to their ability to pre-concentrate or enrich the sample prior to injection [18], as well as providing reduced volume and improved stability for sample transport and/or storage [19]. Solid-phase microextraction (SPME) was first developed by Pawliszyn et al. in 1990 [20,21,22] and has gained high popularity for VOC sampling in nearly all applicable fields. While the sorbent capacity of solid-phase microextraction is less than that of techniques such as sorbent tube collection, the micro-solid phase nature of the technique has many practical and analytical advantages, including (1) sensitivity on small samples; (2) reduced sampling time; and (3) minimal equipment required [19]. Criticisms of SPME for VOC analysis include the poor mechanical robustness of the apparatus for long-term sampling (i.e., prone to breakage, difficult to perform in-field sampling, septum coring, etc.) [23], as well as the relative minimal capacity offered by the fibers in comparison to higher capacity sorbent techniques such as stir bar sorptive extraction (SBSE) or sorbent tubes [24,25,26].
A recent commercial development, known as SPME Arrow, offers the same static enrichment of sample headspace as the original SPME design; however, the arrow exhibits an increase in the amount of sorbent coating (i.e., phase volume) and altered tip design for improved mechanical robustness and reliability [27]. The altered sorptive phase dimensions provide a higher VOC loading capacity for trace samples, allowing for either increased sensitivity or reduced sampling time in comparison to the original SPME design [28]. The tip of the fiber is pointed, which decreases damage to vial and inlet septa, further reducing coring and thereby maintenance costs [28]. This is considered to be of particular value in scenarios where (1) the concentration of analytes of interest is too low upon the headspace equilibration with the sorptive phase of traditional SPME fibers, (2) throughput is a major consideration for sampling equilibration time, and/or (3) reduced down time and costs of inlet maintenance are desired.
Though no literature currently exists on the use of SPME Arrow to collect VOCs from biological matrices, it could provide significant benefits. Many forensic and medical studies that analyze biological samples are currently interested in profiling volatiles from different species of bacteria. In forensic science, this information can assist in the improvement of search and recovery procedures [29,30,31], since many microbes have now been closely associated with deceased individuals [32]. In medicine, the volatiles given off by microbes and human cell lines can be key indicators of health or disease status [33,34,35,36]. When investigating sources of this nature, a number of challenges are present including the high diversity in the VOC profile, the dynamic range of concentrations of VOCs, the large number of samples that must be investigated based on project design, as well as the sensitive and critical nature of each individual sample [35,37]. When dealing with volatile sampling, repeated sample injection may not be possible, and so the reliability and robustness of the sampling technique is extremely important. An increase in sensitivity based on higher VOC loading during the collection process will be a major advantage in dealing with the dynamic range experienced with such samples. As such, it is likely that SPME Arrow will become a more common sampling technique used in these fields over traditional SPME fibers, particularly for biological matrices.
B. subtilis (Bacillales: Bacillaceae) is a species of bacteria that is facultatively aerobic, Gram-positive, motile, and rod shaped (typically 0.7–0.8 μm × 2.0–3.0 μm) [38]. B. subtilis was selected for the current study because it is widely distributed throughout nature [39], associated with decomposing remains [40], and serves as the type species for the genus Bacillus [38]. This species can colonize diverse habitats because it has the ability to decompose a wide range of organic and inorganic resources including protein, amino acids, ammonium, and nitrate; all of these compounds are forensically-relevant as they are associated with decomposing remains and represent key steps in the nitrogen cycle [41]. Additionally, in medical contexts, B. subtilis has been shown to be associated with cases of food poisoning due to spoiled meat, dermatitis, respiratory problems, tumor infection, bacteremia, and septicemia [42]. Improving our ability to profile temporal trends in volatile byproducts during the metabolic activity of B. subtilis using a more sensitive and robust SPME Arrow technology has implications across all these areas.
There currently exists minimal published data on the SPME Arrow technique to demonstrate optimal conditions for VOC analysis from biological matrices, as well as the dynamics of different VOCs that may be encountered during the sampling process. In particular, the limited studies that highlight SPME Arrow [18,27,28,43] do not target compounds encountered in life sciences applications such as forensic science and biomedical disease detection. The objective of this work was to provide preliminary data on the headspace SPME collection of a range of common VOCs encountered in life sciences applications using this high capacity SPME Arrow technique. A volatile reference mixture (VRM) was created to be used in the assessment of the SPME Arrow collection parameters. Fiber type, exposure time, desorption time, carryover, and method reproducibility were investigated to better understand fiber dynamics. A comparison to traditional SPME fiber design was also performed. Finally, the optimized SPME Arrow collection parameters were applied to the VOC profiling of a microbiological source, the headspace of cultured B. subtilis, which is a common microbe associated with forensic, medical, and agricultural applications.

2. Materials and Methods

2.1. Volatiles Reference Mix (VRM)

The VRM was created from a combination of custom mixtures and individual compounds. Mix 1 contained 2-ethyl-1-hexanol, 1-propanol, 2-propanol, 2-butanone, cyclohexane, and 2-methylfuran in P&T methanol/water (90:10), each at a concentration of 1000 µg/mL (GC grade, Restek Corporation, Bellefonte, PA, USA). Mix 2 contained styrene, 2-methylpentane, 3-methylpentane, 2,4-dimethylheptane, 2-methylhexane, naphthalene, and 1,2,3-trimethylbenzene in P&T methanol, each at a concentration of 1000 µg/mL (GC Grade Quality, Restek Corporation). Mix 3 was a commercially available standard containing benzene, ethylbenzene, toluene, m-xylene, o-xylene, and p-xylene in P&T methanol, each at a concentration of 2000 µg/mL (certified reference mixture grade, Restek Corporation). Individual compounds used were heptanal, dimethyl trisulfide, hexanal, and isoprene (analytical standard grade, Sigma-Aldrich, St. Louis, MO, USA). The solvent used for dilution was HPLC-grade methanol (J.T. Baker, Center Valley, PA, USA).
From the commercial mixes, custom mixes, and individual standards, a series of mixed standards were made for SPME Arrow evaluation. VRM 1 contained mix 1, mix 2, heptanal, dimethyl trisulfide, hexanal, and isoprene each at a concentration of 100 µg/mL, and mix 3 at a concentration of 200 µg/mL. VRM 2 contained mix 1, mix 2, heptanal, dimethyl trisulfide, hexanal, and isoprene each at a concentration of 10 µg/mL, and mix 3 at a concentration of 20 µg/mL. VRM 3 contained mix 1, mix 2, heptanal, dimethyl trisulfide, hexanal, and isoprene each at a concentration of 1.1 µg/mL, and mix 3 at a concentration of 2.2 µg/mL.
In addition to the VRM, a commercial saturated alkanes mix (SAMC) containing heptane, octane, nonane, decane, undecane, dodecane, tridecane, tetradecane, pentadecane, hexadecane, heptadecane, octadecane, nonadecane, eicosane, heneicosane, docosane, tricosane, tetracosane, pentacosane, hexacosane, heptacosane, octacosane, nonacosane, and triacontane was used, each at a concentration of 1000 µg/mL in hexane (certified reference material grade, Supelco, Bellefonte, PA, USA). The solvent used for dilution was hexane (CHROMASOLV® Plus, Sigma Aldrich, St. Louis, MO, USA).
From the commercial mix, a series of diluted standards were made for SPME Arrow evaluation. SAM 1 contained SAMC at a concentration of 100 µg/mL. SAM 2 contained SAMC at a concentration of 10 µg/mL. SAM 3 contained SAMC at a concentration of 1.1 µg/mL.
All mixtures were prepared fresh in glass vials (within one month of use) and stored in a freezer between analyses.

2.2. Gas Chromatography–Mass Spectrometry (GC–MS) Analysis and Data Processing

The inlet temperature was 250 °C for all trials. The Thermo TRACE Ultra inlet conversion kit (Restek Corporation) and a splitless liner (Restek Corporation, 2.0 × 8.0 × 105 mm) were used for all SPME injections. A Rxi-624Sil MS capillary column was used (Restek Corporation, 30 m × 0.25 mm ID × 1.4 µm film thickness) inside of a Focus GC coupled to a DSQ II (dual-stage quadrupole) mass selective detector (MSD) (Thermo Scientific, Bellefonte, PA, USA). A helium carrier gas flow rate of 1.0 mL/min was used (Airgas, Radnor, PA, USA). The oven temperature was held at 35 °C for 5 min and then increased by 5 °C/min to 240 °C, where it was held for 5 min. The MS transfer line and source temperatures were held at 250 °C and 200 °C, respectively, and the MSD was operated in full electron ionization (EI) scan mode from 40 to 450 m/z at a scan rate of 5 scans/s.
Data acquisition was performed using Thermo XCalibur version 3.0.63. Raw files were imported into Thermo Chromeleon version 7.25 SR5 for further processing. MS detection was performed using the Cobra detection algorithm. Automatic baseline correction was used with peak dependent correlation set at n = 3 spectra for each of the left region bunch, right region bunch, and peak spectrum bunch. Tentative peak identifications were made using the National Institute of Standards and Technology (NIST) 2014 Mass Spectral Library with a forward match factor threshold of 700 and reverse match factor threshold of 700. Data were exported as *.csv files and statistics were generated as described in Section 2.5.

2.3. Optimization of SPME Arrow Method

The SPME Arrows under study were coated with one of four different stationary phases: 120 µm carbon wide range (CWR)/polydimethylsiloxane (PDMS), 100 µm PDMS, 100 µm polyacrylate (PA), and 120 µm divinylbenzene (DVB)/PDMS (Restek Corporation). Selection of SPME Arrow stationary phase was performed by static exposure of CWR/PDMS, PDMS, PA, and DVB/PDMS Arrows for 5 min inside sealed headspace vials (Restek Corporation, 20 mL, 22 × 75 mm) containing 10.0 µL of VRM 1 and 1.0 µL of SAMC added with a micropipettor prior to sampling at room temperature.
Following fiber selection, the optimum exposure time was determined for the selected fiber. A range of exposure times were tested including 30 s and 1 min to 15 min (in 1 min intervals). For each trial, the SPME Arrow was exposed inside a sealed headspace vial containing 1.0 µL of VRM 2 and 1.0 µL of SAM 2 added with a micropipettor prior to sampling at room temperature. To determine the optimum time the SPME Arrow needed for complete VOC desorption to occur in the GC inlet, a range of inlet desorption times were tested: 1, 5, 15, 20, 25, 30, 45, 60, and 90 s. The SPME Arrow was first conditioned at 270 °C for 8 min in the GC inlet, and then exposed for 5 min inside a sealed headspace vial containing 1.0 µL of VRM 1 and 1.0 µL of SAM 1 added with a micropipettor prior to sampling at room temperature. Carryover was also tested by running a series of fiber blanks after saturating the SPME Arrow with VRM and SAM and performing the optimized desorption time to confirm that optimal desorption removed all analytes prior to further analysis. Following exposure, the SPME Arrows were analyzed using the GC–MS method in Section 2.2.
Intraday and interday repeatability using the final sampling parameters were tested using n = 3 replicate vials spiked with 9.0 µL of VRM 3 and 9.0 µL SAM 3 via injection through the septum using a 10 µL syringe (Trajan Scientific and Medical, Ringwood, Victoria, Australia). Finally, a 23 ga. CWR/PDMS PAL SPME Fiber (Restek Corporation) was also compared to the corresponding CWR/PDMS PAL SPME Arrow (Restek Corporation) to assess the magnitude of increased loading using the SPME Arrows. This test was carried out on a single day using n = 3 replicate vials spiked with 9.0 µL of VRM 3 and 9.0 µL of SAM 3 via injection through the septum using a 10 µL syringe (Trajan Scientific and Medical).

2.4. Application to Bacillus subtilis Headspace

B. subtilis was isolated in previous work from previous pig (Sus scrofa domesticus) decomposition studies at the university taphonomic research facility. The microbial growth medium used in the current study was standard nutrient agar (HiMedia Laboratories Pvt. Ltd., Mumbai, India). 4.0 mL of growth medium was added to sterilized 20 mL headspace vials (Restek Corporation) as a slant using a sterile serological pipette (VWR International, Radnor, PA, USA). After cooling and solidifying, a VWR Symphony incubator was used to incubate the vials at 24 °C for 72 h to verify they were free of biological contamination. The headspace vials were then inoculated with B. subtilis uniformly over the growth medium using a metal loop. The vials were sealed and sampled using the SPME Arrow using the optimized parameters from the above tests. These parameters were: CWR/PDMS stationary phase, pre-conditioning time of 30 min at 270 °C, exposure time of 5 min, and GC inlet desorption time of 3 min. After sampling, the headspace vial was opened inside the sterilized laminar flow cabinet to purge the headspace of VOCs for 5 min. The headspace vial was resealed and incubated at 24 °C for 24 h. Vials were prepared in triplicate and a single injection of each vial was resampled every 24 h over a five-day period. Uninoculated vials were analyzed in triplicate in a manner identical to the B. subtilis vials.

2.5. Statistical Analysis

Statistical analysis was performed on data by importing *.csv files into Prism 7 (Graphpad Software, La Jolla, CA, USA) for univariate analysis and graphing, and the Unscrambler X version 10.5 (CAMO Software, Oslo, Norway) for multivariate analysis. Univariate statistical analysis was performed on raw peak areas. For multivariate analysis, data were normalized using unit vector normalization, scaled by standard deviation and mean centered. The pre-treated data was then subjected to principal component analysis (PCA) for further visualization and characterization. One PCA was performed including all control and bacteria data to demonstrate the differences between vials containing blank agar and those containing bacterial cultures. A second PCA was performed including only bacteria data to demonstrate the differences between samples on each of the days of analysis, in order to highlight the transition in VOCs across the growth phase of the bacteria. Outliers were verified to not exist in both data sets using Hotelling’s T2 ellipse within the Unscrambler X software.

3. Results and Discussion

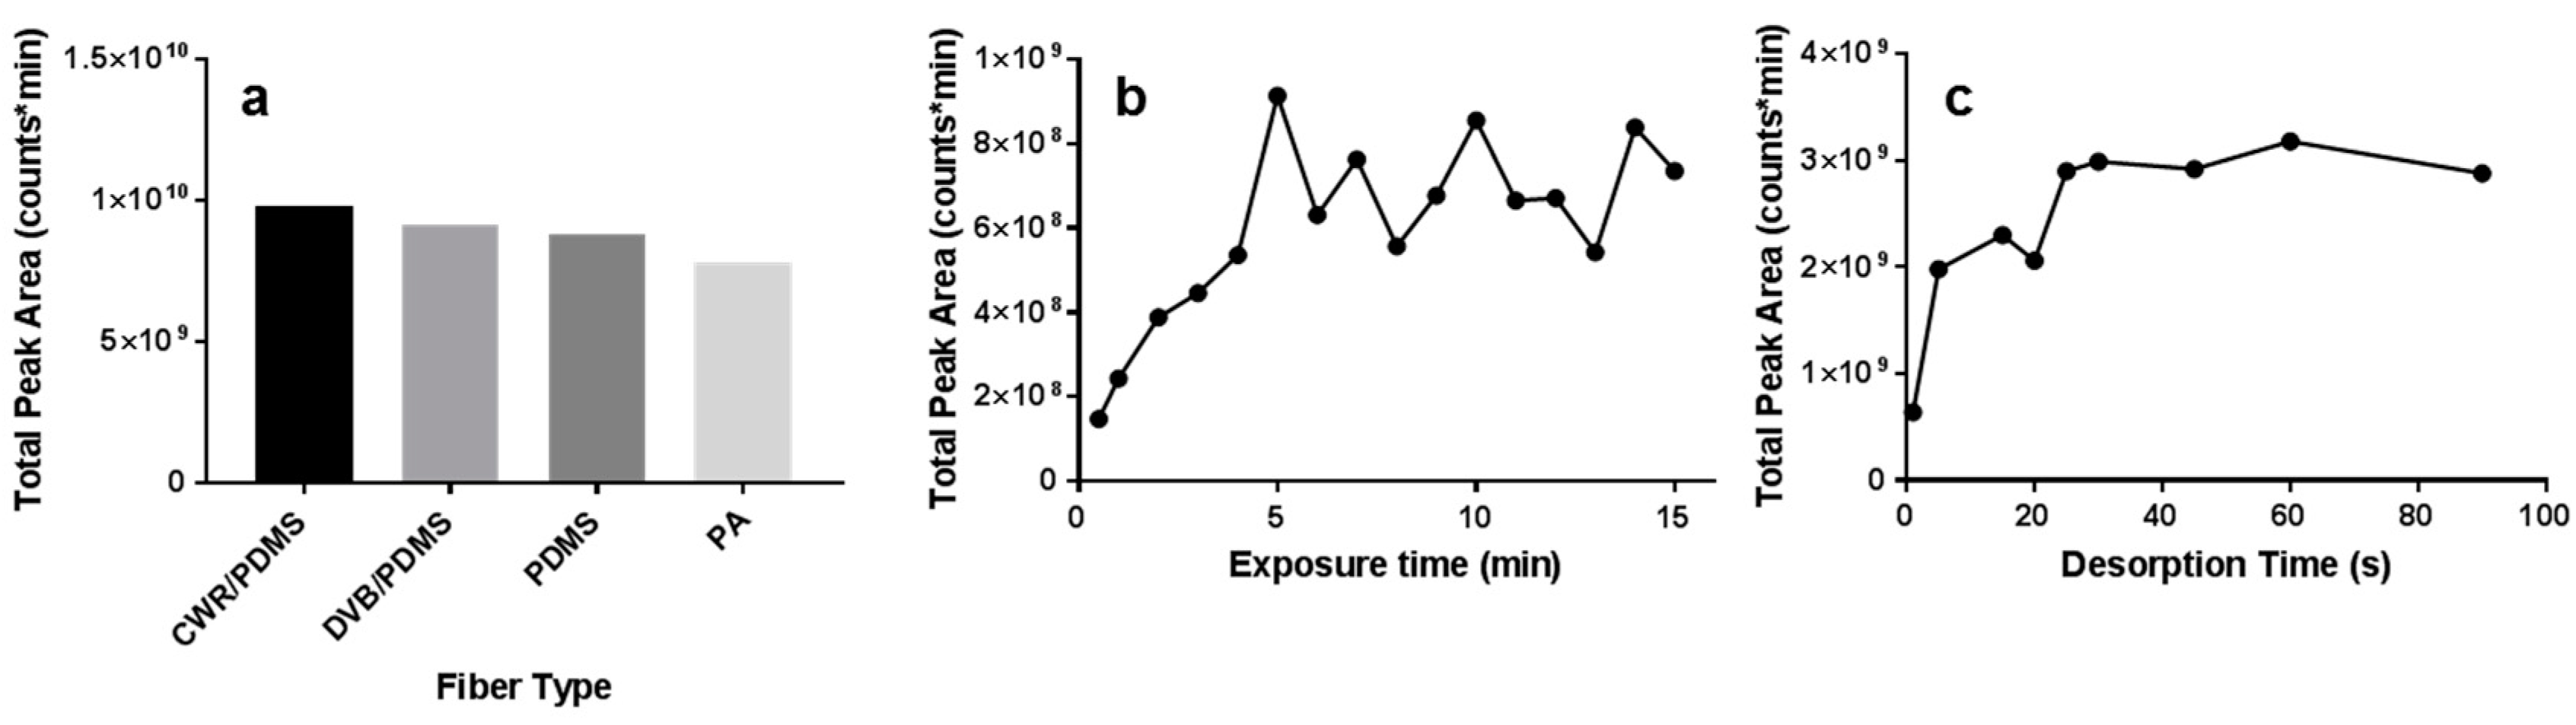
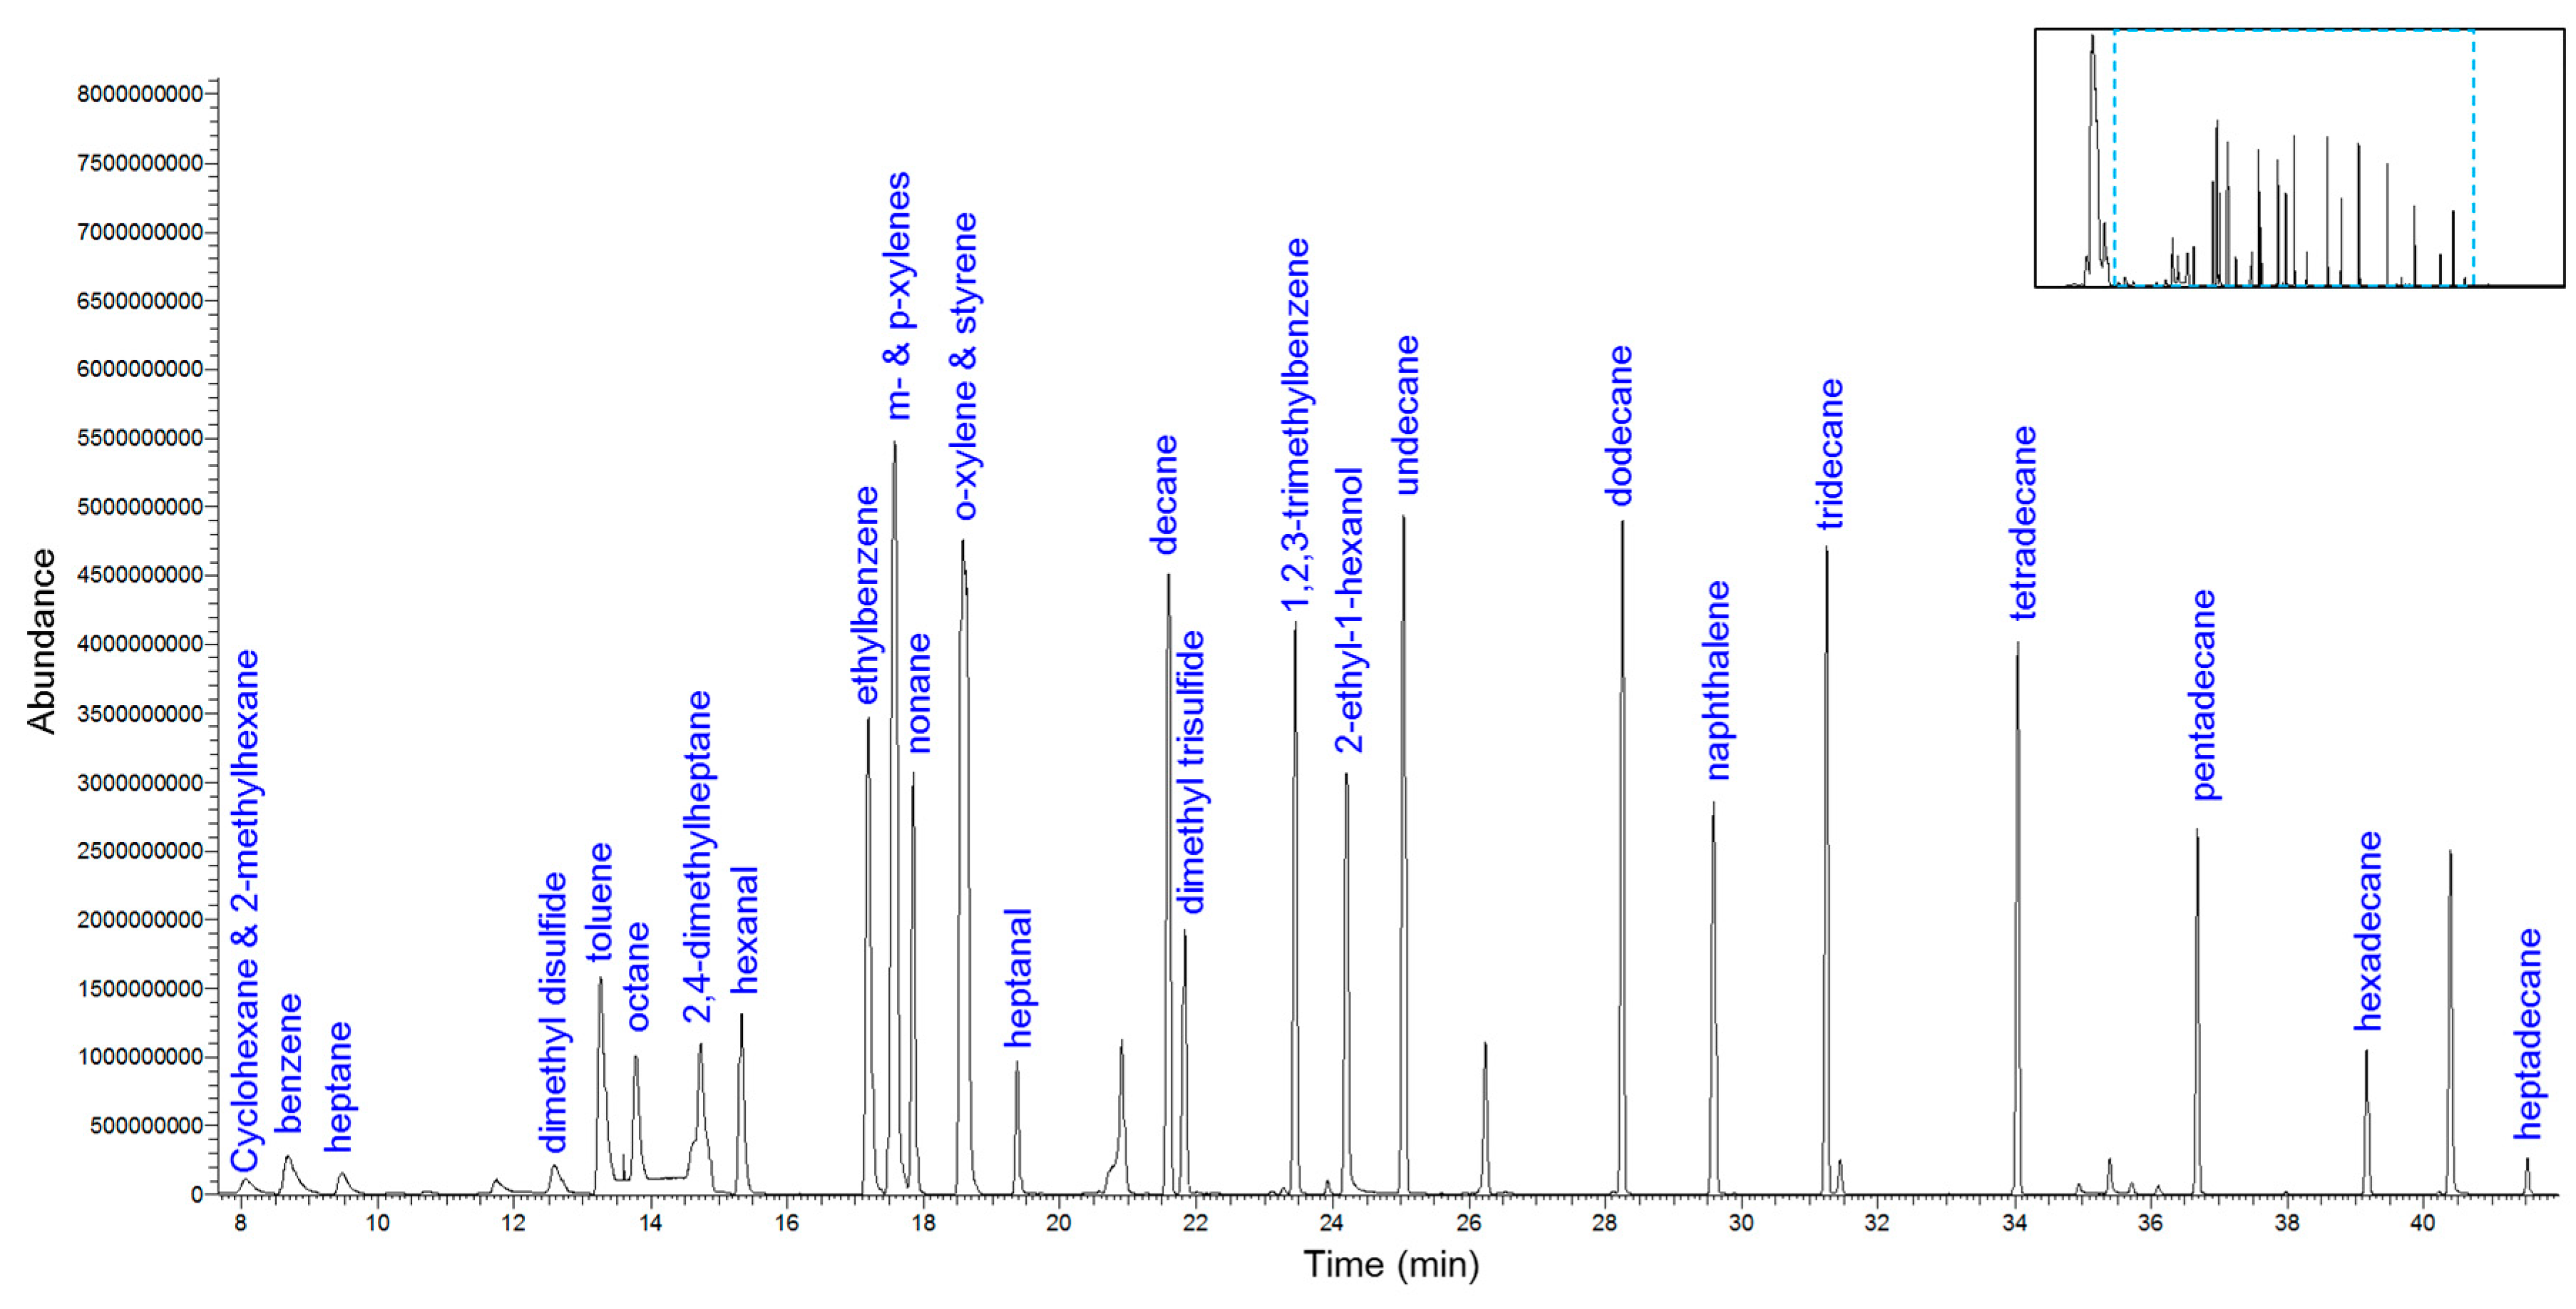
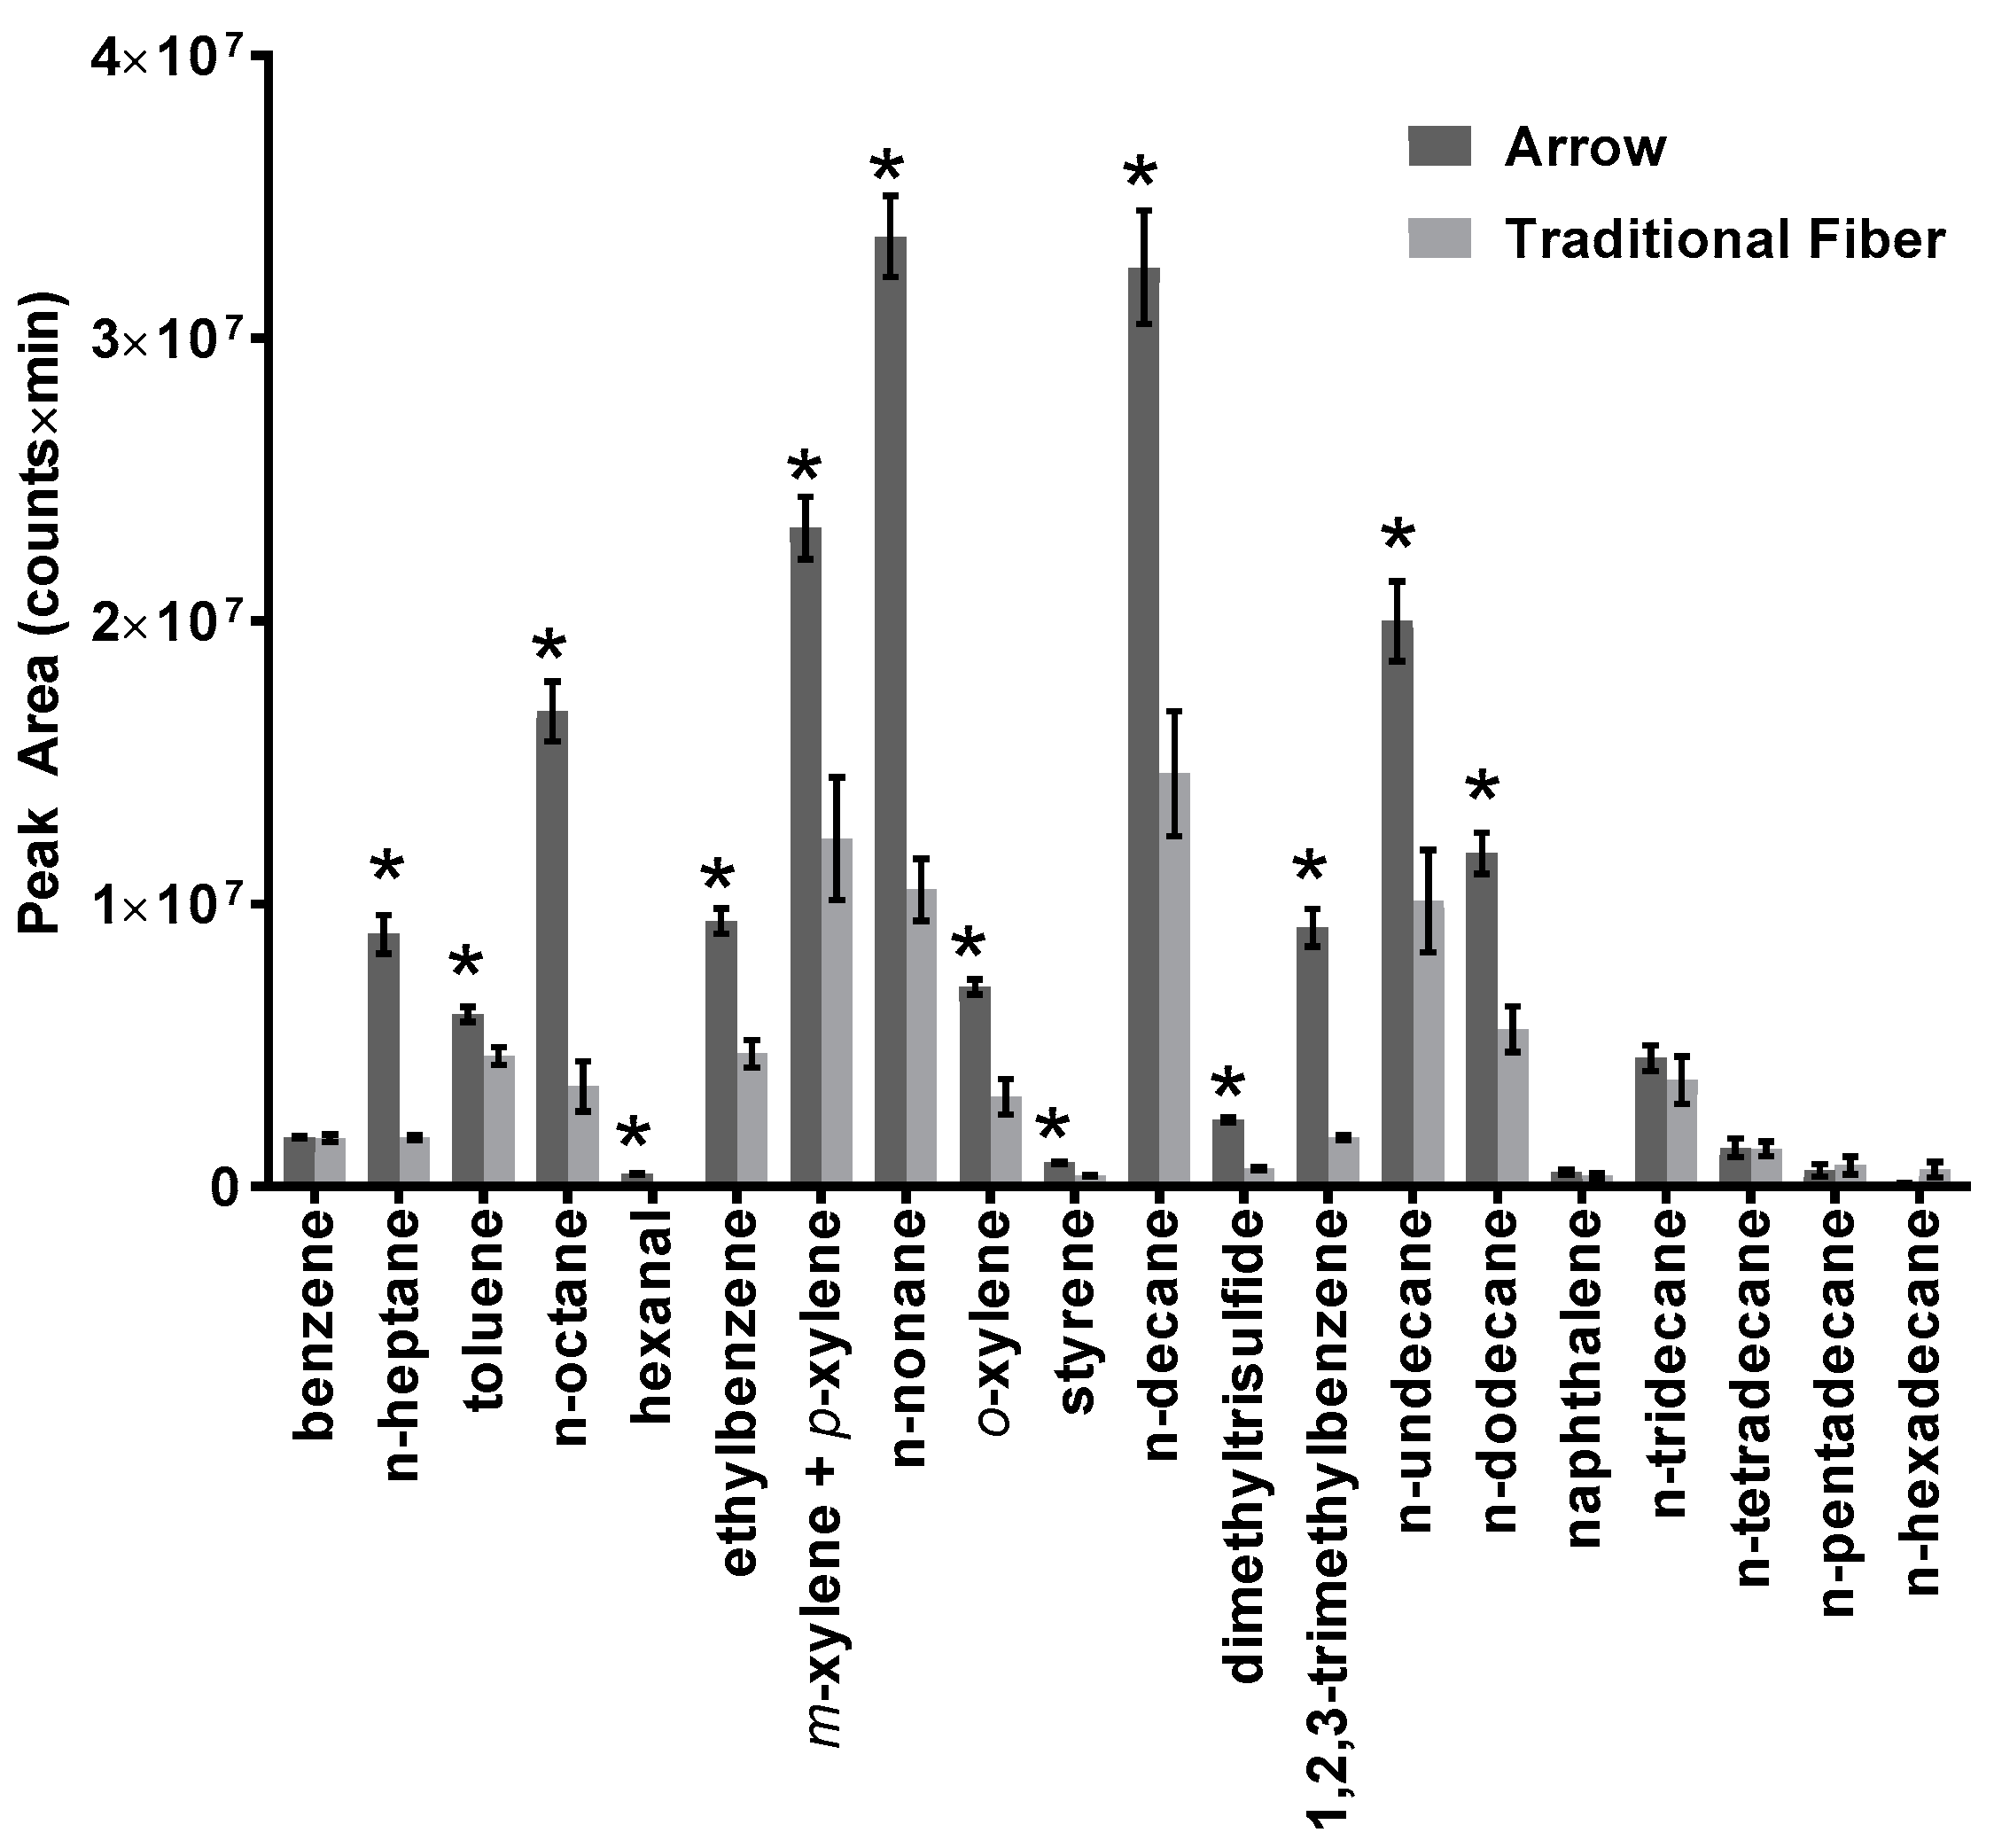
3.1. Arrow Method Optimization

A variety of sorbent materials are now commercially available as part of the PAL SPME Arrow product line. As such, it was necessary to verify suitability for biological applications, specifically for the range of volatiles expected from microbial sources as described for this study. The results of fiber comparison for the SPME 1.1 mm Arrow range are shown in Figure 1a. The CWR/PDMS fiber recovered the highest overall abundance of combined compounds. This was largely attributed to an above average recovery of analytes across all compound classes, whereas other fibers exhibited low recoveries within specific compound groups. For example, the PA fiber had high abundance for >C12 n-alkanes; however, short chain alkanes (<C12) as well as branched and cyclic alkanes—such as 2-methylpentane, 3-methyl-pentane, 3-methylhexane, and cyclohexane—could not be detected from the PA fiber. The high total peak area of the PA fiber is largely attributed to high recovery of >C13 alkanes. The DVB/PDMS and PDMS fibers exhibited lower recoveries than CWR/PDMS and polyacrylate for aromatics, aldehydes, sulfides, and alcohols. Overall, the CWR/PDMS fiber was found to exhibit the highest efficacy for compounds expected within biological matrices such as the headspace of bacterial cultures. The longest n-alkane recovered by the CWR/PDMS fiber was n-heptadecane at a retention time of approximately 41.5 min; therefore, it is unlikely that compounds with a retention index above 1700 would be recovered if the GC–MS conditions employed herein are applied in future work. The GC–MS method extended beyond this time to 52 min, however, no larger alkanes were detected.
Further testing of the CWR/PDMS Arrow demonstrated that exposure time peaked in performance after 5 min (Figure 1b). Though fluctuations in response occurred with longer exposure times, extending the exposure time beyond 5 min did not result in any substantial increase in VOC recovery. Additionally, a saturated CWR/PDMS Arrow was found not to require a lengthy desorption time in the inlet for maximum desorption (Figure 1c). Sufficient desorption occurred between 40–60 s; however, as the manufacturer recommended a 3 min desorption to ensure conditioning of the Arrow prior to next use, a 3 min desorption was chosen. Carryover testing also confirmed effective conditioning of the fiber prior to next usage. A chromatogram displaying the results of the final SPME Arrow parameters is displayed in Figure 2.
The comparison of CWR/PDMS Arrows to the CWR/PDMS traditional SPME fibers is displayed in Figure 3. In this case, the same method (5 min exposure time, 3 min desorption time) was used. For all compounds except for benzene, naphthalene, and >C13 alkanes, the SPME Arrow provided significant increase in recovery (p < 0.05 for Student’s t-test). Often, the SPME Arrow recovered more than double the total peak area detected with the traditional SPME fiber. This demonstrates the higher capacity of sorbent present on the SPME Arrow fibers, specifically for the range of compounds expected in biological matrices.
In addition, it was originally hypothesized that larger recovered peak areas may result in a difference in the reproducibility of the SPME Arrows compared to the traditional SPME fibers. However, the standard deviation of peak areas appeared to be comparable for the two fiber types (Figure 3). The % RSD on the peak area of each compound was found to be, on average, less than 5.8% for intraday variation (n = 3 replicates measured on three individual days). Naphthalene, 1,2-3-trimethylbenzene, and the n-alkanes larger than C12 were the only compounds that exhibited intraday variation greater than 10%. Naphthalene exhibited the highest intraday variation with a % RSD of 24.5% on the first of three days of analysis. The lowest intraday variation was for nonane with a% RSD of 0.6% on the first of three days of analysis. The interday variation was slightly higher for each compound than intraday variation. The average of the interday % RSD for all compounds was 9.2%. With the exception of naphthalene and the n-alkanes higher than C12, the interday variation was always less than 15% RSD. The naphthalene and higher n-alkane data being higher in variation could possibly be attributed to the fact that these compounds had inherently low recoveries on the CWR/PDMS fiber; therefore, variation in the peak area represented a larger proportion of error compared to the average. The tabulated % RSD for intraday and interday variation by each compound can be found in Supplementary Material, Table S1.
In this study, some compounds on the wide end of the volatility range were not recovered in significantly higher quantities when comparing SPME Arrow with traditional SPME. Benzene and naphthalene were two compounds that were expected to be recovered in higher quantity by SPME Arrow that were not. A previous study comparing some similar volatiles demonstrated a 2.5 fold increase for benzene and 32 fold increase for naphthalene when comparing SPME Arrow to traditional SPME fibers [18]. However, this previous study compared the two types of fibers for the PDMS sorbent [18] and not for the CWR/PDMS fiber used in the study herein. The PDMS Arrow used in the previous study also had a fiber phase volume of 10.2 µL [18], whereas the current commercial version of the CWR/PDMS Arrow has a phase volume of 3.8 µL. This is in contrast to the traditional SPME fiber phase volume of 0.6 µL used in both studies. The differences in phase coating and phase volume likely contributing to the inconsistency in results compared to the previous report. However, it is important to stress that the responses recovered for these two compounds were still sufficient for detection and quantification, and therefore, this does not represent a significant challenge.

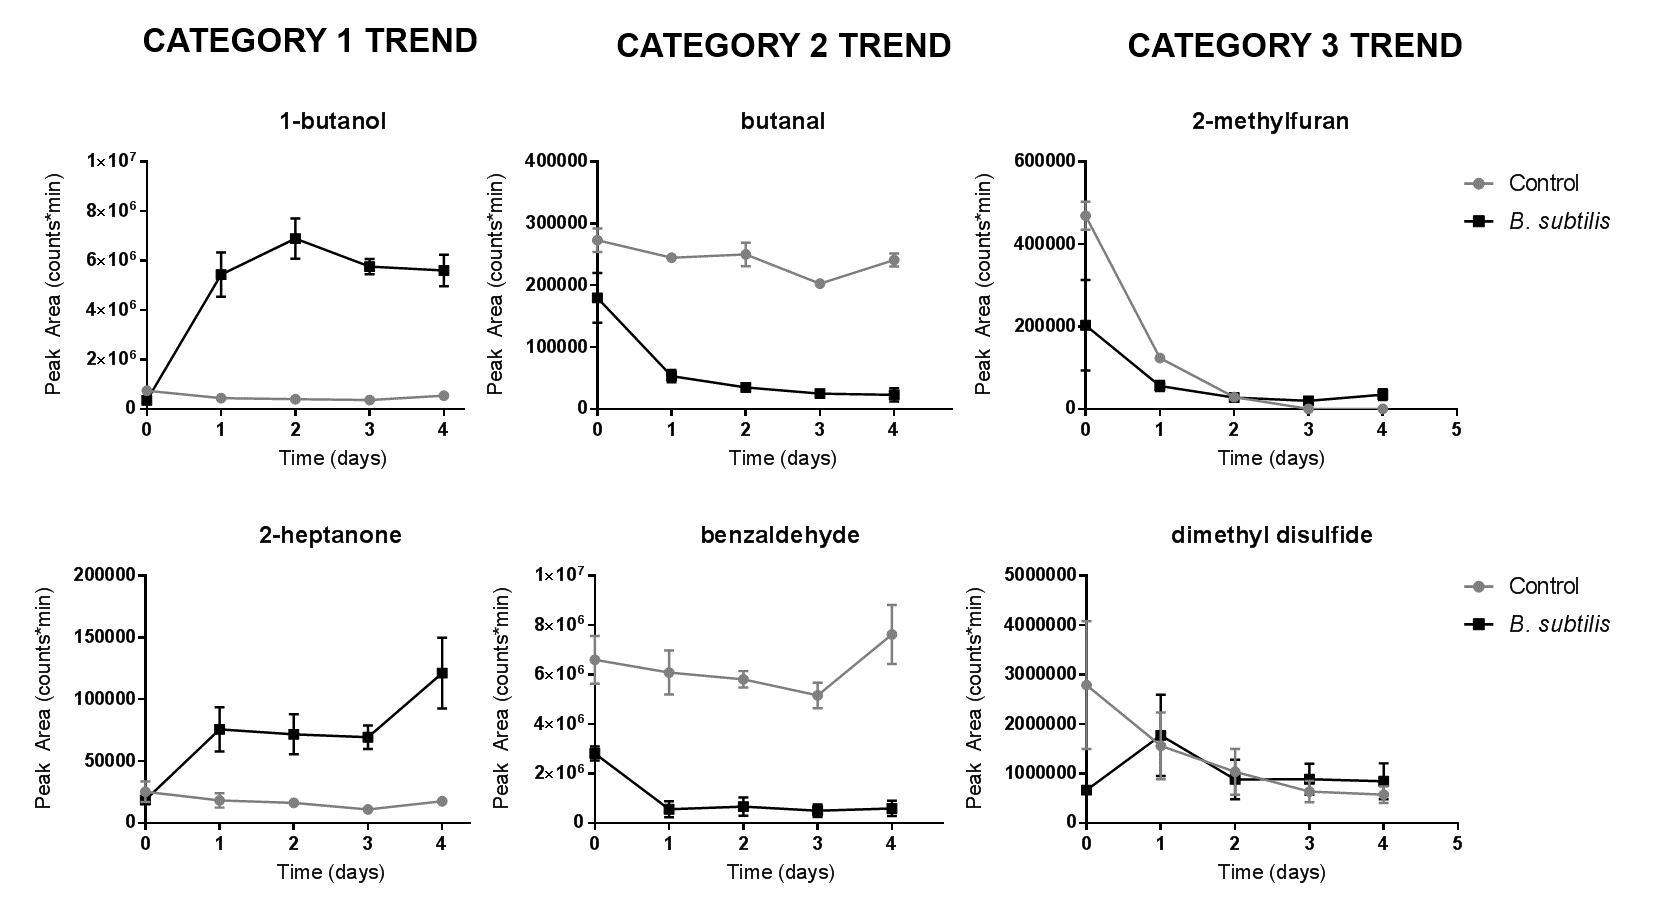
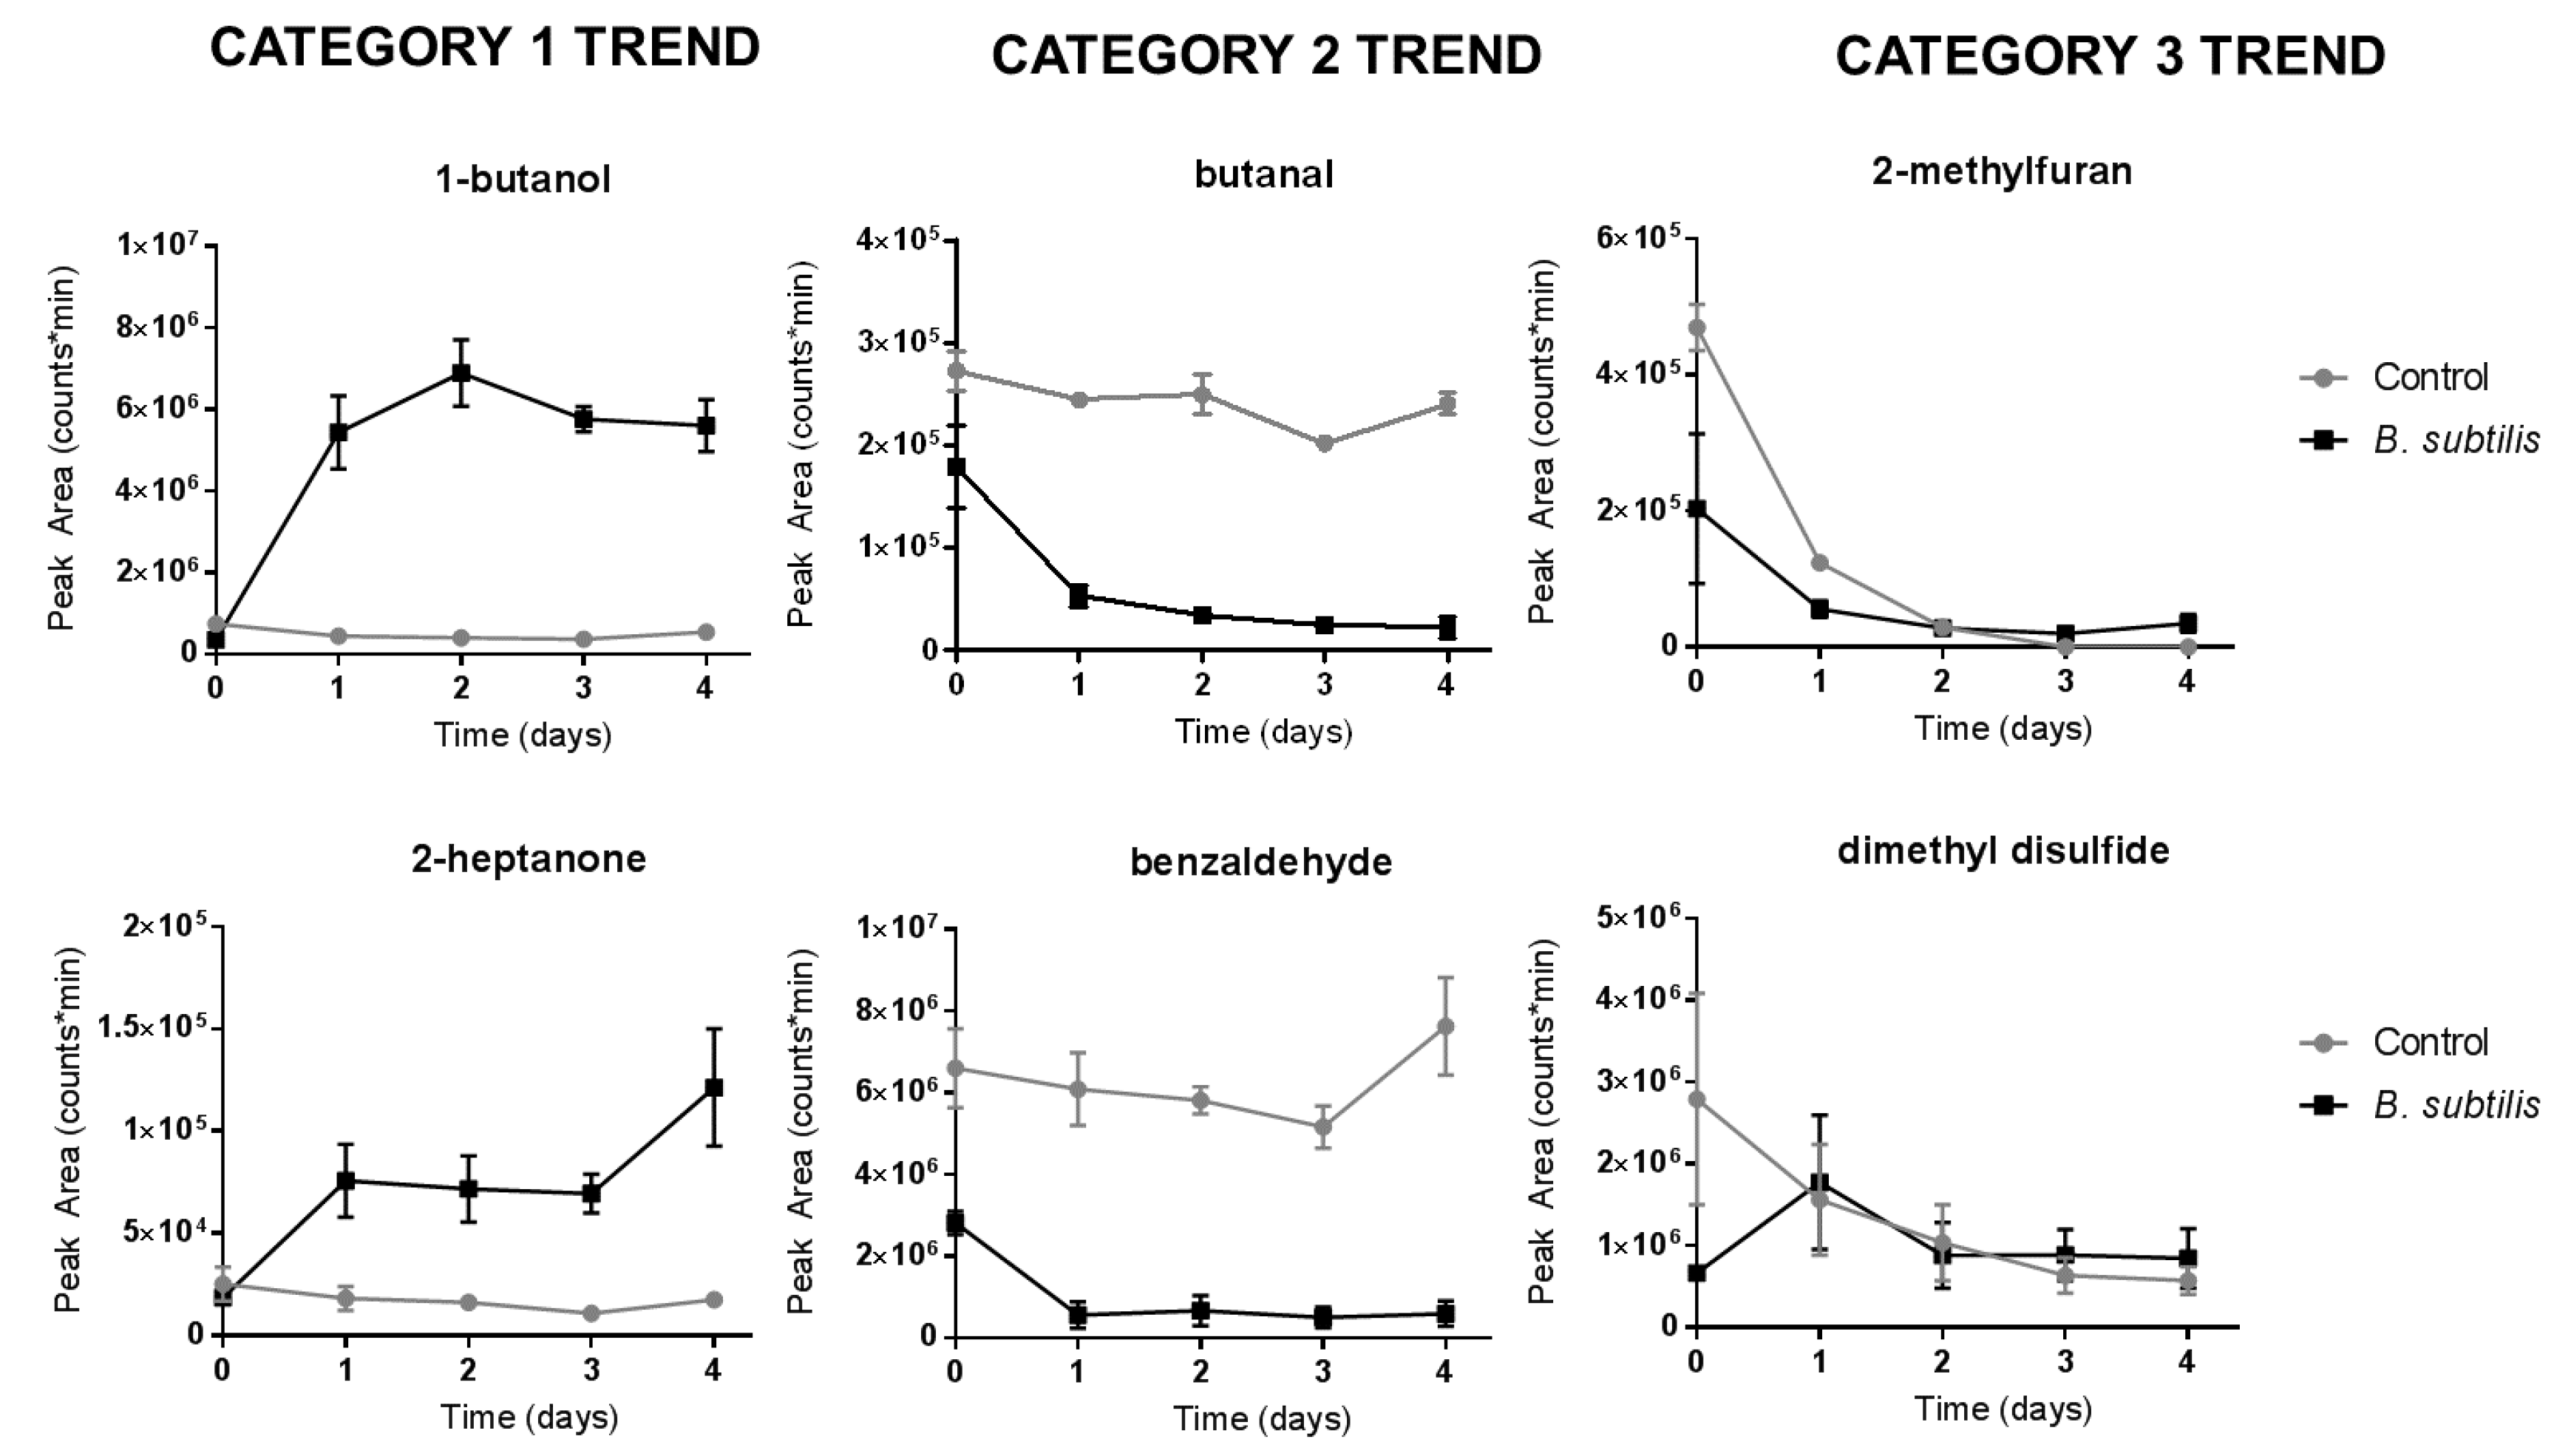
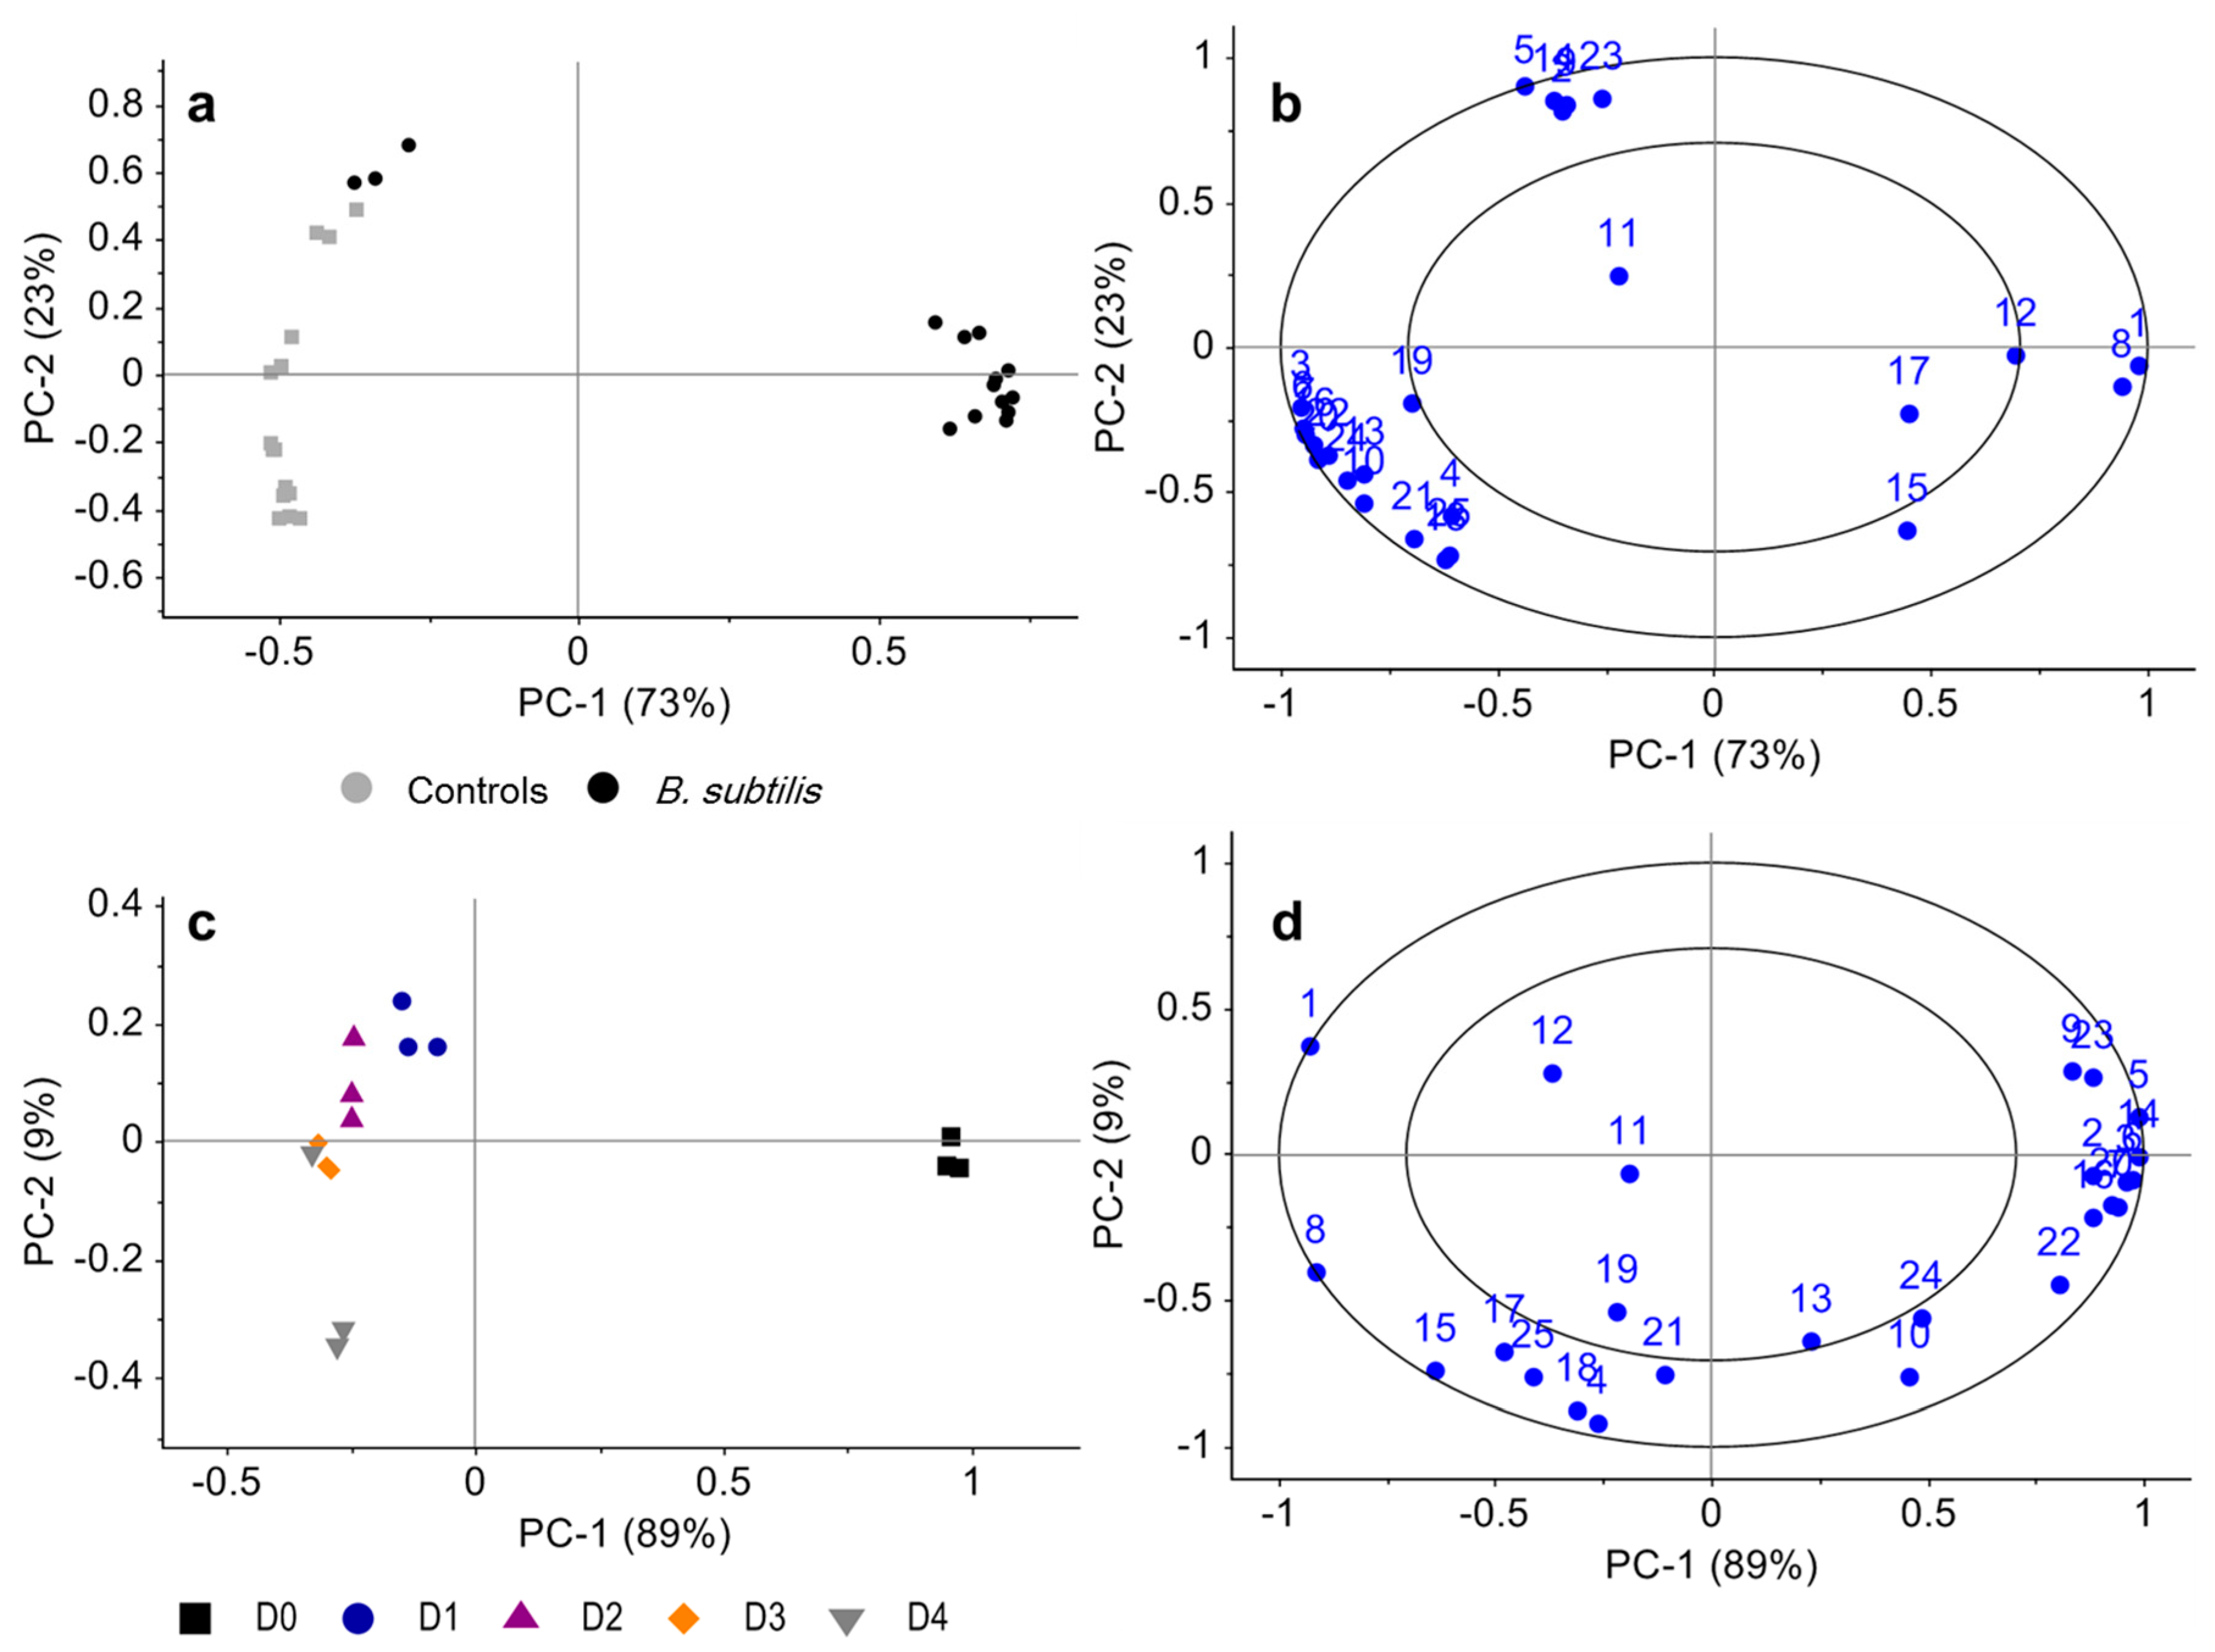
3.2. Bacillus subtilis Profiling

The application of this method to the profiling of B. subtilis can provide valuable information about the volatiles produced throughout its growth cycle. Table 1 depicts the compounds that were detected using the above optimized method. Originally, it was hypothesized that the blank agar samples would produce low level VOCs that would remain stable over time. It was also expected that the bacteria would produce additional VOCs that would surpass levels in the uninoculated samples or not be detected in the uninoculated samples. However, this only represented a single category of compound production and compounds were classified into one of three categories as depicted in Figure 4. The initial category was referred to as Category 1 (“produced VOCs”) and represents the situation where a VOC was not produced, or was produced at lower levels by comparison, in the uninoculated controls and at higher abundance by the bacteria. In Category 2 VOCs (“consumed VOCs”), the level of the compound was higher in the uninoculated controls and found at a lower concentration in the bacterial samples. Finally, Category 3 VOCs (“equilibrated VOCs”) appeared to be those which were either higher or lower in the bacterial samples initially, but eventually equilibrated with the level of the VOC in the uninoculated controls with time. Note that for Category 3 compounds, no significant difference between the two data series was found for any of these VOCs. For all Category 1 (‘produced’) and Category 2 (‘consumed’) compounds, a significant difference between the time series for controls and bacterial samples was detected (Table 1). The only exception to this was for 3-methyl-2-pentanone (Category 1), likely due to the minimal difference observed between the controls on days 0 and 1 impacting the overall statistical difference in the time series. However, the difference in 3-methyl-2-pentanone production by the bacteria in comparison to the controls did appear to be substantial on the later days monitored (days 2–4). The peak for 3-methyl-2-pentanone also eluted at a very similar retention time to the toluene peak. Though different quant ions were used in integration for these two compounds, an improved chromatographic separation in this region may also reveal a more significant trend in 3-methyl-2-pentanone.
When monitoring trends in VOC profile, several analytical priorities exist. First, it is important to use a sampling method that allows a wide range of compounds to be recovered with high efficiency. In this study, this was achieved by implementing the SPME Arrow technique and choosing a fiber type that targeted a wide range of volatiles that were specifically of interest and known to be produced by bacterial metabolism. Second, it is important that the reproducibility of a higher capacity sampling technique remains high priority. In this study, the magnitude of difference in certain VOCs over time and in comparison to blank agar was often very minimal. However, these minimal differences could be relevant quantities to life science applications and therefore, without high precision in the sampling technique, it may not be possible to detect subtle yet important differences in VOC amount. In this study, the reproducibility of SPME Arrow was verified to be adequate for usage in microbiological sampling. Finally, optimal and precise recovery is needed for a quantitative approach to VOC production in order to compare absolute concentrations of VOCs across studies. While absolute quantification was not performed in this study, the analytical parameters established for the SPME Arrow and GC–MS approach indicate that absolute quantification of VOCs is possible and a priority for future research studies. This has recently been highlighted as being critical for advancement of life sciences applications such as monitoring of breath VOCs for medical diagnostics [44]. However, the sentiments in this call for action can also be extended to other areas of importance such as the monitoring of VOCs from decomposing remains for forensic search and recovery [45]. In these application areas, microbial communities play a significant role in VOC production and, therefore, linkage of VOC trends through robust quantification is an important consideration for future advancement in these fields.
This preliminary study on B. subtilis identified 25 compounds in the course of the trial. Some of these compounds exhibited significant trends over time, while some did not differ significantly from levels in the uninoculated controls. It is important to note that this was a preliminary investigation using a new sampling technique, and that changing the conditions used in this study will likely impact the identified VOCs. For example, if more advanced separation technology was used, such as comprehensive two-dimensional gas chromatography–mass spectrometry (GC×GC–MS), it is possible that further deconvolution of low-level co-eluting peaks may uncover additional compounds or allow more robust compound identifications. One particular example of this was the lack of a significant difference over time being detected for the compound 3-methyl-2-pentanone, despite the substantial increase in amount of this compound on days 2–4 of B. subtilis monitoring. Since this particular compound has a very close retention time to toluene, but a very different chemical structure, a two-dimensional separation would benefit the chromatographic separation of these peaks and potentially improve detection of a significant trend. In addition, other experimental parameters may also contribute to the specificity of detected compounds. In this study, bacteria were cultured on standard nutrient agar; however, the use of different growth media (e.g., tryptic soy agar, blood agar), would have provided the bacteria with different sources of nutrients for their metabolism, likely impacting detected VOCs. Future studies will be aimed at identifying the variation in VOC profile with different growth media. Despite these parameters that could change the resulting VOC profile detected, this study provides preliminary data on SPME Arrow sampling dynamics from microbiological sources which will provide a foundation for future studies.
Considering the multivariate nature of the data obtained from these 25 compounds of interest, visualizing the changes in the overall VOC profile of B. subtilis over time was desired. PCA was conducted in order to observe these multivariate trends (Figure 5). Overall, the bacterial samples on Day 0 (immediately after culturing) appeared to produce a VOC profile very similar to the control samples on Day 0. The blank agar samples shifted in VOC profile over time; however, the trend for bacterial samples was distinctly different from the shift in VOC profile of controls (Figure 5a). The compounds largely responsible for differentiating the B. subtilis samples from the controls in the direction towards the right were the Category 1 compounds (i.e., those VOCs produced in high abundance in the bacteria samples and low abundance in the controls). After removing the controls from the analysis and investigating the longitudinal trends of B. subtilis, these Category 1 compounds were responsible for distinguishing the difference between Day 0 and the following days of monitoring; however, the remaining Category 2 and Category 3 compounds appeared to also be important in distinguishing the temporal differences between days 1–4. A number of Category 2 compounds appeared on the far right side of the loadings plot (Figure 5d), as these were the compounds which were consumed in the bacteria samples and present at lower abundance in comparison to the blanks, resulting in the appearance of the PCA scores for later time points on the left side of the scores plot (Figure 5c). Some Category 2 compounds also appeared in the lower left quadrant of the loadings plot (Figure 5d) indicating that they were important markers of the longitudinal progression in VOC profile of B. subtilis. Though not performed in this study, future monitoring of bacterial growth phase, microscopically or through spectrophotometric analysis, may also assist in better understanding these longitudinal trends.

4. Conclusions

SPME is a sorbent-based VOC collection technique that has gained widespread popularity across many life science applications due to its ability to focus and enrich the sample using minimal specialized equipment. SPME Arrow offers these same advantages, yet with an increase in sorbent phase volume and alterations to the SPME fiber design that have the ability to increase its mechanical robustness. As such, many life scientists may desire more information about the resulting effects of advancing to an SPME Arrow approach in the future.
This study provides foundational data on the sampling dynamics of commercially-available SPME Arrow in biological applications. The CWR/PDMS fiber was found to be a suitable fiber type for the expected range of volatiles. A sampling extraction time was optimized at 5 min (room temperature) with a 3 min inlet desorption time. Carryover of VOCs was not observed using the optimized method. A significant increase in recovery was observed for most analytes using the CWR/PDMS SPME Arrow. For some compounds where a significant increase was not observed (e.g., benzene, naphthalene), recovery was found to be comparable to the traditional SPME fiber and remained above sufficient levels for analysis. The optimized method produced intraday repeatability values of peak area less than 10% and interday repeatability values of peak area less than 15%, indicating sufficient precision for monitoring longitudinal trends in biological applications.
Finally, the optimized SPME Arrow method was applied to B. subtilis cultures and monitored over a five-day period. A total of 25 VOCs were identified across three longitudinal trend categories. In the ‘produced VOCs’ category, compounds were detected higher in abundance in the bacterial samples than in the control samples over time. In the ‘consumed VOCs’ category, compounds were detected in lower abundance in the bacterial samples than in the control samples over time. In the ‘equilibrated VOCs’ category, compounds were either higher or lower in the bacterial samples initially, and eventually equilibrated with levels in the control samples. Compounds in the ‘produced VOCs’ and ‘consumed VOCs’ categories generally represented compounds that exhibited a significant difference between the two types of samples, while ‘equilibrated VOCs’ did not. The SPME Arrow method allowed for a sensitive, selective, and repeatable VOC sampling methodology to be used on bacterial samples, which is imperative to future quantitative approaches using SPME Arrow for microbiological VOC monitoring.

Supplementary Materials

The following are available online at https://www.mdpi.com/2297-8739/5/3/45/s1, Figure S1: Category 1 compounds (‘produced VOCs’) detected from the headspace of B. subtilis samples incubated at 24 °C and monitored over a five day period using the optimized SPME Arrow method, Figure S2: Category 2 compounds (‘consumed VOCs’) detected from the headspace of B. subtilis samples incubated at 24 °C and monitored over a five day period using the optimized SPME Arrow method, Figure S3: Category 3 compounds (‘equilibrated VOCs’) detected from the headspace of B. subtilis samples incubated at 24 °C and monitored over a five day period using the optimized SPME Arrow method, Table S1: Tabulated average peak area, standard deviation (s), and % relative standard deviation (% RSD) for intraday and interday repeatability for reference volatile organic compounds using the optimized SPME Arrow method.

Author Contributions

Conceptualization, K.E.E., D.O.C., and K.A.P.; Data curation, K.E.E., D.O.C., and K.A.P.; Formal analysis, K.E.E., D.O.C., and K.A.P.; Funding acquisition, K.A.P.; Methodology, D.O.C.; Project administration, K.A.P.; Resources, D.O.C.; Supervision, K.A.P.; Writing—original draft, K.E.E. and K.A.P.; Writing—review & editing, K.E.E., D.O.C., and K.A.P.

Funding

This research was funded by the Air Force Research Laboratory grant number CHAM 13-S7700-01-C2, and the Restek Academic Support Program.

Acknowledgments

The authors would like to acknowledge support from the Air Force Minority Leader’s Research Competitiveness Program and Restek Corporation’s Academic Support Program. The authors would like to recognize the late Carl Sung for his dedication to this research program during its early conception. Hilary Corcoran is acknowledged for her laboratory support. Additional acknowledgements to Hyo Park for his support in assisting with the volatiles reference mix list. Merlin Instrument Company also donated 1.1 mm SPME Arrow microseals for sample injection in this study.

Conflicts of Interest

Restek Corporation donated the chemical standards used in this study through the Restek Academic Support Program. Restek Corporation had no role in the design of the study; in the collection, analysis, or interpretation of data; in the writing of the manuscript; or in the decision to publish the results.

References

  1. Tranchida, P.Q.; Dugo, P.; Dugo, G.; Mondello, L. Comprehensive two-dimensional chromatography in food analysis. J. Chromatogr. A 2004, 1054, 3–16. [Google Scholar] [CrossRef]
  2. Tranchida, P.Q.; Donato, P.; Cacciola, F.; Beccaria, M.; Dugo, P.; Mondello, L. Potential of comprehensive chromatography in food analysis. Trends Anal. Chem. 2013, 52, 186–205. [Google Scholar] [CrossRef]
  3. Serrano, A.; Gallego, M. Sorption study of 25 volatile organic compounds in several Mediterranean soils using headspace-gas chromatography–mass spectrometry. J. Chromatogr. A 2006, 1118, 261–270. [Google Scholar] [CrossRef] [PubMed]
  4. Hewitt, A.D. Comparison of sample preparation methods for the analysis of volatile organic compounds in soil samples: Solvent extraction vs. vapor partitioning. Environ. Sci. Technol. 1998, 32, 143–149. [Google Scholar] [CrossRef]
  5. Kurán, P.; Sojak, L. Environmental analysis of volatile organic compounds in water and sediment by gas chromatography. J. Chromatogr. A 1996, 733, 119–141. [Google Scholar] [CrossRef]
  6. Voice, T.C.; Kolb, B. Static and dynamic headspace analysis of volatile organic compounds in soils. Environ. Sci. Technol. 1993, 27, 709–713. [Google Scholar] [CrossRef]
  7. Kleeberg, K.K.; Liu, Y.; Jans, M.; Schlegelmilch, M.; Streese, J.; Stegmann, R. Development of a simple and sensitive method for the characterization of odorous waste gas emissions by means of solid-phase microextraction (SPME) and GC–MS/olfactometry. Waste Manag. 2005, 25, 872–879. [Google Scholar] [CrossRef] [PubMed]
  8. Tholl, D.; Boland, W.; Hansel, A.; Loreto, F.; Röse, U.S.R.; Schnitzler, J.-P. Practical approaches to plant volatile analysis. Plant J. 2006, 45, 540–560. [Google Scholar] [CrossRef] [PubMed] [Green Version]
  9. Heath, R.R.; Manukian, A. An automated system for use in collecting volatile chemicals released from plants. J. Chem. Ecol. 1994, 20, 593–608. [Google Scholar] [CrossRef] [PubMed]
  10. Iqbal, M.A.; Nizio, K.D.; Ueland, M.; Forbes, S.L. Forensic decomposition odour profiling: A review of experimental designs and analytical techniques. Trends Anal. Chem. 2017, 91, 112–124. [Google Scholar] [CrossRef]
  11. Verheggen, F.; Perrault, K.A.; Caparros Megido, R.; Dubois, L.M.; Francis, F.; Haubruge, E.; Forbes, S.L.; Focant, J.-F.; Stefanuto, P.-H. The odour of death: An overview of current knowledge on characterization and applications. Bioscience 2017, 67, 600–613. [Google Scholar] [CrossRef]
  12. Cao, W.; Duan, Y. Breath analysis: Potential for clinical diagnosis and exposure assessment. Clin. Chem. 2006, 52, 800–811. [Google Scholar] [CrossRef] [PubMed]
  13. Bijland, L.R.; Bomers, M.K.; Smulders, Y.M. Smelling the diagnosis A review on the use of scent in diagnosing disease. Neth. J. Med. 2013, 71, 300–307. [Google Scholar] [PubMed]
  14. Hamm, S.; Bleton, J.; Connan, J.; Tchapla, A. A chemical investigation by headspace SPME and GC–MS of volatile and semi-volatile terpenes in various olibanum samples. Phytochemistry 2005, 66, 1499–1514. [Google Scholar] [CrossRef] [PubMed]
  15. Cnuts, D.; Perrault, K.A.; Stefanuto, P.-H.; Dubois, L.M.; Focant, J.-F.; Rots, V. Fingerprinting glues using HS-SPME GC×GC-HRTOFMS: A new powerful method allows tracking glues back in time. Archaeometry 2018, 1–16. [Google Scholar] [CrossRef]
  16. Perrault, K.A.; Stefanuto, P.; Dubois, L.; Cnuts, D.; Rots, V.; Focant, J.-F. A new approach for the characterization of organic residues from stone tools using GC×GC-TOFMS. Separations 2016, 3, 1–16. [Google Scholar] [CrossRef]
  17. Jerković, I.; Marijanović, Z.; Gugić, M.; Roje, M. Chemical profile of the organic residue from ancient amphora found in the Adriatic Sea determined by direct GC and GC–MS analysis. Molecules 2011, 16, 7936–7948. [Google Scholar] [CrossRef] [PubMed]
  18. Kremser, A.; Jochmann, M.A.; Schmidt, T.C. Systematic comparison of static and dynamic headspace sampling techniques for gas chromatography. Anal. Bioanal. Chem. 2016, 408, 6567–6579. [Google Scholar] [CrossRef] [PubMed]
  19. Harper, M. Sorbent trapping of volatile organic compounds from air. J. Chromatogr. A 2000, 885, 129–151. [Google Scholar] [CrossRef]
  20. Arthur, C.L.; Pawliszyn, J. Solid phase microextraction with thermal desorption using fused silica optical fibers. Anal. Chem. 1990, 62, 2145–2148. [Google Scholar] [CrossRef]
  21. Zhang, Z.; Pawliszyn, J. Headspace solid-phase microextraction. Anal. Chem. 1993, 65, 1843–1852. [Google Scholar] [CrossRef]
  22. Pawliszyn, J. Theory of solid-phase microextraction. J. Chromatogr. Sci. 2012, 38, 13–59. [Google Scholar] [CrossRef]
  23. Bagheri, H.; Piri-Moghadam, H.; Naderi, M. Towards greater mechanical, thermal and chemical stability in solid-phase microextraction. Trends Anal. Chem. 2012, 34, 126–139. [Google Scholar] [CrossRef]
  24. Spietelun, A.; Kloskowski, A.; Chrzanowski, W.; Namieśnik, J. Understanding solid-phase microextraction: Key factors influencing the extraction process and trends in improving the technique. Chem. Rev. 2013, 113, 1667–1685. [Google Scholar] [CrossRef] [PubMed]
  25. Baltussen, E.; Sandra, P.; David, F.; Cramers, C. Stir bar sorptive extraction (SBSE), a novel extraction technique for aqueous samples: Theory and principles. J. Microcolumn Sep. 1999, 11, 737–747. [Google Scholar] [CrossRef]
  26. Tienpont, B.; David, F.; Bicchi, C.; Sandra, P. High capacity headspace sorptive extraction. J. Microcolumn Sep. 2000, 12, 577–584. [Google Scholar] [CrossRef]
  27. Helin, A.; Rönkkö, T.; Parshintsev, J.; Hartonen, K.; Schilling, B.; Läubli, T.; Riekkola, M.L. Solid phase microextraction arrow for the sampling of volatile amines in wastewater and atmosphere. J. Chromatogr. A 2015, 1426, 56–63. [Google Scholar] [CrossRef] [PubMed]
  28. Kremser, A.; Jochmann, M.A.; Schmidt, T.C. PAL SPME Arrow—Evaluation of a novel solid-phase microextraction device for freely dissolved PAHs in water. Anal. Bioanal. Chem. 2016, 408, 943–952. [Google Scholar] [CrossRef] [PubMed]
  29. Forbes, S.L.; Troobnikoff, A.N.; Ueland, M.; Nizio, K.D.; Perrault, K.A. Profiling the decomposition odour at the grave surface before and after probing. Forensic Sci. Int. 2016, 259, 193–199. [Google Scholar] [CrossRef] [PubMed]
  30. Armstrong, P.; Nizio, K.D.; Perrault, K.A.; Forbes, S.L. Establishing the volatile profile of pig carcasses as analogues for human decomposition during the early postmortem period. Heliyon 2016, 2, e00070. [Google Scholar] [CrossRef] [PubMed]
  31. Perrault, K.A.; Stefanuto, P.-H.; Stuart, B.H.; Rai, T.; Focant, J.-F.; Forbes, S.L. Detection of decomposition volatile organic compounds in soil following removal of remains from a surface deposition site. Forensic Sci. Med. Pathol. 2015, 11, 376–387. [Google Scholar] [CrossRef] [PubMed]
  32. Carter, D.O.; Tomberlin, J.K.; Benbow, M.E.; Metcalf, J.L. (Eds.) Forensic Microbiology, 1st ed.; John Wiley & Sons Ltd.: Chichester, UK, 2017; ISBN 978-1-119-06255-4. [Google Scholar]
  33. Bean, H.D.; Dimandja, J.-M.D.; Hill, J.E. Bacterial volatile discovery using solid phase microextraction and comprehensive two-dimensional gas chromatography–time-of-flight mass spectrometry. J. Chromatogr. B 2012, 901, 41–46. [Google Scholar] [CrossRef] [PubMed] [Green Version]
  34. Bean, H.D.; Rees, C.A.; Hill, J.E. Comparative analysis of the volatile metabolomes of Pseudomonas aeruginosa clinical isolates. J. Breath Res. 2016, 10, 47102. [Google Scholar] [CrossRef] [PubMed]
  35. Nizio, K.D.; Perrault, K.A.; Troobnikoff, A.N.; Ueland, M.; Shoma, S.; Iredell, J.R.; Middleton, P.G.; Forbes, S.L. In vitro volatile organic compound profiling using GC×GC-TOFMS to differentiate bacteria associated with lung infections: A proof-of-concept study. J. Breath Res. 2016, 10, 26008. [Google Scholar] [CrossRef] [PubMed]
  36. Filipiak, W.; Sponring, A.; Filipiak, A.; Ager, C.; Schubert, J.; Miekisch, W.; Amann, A.; Troppmair, J. TD-GC–MS analysis of volatile metabolites of human lung cancer and normal cells in vitro. Cancer Epidemiol. Biomark. Prev. 2010, 19, 182–195. [Google Scholar] [CrossRef] [PubMed]
  37. Perrault, K.A.; Nizio, K.D.; Forbes, S.L. A comparison of one-dimensional and comprehensive two-dimensional gas chromatography for decomposition odour profiling using inter-year replicate field trials. Chromatographia 2015, 78, 1057–1070. [Google Scholar] [CrossRef]
  38. Logan, N.A.; De Vos, P. Genus I: Bacillus. In Bergey’s Manual of Systematic Bacteriology; De Vos, P., Garrity, G.M., Jones, D., Krieg, N.R., Ludwig, W., Rainey, F.A., Schleifer, K.-H., Whitman, W.B., Eds.; Springer: New York, NY, USA, 2019; pp. 21–128. [Google Scholar]
  39. Dyer, B.D. A Field Guide to Bacteria; Cornell University Press: Ithaca, NY, USA, 2003. [Google Scholar]
  40. Chun, L.P.; Miguel, M.J.; Junkins, E.N.; Forbes, S.L.; Carter, D.O. An initial investigation into the ecology of culturable aerobic postmortem bacteria. Sci. Justice 2015, 55, 394–401. [Google Scholar] [CrossRef] [PubMed]
  41. Carter, D.O.; Yellowlees, D.; Tibbett, M. Cadaver decomposition in terrestrial ecosystems. Naturwissenschaften 2007, 94, 12–24. [Google Scholar] [CrossRef] [PubMed]
  42. Logan, N.A. Bacillus species of medical and veterinary importance. J. Med. Microbiol. 1988, 25, 157–165. [Google Scholar] [CrossRef] [PubMed] [Green Version]
  43. Barreira, L.M.F.; Parshintsev, J.; Kärkkäinen, N.; Hartonen, K.; Jussila, M.; Kajos, M.; Kulmala, M.; Riekkola, M.L. Field measurements of biogenic volatile organic compounds in the atmosphere by dynamic solid-phase microextraction and portable gas chromatography-mass spectrometry. Atmos. Environ. 2015, 115, 214–222. [Google Scholar] [CrossRef]
  44. Smith, D.; Španěl, P. On the importance of accurate quantification of individual volatile metabolites in exhaled breath. J. Breath Res. 2017, 11, 4. [Google Scholar] [CrossRef] [PubMed]
  45. Stefanuto, P.-H.; Perrault, K.A.; Lloyd, R.M.; Stuart, B.H.; Rai, T.; Forbes, S.L.; Focant, J.-F. Exploring new dimensions in cadaveric decomposition odour analysis. Anal. Methods 2015, 7, 2287–2294. [Google Scholar] [CrossRef] [Green Version]
Figure 1. (a) Arrow fiber performance based on total summed peak area of all compounds in the volatiles reference mix (VRM) 1 and the commercial saturated alkanes mix (SAMC). (b) Total peak area measured for carbon wide range (CWR)/polydimethylsiloxane (PDMS) Arrow at different exposure times to VRM 2 and SAM 2. (c) Total peak area measured for CWR/PDMS Arrow at 5 min exposure time and varied desorption times after saturation in VRM 1 and SAM 1.
Separations 05 00045 g001
Figure 2. Total ion current chromatogram of the volatiles reference mix (VRM) 1 and the saturated alkanes mix (SAM) 1 using carbon wide range (CWR)/polydimethylsiloxane (PDMS) solid-phase microextraction (SPME) Arrow.
Separations 05 00045 g002
Figure 3. Comparison data for the carbon wide range (CWR)/polydimethylsiloxane (PDMS) fiber using the volatiles reference mix (VRM) 3 and the saturated alkanes mix (SAM) 3. Error bars represent standard deviation based on n = 3 samples. Fibers in both categories were exposed at room temperature for 5 min and analyzed using the same GC–MS method. Statistical significance (*) was determined using the multiple t-test option, correcting for multiple comparisons using the Holm–Sidak method with α = 0.05. Each compound was analyzed individually, without assuming a consistent standard deviation.
Separations 05 00045 g003
Figure 4. Example volatile organic compounds (VOCs) detected from Bacillus subtilis in each of the three categories of compound production. Category 1 compounds (‘produced VOCs’) were higher in bacterial samples than in control samples. Category 2 compounds (‘consumed VOCs’) were higher in control samples than in bacterial samples. Category 3 compounds (‘equilibrated VOCs’) in bacterial samples eventually equilibrated with control samples early in the longitudinal data and did not exhibit a significant difference to the controls over time. Compound trends for all 25 compounds of interest are shown in the Supplementary Material, Figures S1–S3.
Separations 05 00045 g004
Figure 5. Principal component analysis (PCA) scores plots (left) and loadings plots (right) for data obtained from SPME Arrow profiling of Bacillus subtilis samples. For all control and bacterial samples, the PCA scores (a) and loadings (b) are shown on the top. For the bacterial samples with controls removed, the PCA scores (c) and loadings (d) are shown on the bottom. Number labels on both loadings plots correspond to compound identities listed in Table 1.
Separations 05 00045 g005
Table 1. Compounds of interest identified from solid-phase microextraction (SPME) Arrow sampling of Bacillus subtilis over a five-day period. Compound labels refer to labels in Figure 4 and Figure 5. The number of samples used to calculate retention time and retention index for each compound is listed for each value. The longitudinal data for each compound of interest was tested for significance (*) when comparing the level of the compound in the uninoculated control to the bacterial sample over five days. Significance was tested using an unpaired two-tailed Student’s t-test with α = 0.05.
LabelCompoundCASRetention Time (min)Retention IndexTrend Category
11,3-pentadiene504-60-93.282 ± 0.015 (n = 6)591.2 ± 0.2 (n = 6)1 *
22-methylfuran534-22-56.049 ± 0.017 (n = 9)639.5 ± 0.3 (n = 9)3
3butanal123-72-86.452 ± 0.016 (n = 12)647.0 ± 0.3 (n = 12)2 *
42-butanone78-93-36.774 ± 0.027 (n = 14)653.0 ± 0.5 (n = 14)2 *
5trichloromethane67-66-37.495 ± 0.008 (n = 27)666.7 ± 0.2 (n = 27)3
63-methylbutanal590-86-38.986 ± 0.005 (n = 18)696.3 ± 0.1 (n = 18)2 *
72-methylbutanal96-17-39.298 ± 0.008 (n = 18)702.6 ± 0.2 (n = 18)2 *
81-butanol71-36-310.052 ± 0.008 (n = 12)718.2 ± 0.2 (n = 12)1 *
9bromodichloromethane75-27-411.294 ± 0.009 (n = 27)744.8 ± 0.2 (n = 27)3
101,3-diazine289-95-212.157 ± 0.007 (n = 27)763.8 ± 0.2 (n = 27)2 *
11dimethyl disulfide624-92-012.387 ± 0.005 (n = 30)769.0 ± 0.1 (n = 30)3
121-methylcyclohexene591-49-112.632 ± 0.002 (n = 7)774.5 ± 0.1 (n = 7)1 *
132-methylbutanenitrile18936-17-912.794 ± 0.004 (n = 10)778.2 ± 0.1 (n = 10)2 *
14toluene108-88-313.105 ± 0.006 (n = 29)785.3 ± 0.1 (n = 29)3
153-methyl-2-pentanone209.282-113.277 ± 0.005 (n = 8)789.2 ± 0.1 (n = 8)1
16furfural98-01-117.408 ± 0.005 (n = 17)890.1 ± 0.1 (n = 17)2 *
172-heptanone110-43-018.913 (n = 1)929.5 (n = 1)1 *
182,5-dimethylpyrazine123-32-019.281 ± 0.003 (n = 30)939.4 ± 0.1 (n = 30)2 *
19methoxy-phenyl-oxime 21.691 ± 0.006 (n = 6)1006.3 ± 0.2 (n = 6)2 *
20benzaldehyde100-52-722.087 ± 0.003 (n = 18)1017.6 ± 0.1 (n = 18)2 *
212-ethyl-5-methylpyrazine13360-64-022.535 ± 0.004 (n = 25)1030.6 ± 0.1 (n = 25)2 *
22limonene 22.969 ± 0.004 (n = 15)1043.3 ± 0.1 (n = 15)2 *
23dodecane112-40-328.078 ± 0.003 (n = 29)1201.7 ± 0.1 (n = 29)3
24decanal112-31-229.572 ± 0.003 (n = 15)1251.2 ± 0.1 (n = 15)2 *
25butylated hydroxytoluene128-37-037.804 ± 0.004 (n = 12)1550.2 ± 0.2 (n = 12)2 *

