Article

Advances and Pitfalls in the Capillary Electrophoresis Analysis of Aggregates of Beta Amyloid Peptides

1
BioRaNTeam, Lyon Neuroscience Research Center, INSERM U1028; CNRS UMR5292; Université de Lyon, F-69000 Lyon, France
2
NeuroDialytics Unit, Lyon Neuroscience Research Center, INSERM U1028; CNRS UMR5292; Université de Lyon, F-69000 Lyon, France
*
Author to whom correspondence should be addressed.
Separations 2018, 5(1), 2; https://doi.org/10.3390/separations5010002
Submission received: 20 October 2017 / Revised: 1 December 2017 / Accepted: 14 December 2017 / Published: 22 December 2017
(This article belongs to the Special Issue Analytical Tools to Study Biomarkers)

Abstract

:
Alzheimer’s disease is characterized by the accumulation of brain amyloid plaques composed of aggregates of amyloid β (Aβ) peptides. The present paper describes a novel and easy-to-run capillary electrophoresis with laser-induced fluorescence detection (CE-LIF) method for the specific analysis of fibrillar forms of Aβ aggregates obtained after in vitro incubation of Aβ 1-40 monomer. For that purpose, an affinity CE-LIF approach in which the ligand thioflavine T was added to the running buffer has been used, leading to the separation and detection of various fibrillar aggregates which migrated as spikes. The procedure has been optimized to get spikes only corresponding to Aβ aggregates, through the careful elimination of interfering factors and the electrophoretic validation of the link between spikes and particulate material. This method exhibited semi-quantification capabilities, led to the separation of Aβ fibrillar aggregates of different sizes and showed that highly concentrated solutions of Aβ peptides led to the formation of aggregates of larger size than lower-concentrated solution did. Advances brought by this method as well as future development needed to overcome its present limitations are discussed.

1. Introduction

The neurodegenerative Alzheimer’s disease (AD) is characterized by the accumulation of brain amyloid plaques that are mainly composed of fibrillar aggregates of the amyloid β peptides 1-40 and 1-42 (Aβ 1-40 and Aβ 1-42) [1]. The pathway leading to the formation of amyloid fibrils from the monomer forms of Aβ 1-40 and Aβ 1-42 starts by the formation of small oligomers of Aβ peptides, leading to larger oligomers, then to protofibrils and finally to fibrils [2,3,4]. The involvement of amyloid plaques in the pathophysiological process of AD makes these various forms of Aβ peptides potential biomarkers for AD.
Among these forms, the small soluble neurotoxic Aβ oligomers [5] could be candidate biomarkers for AD, especially for the early stage of the disease when plaques start to build up well before the apparition of any cognitive symptoms. Nevertheless, one must be aware of the limitation of their determination in biological samples, since there are metastable and transient species. In contrast, more stable fibrillar Aβ aggregates, which are strongly linked to neurodegeneration [6,7], could be a more reliable biomarker to AD. The presence of brain fibrillar Aβ could be indirectly assessed through the determination of the Aβ monomers. Indeed, immunoassays have revealed a lowering in the concentrations of monomers of Aβ 1-40 and Aβ 1-42 in the cerebrospinal fluid (CSF) of AD patients, a result that was interpreted as reflecting a sequestration of such peptides in the plaques, leading to their reduced leakage from brain to CSF [8,9,10,11].
However, the main drawback of such an approach is that one has to determine a decrease in the concentration of peptide and not an increase above a near-zero level. To obtain specificity in the method, several Aβ peptides must be analyzed and their relative ratio must be determined before obtaining a clear picture of Aβ alteration [10,12,13]. The limitations of these approaches, focused on Aβ monomers quantification, led to the need to determine fibrils themselves. For that purpose, several methods are available, as the thioflavine T assay, in which an increase in fluorescence is measured when this dye binds to the β-sheet structure of Aβ fibrils [14]. Although sensitive, that assay does not discriminate between the various forms of aggregates or fibrils. Besides this classical biochemical assay, the imaging approaches, as illustrated by transmission electron microscopy or atomic force microscopy, allow fine differentiation of the various morphological forms of Aβ fibrils [15], but are neither quantitative nor suitable for routine use or handling a large number of samples.
The capillary electrophoresis (CE) may unlock these drawbacks, as its high resolving power has been shown to allow the separation of various forms of Aβ peptides, i.e., monomers or aggregates obtained following in vitro incubation. CE with UV detection was employed for the analysis of several Aβ monomers [16,17], for the separation of monomers and transient soluble oligomers of Aβ 1-40 or 1-42 using neutral saline background electrolyte [18,19,20,21] or a polymeric separation matrix [22]. Moreover, CE-UV allowed the separation of monomers, large aggregates (migrating as wide peak) and fibrils (migrating as sharp peaks or spikes) [23]. In order to improve sensitivity and selectivity, CE-LIF was also employed for the analysis of fibrils of Aβ. For that purpose, an affinity CE-LIF approach was used, in which the ligand thioflavine T was added to the running buffer. In a first study, using a pH 9.5 running buffer, Kato et al. [24] reported, the detection of a single spike in a sample of Aβ 1-42 was incubated for periods up to 6 days. In a second study [25], using a neutral (pH 7.79) buffer, CE was coupled to laser-induced fluorescence anisotropy (LIFA) detection for the separation, of spikes obtained after incubation of Aβ 1-40 or 1-42 for periods up to 7 days.
However, as the aim of these previous CE-UV and CE-LIF studies was the monitoring of the early steps of Aβ aggregation and the screening of aggregation inhibitors; they were mainly qualitative and disregarded several analytical aspects of the fibrils-related spikes, such as the presence of interferences from incubation medium, the influence of running buffer or the quantitative capability of the method.
Therefore, the present study sought to set up a novel and easy-to-run affinity CE-LIF method based on thioflavine T for the specific analysis of fibrillar forms of Aβ aggregates obtained after in vitro incubation of Aβ 1-40 monomer. The procedure was optimized to get spikes only corresponding to Aβ aggregates, through the careful elimination of interfering factors and the electrophoretic validation of the link between spikes and particulate material. This method exhibited semi-quantification capabilities, led to the separation of Aβ aggregates (likely to be fibrils) of different size and showed that highly concentrated solutions of Aβ peptide led to the formation of aggregates of larger size than lower-concentrated solutions did.

2. Materials and Methods

2.1. Chemicals

Aβ 1-40 (human sequence) was from Sigma (Saint-Louis, MI, USA), Roboscreen (Lepzig, Germany) or rPeptides (Bogart, GA, USA). Thioflavin T was from Sigma. Chemicals used for preparing buffers were from Sigma or from Merck (Darmstadt, Germany).

2.2. Samples and Reagents Preparation

Aβ 1-40 powder was dissolved in 0.1% NH4OH to a concentration equal to 200 µM. This solution was dispatched under 20 µL aliquots which were placed in 500 µL polypropylene Eppendorf tubes and further stored at −30 °C. The Ringer solution used for the incubation of Aβ peptides contained 149 mM NaCl, 2.8 mM KCl, 1.2 mM CaCl2, 1.2 mM MgCl2 and 2.78 mM phosphate buffer, pH 7.4.
To prepare the Aβ aggregates, 0.9 µL of 1 M HCl and 380 µL of Ringer solution were added to one tube containing 20 µL of 200 µM Aβ 1-40, giving 400 µL of a 10 µM Aβ 1-40 solution which were dispatched under 20 µL aliquots into 200 µL PCR tubes (Axygen Union City, CA, USA). These tubes were incubated at 37 °C under horizontal agitation in a temperature-controlled oven for periods of time from 1 to 28 days.
The 10 mM thioflavine T solution was prepared in methanol and dispatched under 50 µL aliquots into 200 µL PCR tubes which were stored at −20 °C for period of time up to 4 weeks. On each working day, a novel aliquot of 10 mM thioflavine T was thawed and used for preparing a fresh thioflavine T containing running buffer (final concentration 10–20 µM).
The citrate buffer was prepared by dissolving citric acid in ultra-pure water and adjusting the pH to 3.0 by the addition of 5 M sodium hydroxide; water was then added to get a citric acid concentration equal to 100 mM. This solution was stored at 4 °C. On each working day, an aliquot from this solution was taken out, diluted twice with water and filtered through a 0.2 µm acetate cellulose filter. Thioflavine T was then added to this final 50 mM pH 3.0 sodium citrate running buffer.
The ammonium acetate buffer was made by mixing a 250 mM solution of ammonium acetate and a 250 mM solution of acetic acid to reach a pH equal to 4.7. On each working day, an aliquot from this solution (stored at 4 °C) was taken out, diluted five times with water and filtered through a 0.2 µm acetate cellulose filter. Thioflavine T was then added to this resulting 50 mM pH 4.7 ammonium acetate running buffer.
The borate buffer was prepared by mixing separate solution of 500 mM boric acid and of 125 mM sodium tetraborate until obtaining a pH equal to 8.7. The resulting 500 mM sodium borate buffer was stored at ambient temperature. On each working day, an aliquot was taken out from this solution, diluted ten times with water and filtered through a 0.2 µm acetate cellulose filter. Thioflavine T was then added to this resulting 50 mM pH 8.7 sodium borate running buffer.

2.3. CE-LIF

The electrophoresis system consisted of an automatic P/ACE MDQ system (Beckman-Coulter, Fullerton, CA, USA) equipped with an external LIF detector (ZetaLif, Picometrics, Toulouse, France). The excitation was performed by a Melles Griot (Carlsbad, CA, USA) diode laser at a wavelength of 410 nm; emission wavelength was 490 nm. The separation was carried out with a 50 µm I.D. × 350 µm O.D. fused silica capillary (Composite Metal Services, Worcester, UK) whose total and effective (i.e., injection to detection) lengths were 70 and 53 cm, respectively. The capillary was maintained at 35 °C.
Before each separation, the capillary was sequentially washed with 1 M sodium hydroxide (1 min, 20 psi), ultra-pure water (3 min, 20 psi) and running buffer (5 min, 20 psi). Hydrodynamic injections of the sample were mostly performed under various pressure and duration (see results for proper details) and a 25 kV separation voltage was applied for 20–40 min. In a few cases, electrokinetic injection was employed (see results for detailed conditions). Electropherograms were acquired at 15 Hz with P/ACE MDQ software. Data were further analyzed and curves were fitted using the GraphPad 5 software.

3. Results

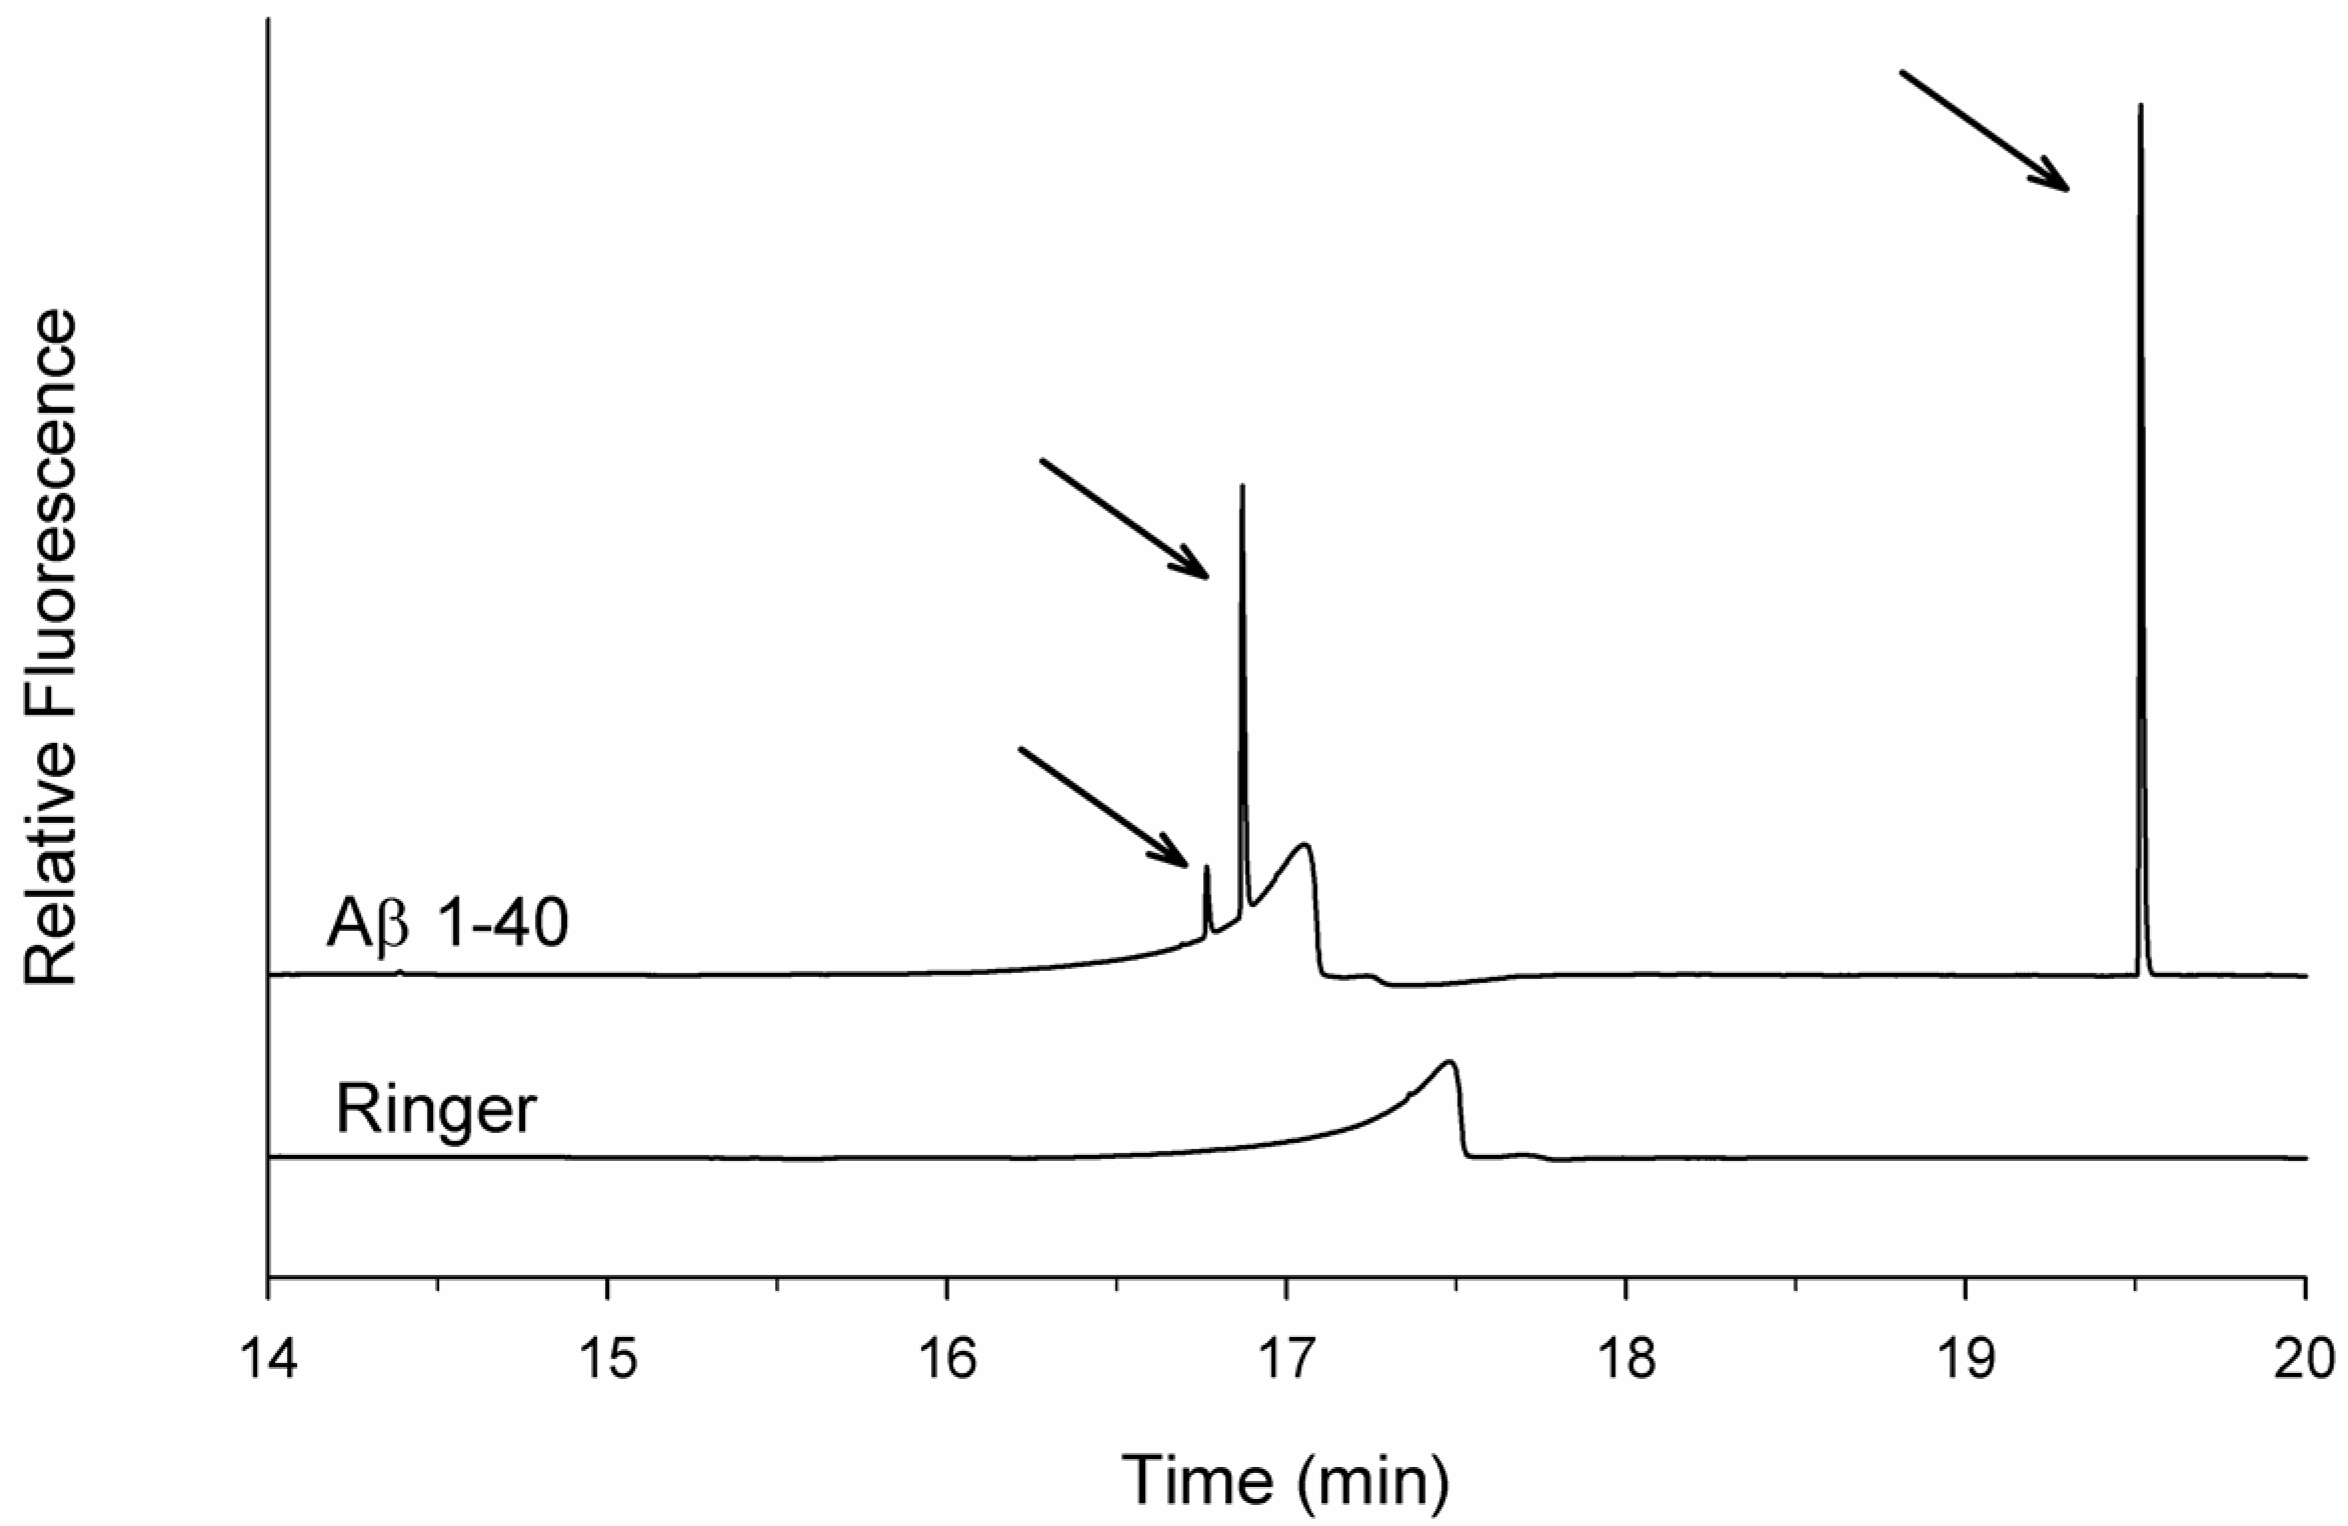
3.1. Spikes Are Present in Samples of Incubated Aβ 1-40 and Reveal Aggregates

The CE-LIF separations of an Aβ 1-40 incubated sample compared to un-incubated matrix are shown in Figure 1. One may note the presence of spikes (average width 1.7 to 2.5 s) only in the peptide sample (arrows). In order to confirm that such these spikes were due to aggregated peptide formed during the incubation, un-incubated Aβ 1-40 was analyzed under similar conditions.
In contrast to what could be expected, the electropherograms of un-incubated Aβ 1-40 also contained spikes (Supplementary Material Figure S1, top traces). Moreover, such spikes were no more observed if the sample was filtered prior to being injected (Figure S1, bottom traces), suggesting that the sample of un-incubated Aβ 1-40 contained particulate material. We cannot rule out that this material could be aggregates formed during the preparation of the peptide solution, since Aβ 1-40 is known to be prone to rapid self-aggregation. As in this experiment the Aβ 1-40 powder was initially dissolved in Ringer, we looked at another protocol that could avoid the formation of aggregates in un-incubated Aβ 1-40 solution. For that purpose, the Aβ 1-40 powder was dissolved in 0.1% NH4OH and further dissolved with Ringer just before the CE-LIF separation. As shown in Figure S2, the electropherogram of such un-incubated Aβ 1-40 did not exhibit any spikes and was similar to electropherograms of un-incubated matrix. Thus, in agreement with previous studies [20], the sample of Aβ must be initially dissolved in a medium such as NH4OH in order to avoid the presence of any particulate material prior to the incubation process.
In another assay, a sample of Aβ 1-40 was incubated for different durations and spikes only appeared from the third day of incubation (Figure S3). This progressive apparition of spikes during the incubation was in accordance with the pathway model for amyloid fibrils formation. These first results, which showed that the spikes were absent in the incubation medium and appeared along the incubation, strongly suggested that they might be due to aggregates of Aβ 1-40 peptide.

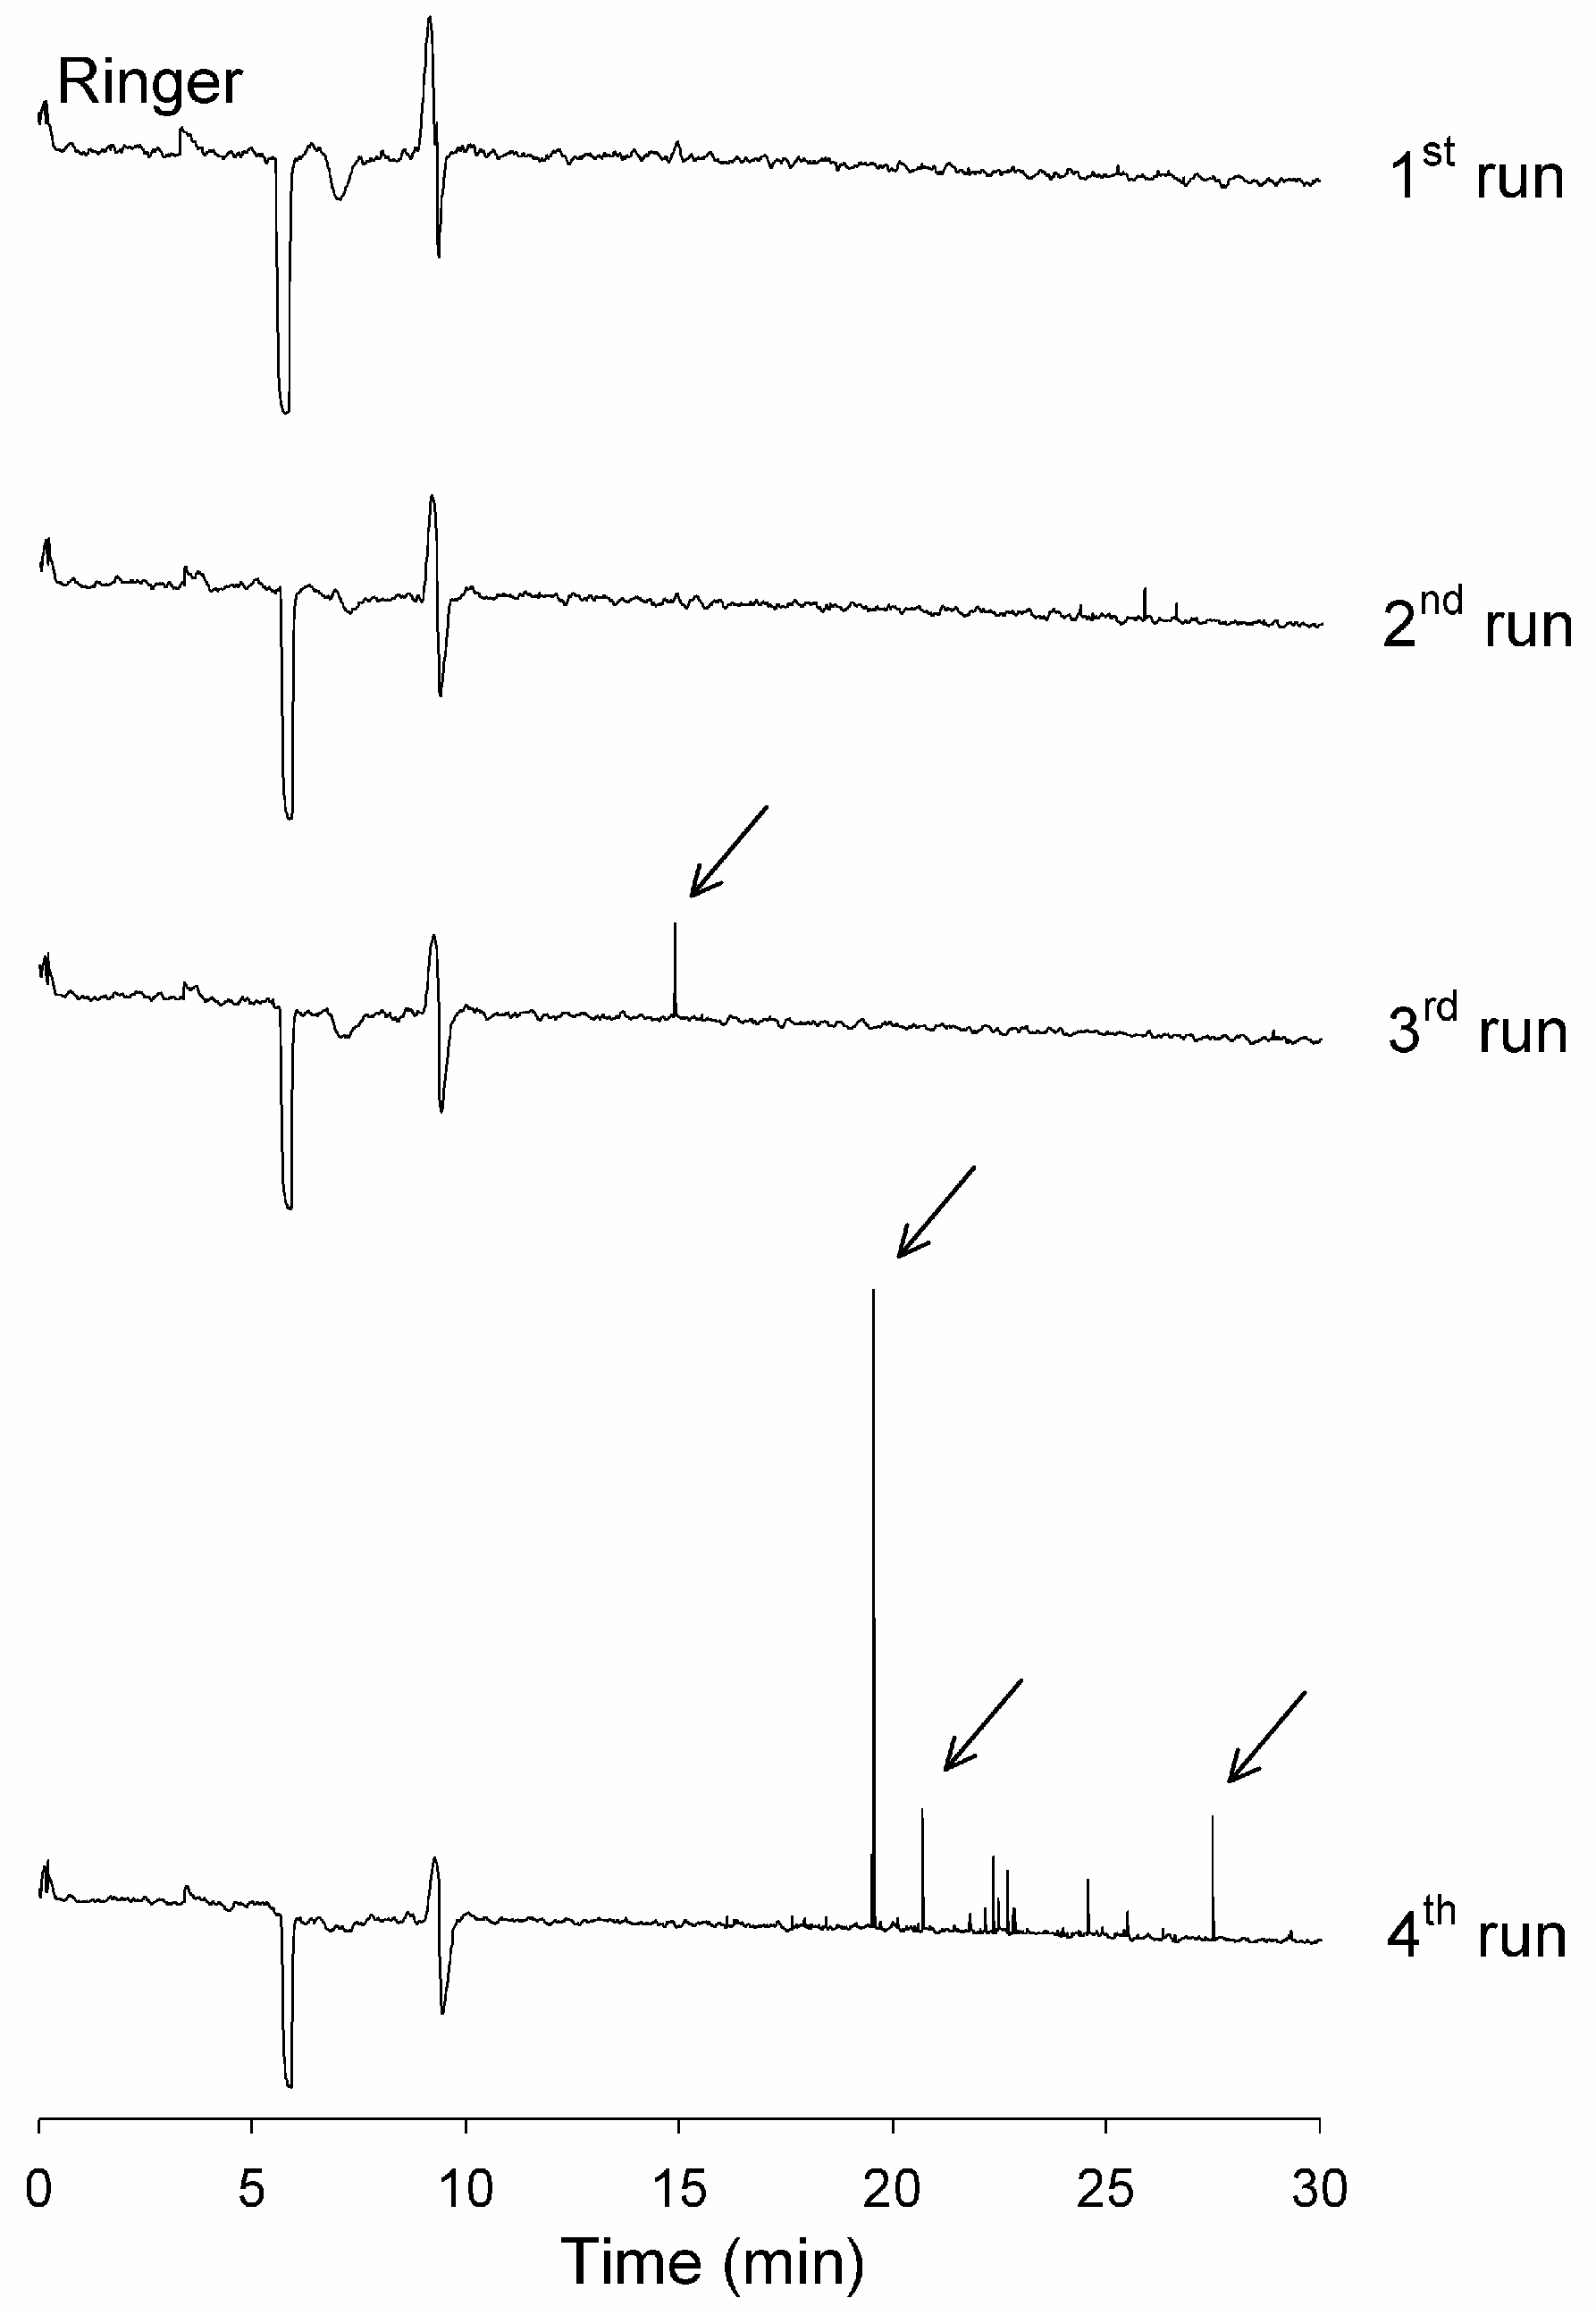
3.2. Analytical Instrument Can Generate Artefactual Spikes During the Analysis of Incubated Aβ

Nevertheless, in a few experiments, the presence of spikes in the electropherograms of un-incubated Aβ 1-40 could be still encountered, despite an initial dissolution of the peptide in 0.1% NH4OH (data not shown). Moreover, in some experiments, spikes could be also encountered when performing separation of control incubation medium (data not shown). Since such spikes never appeared when a separation was performed without any injection, i.e., when applying voltage just after the capillary conditioning steps, they were unlikely to be caused by particles already contained in the running buffer, but could be linked to sample injection.
Although the incubation medium was filtered on 0.2 µm acetate cellulose filter, one cannot totally rule out that it may still contain some tiny particles that exhibited unspecific binding towards thioflavine T, giving rise to spikes. Consequently, ultra-filtration on 30 kDa cut-off ultra-filters was attempted in order to eliminate particles, but spikes could still be detected during the analysis of such ultra-filtered incubation medium (data not shown). However, such spikes only appeared after some successive separations, for example from the third injection as in the experiment shown in Figure 2. Thus, the presence of spikes may be more related to the successive injection steps than to the presence of particulate material in the ultra-filtered incubation medium.
One may thus hypothesize that the spikes encountered when separating ultra-filtered incubation medium arise from silica particles released from the capillary inlet at the injection step. Indeed, the silica at capillary inlet is likely to be weakened after successive separations, a phenomenon that may partly be due to the cavitation process induced by the strong enhancement in running buffer linear velocity within the capillary when applying the separation voltage. In addition, as the capillary inlet bends through the inner part of the rubber stopper of sample vial during the injection step, this may induce some mechanical stress favoring the release of silica particles from the capillary inlet, especially after a few separations in agreement with the data shown in Figure 2. Alternatively, the unexpected spikes could also be due to tiny dusts ripped out from the rubber stopper of sample vial during the injection process.
In order to reduce these two putative causes of interfering spikes, the inner part of the rubber stopper of vials (Figure S4A) was cut out and “open stopper” (Figure S4B) was used in both samples and buffer vials, avoiding any mechanical stress during the injection step, such as bending or rubbing of the capillary inlet against the rubber stopper. Under such a condition, all the electropherograms of the analysis of ultra-filtered incubation medium were devoid of any spikes (Figure S5), whereas only separation of incubated Aβ 1-40 led to sharp spikes, which may correspond to aggregated peptide.

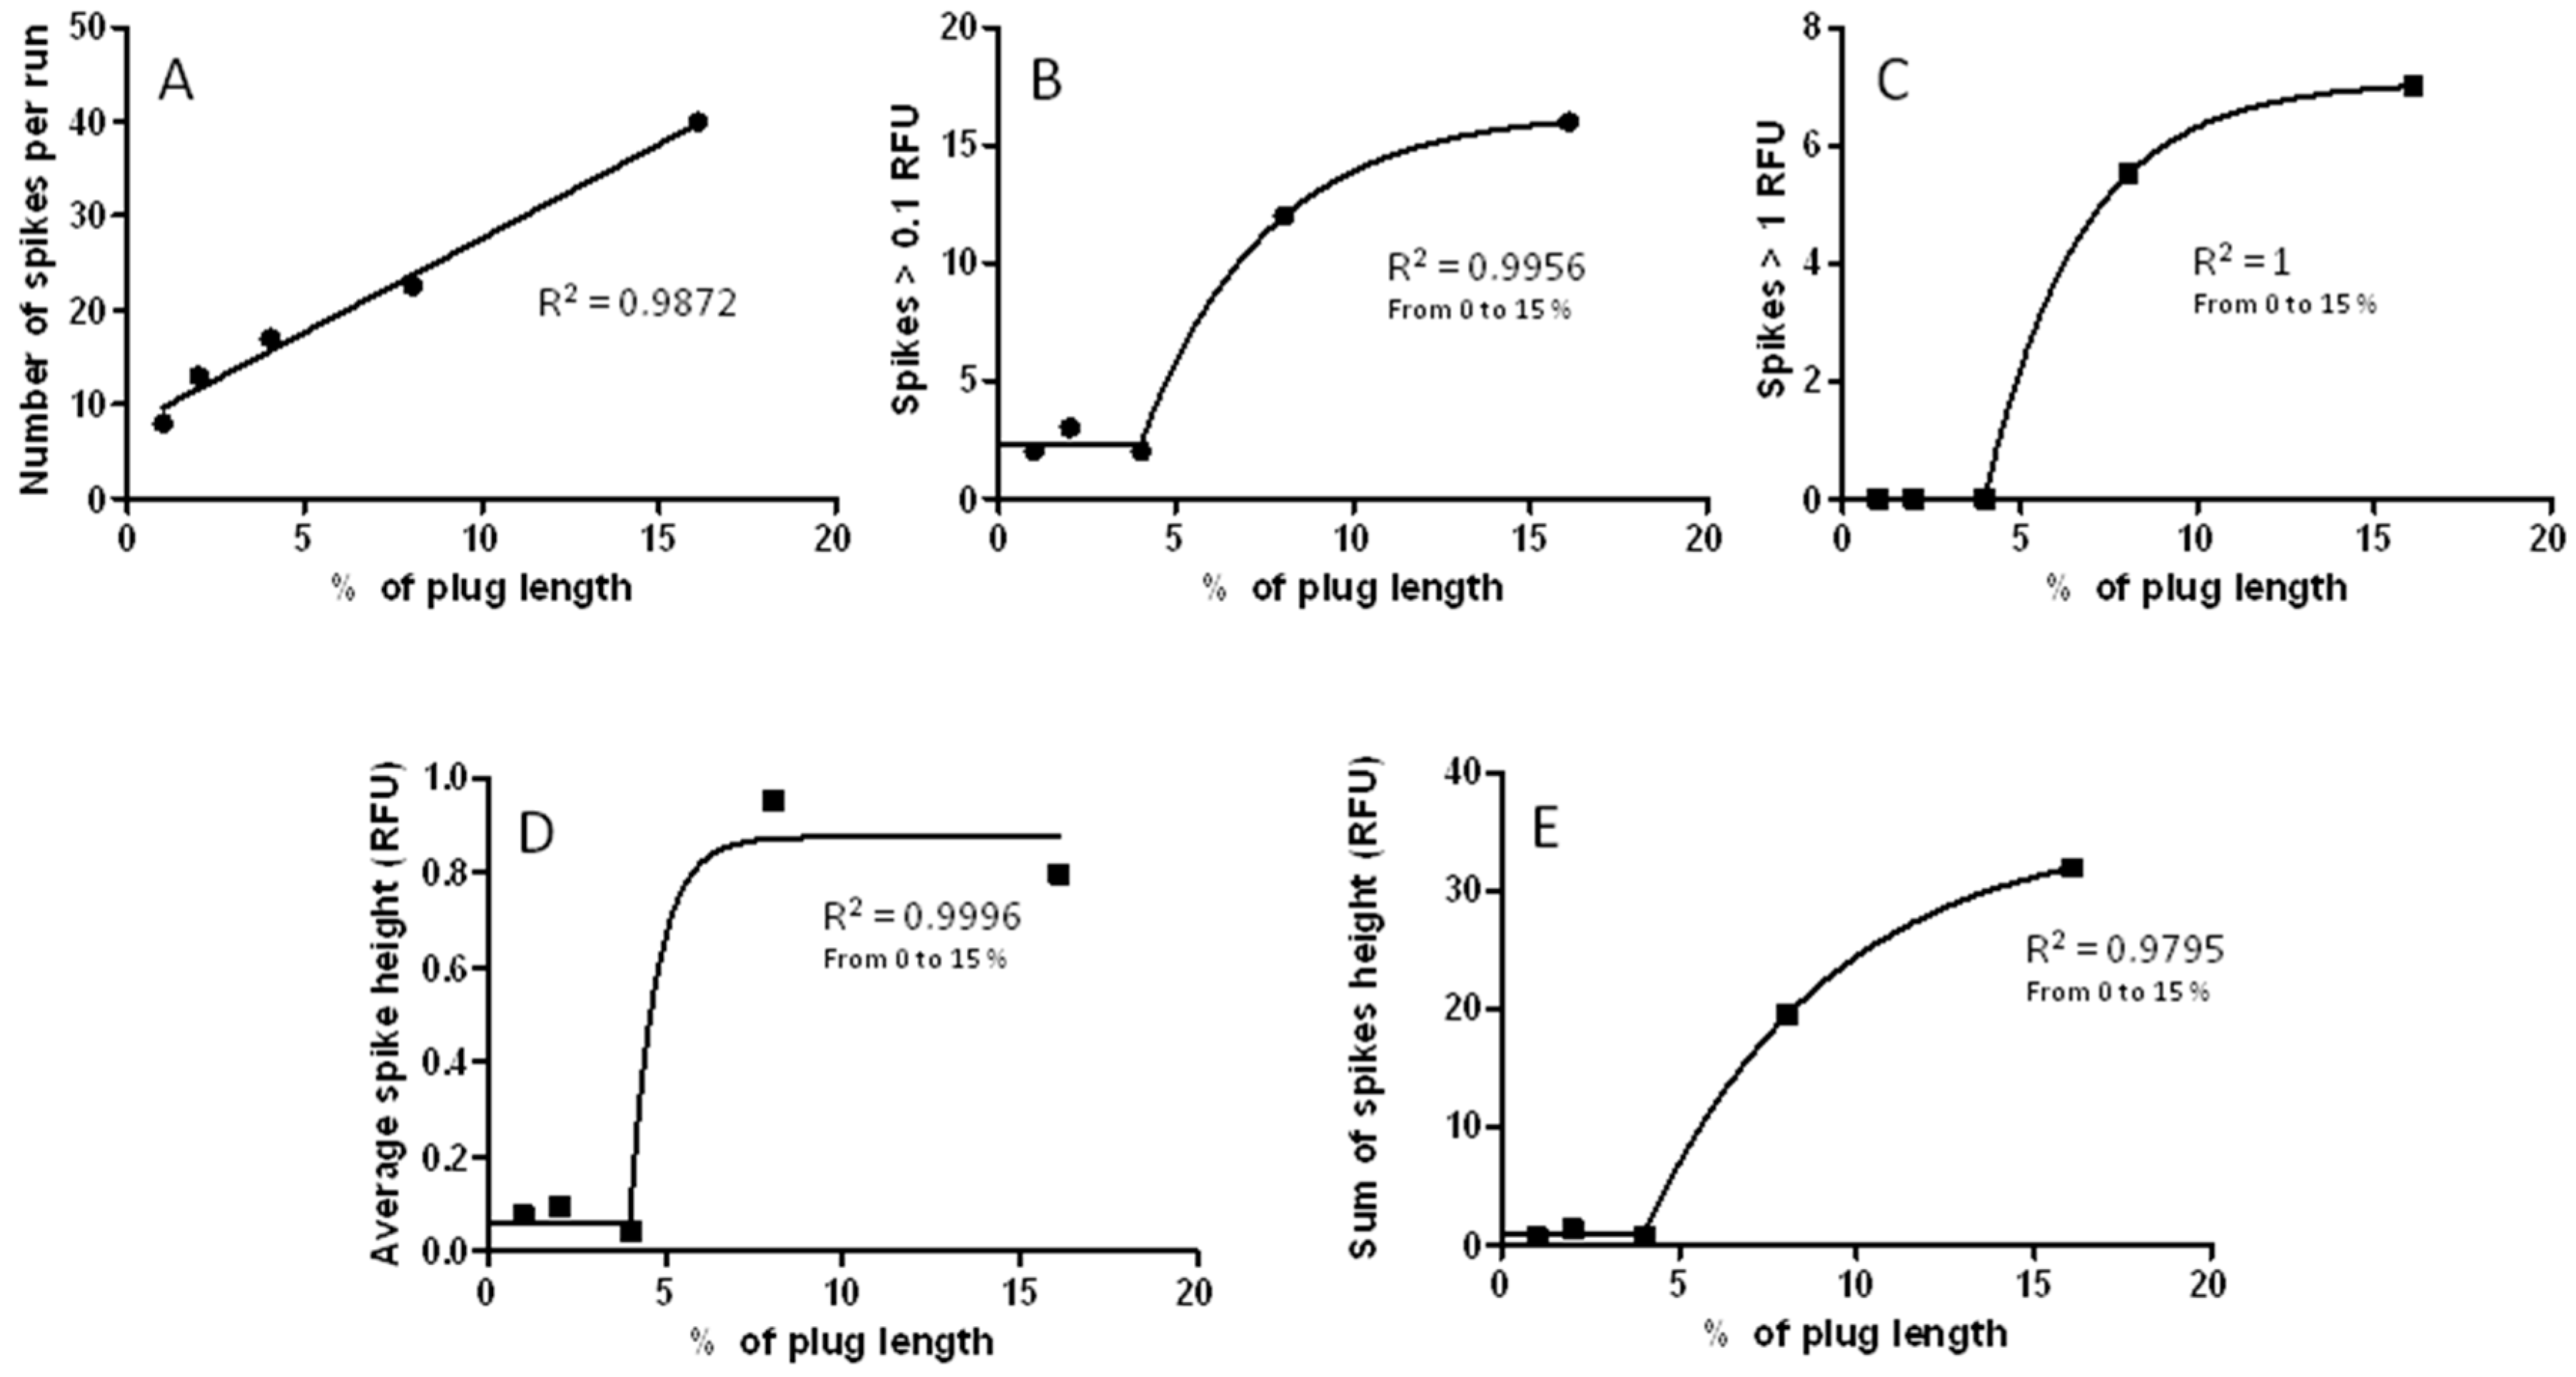
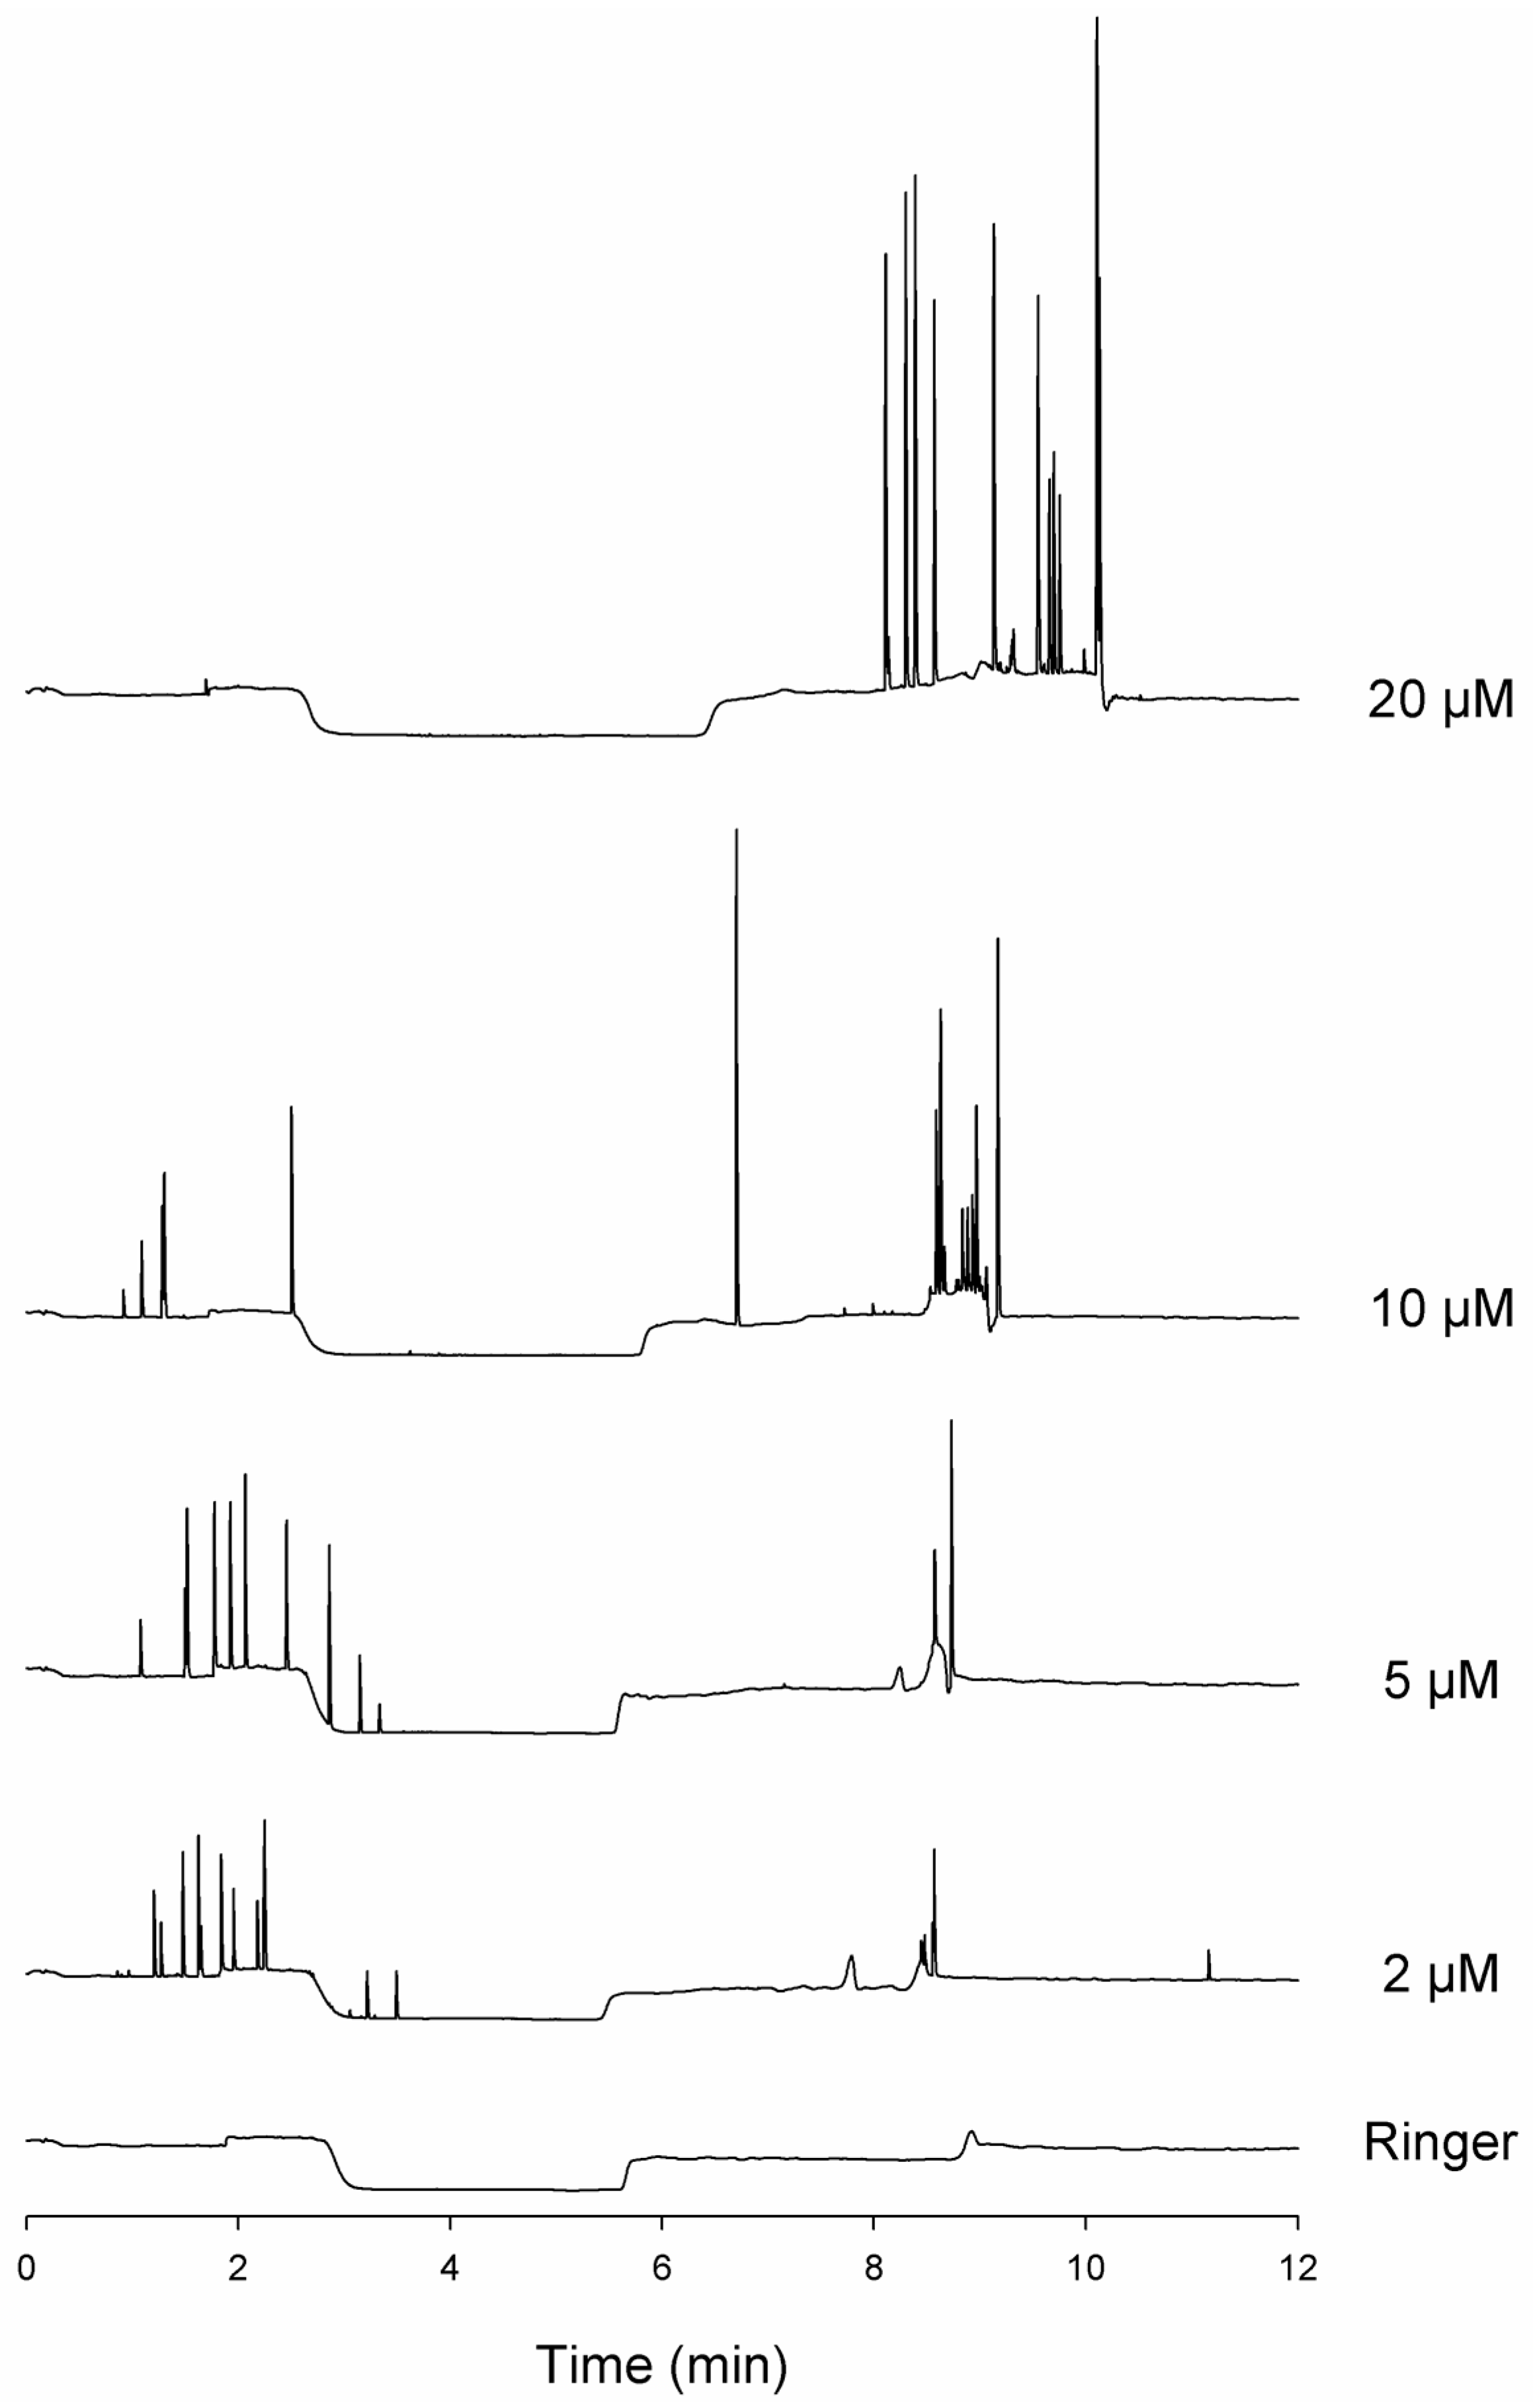
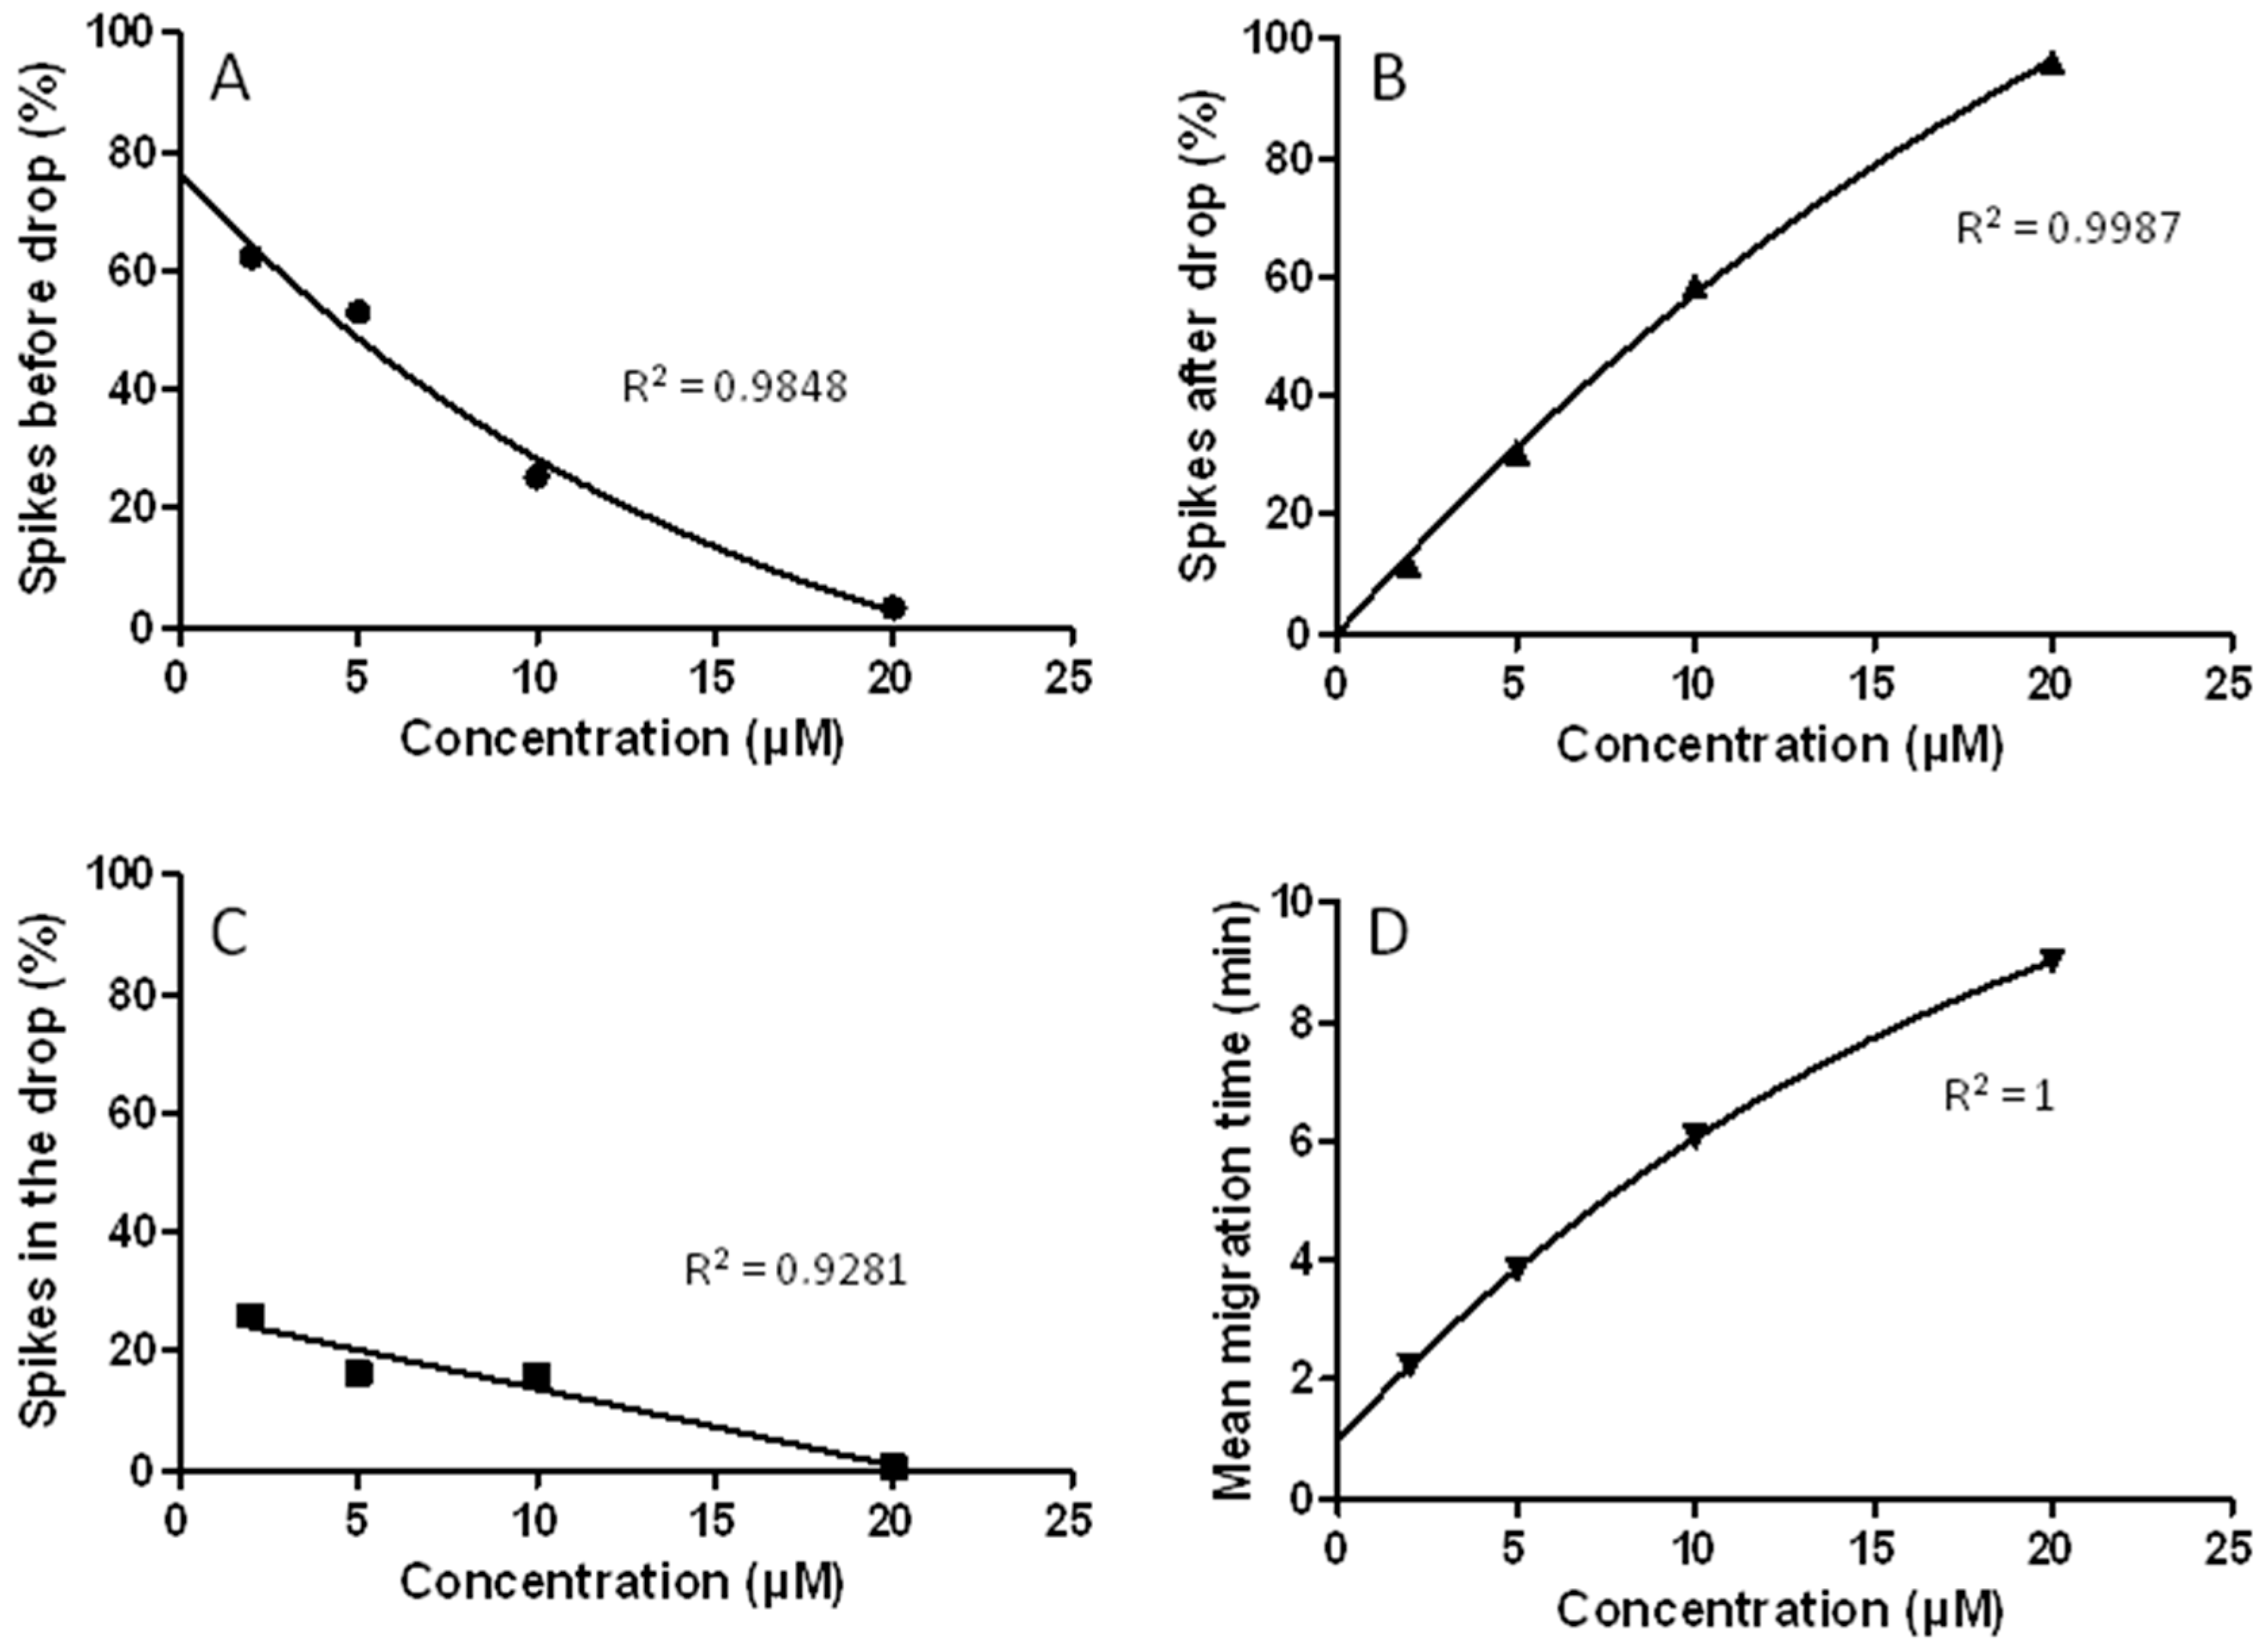
3.3. Changes in Injection Volume Reveal That Spikes of Incubated Aβ 1-40 Exhibit Particle-Like Electrophoresis Behavior

In an experiment aiming to investigate the effect of injection volume on separation, hydrodynamic injections of a sample of incubated Aβ 1-40 were performed with durations ranging from 10 to 160 s, corresponding to percentage of sample plug length vs. effective capillary length ranging from 1% to 16%. The electropherograms (Figure 3) exhibited, in addition to spikes, a vacancy peak (transient baseline drop) followed by a wide peak, both thought to correspond respectively to the absence of thioflavine T and to soluble compounds in the sample. When the injection volume was enhanced, the number and size of spikes increased, but, unexpectedly, the width of spikes did not change. To further analyze these data, the widths of spikes, of vacancy peak and wide peak were measured and Figure S6 shows their changes according to the injection volume. This clearly shows that the width of spikes is independent of the injection volume, in contrast to the widths of the vacancy peak and of the wide peak, which increase according to the injection volume.
This also suggests that spikes correspond to species that are not distributed homogeneously within the sample plug as solvated molecules contained in the wide peak are. Such an interpretation was further supported by the fact that major spikes could be observed only with injection equal or higher than a percentage of plug length of 8%, in contrast to the vacancy peak and to the wide peak, which were obtained whatever the injection volume was (Figure 3). Thus, the link between spikes and aggregates was clearly supported by the particle-like electrophoresis behavior of spikes. In that respect, Aβ aggregates behave as discrete particles, leading to separation profiles, which were characterized by spikes and looked like CE separation of polymer particles, microbial aggregates or even organelles such as mitochondria [26,27,28,29].

3.4. The Nature of Running Buffer Affects Spikes Detection

Several running buffers can be used for performing capillary electrophoresis separation of Aβ aggregates. In one study, samples of incubated Aβ 1-40 were separated using 50 mM pH 3.0 sodium citrate, 50 mM pH 4.7 ammonium acetate or 50 mM pH 8.7 sodium borate as running buffer and the electropherograms showed that performing the analysis in citrate buffer or acetate allowed the obtaining of more and higher spikes than when using the borate buffer (Figure S7). In addition, the trace obtained with borate buffer seemed to exhibit more wide peaks (i.e., unrelated to Aβ fibrillar aggregates) than the trace obtained with citrate buffer and analysis of incubation medium revealed that borate buffer gave a larger background peak as compared to citrate buffer (data not shown). The sole drawback of citrate buffer was a longer run time due to reduced electroosmotic flow. As an alternative, the ammonium acetate buffer could be used as it gave electropherograms of a quality similar to sodium citrate ones, while allowing a shorter run time.

3.5. The Link between Spikes and Aggregates Is Supported by Ultrasound-Treatment of Samples

When using optimized running buffer, the link between spikes and aggregates was further supported by the sensitivity of spikes towards the ultrasound-treatment of samples that could disrupt supra-molecular build-up of peptide. Indeed, as shown in Figure S8, the number and size of spikes were poorly affected by a moderate exposition of sample to ultrasounds in a sonication bath. In contrast, spikes were dramatically lowered after treatment with a more powerful sonication rod.

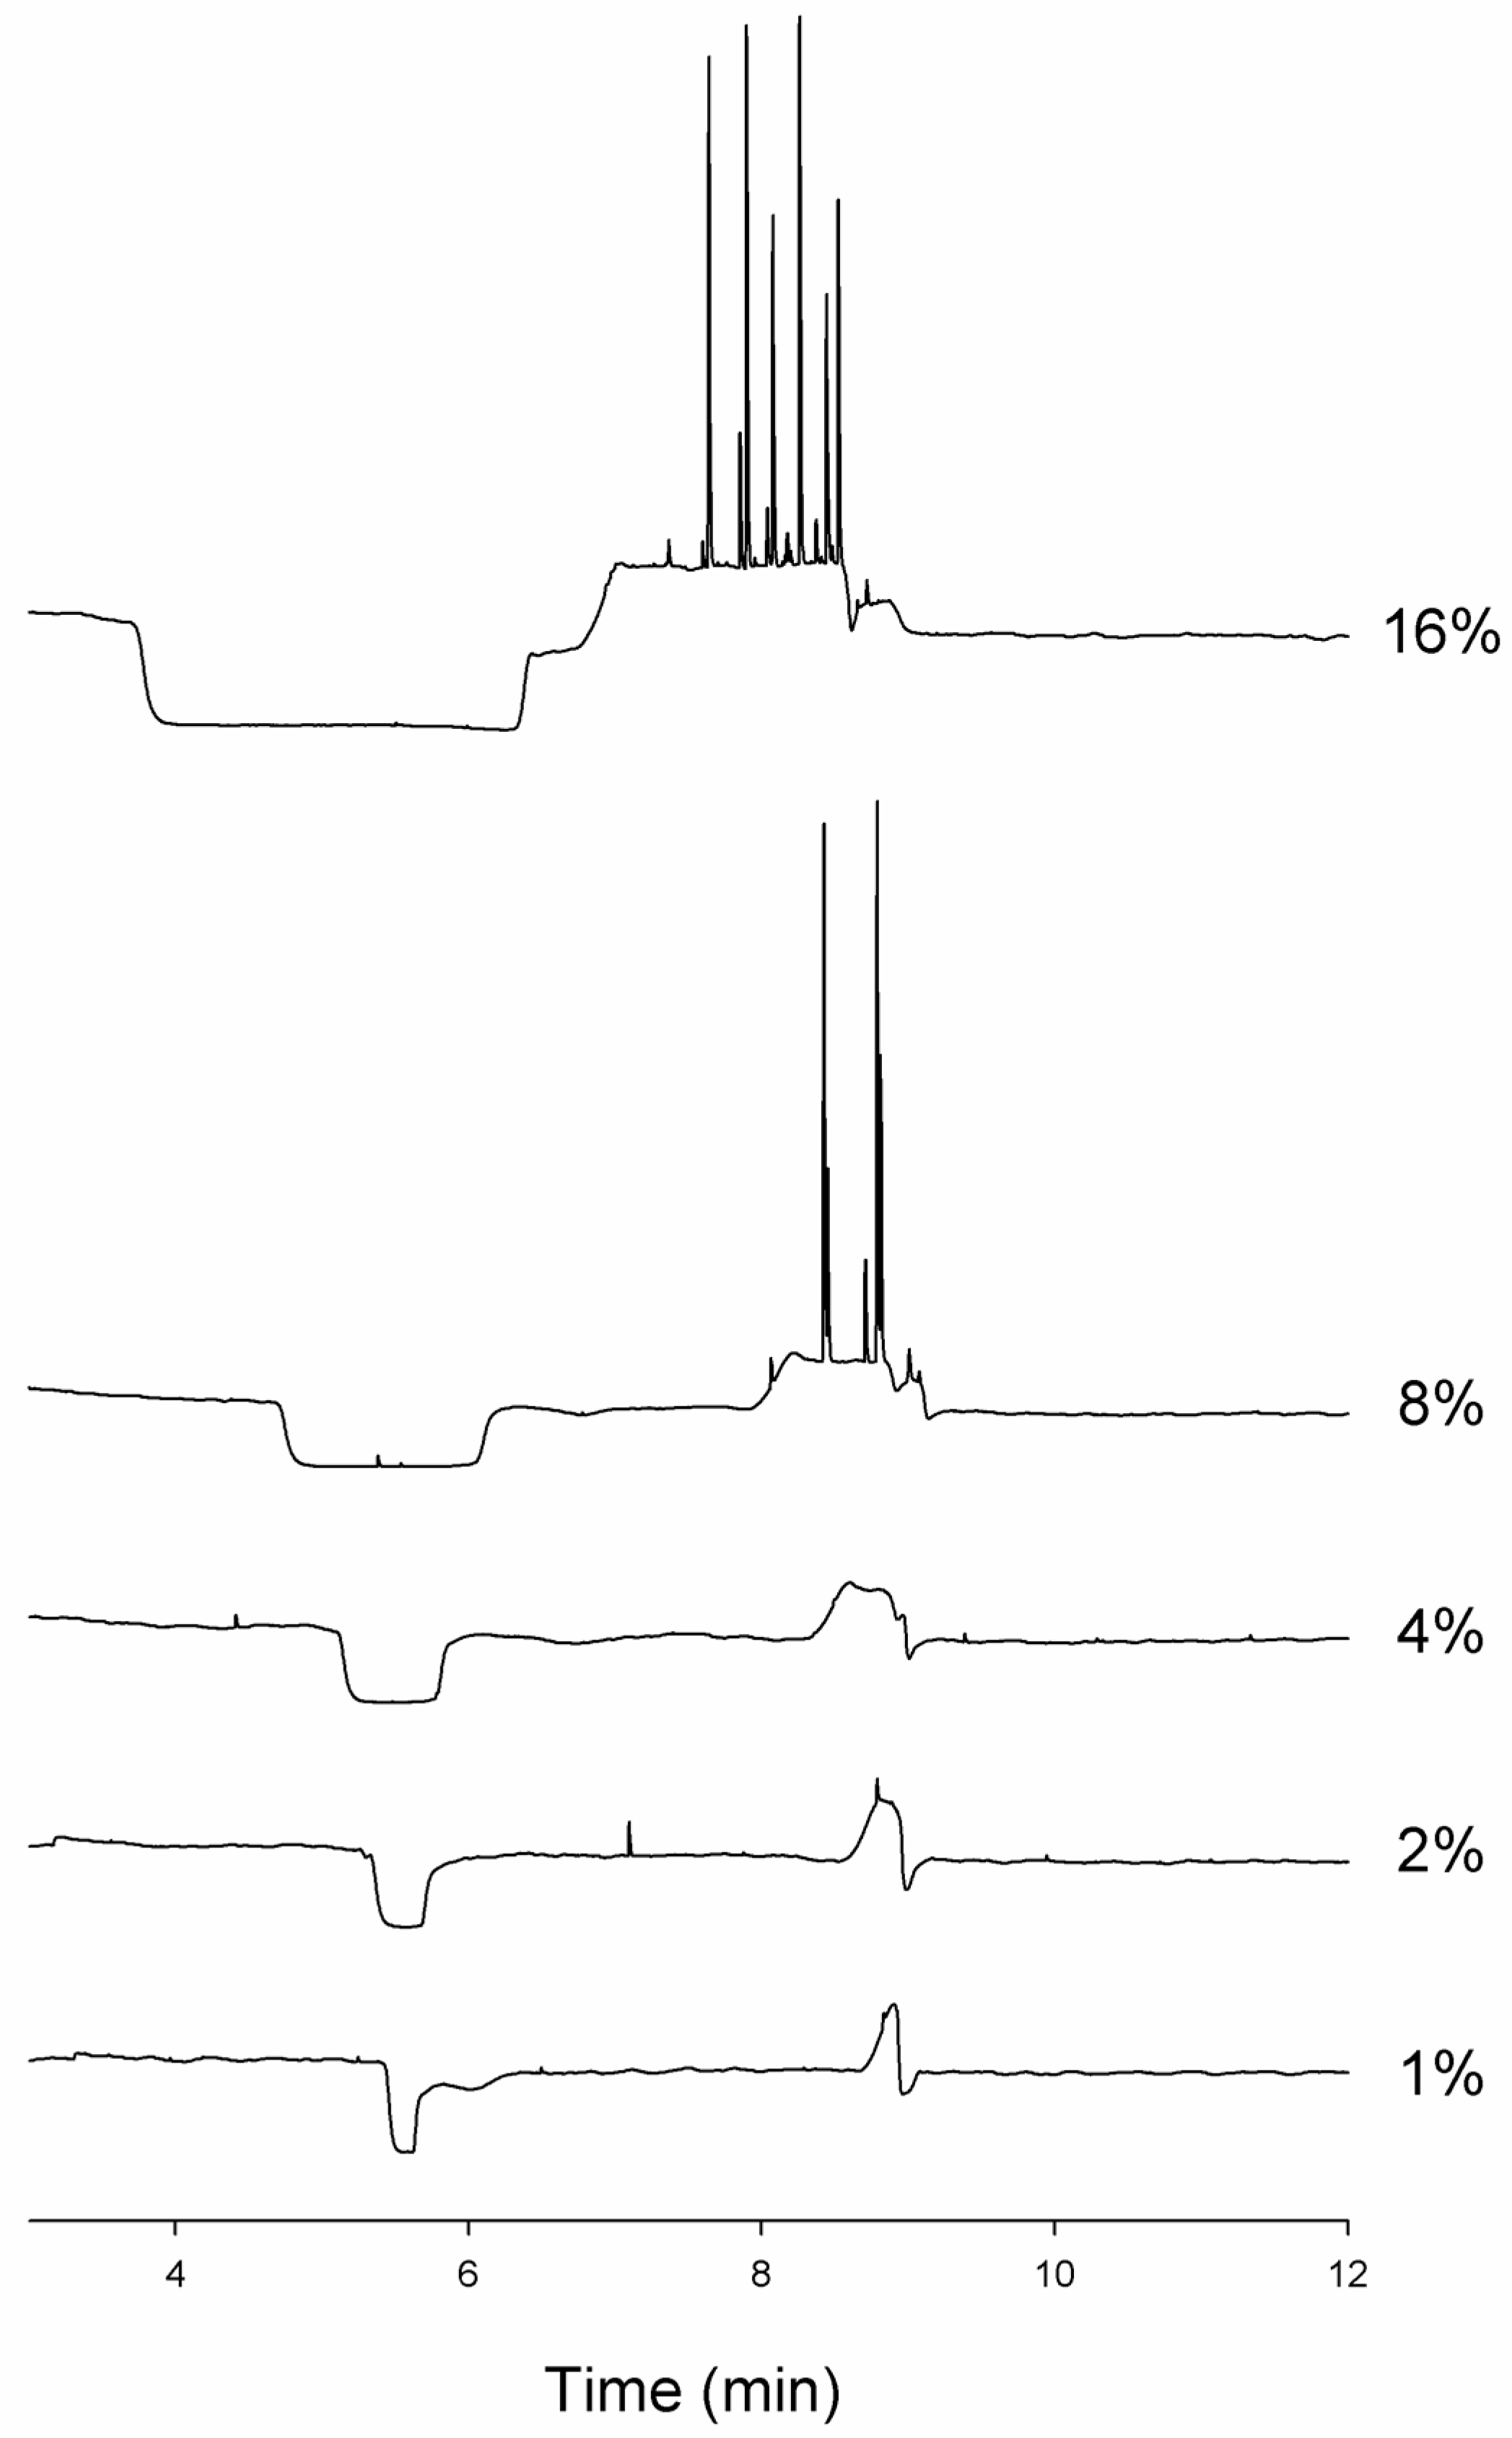
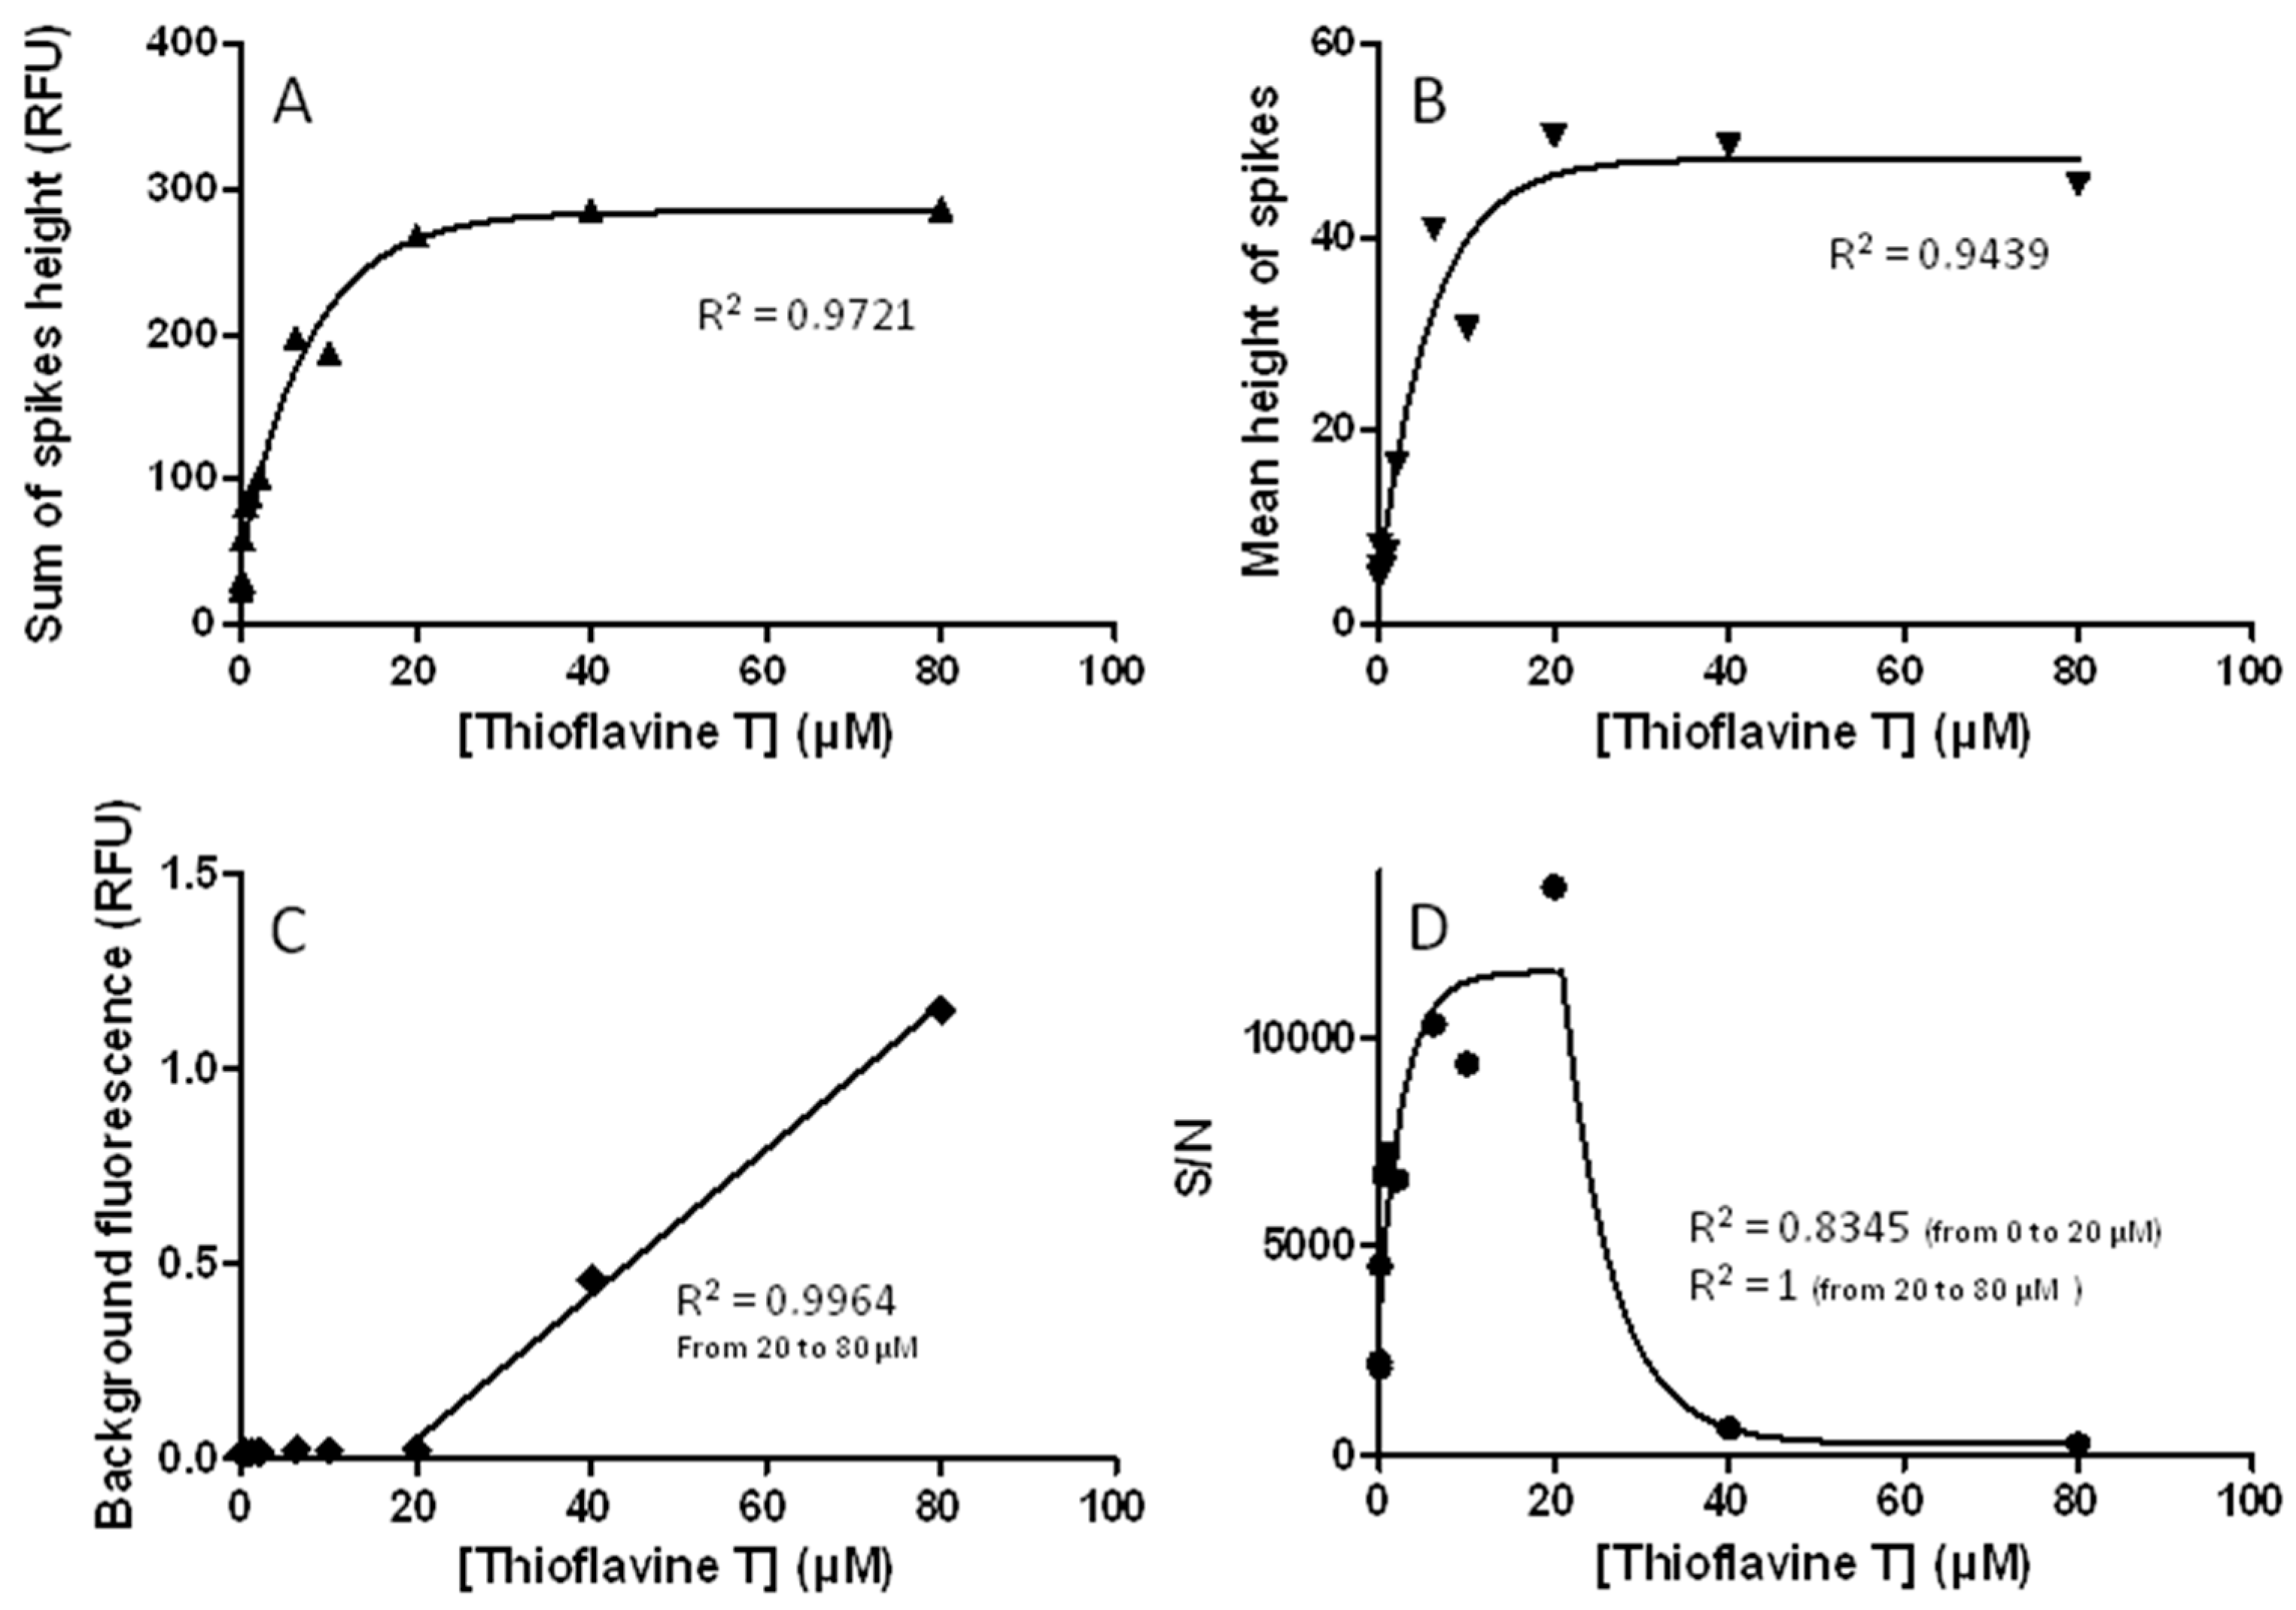
3.6. The Use of Thioflavine T in Running Buffer Must Be Carefully Controlled and Validated

It is thought that the fluorescence of the spikes is due to thioflavine T bound to aggregated Aβ 1-40. Indeed, when the CE separation of incubated Aβ 1-40 was performed using a running buffer devoid of thioflavine T, no noticeable spike was observed, even when recording fluorescence at high sensitivity, as shown in Figure S9.
In order to enhance the sensitivity of aggregated Aβ detection, the influence of the concentration of thioflavine T in the running buffer on spike height and level of background fluorescence was determined. For that purpose, a sample of incubated Aβ 1-40 was analyzed in citrate buffer containing thioflavine T in the 0.01 µM to 80 µM range. The results are shown in Figure 4.
The sum of spike heights and the mean height of spikes were enhanced when the thioflavine T concentration was increased up to 20 µM and reached a plateau when the thioflavine T was further enhanced. The level of background fluorescence remained negligible up to 20 µM and increased thereafter. As a consequence, the signal to noise ratio (i.e., the ratio between sum of spike heights and background fluorescence) increased up to a concentration of thioflavine T equal to 20 µM and fell afterwards. Therefore, the optimal concentration of thioflavine T in the 50 mM pH 3.0 sodium citrate buffer seemed to be around 20 µM.
The thioflavine T containing citrate, ammonium acetate or borate buffers exhibited a basal fluorescence. For the three buffers, the values of this residual fluorescence were not constant and exhibited a similar decrease over time (~−10% per hour) as shown in Figure S10. Consequently, to avoid any noticeable effect of such decreases, running buffers were made fresh every other hour. Further studies will be necessary to determine whether such a lowering in basal fluorescence could be due to either the degradation of thioflavine T or to a partial precipitation of this hydrophobic ligand in the aqueous running buffers. According to the results, they may suggest to add a stabilizing compound in the running buffers.
In our method, the aggregated Aβ sample did not contain any ligand and was injected into a capillary filled with a running buffer containing thioflavine T, relying on the assumption that the binding of thioflavine T to Aβ aggregates was highly rapid and occurred completely within the migration time range. In order to validate this procedure, we sought to determine if the same amount of spikes could be obtained when decreasing the contact time between the thioflavine T and the sample. For that purpose, the sample was injected into a capillary filled with a running buffer devoid of ligand and this step was followed by the insertion of an inlet reservoir filled with buffer containing thioflavine T just before applying voltage. As both Aβ aggregates and thioflavine T were positively charged at the pH of the citrate buffer used, they were mixed when migrating together towards the cathode at the capillary outlet, through a running buffer initially devoid of ligand. In such a “sweeping-like” mode of binding, the Aβ aggregates reacted with thioflavine T during a shorter time as compared to the initial procedure, in which the whole capillary was filled with thioflavine T-containing buffer. As shown in Figure S11, the number and size of spikes were not reduced when the contact time between Aβ aggregates and thioflavine T was decreased by that way. That result strongly suggested that the binding of thioflavine T to Aβ aggregates was a fast event, supporting the assumption that it occurred completely when using the initial procedure.

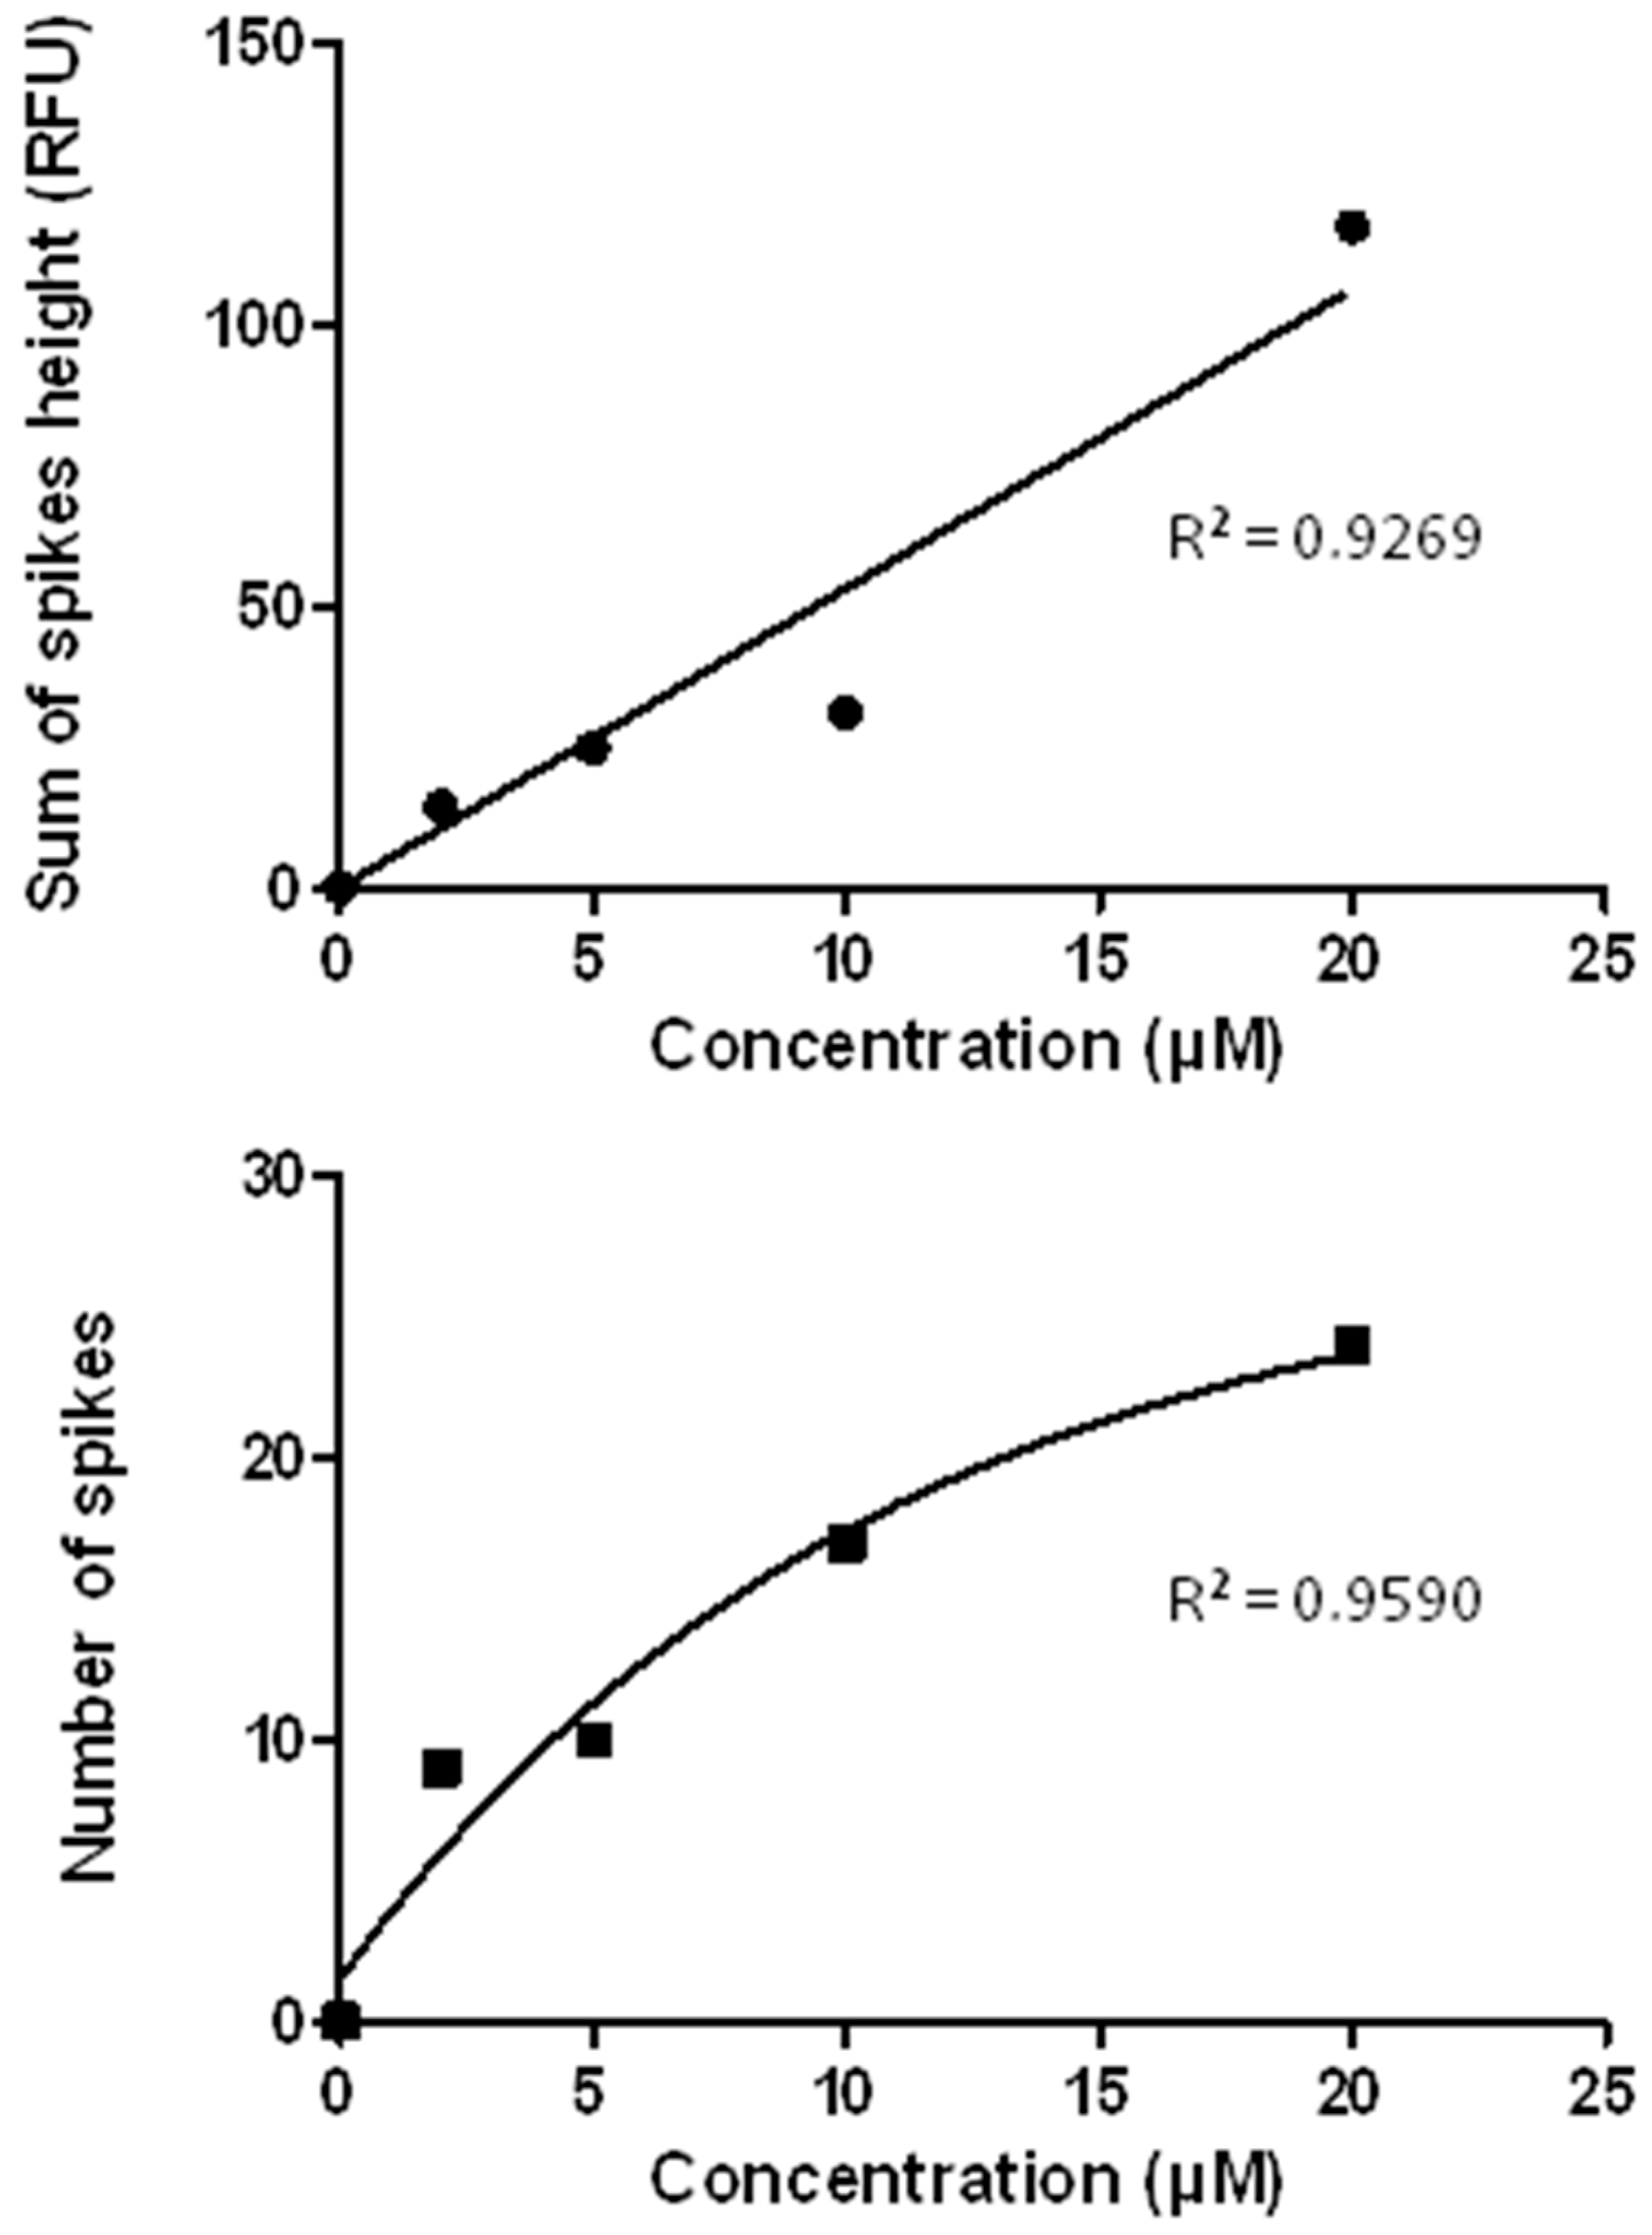
3.7. The CE-LIF Separation of Aβ Aggregates Exhibits Quantification Capabilities

The question arose whether such a CE-LIF analysis of spikes corresponding to aggregates could be quantitative. If it is the case, the number of detected spikes should increase when the volume of hydrodynamically injected sample is progressively enhanced. This was observed when the plug of a sample of incubated Aβ 1-40 was increased from 1% to 16% of the effective capillary volume, as shown in Figure 5A. This increased number of spikes was associated to an enhanced size of spikes as shown by a non-linear increase in the number of spike higher than 0.1 relative fluorescence unit RFU (Figure 5B) or 1 RFU (i.e., major spikes; Figure 5C) and in the average spike height (Figure 5D), when the sample plug length became higher than 5% of the effective capillary length. Besides, the sum of spike heights underwent a larger increase above that threshold (Figure 5E), due to a more pronounced injection of large spikes. The number and size of spikes were also enhanced when the amount of injected sample was progressively increased when performing an electrokinetic injection instead of a hydrodynamic one. Indeed, when a sample of incubated Aβ 1-40 was successively analyzed using electrokinetic injection from 200 to 1600 kV.s (i.e. 5 kV/40 s to 10 kV/160 s), the total number of spikes (Figure S12A) and the number of spikes higher than 0.1 RFU (Figure S12B) increased progressively.
Further experiments were undertaken to determine whether the number and size of spikes depend on the concentration of incubated Aβ 1-40. Such experiments were based on the assumption that the amount of aggregates formed during the incubation would closely depend on the initial concentration of Aβ 1-40 at the beginning of the incubation. For that purpose, 1 µM to 20 µM Aβ 1-40 samples were incubated for 18 days and thereafter analyzed by CE-LIF using a hydrodynamic injection and a pH 4.7 ammonium acetate buffer as running electrolyte. The corresponding electropherograms are presented in Figure 6 and clearly show an increase in the number and size of spikes when the initial concentration of peptide is enhanced.
The spikes were counted and their heights were measured in each electropherogram and the data are presented in Figure 7. It clearly appeared that the sum of spike height varied linearly with the concentration of Aβ 1-40 in the sample. The number of spikes also increased with the concentration of sample, but the relationship was not linear. Thus, these data show that the number and size of spikes depend on the concentration of incubated Aβ 1-40 and further support a semi-quantitative capability of the CE-LIF in the analysis of Aβ aggregates.

3.8. This CE-LIF Method Allows Separation ofAβ Aggregates of Different Size

The capability of the present CE-LIF approach to separate various Aβ aggregates has been revealed in the experiment shown in Figure 6, in which different concentrations of Aβ 1-40 have been incubated. These data clearly showed that when the Aβ 1-40 concentration was enhanced, more spikes were migrating belatedly. Indeed, when the Aβ concentration was equal to 20 µM, all the spikes migrated after the vacancy peak (wide drop, in the migration time range 2.5–5.5 min); when the concentration was equal to 10 µM, the spikes migrated on both sides of this drop; when the Aβ concentration was equal to 5 or 2 µM, most of the spikes migrated before the drop. The migration times of the spikes were measured and the results are shown in Figure 8, as percentage of spikes migrating before (Figure 8A), after (Figure 8B) or during (Figure 8C) the drop when injecting the different concentrations of Aβ 1-40. The averaged migration times of all spikes for each sample are also shown (Figure 8D). These results showed that more concentrated solutions of Aβ peptide (e.g., 20 µM) gave spikes with a reduced mobility (or higher migration time) as compared to lower-concentrated solutions (e.g., 2 µM). As the electrophoretic mobility depends on the charge-to-mass ratio, one may suggest that the enhanced migration times of spikes found when analyzing highly concentrated solutions of Aβ 1-40 reflect the formation of aggregates of larger size than when incubating lower-concentrated solutions of peptide.

4. Discussion

This study describes a novel CE-LIF method for the analysis of large aggregates (likely to be fibrils) of Aβ peptides that migrate as sharp spikes. In the present work, these aggregates have been formed during the in vitro incubation of Aβ 1-40 monomer for period in the 1 to 28 days range. As it was not possible to have access to an electronic microscopy platform when performing the present study, the presence of fibrillar aggregates was not confirmed using an imaging approach. However, one can safely assume that our samples contained fibrils of Aβ peptides, because the incubation conditions we used (buffer, temperature, duration) are well known to lead to Aβ aggregates, some of them being fibrils [15,23,24,25].
As compared to previous CE-UV [23] or CE-LIF [24,25] studies that did not consider blanks (i.e., incubated or un-incubated matrix), the present work has revealed factors leading to interfering spikes, i.e., spikes related to material other than Aβ aggregates. Clearly, important causes of interfering spikes may be silica particles released from the capillary inlet in response to the mechanical stress to capillary occurring during the injection step and/or tiny dusts ripped out from the rubber stopper of vials. Moreover, one original procedure, i.e., a simple modification of the rubber stopper of vials, has been shown to be successful to minimize the interfering spikes, greatly improving the specificity of the assay.
In addition, the present work highlights the importance of running buffer nature and pH and suggests, for improving the performances of the analysis, the use of slightly acidic citrate or acetate buffer instead of neutral or slightly basic buffer as in previous studies [24,25]. In addition, care in the handling of running buffer has been emphasized when describing the limited stability of thioflavine T in such buffers, an effect that has been overlooked so far.
Besides, one of the main results of the present work is represented by original data regarding the nature of the species migrating as spikes and the difficulty of the analysis linked to the heterogeneous character of the samples. This has been brought when describing the effect of sample volume on the shape of these spikes. Indeed, as the width of spikes was unrelated to the length of sample plug, these spikes could not correspond to solvated molecules and therefore could only correspond to particles that were suspended in the sample solution, i.e., large Aβ aggregates (likely to be fibrils). The un-solvated nature of Aβ aggregates led to non-homogeneous sample, which was a suspension and not a solution. That was clearly shown by the step increases in the size of spikes when the sample plug length became higher than 5% of the effective capillary length, reflecting an increased probability to pick up major spikes when enhancing the volume of injection. The consequence of the non-homogeneity of the sample was a poor repeatability of the analysis, the coefficient of variation in the number of spikes or in the average spike height being in the 30% to 40% range. On the other hand, one cannot rule out that the lack of repeatability was due to aggregates adsorption onto the capillary wall, followed by desorption during a successive run. This could be minimized by optimizing the washing steps between runs, such as including an acid wash. Besides, the precipitation of aggregates cannot be ruled out for explaining the lack of repeatability, although frequent shaking of the samples in order to re-suspend particulate material just before each injection did not improve the repeatability. Thus, in contrast to previous studies, the present work clearly reveals significant difficulties to obtain reproducible data when using the CE-LIF approach for determining Aβ fibrils.
Despite this poor repeatability, the present study shows for the first time that the CE-LIF analysis of Aβ aggregates could allow their semi-quantification. Indeed, the number and size of spikes closely depend on both injection volume and initial Aβ concentration in the sample. Furthermore, correlations could be drawn between the number of spikes or the sum of spikes height and the concentration of the sample. That determination of Aβ aggregates was far more selective than the classical thioflavine T fluorescence assay, since fluorescence signals unrelated to aggregates, such as wide peaks, were not taken into account. This emphasizes the advantages of the CE-LIF over non-separation fluorescence-based methods, e.g., the possibility to eliminate fluorescence signal due to other analytes than fibrils.
Another major advantage of the separation brought by the present CE-LIF method is the potential to discriminate different classes of aggregates formed during a given incubation period. That was shown when comparing electropherograms from samples obtained after the incubation of different concentrations of Aβ 1-40. The results showed that the migration time of spikes and hence the size of fibrils depends on the initial concentration of Aβ 1-40 monomer in the sample. This strongly suggests that highly concentrated solutions of Aβ 1-40 lead to the formation of aggregates of larger size than when incubating lower-concentrated solutions of peptide, i.e., that the size of aggregates (likely to be fibrils) is linked to the availability of Aβ monomer.
Thus, the present method is an easy-to-run affinity CE-LIF assay for the semi-quantitative analysis of fibrillar forms of Aβ aggregates. As compared to a previous study [25], it has the advantage to use a commercially available LIF instead of a home-made LIFA detector and to allow the direct analysis of sample, a buffer exchange step of sample prior to CE separation being unnecessary. Its selectivity mainly arises from the careful elimination of factors leading to interfering spikes and the optimization of thioflavine T containing running buffer.
However, one must recognize that our CE-LIF method still encounters some limitations. First at all, the repeatability must be enhanced to improve the quantification of Aβ aggregates. As discussed above, the present poor repeatability was likely due to the non-homogenous character of the sample and one may expect to improve it by injecting a larger volume of sample, as this should pick up a near constant number of Aβ aggregates when performing identical successive injections. However, as injecting a large volume of sample will reduce the capillary length available for the separation, such injection will need to be followed by an in-capillary sample concentration step. Several stacking approaches [30,31], based on hydrodynamic or electrokinetic injection should be considered, but one has first to ensure that no disruption of the non-covalent aggregates occurs due to the additional physico-chemical stress applied to the sample during such stacking steps. Performing an immuno-extraction to concentrate the sample before its injection into the separation capillary [32,33] could be another way to analyze a larger volume of sample and therefore to improve the repeatability. Besides to improve the repeatability, such immuno-extraction and stacking approaches will also be needed for enhancing the sensitivity in order to detect trace concentrations of Aβ aggregates in biological samples.
Finally, when performing this study, both preparation and handling of samples appeared to affect the performance of the CE-LIF analysis. Besides the need to dissolve the Aβ powder in an appropriate medium to avoid artifactual aggregates, the nature of the incubation medium seemed to affect the formation of fibrillar aggregates. In the present study, incubation of Aβ 1-40 in Ringer solution or in saline led to similar electropherograms. In contrast, in one pilot experiment, fewer spikes were obtained when incubating Aβ 1-40 or 1-42 peptide in human CSF (data not shown). This unexpected single result justifies repeating such an experiment on a larger number of human CSF samples, before to conclude that human CSF is a less favorable medium than Ringer or saline for the aggregation of Aβ. More broadly, a careful investigation of all steps of sample preparation and handling (including storage, freeze-thawing etc.) is needed to optimize the quality of samples and the performances of the analysis.

Supplementary Materials

The following are available online at https://www.mdpi.com/2297-8739/5/1/2/s1, Figure S1: Electropherograms of un-incubated Aβ 1-40 initially dissolved in Ringer, Figure S2: Electropherograms of un-incubated Aβ 1-40 initially dissolved in NH4OH and of un-incubated Ringer, Figure S3: Kinetic of the incubation of Aβ 1-40, Figure S4: Photographs of rubber stoppers for the vials, Figure S5: Successive analysis of 30 kDa ultra-filtered Ringer using “open stoppers” on sample and buffer vials, Figure S6: Effect of injection volume on the width of peaks and spikes, Figure S7: Effect of nature of running buffer on the separation of incubated Aβ 1-40, Figure S8: Effect of sonication on the capillary electrophoresis of incubated Aβ 1-40, Figure S9: Analysis of incubated Aβ 1-40 or ultra-filtered Ringer using a running buffer devoid of thioflavine T, Figure S10: Effect of nature of the running buffer on basal fluorescence and on its decay according to time, Figure S11: Effect of decreasing the contact time between analyte and thioflavine T on the capillary electrophoresis of incubated Aβ 1-40, Figure S12: Effect of size of electrokinetically injected sample on the number of spikes.

Acknowledgments

This research was supported by Institut National de la Santé et de la Recherche Médicale (INSERM), Centre National de la Recherche Scientifique (CNRS) and Université Lyon 1.

Author Contributions

L.D. conceived and designed the experiments; L.D. performed the experiments; L.D. analyzed the data; L.D. and S.P. contributed reagents/materials/analysis tools; L.D. and S.P. wrote the paper.

Conflicts of Interest

The authors declare no conflict of interest. The founding sponsors had no role in the design of the study; in the collection, analyses, or interpretation of data; in the writing of the manuscript, and in the decision to publish the results.

References

  1. Roher, A.; Wolfe, D.; Palutke, M.; KuKuruga, D. Purification, ultrastructure, and chemical analysis of Alzheimer disease amyloid plaque core protein. Proc. Natl. Acad. Sci. USA 1986, 83, 2662–2666. [Google Scholar] [CrossRef] [PubMed]
  2. Harper, J.D.; Wong, S.S.; Lieber, C.M.; Lansbury, P.T. Observation of metastable Aβ amyloid protofibrils by atomic force microscopy. Chem. Biol. 1997, 4, 119–125. [Google Scholar] [CrossRef]
  3. Walsh, D.M.; Lomakin, A.; Benedek, G.B.; Condron, M.M.; Teplow, D.B. Amyloid β-protein fibrillogenesis detection of a protofibrillar intermediate. J. Boil. Chem. 1997, 272, 22364–22372. [Google Scholar] [CrossRef]
  4. Fandrich, M. Oligomeric intermediates in amyloid formation: Structure determination and mechanisms of toxicity. J. Mol. Biol. 2012, 421, 427–440. [Google Scholar] [CrossRef] [PubMed]
  5. Sakono, M.; Zako, T. Amyloid oligomers: Formation and toxicity of Aβ oligomers. FEBS J. 2010, 277, 1348–1358. [Google Scholar] [CrossRef] [PubMed]
  6. Lorenzo, A.; Yankner, B.A. Beta-amyloid neurotoxicity requires fibril formation and is inhibited by congo red. Proc. Natl. Acad. Sci. USA 1994, 91, 12243–12247. [Google Scholar] [CrossRef] [PubMed]
  7. Selkoe, D.J.; Hardy, J. The amyloid hypothesis of Alzheimer’s disease at 25 years. EMBO Mol. Med. 2016, 8, 595–608. [Google Scholar] [CrossRef] [PubMed]
  8. Motter, R.; Vigo-Pelfrey, C.; Kholodenko, D.; Barbour, R.; Johnson-Wood, K.; Galasko, D.; Chang, L.; Miller, B.; Clark, C.; Green, R.; et al. Reduction of β-amyloid peptide42 in the cerebrospinal fluid of patients with Alzheimer’s disease. Ann. Neurol. 1995, 38, 643–648. [Google Scholar] [CrossRef] [PubMed]
  9. Kanai, M.; Matsubara, E.; Isoe, K.; Urakami, K.; Nakashima, K.; Arai, H.; Sasaki, H.; Abe, K.; Iwatsubo, T.; Kosaka, T.; et al. Longitudinal study of cerebrospinal fluid levels of tau, Aβ 1-40, and Aβ 1-42(43) in Alzheimer’s disease: A study in Japan. Ann. Neurol. 1998, 44, 17–26. [Google Scholar] [CrossRef] [PubMed]
  10. Welge, V.; Fiege, O.; Lewczuk, P.; Mollenhauer, B.; Esselmann, H.; Klafki, H.W.; Wolf, S.; Trenkwalder, C.; Otto, M.; Kornhuber, J.; et al. Combined CSF tau, p-tau181 and amyloid-β 38/40/42 for diagnosing Alzheimer’s disease. J. Neural Transm. (Vienna) 2009, 116, 203–212. [Google Scholar] [CrossRef] [PubMed]
  11. Verwey, N.A.; Veerhuis, R.; Twaalfhoven, H.A.; Wouters, D.; Hoozemans, J.J.; Bollen, Y.J.; Killestein, J.; Bibl, M.; Wiltfang, J.; Hack, C.E.; et al. Quantification of amyloid-beta 40 in cerebrospinal fluid. J. Immunol. Methods 2009, 348, 57–66. [Google Scholar] [CrossRef] [PubMed]
  12. Wiltfang, J.; Esselmann, H.; Bibl, M.; Smirnov, A.; Otto, M.; Paul, S.; Schmidt, B.; Klafki, H.W.; Maler, M.; Dyrks, T.; et al. Highly conserved and disease-specific patterns of carboxyterminally truncated Aβ peptides 1-37/38/39 in addition to 1-40/42 in Alzheimer’s disease and in patients with chronic neuroinflammation. J. Neurochem. 2002, 81, 481–496. [Google Scholar] [CrossRef] [PubMed]
  13. Verpillot, R.; Esselmann, H.; Mohamadi, M.R.; Klafki, H.; Poirier, F.; Lehnert, S.; Otto, M.; Wiltfang, J.; Jean-Louis, V.; Taverna, M. Analysis of amyloid-β peptides in cerebrospinal fluid samples by capillary electrophoresis coupled with LIF detection. Anal. Chem. 2011, 83, 1696–1703. [Google Scholar] [CrossRef] [PubMed]
  14. Naiki, H.; Higuchi, K.; Hosokawa, M.; Takeda, T. Fluorometric determination of amyloid fibrils in vitro using the fluorescent dye, thioflavinT. Anal. Biochem. 1989, 177, 244–249. [Google Scholar] [CrossRef]
  15. Bartolini, M.; Naldi, M.; Fiori, J.; Valle, F.; Biscarini, F.; Nicolau, D.V.; Andrisano, V. Kinetic characterization of amyloid-beta 1-42 aggregation with a multimethodological approach. Anal. Biochem. 2011, 414, 215–225. [Google Scholar] [CrossRef] [PubMed]
  16. Verpillot, R.; Otto, M.; Klafki, H.; Taverna, M. Simultaneous analysis by capillary electrophoresis of five amyloid peptides as potential biomarkers of Alzheimer’s disease. J. Chromatogr. A 2008, 1214, 157–164. [Google Scholar] [CrossRef] [PubMed]
  17. Picou, R.; Moses, J.P.; Wellman, A.D.; Kheterpal, I.; Gilman, S.D. Analysis of monomeric Aβ (1-40) peptide by capillary electrophoresis. Analyst 2010, 135, 1631–1635. [Google Scholar] [CrossRef] [PubMed]
  18. Sabella, S.; Quaglia, M.; Lanni, C.; Racchi, M.; Govoni, S.; Caccialanza, G.; Calligaro, A.; Bellotti, V.; De Lorenzi, E. Capillary electrophoresis studies on the aggregation process of β-amyloid 1-42 and 1-40 peptides. Electrophoresis 2004, 25, 3186–3194. [Google Scholar] [CrossRef] [PubMed]
  19. Colombo, R.; Carotti, A.; Catto, M.; Racchi, M.; Lanni, C.; Verga, L.; Caccialanza, G.; De Lorenzi, E. CE can identify small molecules that selectively target soluble oligomers of amyloid β protein and display antifibrillogenic activity. Electrophoresis 2009, 30, 1418–1429. [Google Scholar] [CrossRef] [PubMed]
  20. Brinet, D.; Kaffy, J.; Oukacine, F.; Glumm, S.; Ongeri, S.; Taverna, M. An improved capillary electrophoresis method for in vitro monitoring of the challenging early steps of Aβ 1-42 peptide oligomerization: Application to anti-Alzheimer’s drug discovery. Electrophoresis 2014, 35, 3302–3309. [Google Scholar] [CrossRef] [PubMed]
  21. Paracha, S.; Hestekin, C. Field amplified sample stacking of amyloid beta (1-42) oligomers using capillary electrophoresis. Biomicrofluidics 2016, 10, 033105. [Google Scholar] [CrossRef] [PubMed]
  22. Pryor, N.E.; Moss, M.A.; Hestekin, C.N. Capillary electrophoresis for the analysis of the effect of sample preparation on early stages of Aβ 1-40 aggregation. Electrophoresis 2014, 35, 1814–1820. [Google Scholar] [CrossRef] [PubMed]
  23. Picou, R.A.; Kheterpal, I.; Wellman, A.D.; Minnamreddy, M.; Ku, G.; Gilman, S.D. Analysis of Aβ (1-40) and Aβ (1-42) monomer and fibrils by capillary electrophoresis. J. Chromatogr. B Anal. Technol. Biomed. Life Sci. 2011, 879, 627–632. [Google Scholar] [CrossRef] [PubMed]
  24. Kato, M.; Kinoshita, H.; Enokita, M.; Hori, Y.; Hashimoto, T.; Iwatsubo, T.; Toyo’oka, T. Analytical method for β-amyloid fibrils using CE-laser-induced fluorescence and its application to screening for inhibitors of β-amyloid protein aggregation. Anal. Chem. 2007, 79, 4887–4891. [Google Scholar] [CrossRef] [PubMed]
  25. Picou, R.A.; Schrum, D.P.; Ku, G.; Cerqua, R.A.; Kheterpal, I.; Gilman, S.D. Separation and detection of individual Aβ aggregates by capillary electrophoresis with laser-induced fluorescence detection. Anal. Biochem. 2012, 425, 104–112. [Google Scholar] [CrossRef] [PubMed]
  26. Duffy, C.F.; McEathron, A.A.; Arriaga, E.A. Determination of individual microsphere properties by capillary electrophoresis with laser-induced fluorescence detection. Electrophoresis 2002, 23, 2040–2047. [Google Scholar] [CrossRef]
  27. Gunasekera, N.; Musier-Forsyth, K.; Arriaga, E. Electrophoretic behavior of individual nuclear species as determined by capillary electrophoresis with laser-induced fluorescence detection. Electrophoresis 2002, 23, 2110–2116. [Google Scholar] [CrossRef]
  28. Fuller, K.M.; Arriaga, E.A. Analysis of individual acidic organelles by capillary electrophoresis with laser-induced fluorescence detection facilitated by the endocytosis of fluorescently labeled microspheres. Anal. Chem. 2003, 75, 2123–2130. [Google Scholar] [CrossRef] [PubMed]
  29. Dziubakiewicz, E.; Buszewski, B. Capillary electrophoresis of microbial aggregates. Electrophoresis 2014, 35, 1160–1164. [Google Scholar] [CrossRef] [PubMed]
  30. Breadmore, M.C. Recent advances in enhancing the sensitivity of electrophoresis and electrochromatography in capillaries and microchips. Electrophoresis 2007, 28, 254–281. [Google Scholar] [CrossRef] [PubMed]
  31. Kitagawa, F.; Otsuka, K. Recent applications of on-line sample preconcentration techniques in capillary electrophoresis. J. Chromatogr. A 2014, 1335, 43–60. [Google Scholar] [CrossRef] [PubMed]
  32. Svobodova, Z.; Reza Mohamadi, M.; Jankovicova, B.; Esselmann, H.; Verpillot, R.; Otto, M.; Taverna, M.; Wiltfang, J.; Viovy, J.L.; Bilkova, Z. Development of a magnetic immunosorbent for on-chip preconcentration of amyloid β isoforms: Representatives of Alzheimer’s disease biomarkers. Biomicrofluidics 2012, 6. [Google Scholar] [CrossRef] [PubMed]
  33. Mai, T.D.; Pereiro, I.; Hiraoui, M.; Viovy, J.L.; Descroix, S.; Taverna, M.; Smadja, C. Magneto-immunocapture with on-bead fluorescent labeling of amyloid-β peptides: Towards a microfluidized-bed-based operation. Analyst 2015, 140, 5891–5900. [Google Scholar] [CrossRef] [PubMed]
Figure 1. Analysis of 19-day incubated 100 µM Aβ 1-40 and of un-incubated Ringer. Running buffer 50 mM ammonium acetate pH 4.7 + 10 µM thioflavine T. Injection 0.5 psi/10 s. Note the spikes (arrows) due to the peptide.
Separations 05 00002 g001
Figure 2. Successive analysis of 30 kDa ultra-filtered Ringer. Running buffer as in Figure 1. Injection 0.5 psi/20 s. Spikes (arrow) appeared in the third run and became abundant in the fourth run.
Separations 05 00002 g002
Figure 3. Analysis of 13-day incubated Aβ 1-40. Running buffer as in Figure 1. Hydrodynamic injection (0.5 psi) under duration ranging from 10 to 160 s, leading to percentage of sample plug length vs. effective capillary length ranging from 1% to 16%. Major spikes can be observed only with a ratio ≥ 8% (injection time ≥ 80 s). The number of spikes seems to increase according to the lengthening of injection time.
Separations 05 00002 g003
Figure 4. Effects of thioflavine T concentration in the running buffer on: (A): the sum of spike heights; (B): the mean height of spikes; (C): the background fluorescence and (D): the signal/background ratio. Aβ 1-40 incubated for 20 days in saline. Running buffer: 50 mM pH 3.0 citrate buffer containing thioflavine T in the 0.01 µM to 80 µM range. Injection 0.5 psi/80 s. Curve fitting: (A,B): non-linear fitting, one phase association; (C): linear regression; (D): non-linear fitting, one phase association (from 0 to 20 µM) and non-linear fitting, one phase decay (from 20 to 80 µM).
Separations 05 00002 g004
Figure 5. Effect of injection volume (expressed as percentage of sample plug length to effective capillary length) on: (A): the number of spikes; (B): the number of spikes higher than 0.1 RFU; (C): the number of spikes higher than 1 RFU; (D): the average height of spikes and (E): the sum of spikes height, when analyzing 13-day incubated Aβ 1-40. Running buffer as in Figure 1. Curve fitting: (A): linear regression; (BE): non-linear fitting, plateau followed by one phase association.
Separations 05 00002 g005
Figure 6. Capillary electrophoresis separation of 18-day incubated 2, 5, 10 or 20 µM Aβ 1-40. Effect of Aβ 1-40 concentration during an 18-day incubation on the capillary electrophoresis separation. The concentration of sample was 2, 5, 10 and 20 µM. The analysis of a control incubated Ringer is also included. Running buffer as in Figure 1. Injection 2 psi/80 s.
Separations 05 00002 g006
Figure 7. Effect of Aβ 1-40 concentration during an 18-day incubation on the sum of spikes height (top) and on the number of spikes (bottom) obtained during the CE-LIF separation performed after hydrodynamic injection (2 psi/80 s). Running buffer as in Figure 1. Curve fitting: top: linear regression; bottom: non-linear fitting, one phase association.
Separations 05 00002 g007
Figure 8. Effect of the concentration of 18 days incubated Aβ 1-40 on the migration time of spikes. (A): percentage of spikes before the drop in fluorescence due to the absence of thioflavine T in the sample. (B): percentage of spikes after the drop. (C): percentage of spikes migrating during the drop. (D): average migration time of the spikes. Running buffer as in Figure 1. Injection 2 psi/80 s. Curve fitting; (A): non-linear fitting, one phase decay; (B): non-linear fitting, one phase association; (C): linear regression; (D): non-linear fitting, one phase association.
Separations 05 00002 g008

