Article

Development of an Automated Method for Selected Aromas of Red Wines from Cold-Hardy Grapes Using Solid-Phase Microextraction and Gas Chromatography-Mass Spectrometry-Olfactometry

by
Lingshuang Cai
1,2,
Somchai Rice
1,3,
Jacek A. Koziel
1,3,4,* and
Murlidhar Dharmadhikari
4
1
Department of Agricultural and Biosystems Engineering, Iowa State University, Ames, IA 50011, USA
2
DuPont Crop Protection, Stine-Haskell Research Center, Newark, DE 19711, USA
3
Interdepartmental Toxicology Graduate Program, Iowa State University, Ames, IA 50011, USA
4
Department of Food Science and Human Nutrition, Iowa State University, Ames, IA 50011, USA
*
Author to whom correspondence should be addressed.
Separations 2017, 4(3), 24; https://doi.org/10.3390/separations4030024
Submission received: 1 June 2017 / Revised: 15 June 2017 / Accepted: 30 June 2017 / Published: 5 July 2017
(This article belongs to the Special Issue Trends in Microextraction Techniques for Sample Preparation)

Abstract

:
The aroma profile of red wine is complex and research focusing on aroma compounds and their links to viticultural and enological practices is needed. Current research is limited to wines made from cold-hardy cultivars (interspecific hybrids of vinifera and native N. American grapes). The objective of this research was to develop a fully automated solid phase microextraction (SPME) method, using tandem gas chromatography-mass spectrometry (GC-MS)-olfactometry for the simultaneous chemical and sensory analysis of volatile/semi-volatile compounds and aroma in cold-hardy red wines. Specifically, the effects of SPME coating selection, extraction time, extraction temperature, incubation time, sample volume, desorption time, and salt addition were studied. The developed method was used to determine the aroma profiles of seven selected red wines originating from four different cold-hardy grape cultivars. Thirty-six aroma compounds were identified from Maréchal Foch, St. Croix, Frontenac, Vincent, and a Maréchal Foch/Frontenac blend. Among these 36 aroma compounds, isoamyl alcohol, ethyl caproate, benzeneethanol, ethyl decanoate, and ethyl caproate are the top five most abundant aroma compounds. Olfactometry helps to identify compounds not identified by MS. The presented method can be useful for grape growers and wine makers for the screening of aroma compounds in a wide variety of wines and can be used to balance desired wine aroma characteristics.

Graphical Abstract

1. Introduction

In order to understand the aroma of wine and make a marketable product, it is necessary to separate, identify, and quantify the chemical compounds that impart these aromas. Aromas to note are the primary (varietal aroma), secondary (aromas due to fermentation from yeasts), and bouquet (aromas due to aging and storage) aromas. The pleasant volatiles in wines are due to the presence of higher aliphatic alcohols, ethyl esters, and acetates [1,2]. Wine aroma increased in complexity after malo-lactic fermentation (MLF), which produces changes in the carbonyl compounds [3]. Wines that have undergone MLF can be associated with herbaceous aromas from aliphatic aldehydes [4,5] or buttery aromas from diacetyl [6]. Wine can also have off odors due to volatile sulfur compounds, described as garlic, onion, or cabbage [7]. Vinylphenols have been described as phenolic, medicinal, smoky, spicy, and clove-like [8,9]. An experienced palate can often distinguish the “foxy” characteristic of the main North American vines (Vitis labrusca and Vitis rotundifolia) from vinifera vines caused by methyl anthranilate [9,10].
Cold climate grapes are newer, and the aroma profiles are less characterized than Vinifera varieties. The identification and quantification of the most aromatic compounds can help the industry maximize the aroma quality in these wines. The varietal flavor profile was used to demonstrate good examples of wine production and the best grape growing and innovative vinification techniques. The first step in the aroma analysis of wines is to extract volatile organic compounds (VOCs). Solid phase microextraction (SPME) coupled with gas chromatography-mass spectrometry (GC-MS) is useful in extracting and pre-concentrating VOCs in wine. The inception of GC-olfactometry (GC-O) in 1964 allowed researchers to link an aroma descriptor to these separated compounds [11]. Although many detectors have been used to identify and quantify aroma compounds from wine, MS is the most widely used [12]. A review and summary of many experimental parameters are available elsewhere [12,13].
In this research, an automated headspace SPME-GCMS-O method was developed and the aroma profiles of seven cold-hardy wine samples were investigated. The chemicals in selected cold-hardy wines were isolated and tentatively identified by matching the mass spectral and aroma character. The grape and wine industry has expanded exponentially in cold climates. Therefore, there is a need to research aroma compounds and their links to grape growing and wine making practices in cold climates. Such information can be used for the monitoring of fruit maturity, developing the best viticultural and wine making practices, and the development of appropriate wine styles specific to cold climates. The flavor and aroma profiling of cold-hardy wine enables the development of high quality and unique wines. Therefore, a method was developed to evaluate the full chemical and sensory aroma profile of wine from cold climate grapes.

2. Materials and Methods

2.1. Samples, Internal Standard, SPME

Seven different red wines were obtained from various wineries in Iowa. Varieties included two Maréchal Foch from separate wineries, two Frontenac from separate wineries, a St. Croix, a Vincent, and a Maréchal Foch/Frontenac blend. Wines were not stored after initial opening for analysis. 3-nonanone (99%), CAS 925-78-0 (Sigma-Aldrich, St. Louis, MO, USA), was used as an internal standard (IS) for the semi-quantification of aroma compounds. 3-nonanone was chosen because the compound is odor-active and not present in these wine samples. The final concentration of IS in wine (0.206 mg/L) was achieved by adding 10 µL of IS in ethanol (82.5 mg/L) to each 4 mL of wine. Each wine sample bottle was opened immediately before each analysis, and triplicate runs were performed for each experiment (n = 3). SPME fibers with seven different coatings were purchased from Sigma-Aldrich (St. Louis, MO, USA). These coatings included: 50/30 µm Divinylbenzene (DVB)/Carboxen (CAR)/Polydimethylsiloxane (PDMS), 100 µm PDMS, 7 µm PDMS, 85 µm Polyacrylate (PA), 65 µm PDMS/DVB, 70 µm Carbowax (CW)/DVB, and 85 µm CAR/PDMS. All SPME fibers were 1 cm in length. Details of SPME fiber cores, coatings, and the internal structure can be found elsewhere [14].
The optimized method used for the automated analysis of wine aroma used a 1 cm 50/30 µm DVB/CAR/PDMS SPME fiber, 10 min extraction time at 50 °C, and 2 min desorption in the heated GC inlet. A 10 min incubation in the heated agitator was used to equilibrate VOCs in the headspace of 4 mL of the wine sample in a 10 mL vial, facilitated by the addition of 2 g of sodium chloride.

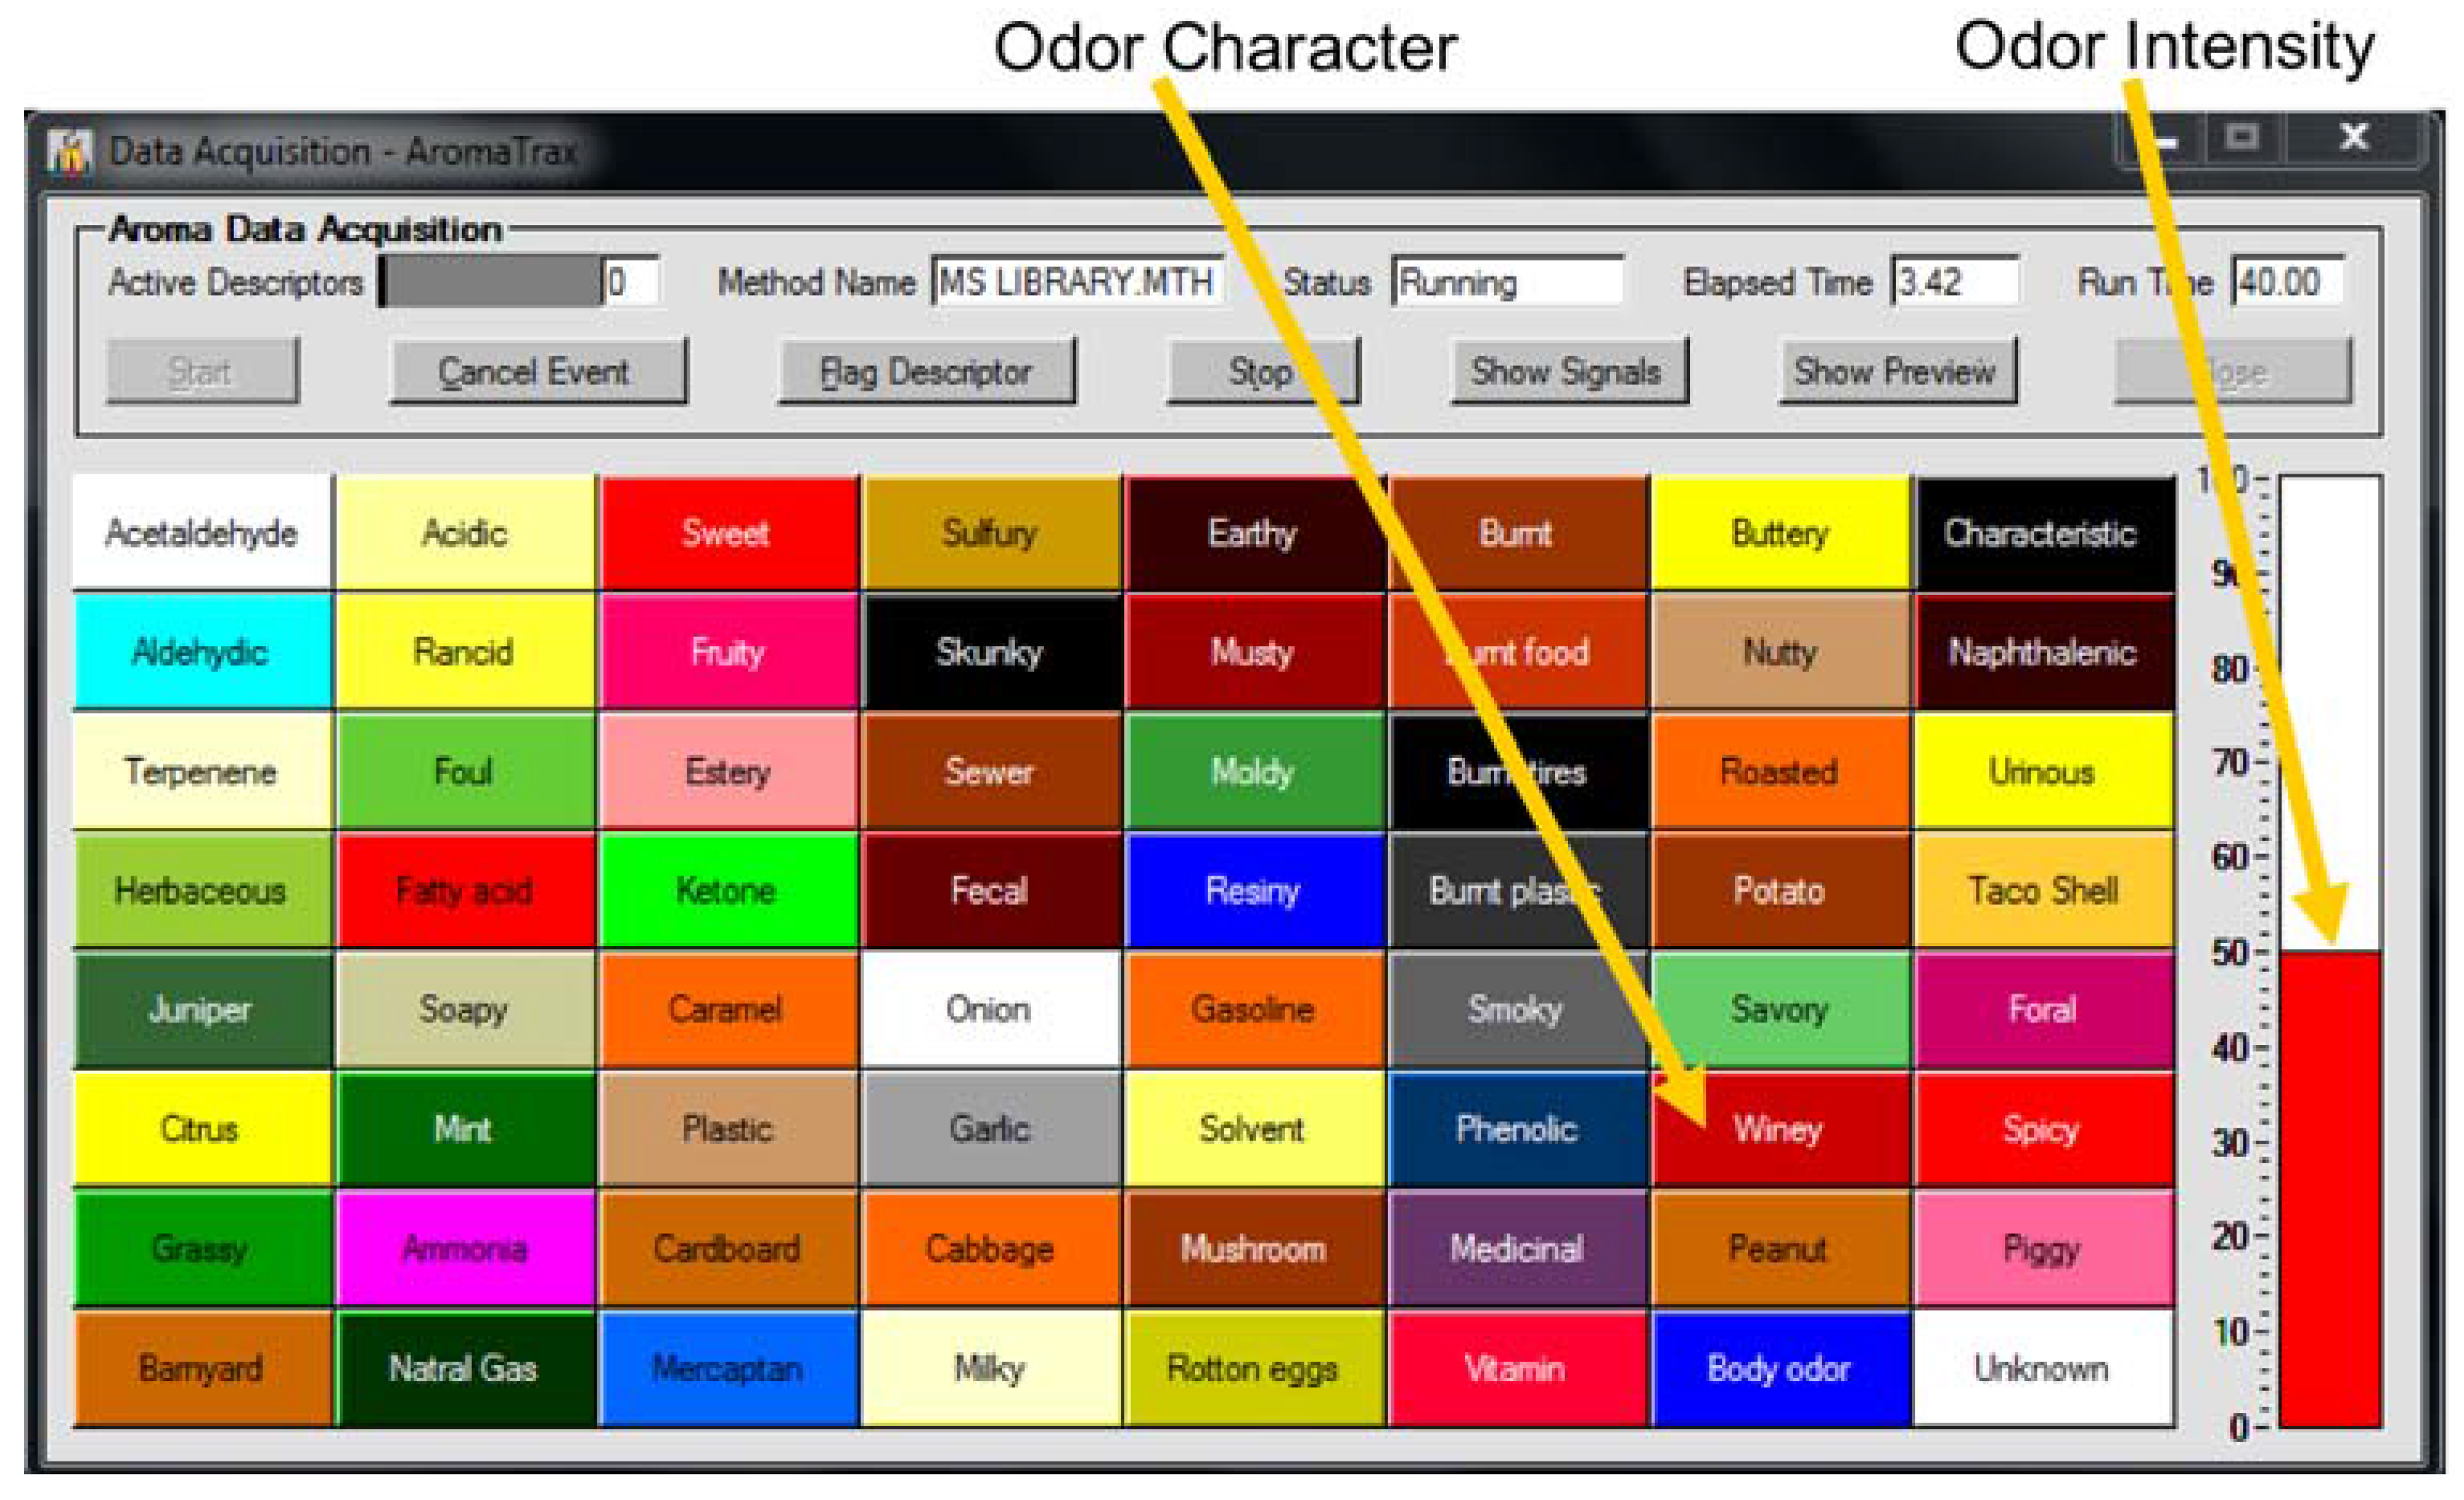
2.2. GC-MS-Olfactometry System

The analysis was performed on a standard 6890N GC/5973Network Platform (Agilent Technologies, Santa Clara, CA, USA) and a CTC CombiPal™ autosampler equipped with a heated agitator (Trajan Scientific, Pflugerville, TX, USA). A constant agitation speed of 500 rpm was used throughout this research, so that extraction would only depend on the SPME fiber geometry and diffusion coefficients of the aroma compounds. The instrument was modified after marketing with a Dean’s switch for heartcutting, the ability for cryogenic focusing, FID, and the olfactometry port. A detailed schematic of the instrument can be found elsewhere [15]. The GC contains two columns connected in series. The first non-polar column was BPX-5 stationary phase with the following dimensions: 43.5 m length × 0.53 mm ID × 1.0 μm film thickness (SGE Analytical Science, by Trajan, Austin, TX, USA). The second cross-linked polar column was BP-20 (Wax) with the following dimensions: 25 m length × 0.53 mm ID × 1.0 μm film thickness (SGE Analytical Science, by Trajan, Austin, TX, USA). A constant pressure of 5.8 psi was provided at the midpoint between the first and second column using MultiTrax™ V.6.00 (Microanalytics, a Volatile Analysis company, Round Rock, TX, USA) system automation and MSD ChemStation™ E.01.01.335 data acquisition software (Agilent Technologies, Santa Clara, CA, USA). Additional analysis to obtain the total compound chromatogram (TCC) was done using a MassHunter Workstation (Agilent, Santa Clara, CA, USA). Flow from the second analytical column was directed to the single quadrupole mass selective detector and the olfactometry port by fixed restrictor tubing in an open-split interface.
For this research, a full heartcut was utilized from 0.05 to 35.00 min. In other words, the sample flow was first directed through the non-polar column, and then the second polar column, yielding results similar to a mid-polarity GC separation on a long column. Therefore, retention indices were not used for identification in this research, due to the configuration of the two GC capillary columns connected in series.
The following instrument parameters were used: GC inlet temperature, 260 °C; FID, 280 °C; column, 40 °C initial, 3.0 min hold, 7 °C per min ramp, 220 °C final, 11.29 min hold; carrier gas, UHP helium (99.999%) with an inline filter trap. The mass detector was operated in electron ionization (EI) mode with an ionization energy of 70 eV. The mass detector ion source and quadrupole were held at 230 °C and 150 °C, respectively. Full spectrum scans were collected with the mass filter set from m/z 33 to m/z 450. The MS was auto-tuned daily before analysis. The use of a full scan for data acquisition allowed for library search techniques using NIST05 and Wiley 6th edition mass spectral databases.
Olfactometry data was generated using AromaTrax™ V.6.61 software (Microanalytics, a Volatile Analysis company, Grant, AL, USA). Recorded parameters included an aroma descriptor and the perceived intensity. The editable descriptor panel is shown in Figure 1. The area under the peak of each aroma note in the aromagram is calculated as width × intensity × 100, where the width is the length of time that the aroma persisted in minutes. The sum of the areas under the peaks in the aromagram is the total odor, a dimensionless value used to analyze the total aroma detected by the human nose.

3. Results

3.1. SPME Optimization

3.1.1. SPME Coating Selection

Seven commercially available SPME coatings were selected for optimization in the extraction of aroma compounds from Iowa red wines (Table 1). The response of the mass spectrometer to volatiles detected throughout the run was used to determine the extraction efficiency of the SPME coating. It was shown that the use of a 50/30 µm DVB/CAR/PDMS SPME coating was most appropriate for the rest of the experiments. In Table 1, a coating with a number lower than 100 indicates a lower extraction efficiency for that analyte when compared to 50/30 µm DVB/CAR/PDMS. These analytes spanned the entire chromatographic run, representing the range of analytes in wine aroma.

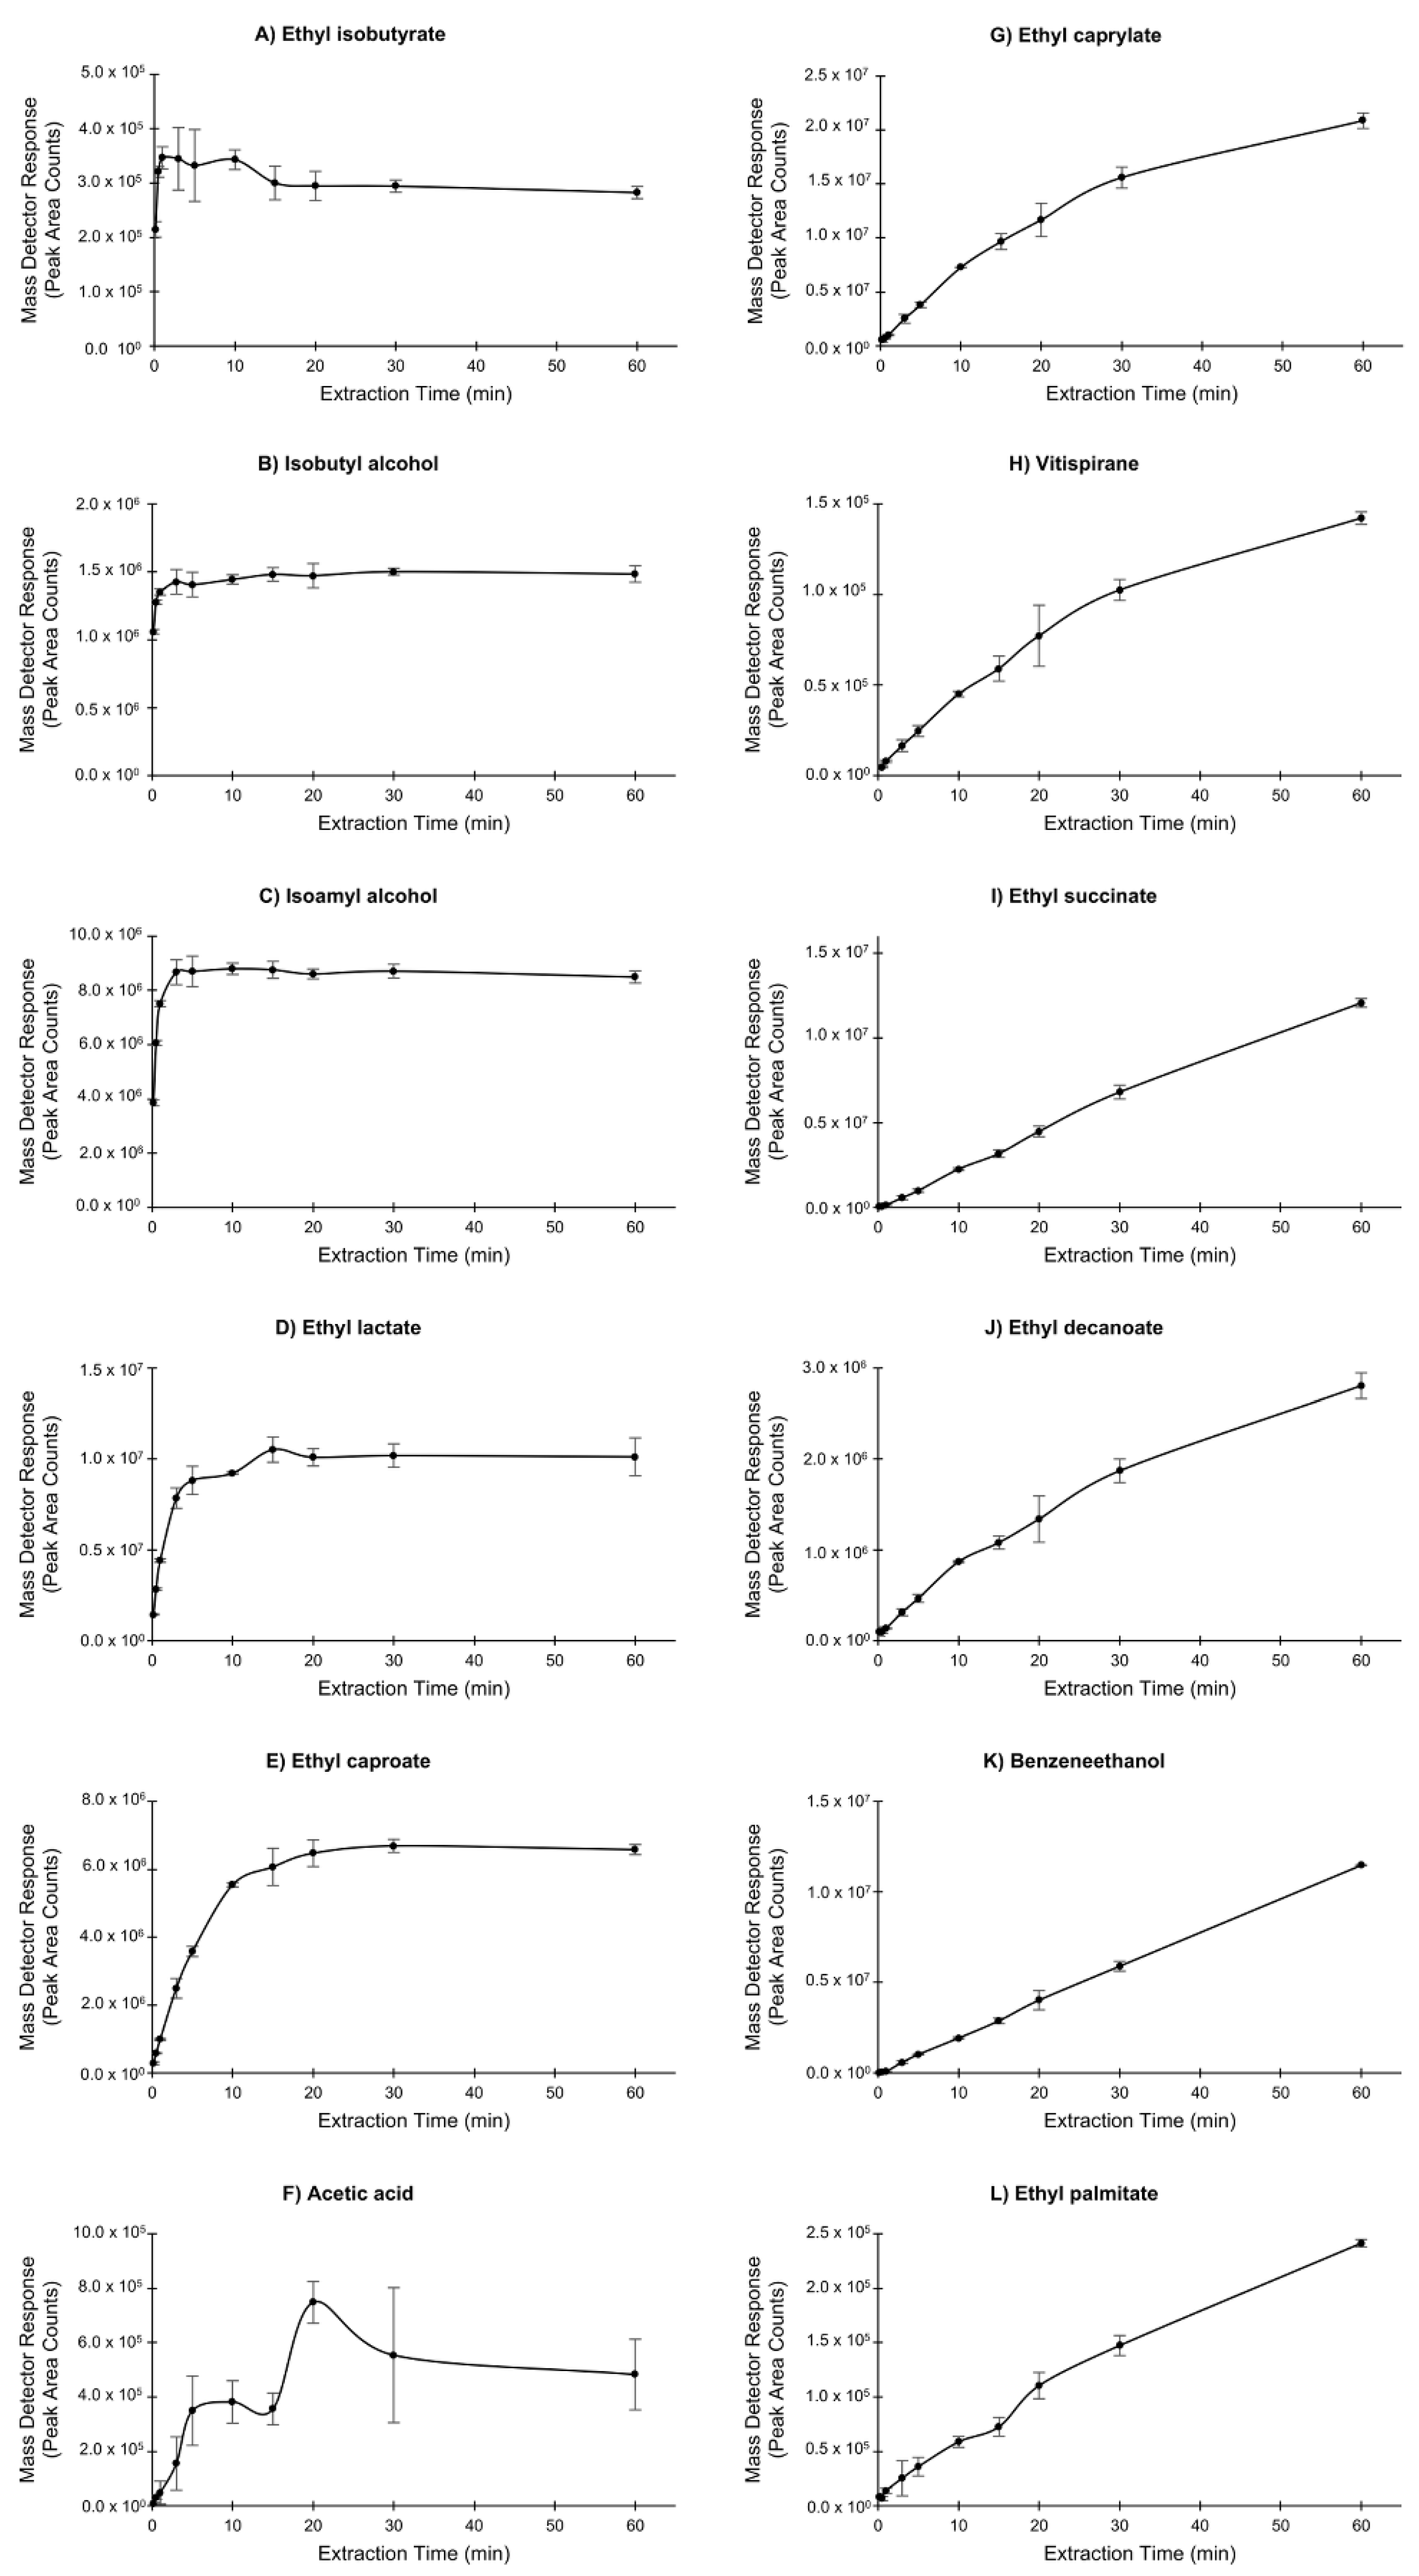
3.1.2. Extraction Time

Different extraction times were tested using the autosampler. These times were 10 s, 30 s, 1 min, 3 min, 5 min, 10 min, 15 min, 20 min, 30 min, and 60 min. Plots of the mass extracted versus the extraction time varied in shape. The profiles were typically linear or logarithmic, with the exception of acetic acid (Figure 2). Equilibrium was reached for most compounds (i.e., the logarithmic curve had started to flatten out), and was not excessively long, with a figure of about 10 min. Additional SPME fiber sorption capacity limitations were noticed after 10 min, for example, ethyl isobutyrate, ethyl lactate, and acetic acid. An extraction time of 10 min was chosen to avoid these possible interactions due to competitive adsorption and apparent analyte displacement after 10 min.

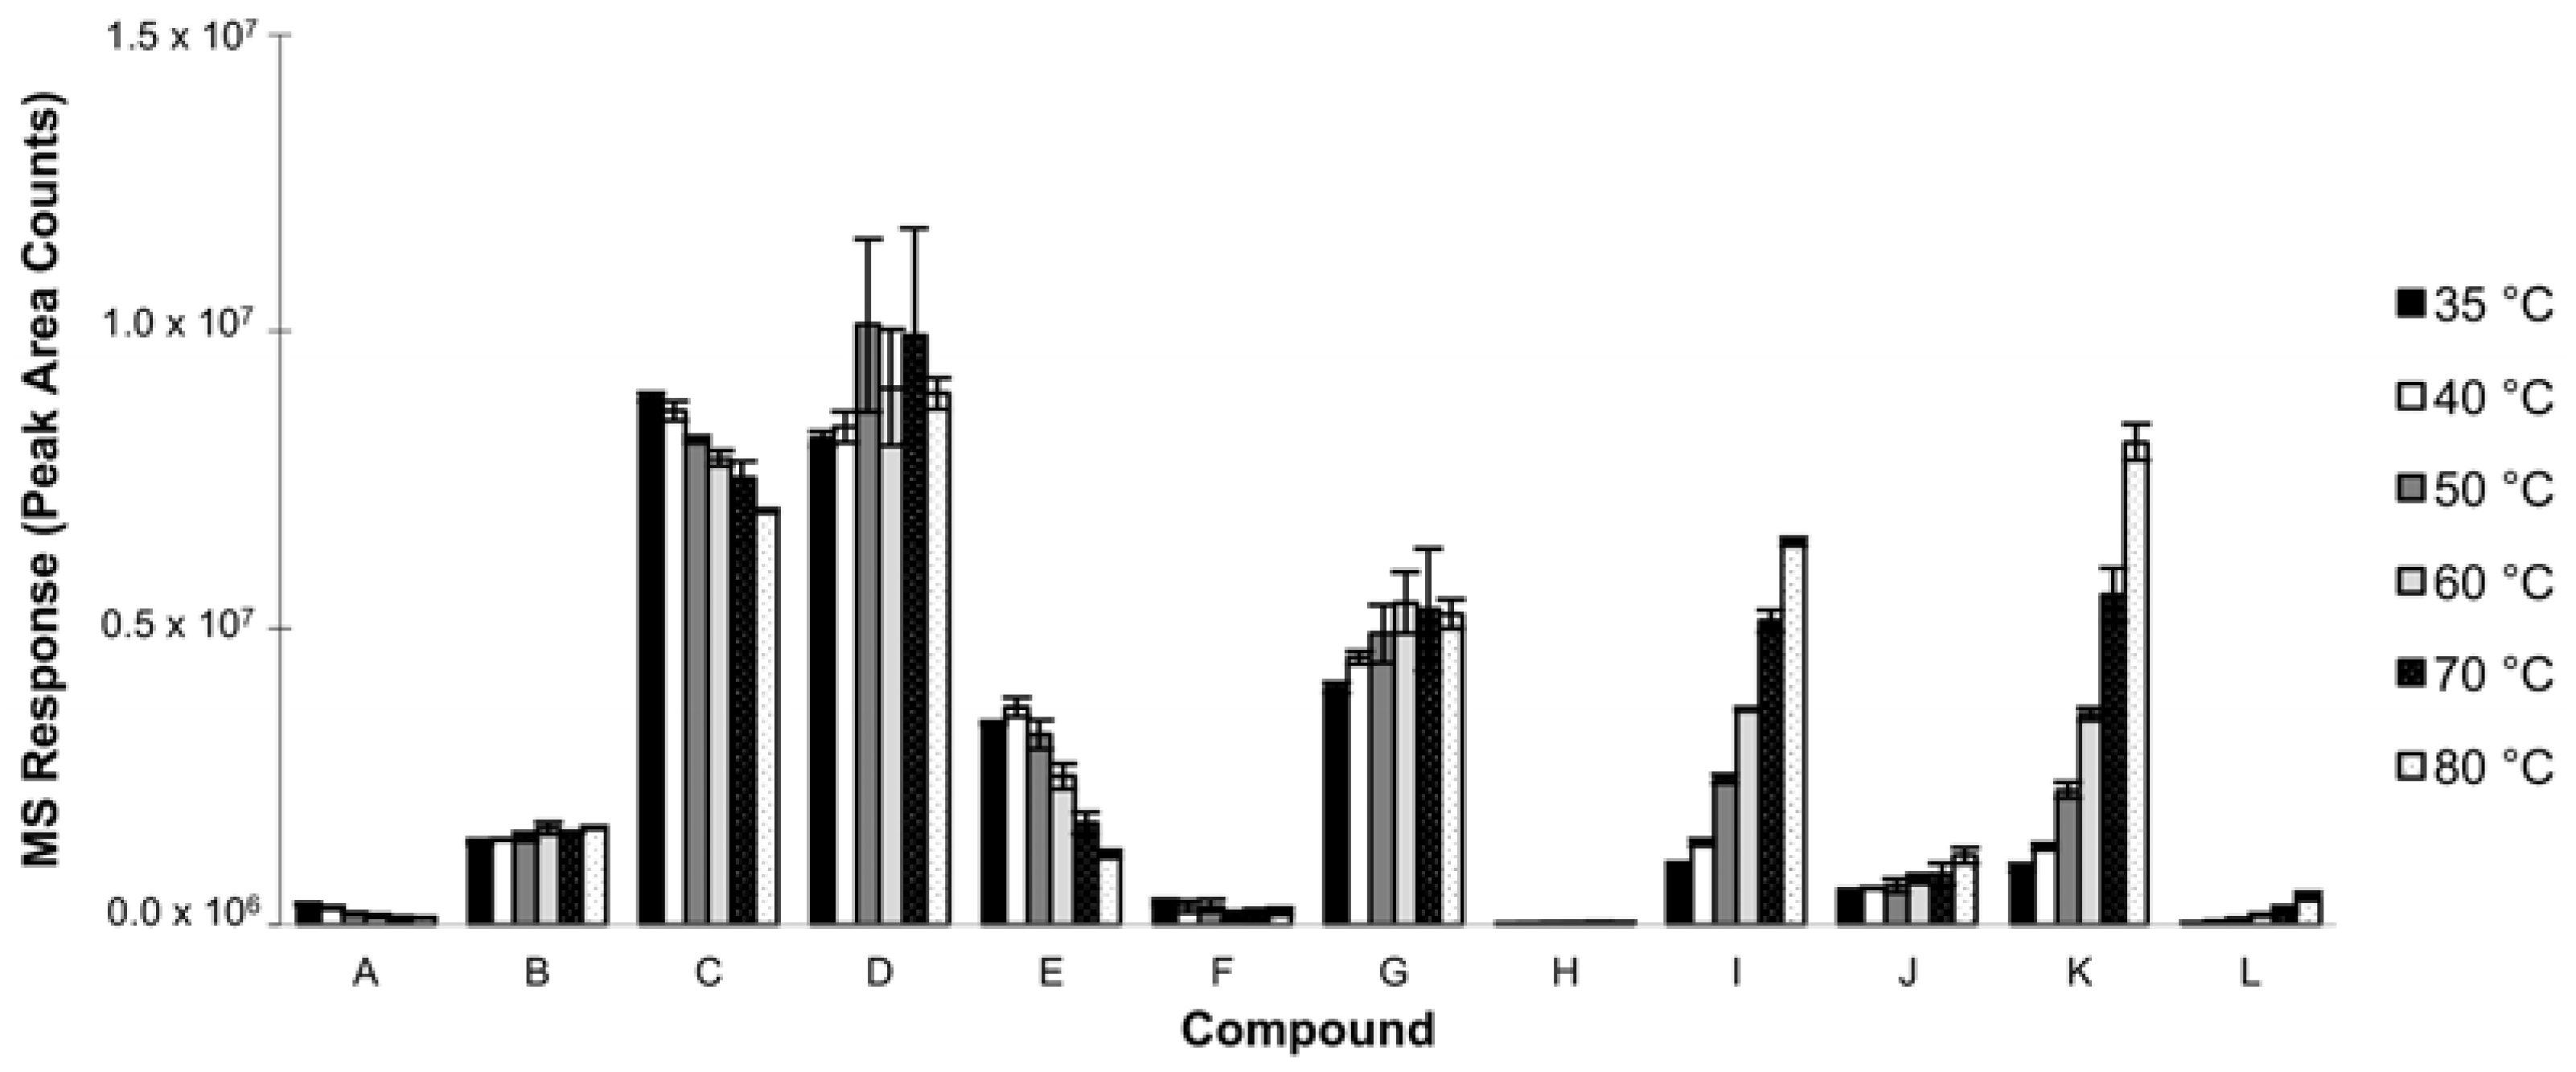
3.1.3. Extraction Temperature

Extraction times can be shortened by the efficient use of a higher extraction temperature, as seen in Figure 3. Masses extracted of ethyl caprylate, ethyl succinate, ethyl decanoate, benzeneethanol, and ethyl palmitate increased with a higher temperature. Higher temperatures can also decrease the amount of analyte extracted, as observed in ethyl isobutyrate, isoamyl alcohol, and ethyl caproate. Extraction temperatures of 35, 40, 50, 60, 70, and 80 °C were investigated. To efficiently extract the range of volatiles and semi-volatiles, the optimal temperature chosen for this experiment was 50 °C.

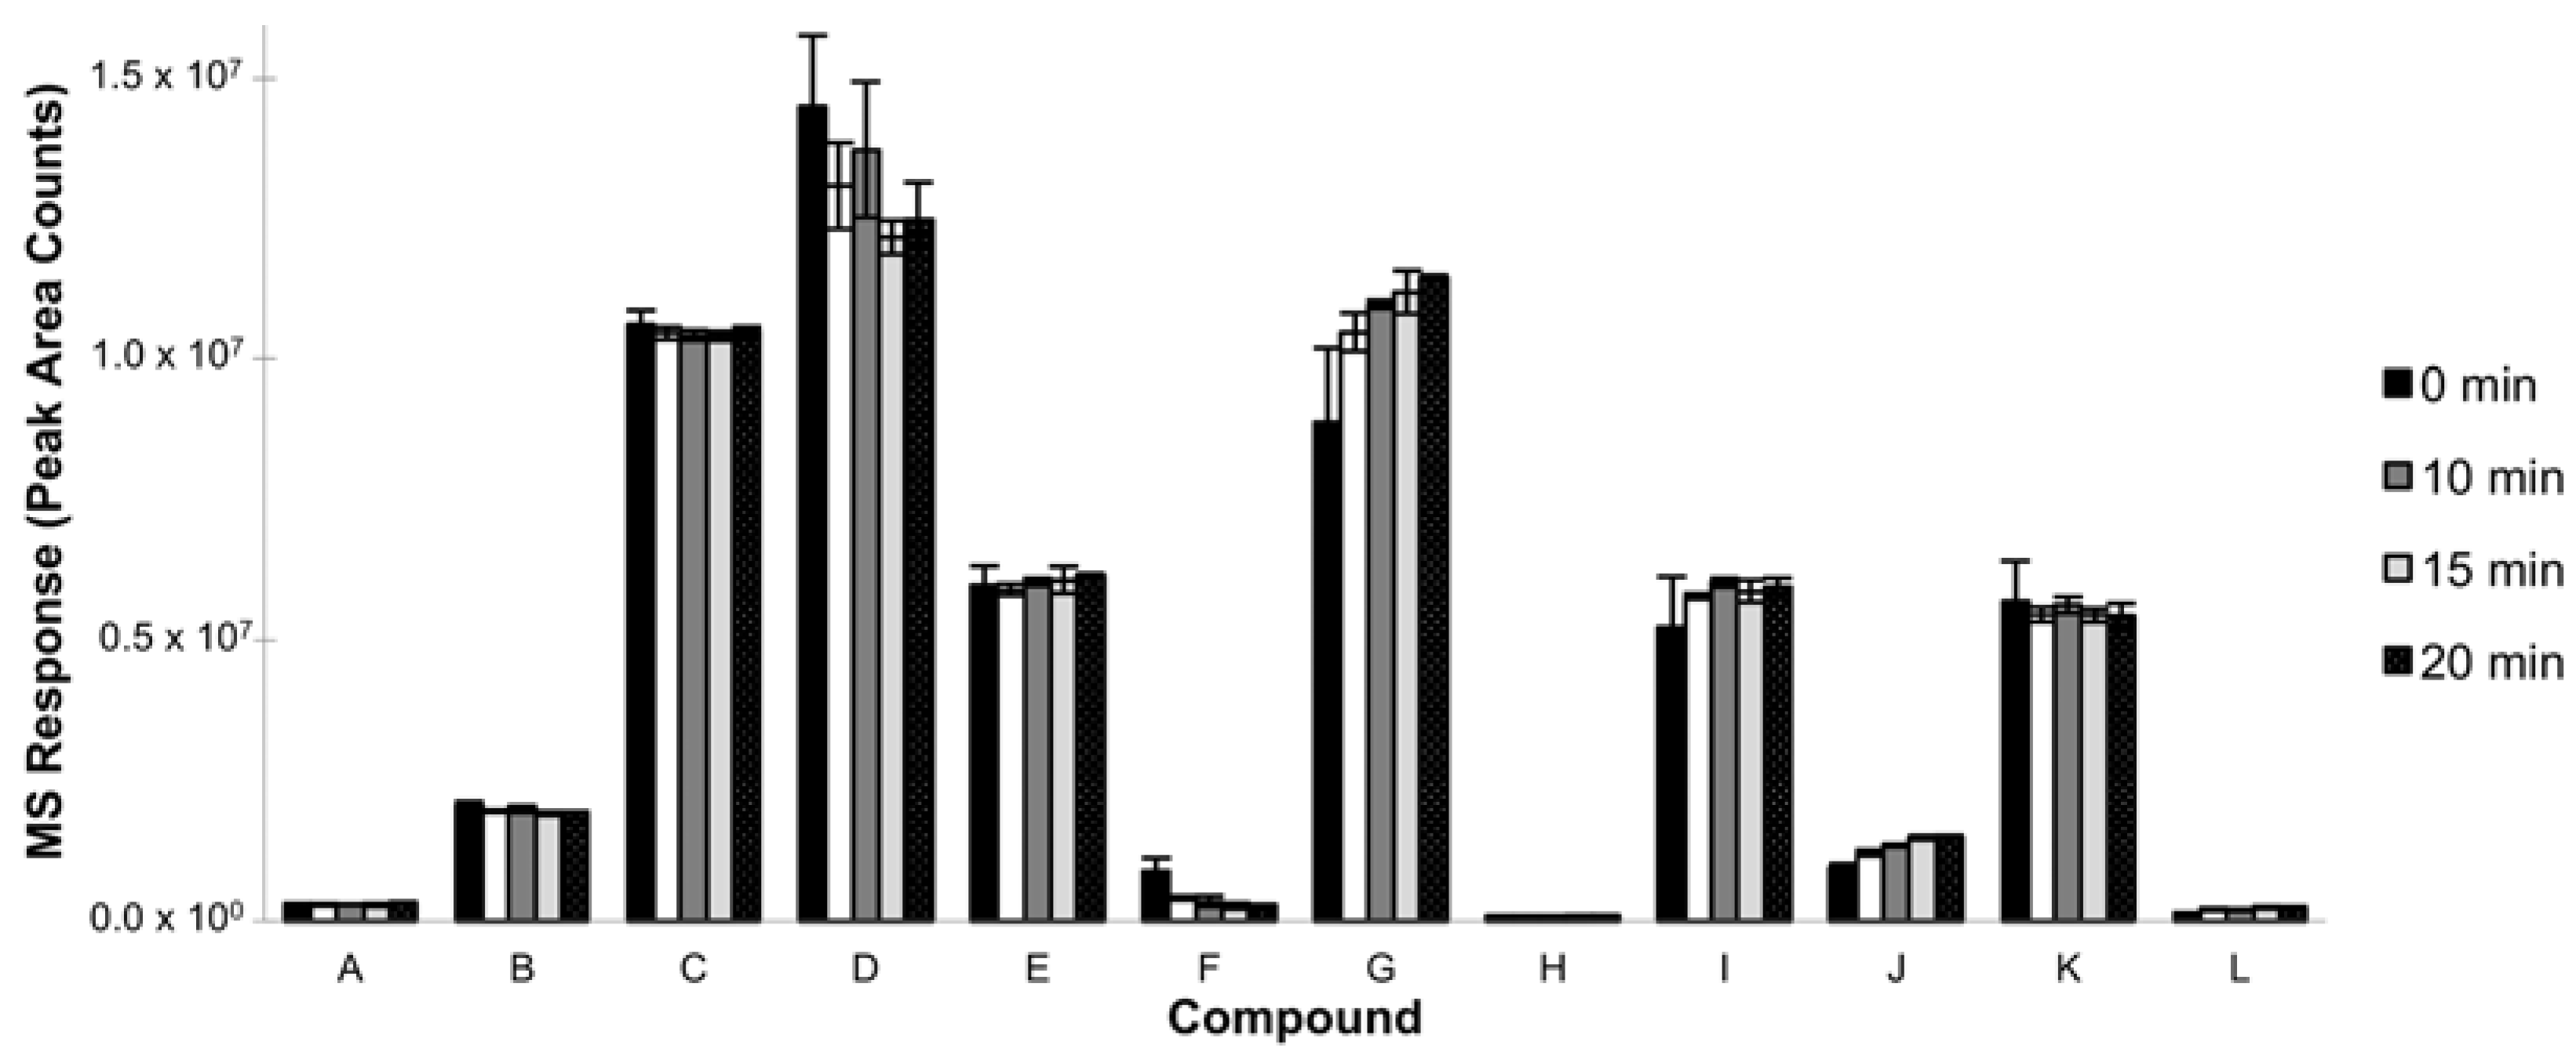
3.1.4. Incubation Time

An extended incubation time allows for volatiles to equilibrate in the headspace before sampling. This was useful in the extraction of less volatile compounds in the wine sample, such as ethyl caprylate or ethyl decanoate (Figure 4). The incubation time did not have a large effect on the extraction efficiency of more volatile compounds such as ethyl isobutyrate, isobutyl alcohol, and isoamyl alcohol, likely due to their abundance in the headspace of the sample. Incubation times of 0, 5 min, 10 min, 15 min, and 20 min were investigated to establish the equilibrium of analytes in the headspace. The incubation time of 10 min was chosen, as determined by the extracted mass of semi-volatiles.

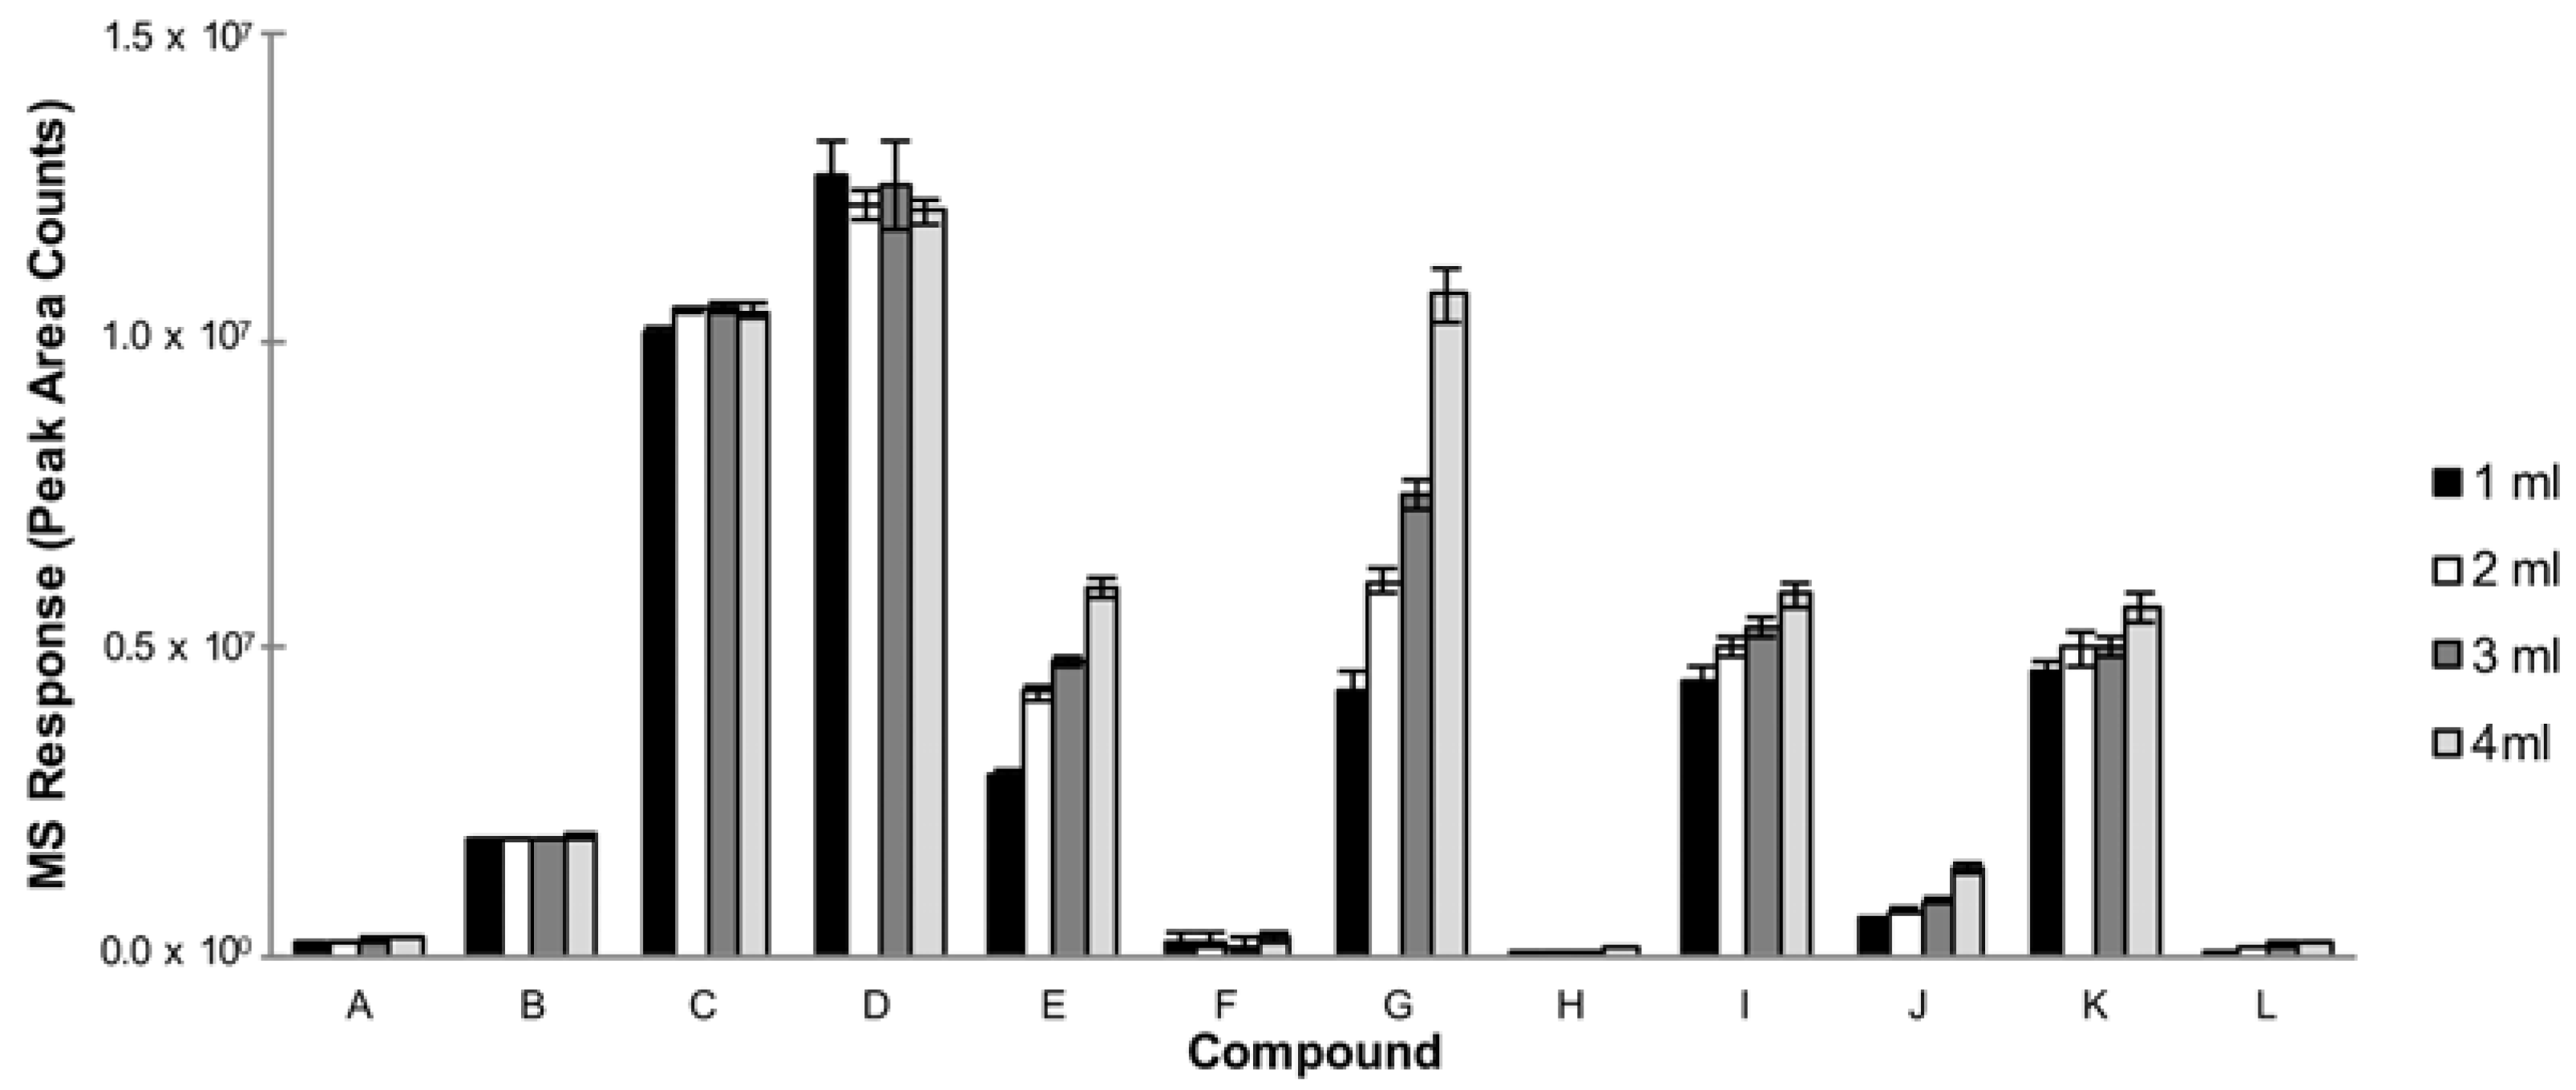
3.1.5. Sample Volume

A 10 mL glass amber vial was used with the autosampler. The sample volume was investigated to maximize the mass extracted from the headspace by SPME. A higher volume of wine would yield a greater mass of volatiles in the headspace, up to the equilibrium. This was observed as an increase in the mass extracted was directly proportional to an increase in the sample volume in ethyl caproate, ethyl caprylate, ethyl succinate, ethyl decanoate, benzeneethanol, and ethyl palmitate (Figure 5). From this experiment, a 4 mL sample volume in a 10 mL vial was chosen for the method.

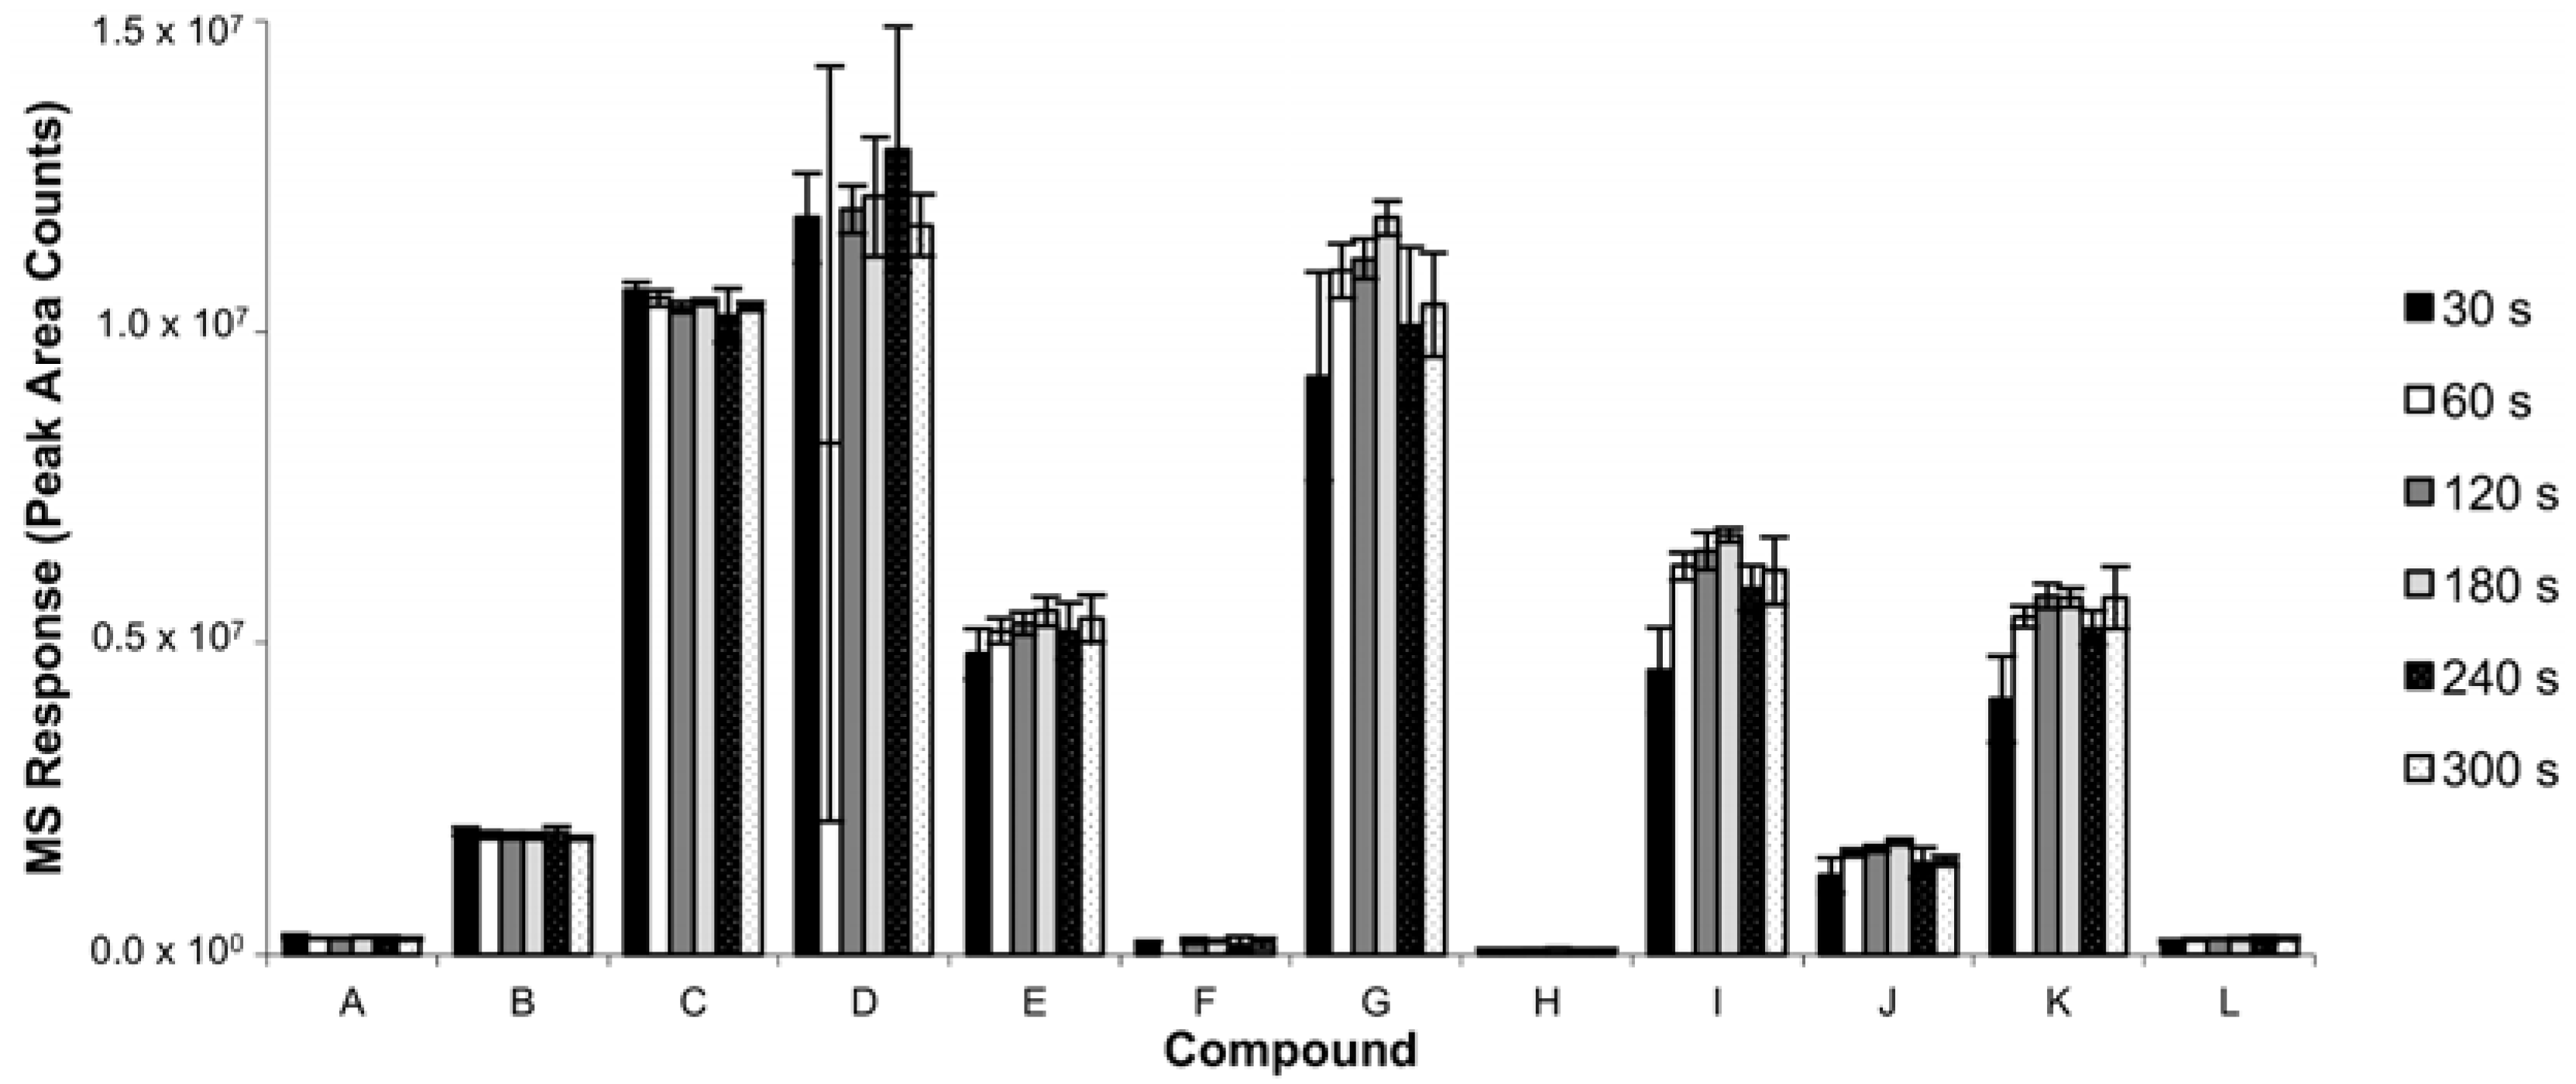
3.1.6. Desorption Time

Optimizing the desorption time maximizes the transfer of analytes into the instrument for analysis. Desorption times of 30 s, 60 s, 120 s, 180 s, 240 s, and 300 s were used to determine the minimum time needed to desorb analytes from the SPME fiber (Figure 6). A desorption time of 120 s was chosen in a 260 °C injector. The inlet pressure was constant and determined by the pressure needed to maintain balance with the midpoint pressure.

3.1.7. Salt Addition

The addition of sodium chloride was used to adjust the ionic strength of the wine sample. This salting-out effect can help drive analytes to the SPME coating with increasing amounts of salt. The addition of 0.5, 1.0, 1.5, 2, and 2.5 g of salt was investigated to maximize the extraction efficiency (Figure 7). For this experiment, a 2.0 g addition of sodium chloride was chosen for the method.

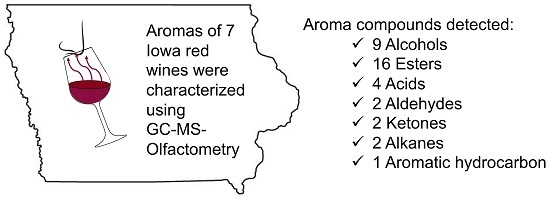
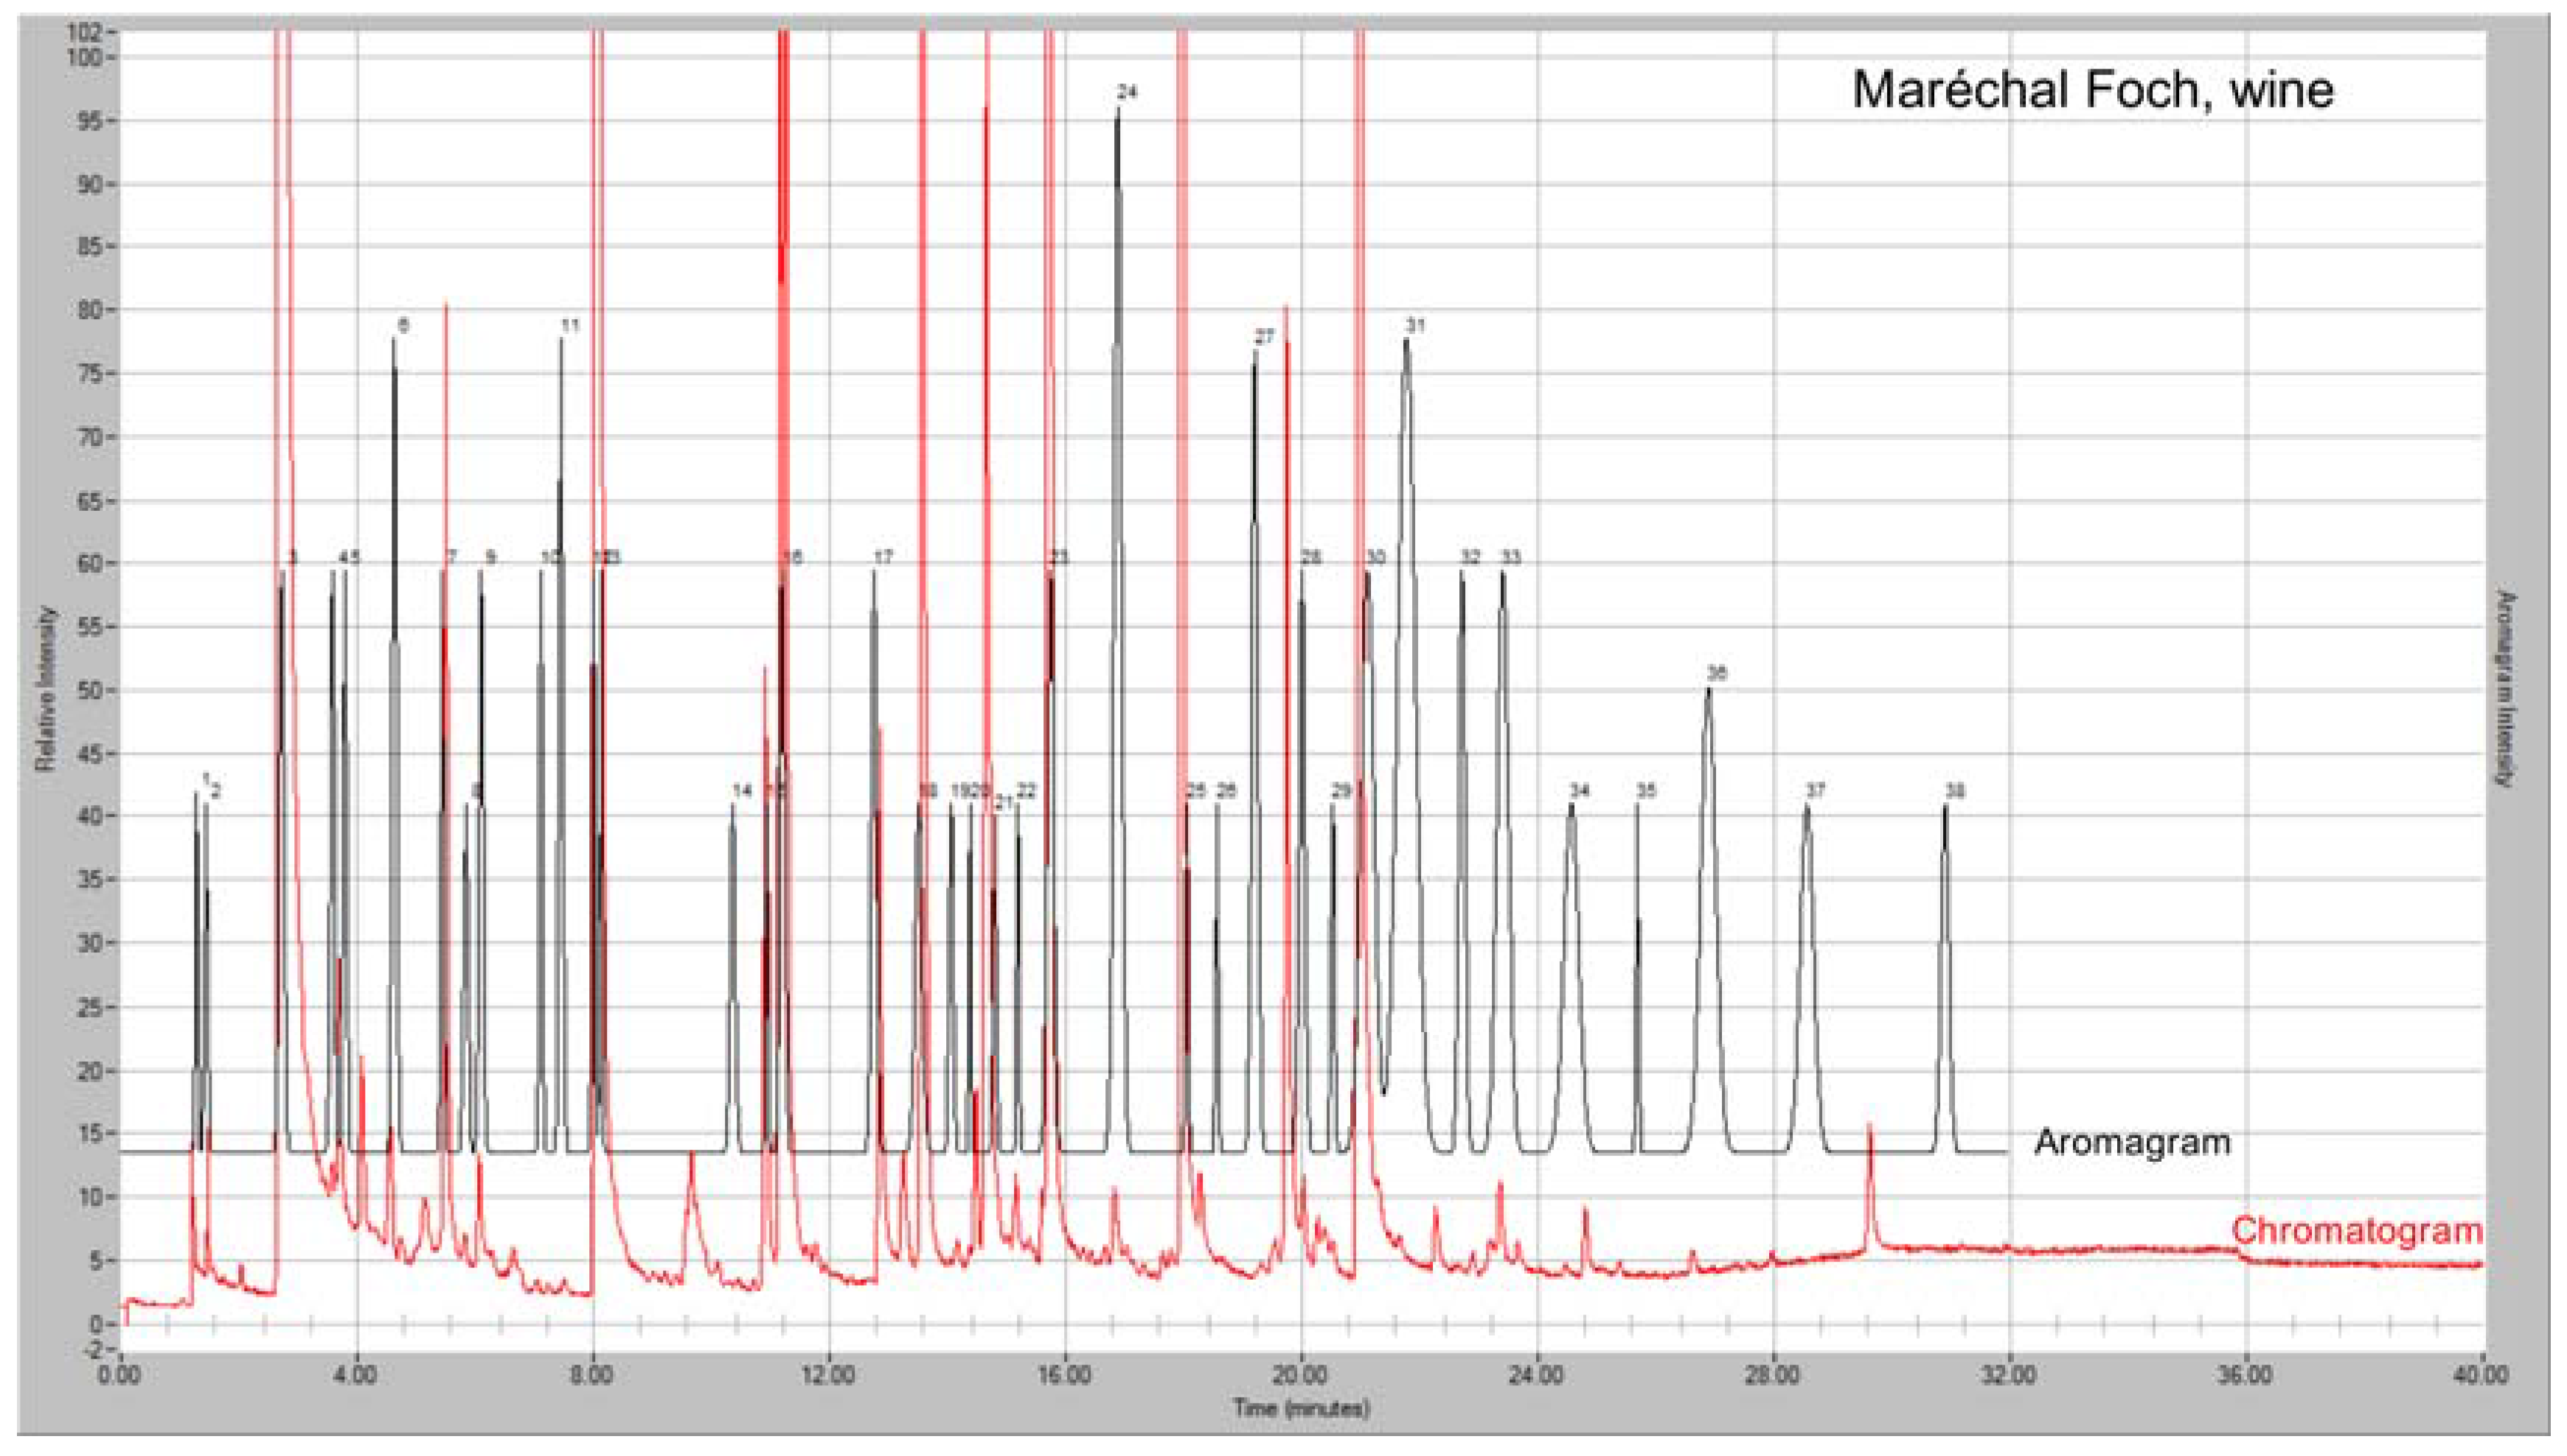
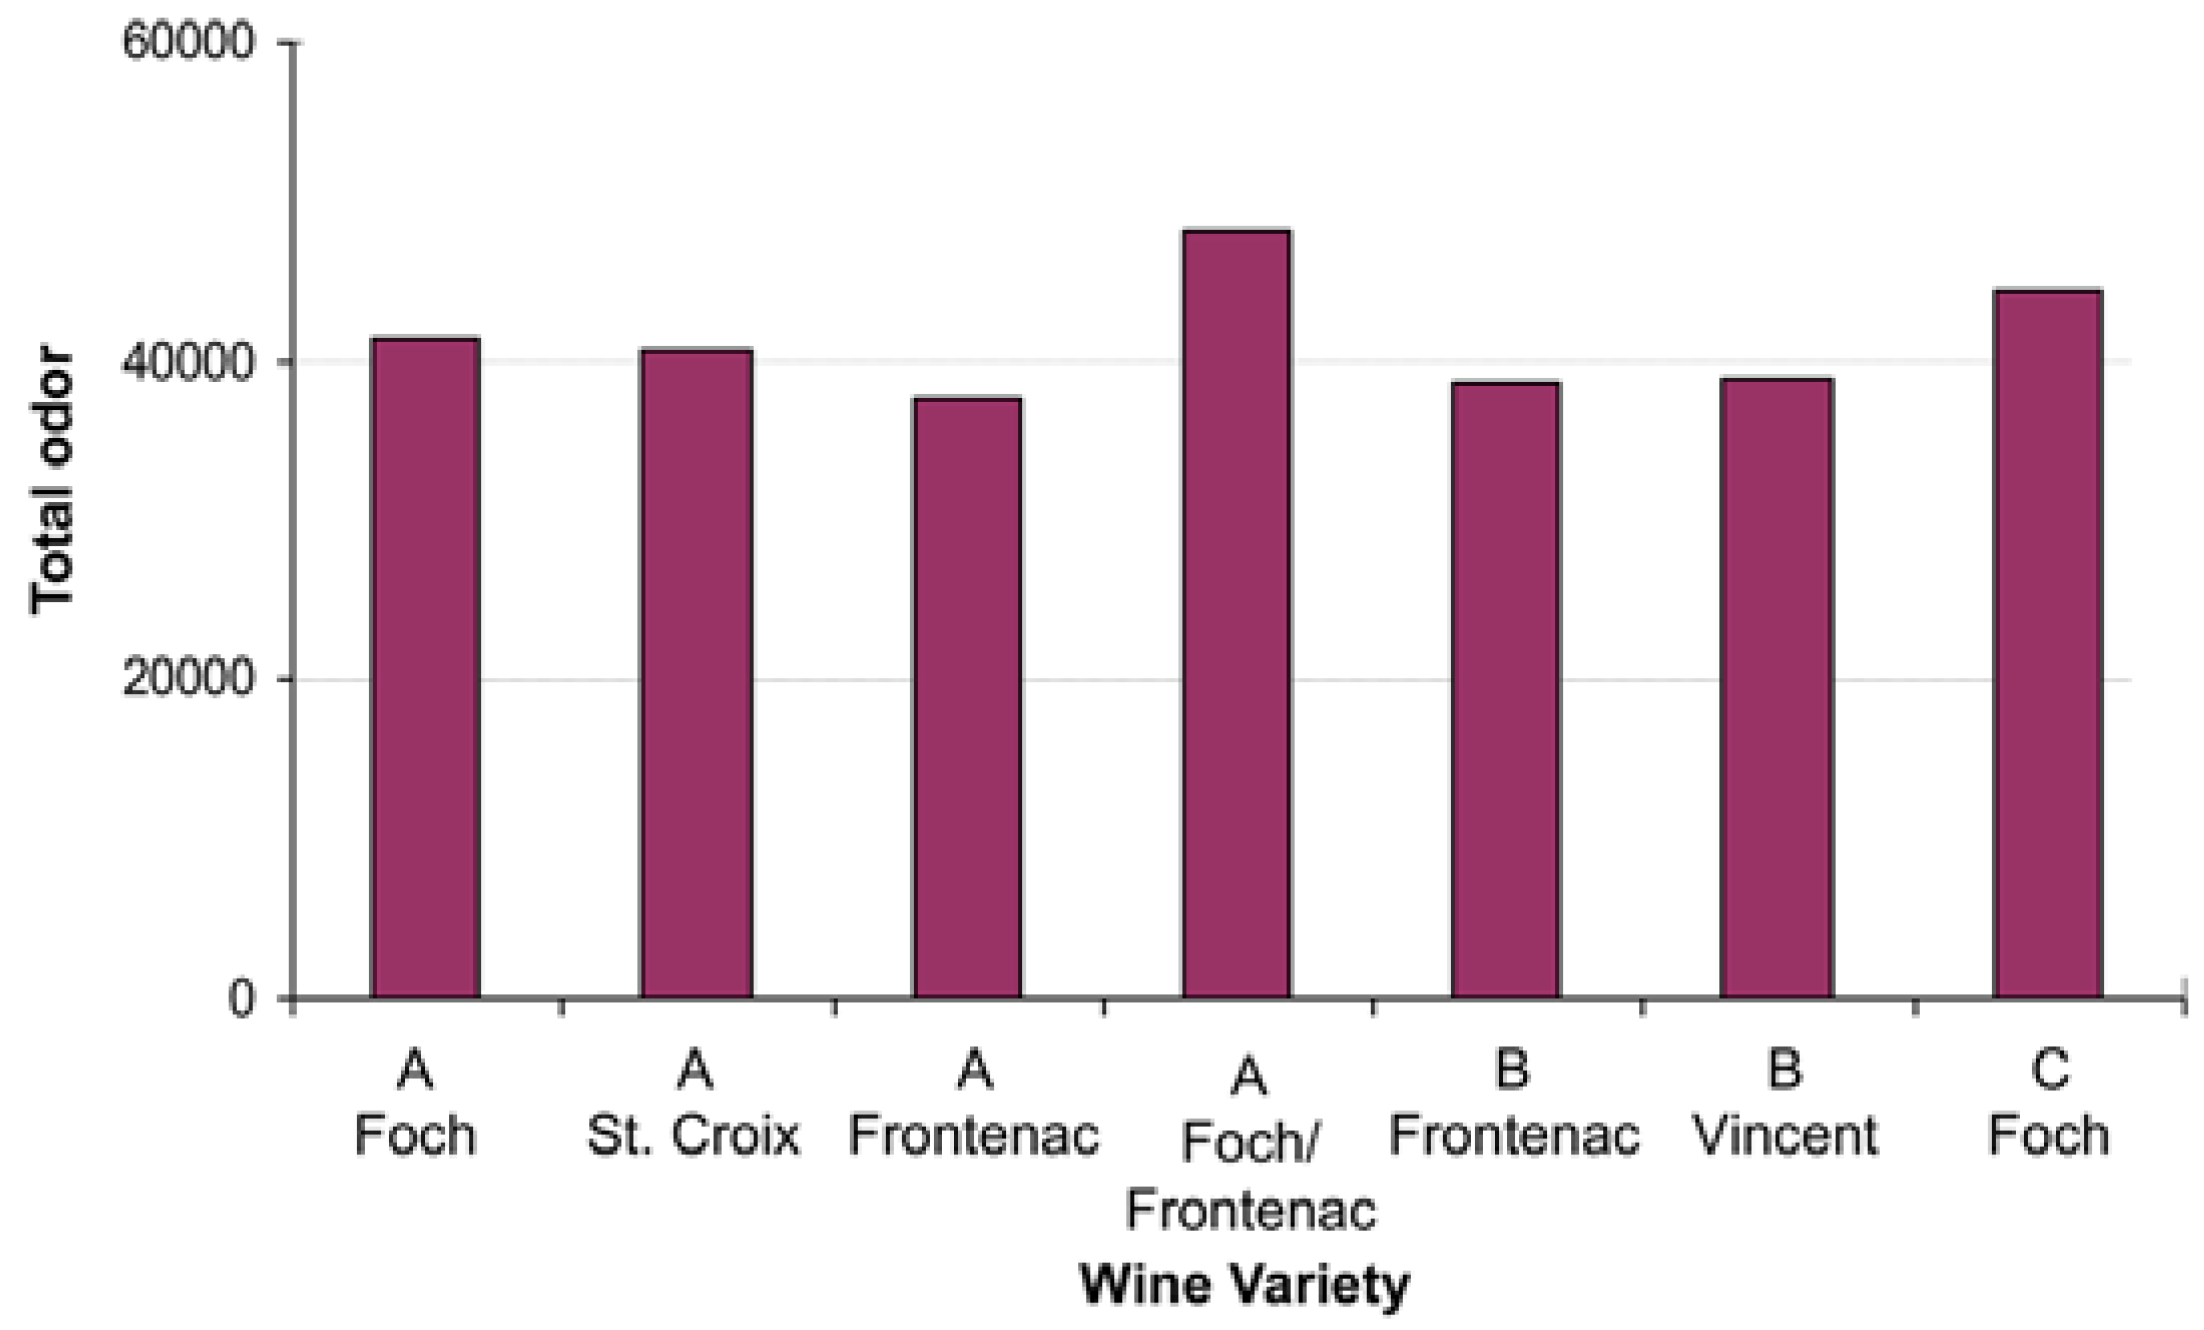
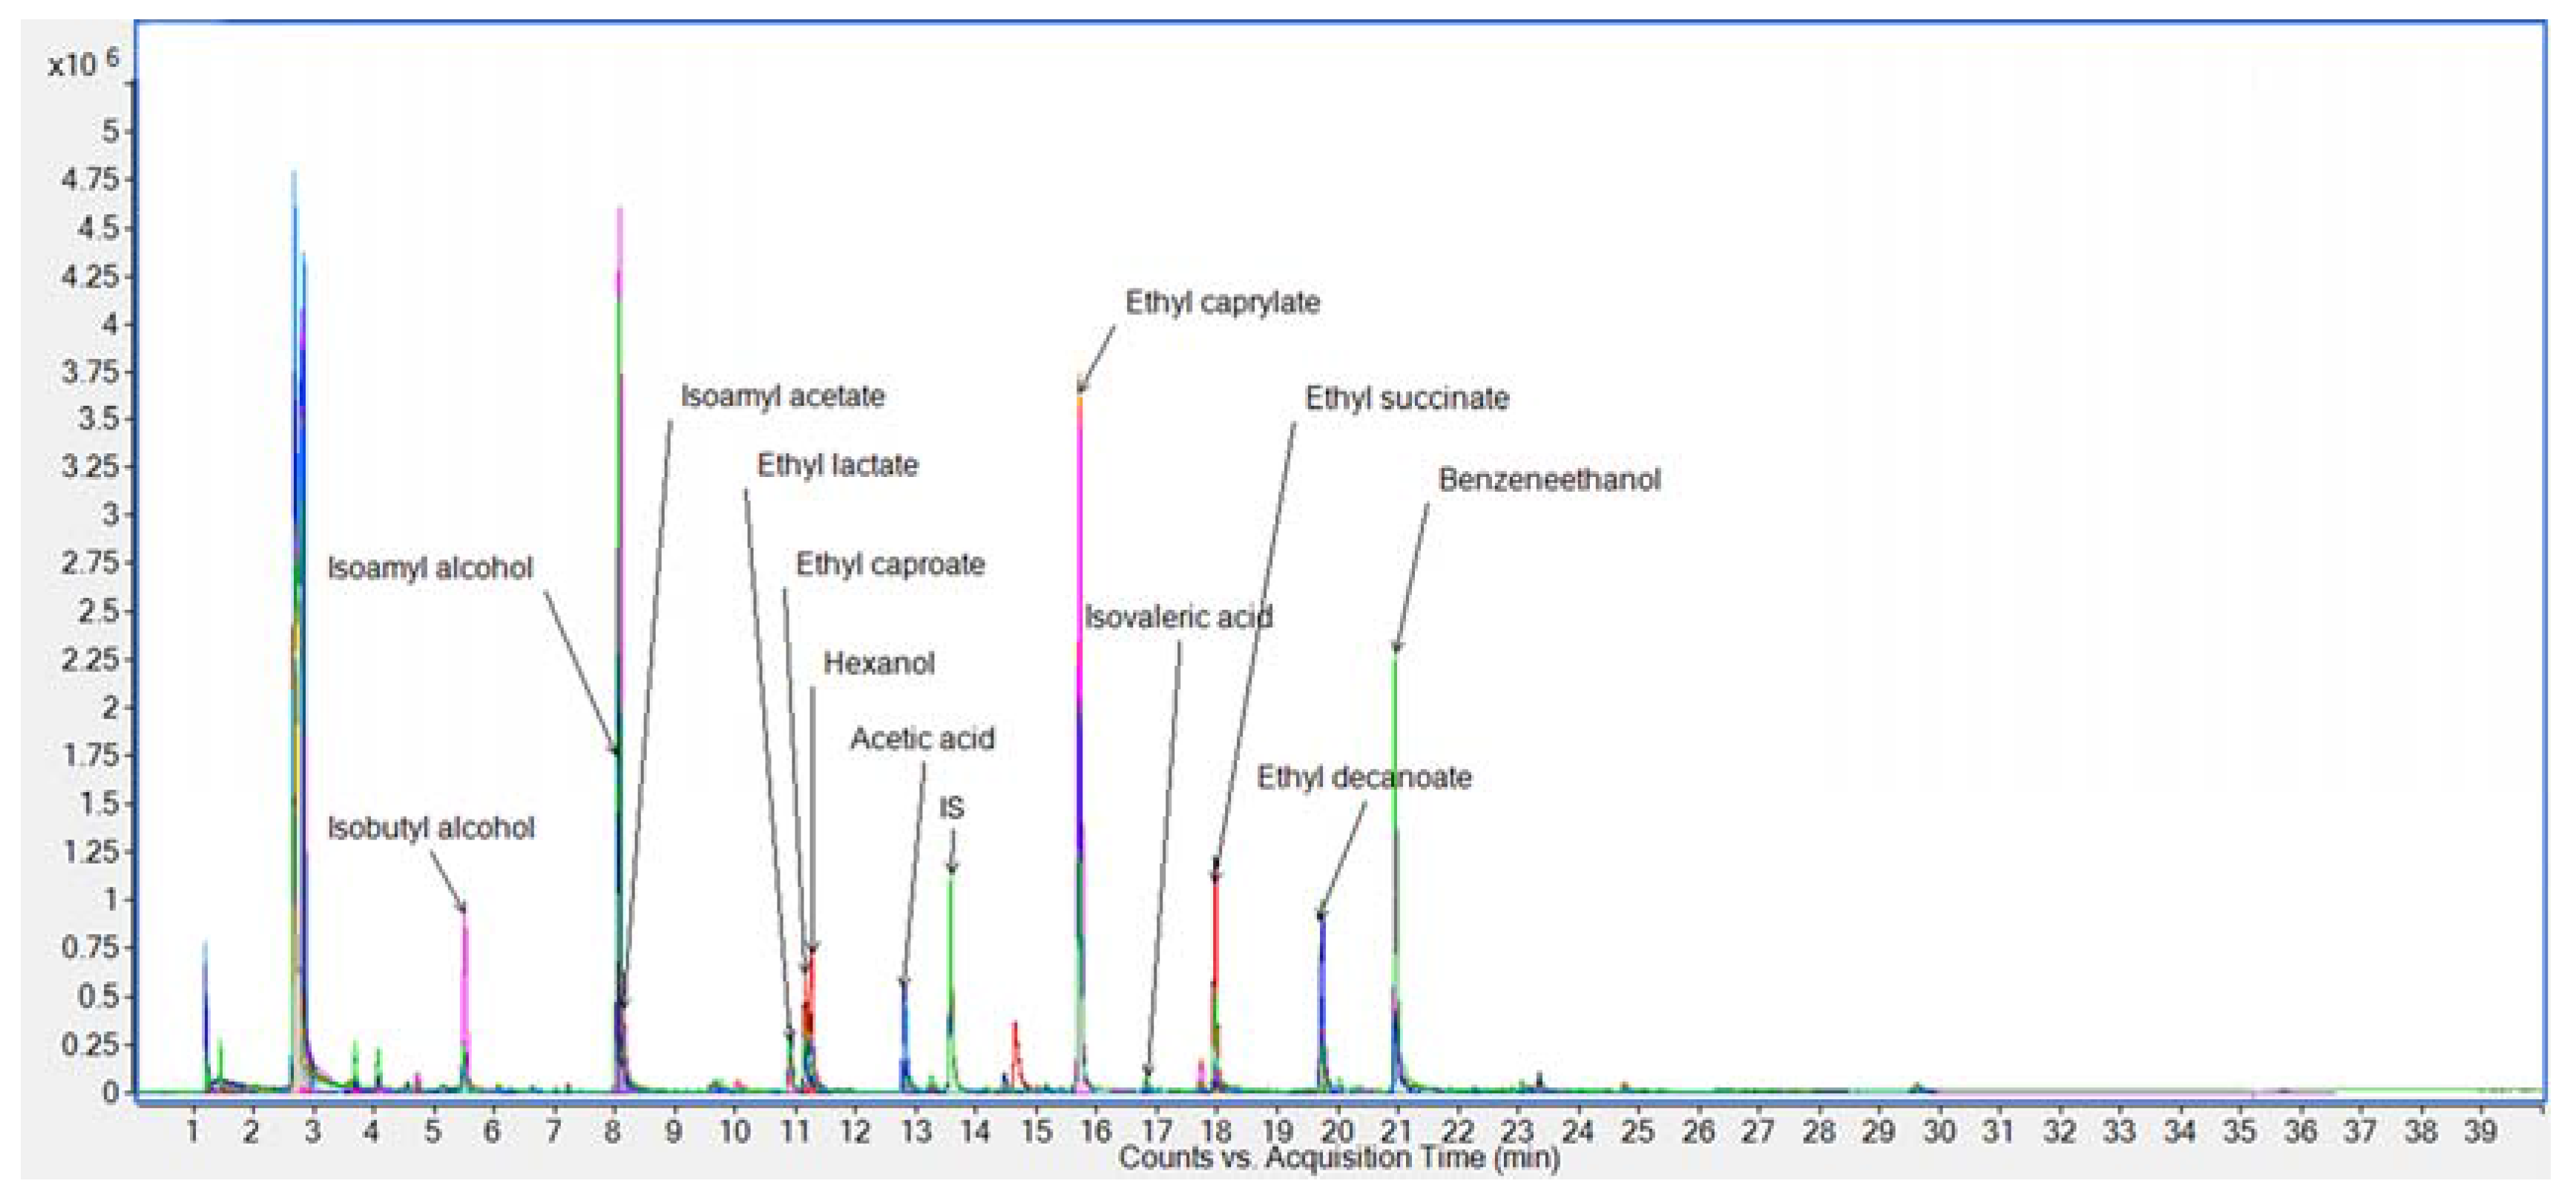
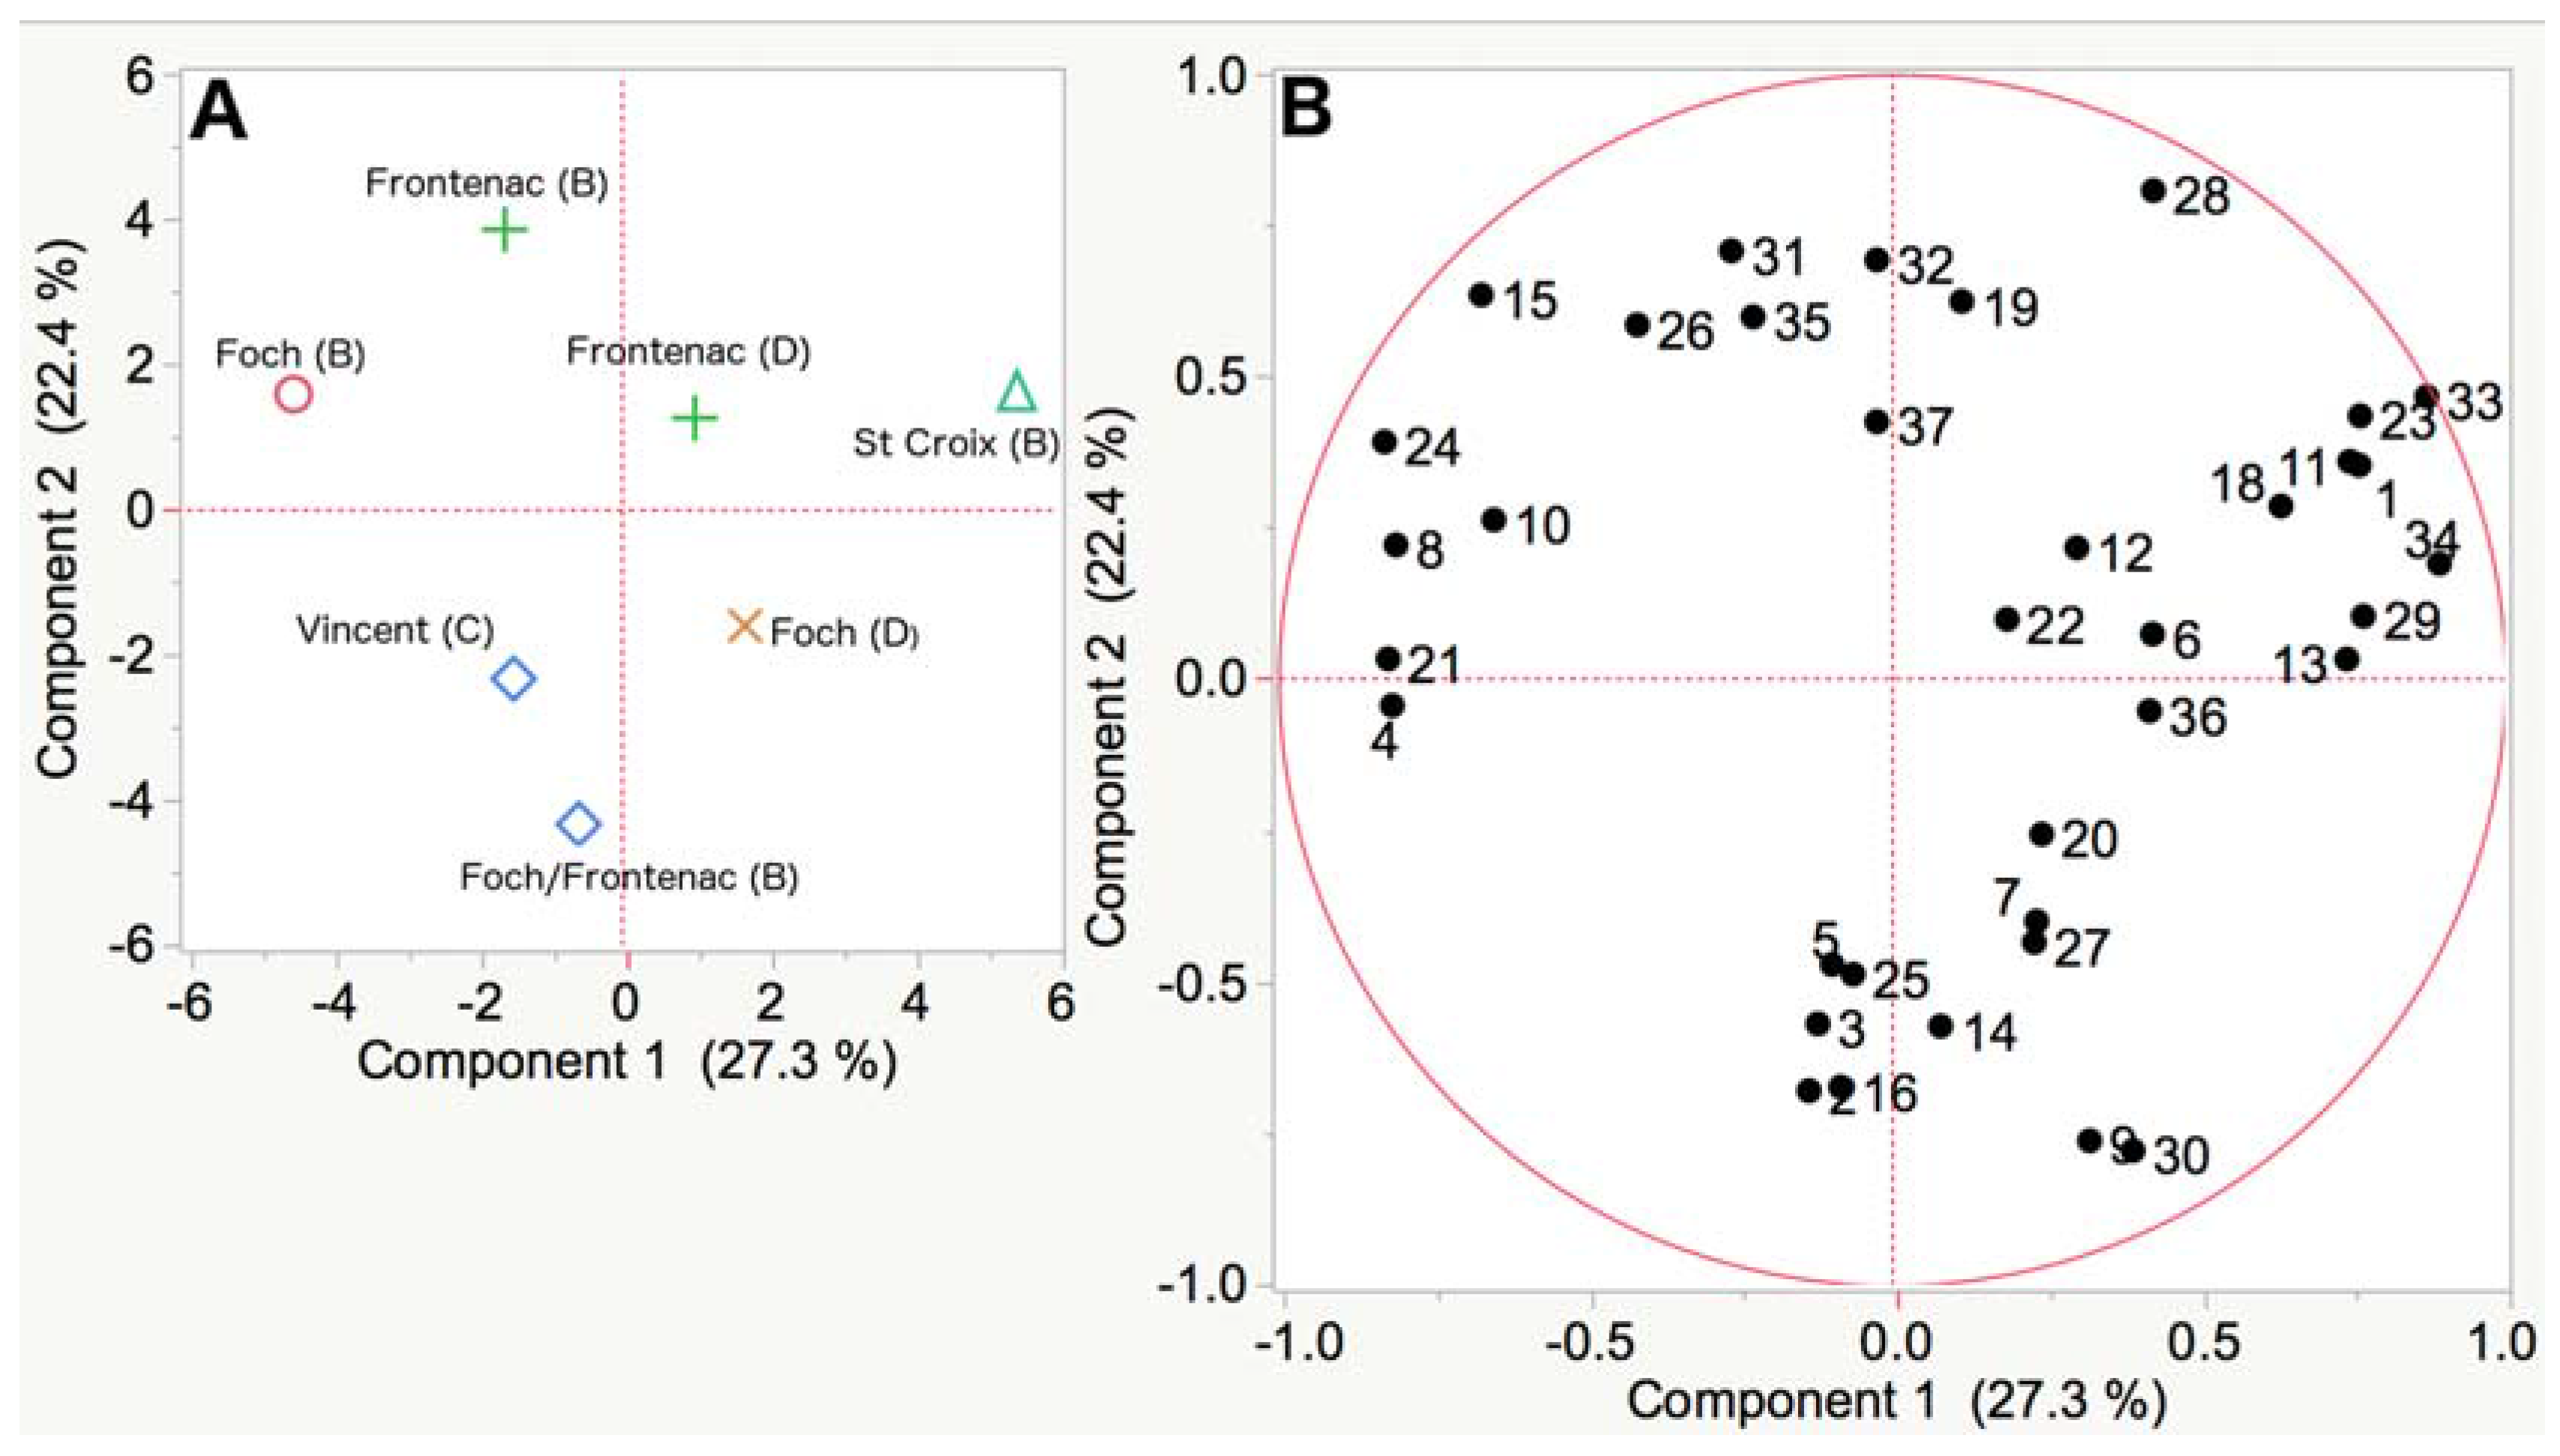
3.2. Analysis of Wine Samples

GC-MS-Olfactometry

Tentative identifications of thirty-six compounds by the mass spectral match of their most significant red wine aroma compounds with the ratio of their compound peak area to the internal standard peak area are listed in Table 2. The molecular weight of the compounds identified by mass spectral match ranged from 60 to 284 amu. The relative quantity of each compound to the corresponding ones in the other wine samples was calculated by the peak area to internal standard ratio. The aroma profile of the seven Iowa red wines varied considerably between samples. These results can reflect the influence of the climate, grape variety, vintage, and different viticultural and enological practices in seven different Iowa red wines. Further research is warranted to link the variables to wine aroma.
Simultaneous olfactometry, when used with GC-MS, can verify compounds by aroma character. An example of this is highlighted in Figure 8. The chromatographic peak at 19 min was not identified by mass spectral comparison, but it was recorded with an aroma character of burnt food (aromagram peak number 27). An open source aroma database search narrows the possible identification of this compound from hundreds to six: octanol, indole, 3-methyl-1-butanol, ethyldimethylpyrazine, dimethyl sulfone, or furfuryl alcohol [17]. The use of olfactometry, by means of the human nose as a detector, is a very valuable tool for the identification of unknown compounds. The total aroma values, calculated as the sum of the area under the aromagram peaks, are compared in Figure 9 and no significant differences are exhibited between the seven Iowa red wines.

4. Discussion

The mixed adsorbent beds of the 50/30 µm DVB/CAR/PDMS coating were best suited for the extraction of wine volatiles, and extracted a greater mass of analytes than the other six fibers. The dual layer Car/PDMS/DVB fiber has been used to overcome the lack of selectivity toward some of the compounds in the single and double-phase fibers [18] and is consistent with previous work by Howard et al. [19]. Even though extraction equilibrium was not reached in some analytes (i.e., the profile is linear in shape at 10 min), precision was assured by using the autosampler to control the mass transfer conditions. The addition of salt can improve the extraction efficiency up to a point, where the target analytes may interact with the salt ions in solution. These interactions will then reduce the extraction efficiency. This phenomenon has been shown to be related to the pKa of the analyte [20]. The total wine aroma is a balance between the heavier aroma of the alcohols, esters, acids, and the unpleasant rancid odors of the aliphatic acids and carbonyls which can be formed during the fermentation process. It should be noted that these 36 compounds were detected in the presence of a highly volatile organic solvent. In Figure 10, ethanol is present at 2.8–3.0 min and is the most abundant compound in the headspace of wine, as expected.
Four esters, including ethyl caproate, ethyl isobutyrate, ethyl isovalerate, and isoamyl acetate, were detected in seven Iowa red wines. In only one previous study, nonanal, (E,Z)-2,6-nonadienal, β-damascenone, ethyl caprylate, and isoamyl acetate had the highest OAVs in Frontenac, Marquette, Maréchal Foch, Sabrevois, and St. Croix wines, using SPME-GCMS(TOF) [21]. Ethyl caproate was previously reported in an analysis of Frontenac and Marquette juice from Quebec using SPME-GCMS [22]. Five compounds in selected Iowa red wines (i.e., isoamyl alcohol, ethyl caproate, benzeneethanol, ethyl decanoate, and ethyl caproate) were also found in Cabernet Sauvignon and Merlot, where ethyl caproate and ethyl caprylate were reported as the most abundant ethyl esters in these vinifera varieties [23]. These compounds have been attributed to yeast metabolism and do not impart any varietal characteristics to wine [24].
A principal components analysis followed by hierarchical clustering analysis is shown in Figure 11. St. Croix (from winery B) and Frontenac (from wineries B and D) are distinguishable by the grape variety and from the other five wine samples. Frontenac from winery B was more significantly associated with (31) octanoic acid than Frontenac from winery D. Maréchal Foch wines (from wineries B and D) were not similar to each other or when blended with Frontenac (from winery B). Maréchal Foch from winery B was associated (8) with ethyl isovalerate, Maréchal Foch from winery D was associated with (20) benzaldehyde, and Maréchal Foch/Frontenac blend from winery B was associated with (16) furfural. Vincent wine from winery C and the Maréchal Foch/Frontenac blend from winery B were similar in wine aroma. It cannot be determined if the difference in aroma is due to the variety or winemaking practices for the Maréchal Foch, Maréchal Foch/Frontenac blend, or Vincent wines.
An automated headspace SPME method, coupled with GCMS-olfactometry was developed to characterize wine aroma. This method was applied to characterize 36 aroma compounds present in seven Iowa red wines from three different wineries. The interactions between the experimental factors were not considered in this research. A multivariate experimental design aimed to determine the main factors followed by a response surface methodology [25] could yield better results. Although a distinct varietal aroma character was not ‘pinpointed’ for these Iowa red wines, there were notable differences in the aroma profile by grape variety and by the winery. Linking aroma compounds to grape variety and winemaking practices continues to be important in producing high quality Iowa wines.

Acknowledgments

The authors acknowledge funding provided through the Iowa Department of Agricultural and Land Stewardship (07-1273; Project title: Development of a rapid screening method for chemical and aroma analyses of Iowa wines: transresveratrol and aroma-enhancing compounds).

Author Contributions

L.C., J.A.K., and M.D. conceived and designed the experiments; L.C. performed the experiments; L.C. and S.R. analyzed the data; J.A.K. and M.D. contributed reagents/materials/analysis tools; L.C., S.R., J.A.K., and D.M. wrote the paper.

Conflicts of Interest

The authors declare no conflict of interest. The funding sponsors had no role in the design of the study; in the collection, analyses, or interpretation of data; in the writing of the manuscript, and in the decision to publish the results.

References

  1. Schreier, P.; Jennings, W.G. Flavor composition of wines: A review. CRC Crit. Rev. Food Sci. Nutr. 1979, 12, 59–111. [Google Scholar] [CrossRef] [PubMed]
  2. Rapp, A. Wine aroma substances from gas chromatographic analysis. In Modern Methods of Plant Analysis; Linskens, H.F., Jackson, J.F., Eds.; Springer: Berlin, Germany, 1988; Volume 6, pp. 29–66. [Google Scholar] [CrossRef]
  3. Sauvageot, F.; Vivier, P. Effects of malolactic fermentation on sensory properties of four burgundy wines. Am. J. Enol. Vitic. 1997, 48, 187–192. [Google Scholar]
  4. De Revel, G.; Bertrand, A. Dicarbonyl compounds and their reduction products in wine. Identification of wine aldehydes. In Trends in Flavour Research; Maarse, H., van der Heij, D.G., Eds.; Elsevier Science B.V.: Amsterdam, The Netherlands, 1994; Volume 35, p. 353. ISBN 0444815872. [Google Scholar]
  5. Allen, M. What level of methoxypyrazines is desired in red wines? The flavour perspective of the classic red wines of Bordeaux. Aust. Grapegrow. Winemak. 1995, 381, 7–9. [Google Scholar]
  6. Davis, C.R.; Wibowo, D.; Eschenbruch, R.; Lee, T.H.; Fleet, G.H. Practical implications of malolactic fermentation: A review. Am. J. Enol. Vitic. 1985, 36, 290–301. [Google Scholar]
  7. Rapp, A.; Güntert, M.; Almy, J. Identification and significance of several sulfur-containing compounds in wine. Am. J. Enol. Vitic. 1985, 36, 219–221. [Google Scholar]
  8. Montedoro, G.; Bertuccioli, M. The flavour of wines, vermouth and fortified wines. In Food flavours, Part B, The Flavour of Beverages; Morton, I.D., MacLeod, A.J., Eds.; Elsevier Science Ltd.: Amsterdam, The Netherlands, 1986; p. 171. ISBN 9780444425997. [Google Scholar]
  9. Rapp, A.; Versini, G. Methylanthranilate (“foxy taint”) concentrations of hybrid and Vitis vinifera wines. Vitis 1996, 35, 215–216. [Google Scholar]
  10. Margalit, Y. Concepts in Wine Chemistry, 3rd ed.; The Wine Appreciation Guild: San Francisco, CA, USA, 2012; p. 203. ISBN 1-935879-94-4. [Google Scholar]
  11. Fuller, G.H.; Steltenkamp, R.; Tisserand, G.A. The gas chromatograph with human sensor: Perfumer model. Ann. N. Y. Acad. Sci. 1964, 116, 711–724. [Google Scholar] [CrossRef] [PubMed]
  12. Robinson, A.L.; Boss, P.K.; Solomon, P.S.; Trengrove, R.D.; Heymann, H.; Ebeler, S.E. Origins of grape and wine aroma. Part 2. Chemical and sensory analysis. Am. J. Enol. Viticult. 2014, 65, 25–42. [Google Scholar] [CrossRef]
  13. Panighel, A.; Flamini, R. Solid phase extraction and solid phase microextraction in grape and wine volatile compounds analysis. Sample Prep. 2015, 2, 55–65. [Google Scholar] [CrossRef]
  14. Pawliszyn, J. Handbook of Solid Phase Microextraction; Chemical Industry Press: Beijing, China, 2009; pp. 90–103. ISBN 978-7-122-04701-4. [Google Scholar]
  15. Zhang, S.; Koziel, J.A.; Cai, L.; Hoff, S.J.; Heathcote, K.Y.; Chen, L.; Jacobson, L.D.; Akdeniz, N.; Hetchler, B.P.; Parker, D.B.; et al. Odor and odorous chemical emissions from animal buildings: Part 5. Simultaneous chemical and sensory analysis with gas chromatography-mass spectrometry-olfactometry. Trans. ASABE 2015, 58, 1349–1359. [Google Scholar] [CrossRef]
  16. LRI & Odour Database. Available online: http://www.webcitation.org/6rDRATLKY (accessed on 14 June 2017).
  17. Flavornet and Human Odor Space. Available online: http://www.webcitation.org/6qr4xTprN (accessed on 30 May 2017).
  18. Ferreira, A.C.S.; de Pinho, P.G. Analytical method for determination of some aroma compounds on white wines by solid phase microextraction and gas chromatography. J. Food Sci. 2003, 68, 2817–2820. [Google Scholar] [CrossRef]
  19. Howard, K.L.; Mike, J.H.; Riesen, R. Validation of a solid-phase microextraction method for headspace analysis of wine aroma compounds. Am. J. Enol. Vitic. 2005, 56, 37–45. [Google Scholar]
  20. Hall, B.J.; Brodbelt, J.S. Determination of barbiturates by solid-phase microextraction (SPME) and ion trap gas chromatography-mass spectrometry. J. Chromatogr. A 1997, 777, 275–282. [Google Scholar] [CrossRef]
  21. Slegers, A.; Angers, P.; Ouellet, E.; Truchon, T.; Pedneault, K. Volatile compounds from grape skin, juice, and wine from five interspecific hybrid grape cultivars grown in Quebec (Canada) for wine production. Molecules 2015, 20, 10980–11016. [Google Scholar] [CrossRef] [PubMed]
  22. Pedneault, K.; Martine, D.; Angers, P. Flavor of cold-hardy grapes: Impact of berry maturity and environmental conditions. J. Agric. Food Chem. 2013, 61, 10418–10438. [Google Scholar] [CrossRef] [PubMed]
  23. Cheng, G.; Liu, Y.; Yue, T.X.; Zhang, Z.W. Comparison between aroma compounds in wines from four Vitis vinifera grape varieties grown in different shoot positions. Food Sci. Technol. Camp. 2015, 35, 237–246. [Google Scholar] [CrossRef]
  24. Jackson, R.S. Wine Science Principles and Applications, 3rd ed.; Elsevier: Amsterdam, The Netherlands, 2008; p. 662. ISBN 978-0-12-373646-8. [Google Scholar]
  25. Gunst, R.F. Response surface methodology: Process and product optimization using designed experiments. Technometrics 1996, 38, 284–286. [Google Scholar] [CrossRef]
Figure 1. Aroma descriptor panel used to characterize volatiles and perceived intensities.
Separations 04 00024 g001
Figure 2. Extraction time profile of selected volatiles extracted with HS-SPME in an Iowa Maréchal Foch. Conditions: 5 min pre-sampling desorption of 50/30 µm DVB/CAR/PDMS SPME fiber; 4 mL wine sample in a 10 mL threaded glass amber vial with PTFE/silicone septa; 10 min incubation at 35 °C; 10 s, 30 s, 1 min, 3 min, 5 min, 10 min, 20 min, 30 min, and 60 min extraction time at 35 °C; agitation speed 500 rpm; 5 min desorption time into GC inlet. 10 min extraction time was chosen for the method.
Separations 04 00024 g002
Figure 3. Effects of extraction temperature on selected volatiles extracted with HS-SPME in an Iowa Maréchal Foch. Compound letters correspond to compounds found in Figure 2 (i.e., A—ethyl isobutyrate, B—isobutyl alcohol, L—ethyl palmitate). Conditions: 5 min pre-sampling desorption of 50/30 µm DVB/CAR/PDMS SPME fiber; 4 mL wine sample in a 10 mL threaded glass amber vial with PTFE/silicone septa; 10 min incubation at 35, 40, 50, 60, 70, 80 °C; 10 min extraction time at 35, 40, 50, 60, 70, 80 °C; agitation speed 500 rpm; 5 min desorption time into GC inlet. 50 °C was chosen for the method.
Separations 04 00024 g003
Figure 4. Effects of incubation time on selected volatiles extracted using HS-SPME in an Iowa Maréchal Foch. Compound letters correspond to compounds found in Figure 2 (i.e., A—ethyl isobutyrate, B—isobutyl alcohol, L—ethyl palmitate). Conditions: 5 min pre-sampling desorption of 50/30 µm DVB/CAR/PDMS SPME fiber; 4 mL wine sample in a 10 mL threaded glass amber vial with PTFE/silicone septa; 0, 5 min, 10 min, 15 min, and 20 min incubation at 50 °C; 10 min extraction time at 50 °C; agitation speed 500 rpm; 5 min desorption time into GC inlet. 10 min incubation time was chosen for the method.
Separations 04 00024 g004
Figure 5. Effects of sample volume on selected volatiles extracted using HS-SPME in an Iowa Maréchal Foch. Compound letters correspond to compounds found in Figure 2 (i.e., A—ethyl isobutyrate, B—isobutyl alcohol, L—ethyl palmitate). Conditions: 5 min pre-sampling desorption of 50/30 µm DVB/CAR/PDMS SPME fiber; 1, 2, 3, and 4 mL wine sample in a 10 mL threaded glass amber vial with PTFE/silicone septa; 10 min incubation at 50 °C; 10 min extraction time at 50 °C; agitation speed 500 rpm; 5 min desorption time into GC inlet. 4 mL sample volume was chosen for the method.
Separations 04 00024 g005
Figure 6. Effects of fiber desorption time on selected volatiles extracted in an Iowa Maréchal Foch. Compound letters correspond to compounds found in Figure 2 (i.e., A—ethyl isobutyrate, B—isobutyl alcohol, L—ethyl palmitate). Conditions: 30 s, 60 s, 120 s, 180 s, 240 s, 300 s pre-sampling desorption of 50/30 µm DVB/CAR/PDMS SPME fiber; 4 mL wine sample in a 10 mL threaded glass amber vial with PTFE/silicone septa; 10 min incubation at 50 °C; 10 min extraction time at 50 °C; agitation speed 500 rpm; 30 s, 60 s, 120 s, 180 s, 240 s, 300 s desorption time into GC inlet. 120 s thermal desorption time was chosen for the method.
Separations 04 00024 g006
Figure 7. Effects of salt addition on selected volatiles extracted in an Iowa Maréchal Foch. Compound letters correspond to compounds found in Figure 2 (i.e., A—ethyl isobutyrate, B—isobutyl alcohol, L—ethyl palmitate). Conditions: 30, 60, 120, 180, 240, 300 s pre-sampling desorption of 50/30 µm DVB/CAR/PDMS SPME fiber; 4 mL wine sample in a 10 mL threaded glass amber vial with PTFE/silicone septa; 10 min incubation at 50 °C; 10 min extraction time at 50 °C; agitation speed 500 rpm; 30, 60, 120, 180, 240, 300 s desorption time into GC inlet. 120 s thermal desorption time was chosen for the method.
Separations 04 00024 g007
Figure 8. Overlay of total ion chromatogram and aromagram of an Iowa Maréchal Foch wine using the optimized method. Intense aromas (observed as increased peak height, black signal) and responsible chemical compounds (TIC, red signal) were aromagram peak: (#6) sweet, fruity—ethyl isobutyrate (4.71 min); (#11) fruity—ethyl isovalerate (7.21 min); (#24) rancid, sweaty, body odor, burnt—isovaleric acid (16.83 min) (#27) burnt, burnt food—unknown compound (19 min); (#31) sweet, fruity, winey—ethyl laurate (23.26 min). Conditions: 2 min pre-sampling desorption of 50/30 µm DVB/CAR/PDMS SPME fiber; 4 mL wine sample in a 10 mL threaded glass amber vial with PTFE/silicone septa; 10 min incubation at 50 °C; 10 min extraction time at 50 °C; agitation speed 500 rpm; 2 min desorption time into GC inlet.
Separations 04 00024 g008
Figure 9. Overlay of total ion chromatogram and aromagram of an Iowa Maréchal Foch wine using the optimized method. Intense aromas (observed as increased peak height, black signal) and responsible chemical compounds (TIC, red signal) were aromagram peaks: (#6) sweet, fruity—ethyl isobutyrate (4.71 min); (#11) fruity—ethyl isovalerate (7.21 min); (#24) rancid, sweaty, body odor, burnt—isovaleric acid (16.83 min) (#27) burnt, burnt food—unknown compound (19 min); (#31) sweet, fruity, winey—ethyl laurate (23.26 min). Conditions: 2 min pre-sampling desorption of 50/30 µm DVB/CAR/PDMS SPME fiber; 4 mL wine sample in a 10 mL threaded glass amber vial with PTFE/silicone septa; 10 min incubation at 50 °C; 10 min extraction time at 50 °C; agitation speed 500 rpm; 2 min desorption time into GC inlet.
Separations 04 00024 g009
Figure 10. Overlay of total compound chromatograms of seven selected Iowa red wines using the optimized method. Wines included: two bottles of Maréchal Foch, one bottle of St. Croix, two bottles of Frontenac, one bottle of Vincent, and one bottle of Maréchal Foch/Frontenac blend. Conditions: 2 min pre-sampling desorption of 50/30 µm DVB/CAR/PDMS SPME fiber; 4 mL wine sample in a 10 mL threaded glass amber vial with PTFE/silicone septa; 10 min incubation at 50 °C; 10 min extraction time at 50 °C; agitation speed 500 rpm; 2 min desorption time into GC inlet.
Separations 04 00024 g010
Figure 11. A principal components analysis of wine aroma of seven wines from three different Iowa wineries (A) and variables (B). Numbered variables refer to peak numbers in Table 2. Internal standard (17) 3-nonanone is not included in (B) because there was no variation between the samples.
Separations 04 00024 g011
Table 1. Optimization of solid phase microextraction (SPME) extraction conditions—Fiber selection.
RT (min)Compound50/30 µm DVB/CAR/PDMS100 µm PDMS7 µm PDMS85 µm PA65 µm PDMS/DVB70 µm CW/DVB85 µm CAR/PDMS
4.77Ethyl isobutyrate100580137529104
5.53Isobutyl alcohol10042195819783
8.10Isoamyl alcohol10035073756692
11.00Ethyl lactate100170716079132
11.75Ethyl caproate10024075317109
12.92Acetic acid1005312438242158
16.38Ethyl caprylate10067121984564
18.44Vitispirane10061016903899
18.34Diethyl succinate100520451055663
20.42Ethyl decanoate10011412561217253
21.13Benzenethanol10023074866782
24.03Ethyl myristate100943259926641
30.37Ethyl palmitate10018713213519415517
Bolded numbers indicate when a SPME fiber coating extracted more mass than the 50/30 µm DVB/CAR/PDMS coating. DVB: Divinylbenzene; PA: Polyacrylate; PDMS: Polydimethylsiloxane; CW: Carbowax; CAR: Carboxen.
Table 2. Tentative identification by mass spectral match of the most significant red wine aroma wine aroma compounds, listed as the volatile compound peak area: internal standard peak area ratio.
#RT (min)LRI AStationary Phase 1–10CompoundMWB FochB St. CroixB FrontenacB Foch/FrontenacC VincentD FrontenacD Foch
13.5894922,3-Butanedione861.115.180.850.320.941.391.05
9632
9554
5585
6198
5758
9769
23.78802Acetal1181.240.968.5723.16.754.98.08
7108
34.087743Ethyl propanoate1021.731.057.2619.63.426.855.38
44.729562Ethyl isobutyrate1165.941.673.993.546.362.31
7468
55.4911102Isobutyl alcohol7414.623.821.927.686.121.428.7
10542
10834
10934
6096
6168
66.078633Ethyl butanoate1161.553.433.52.22.631.053.59
7885
76.6611384n-Butanol740.91.851.444.071.764.321.68
11494
6345
6536
87.2210602Ethyl isovalerate1304.290.4121.760.90.380.29
8566
8408
98.0511842Isoamyl alcohol88132355275477475221377
7198
108.1211102Isoamyl acetate13032.23.893.874.023.893.220
8608
1110.0312502Styrene104nd16.93.220.050.03nd0.68
1210.9113122Ethyl lactate11813.734.139.934.33067.119.8
13414
8038
1311.1512302Ethyl caproate14426.47140.43334.721.564.3
10603
12324
12384
9855
9815
9966
9966
1411.2713162n-Hexanol1028.640019.612.67.8251.7
13302
13322
13524
8475
8485
8485
8626
13549
1512.8114002Acetic acid6051.46.6158.210.611.613.218.7
14012
7913
14354
14424
14594
6215
7238
1613.2514372Furfural96ndndnd10.2ndndnd
14382
14502
14492
14474
14564
14664
14654
8025
8295
8005
8005
8366
8686
8306
8158
1713.57 3-Nonanone (IS)142100100100100100100100
1814.3713751Methyl octanoate1580.391.010.320.230.350.180.33
13924
110910
1914.48169221,3-Butanediol901.894.03113.381.488.154.43
9418
2014.8115181Benzaldehyde1060.180.930.951.140.730.1255.2
15161
15092
14542
15202
14822
15022
10863
15154
14964
15134
15384
15304
15224
15164
9265
9265
9265
9246
9606
9626
9576
9616
9447
9387
9478
9478
15409
2115.0215012Isobutyric acid882.450.281.380.782.460.450.32
9353
2215.15 2,3-Butanediol901.411.562.312.031.52.622.35
2315.7212583Ethyl caprylate172164398209116187181205
14294
14664
11966
11936
11956
2416.8316312Isovaleric acid1028.972.587.795.13.733.543.55
8346
2517.6612767Vitispirane19203.020.314.515.73.390
2617.7912785Ethyl nonanoate1860.83nd1.680000.78
2717.9916422Diethyl succinate1743.6211.518.943.812.95.77122
11538
2819.7413906Ethyl decanoate20054.999.583.929.833.398.534.4
13916
13946
2920.2717882Phenethyl acetate1640.951.561.261.410.951.471.2
17852
12338
3020.9819034Benzeneethanol12241.31465623211153.7134
3123.0620072Octanoic acid1441.391.076.630.091.992.220.7
20072
21002
20132
20754
11836
12567
3223.3615956Ethyl laurate2283.32.636.731.621.288.242.72
3324.76 4-Ethylphenol122nd7.492.32ndnd3.42.33
3424.81 8-Pentadecanone2261.067.492.312.532.333.42.32
3526.57 Glycerol92ndnd26.8ndndndnd
3626.6317936Ethyl myristate2560.390.530.480.380.570.840.99
3729.6319936Ethyl palmitate2842.352.15.751.922.814.125.14
19857
Note: # is the chromatographic peak number. RT is the retention time in minutes. A is the GC capillary column linear retention index from the LRI & Odour Database [16]. GC stationary phases are: 1—CP-Wax, 2—CW-20M, 3—DB-1701, 4—DB-Wax, 5—DB1, 6—DB5, 7—HP-1, 8—OV-101, 9—SP-Wax, 10—SPB-1. MW is the molecular weight. B, C, and D stand for the three different Iowa wineries. IS = internal standard.

