3.1. Analysis of Hydrocarbon Impurities in Gasfield Water and Preparation of Reference Standard Oil
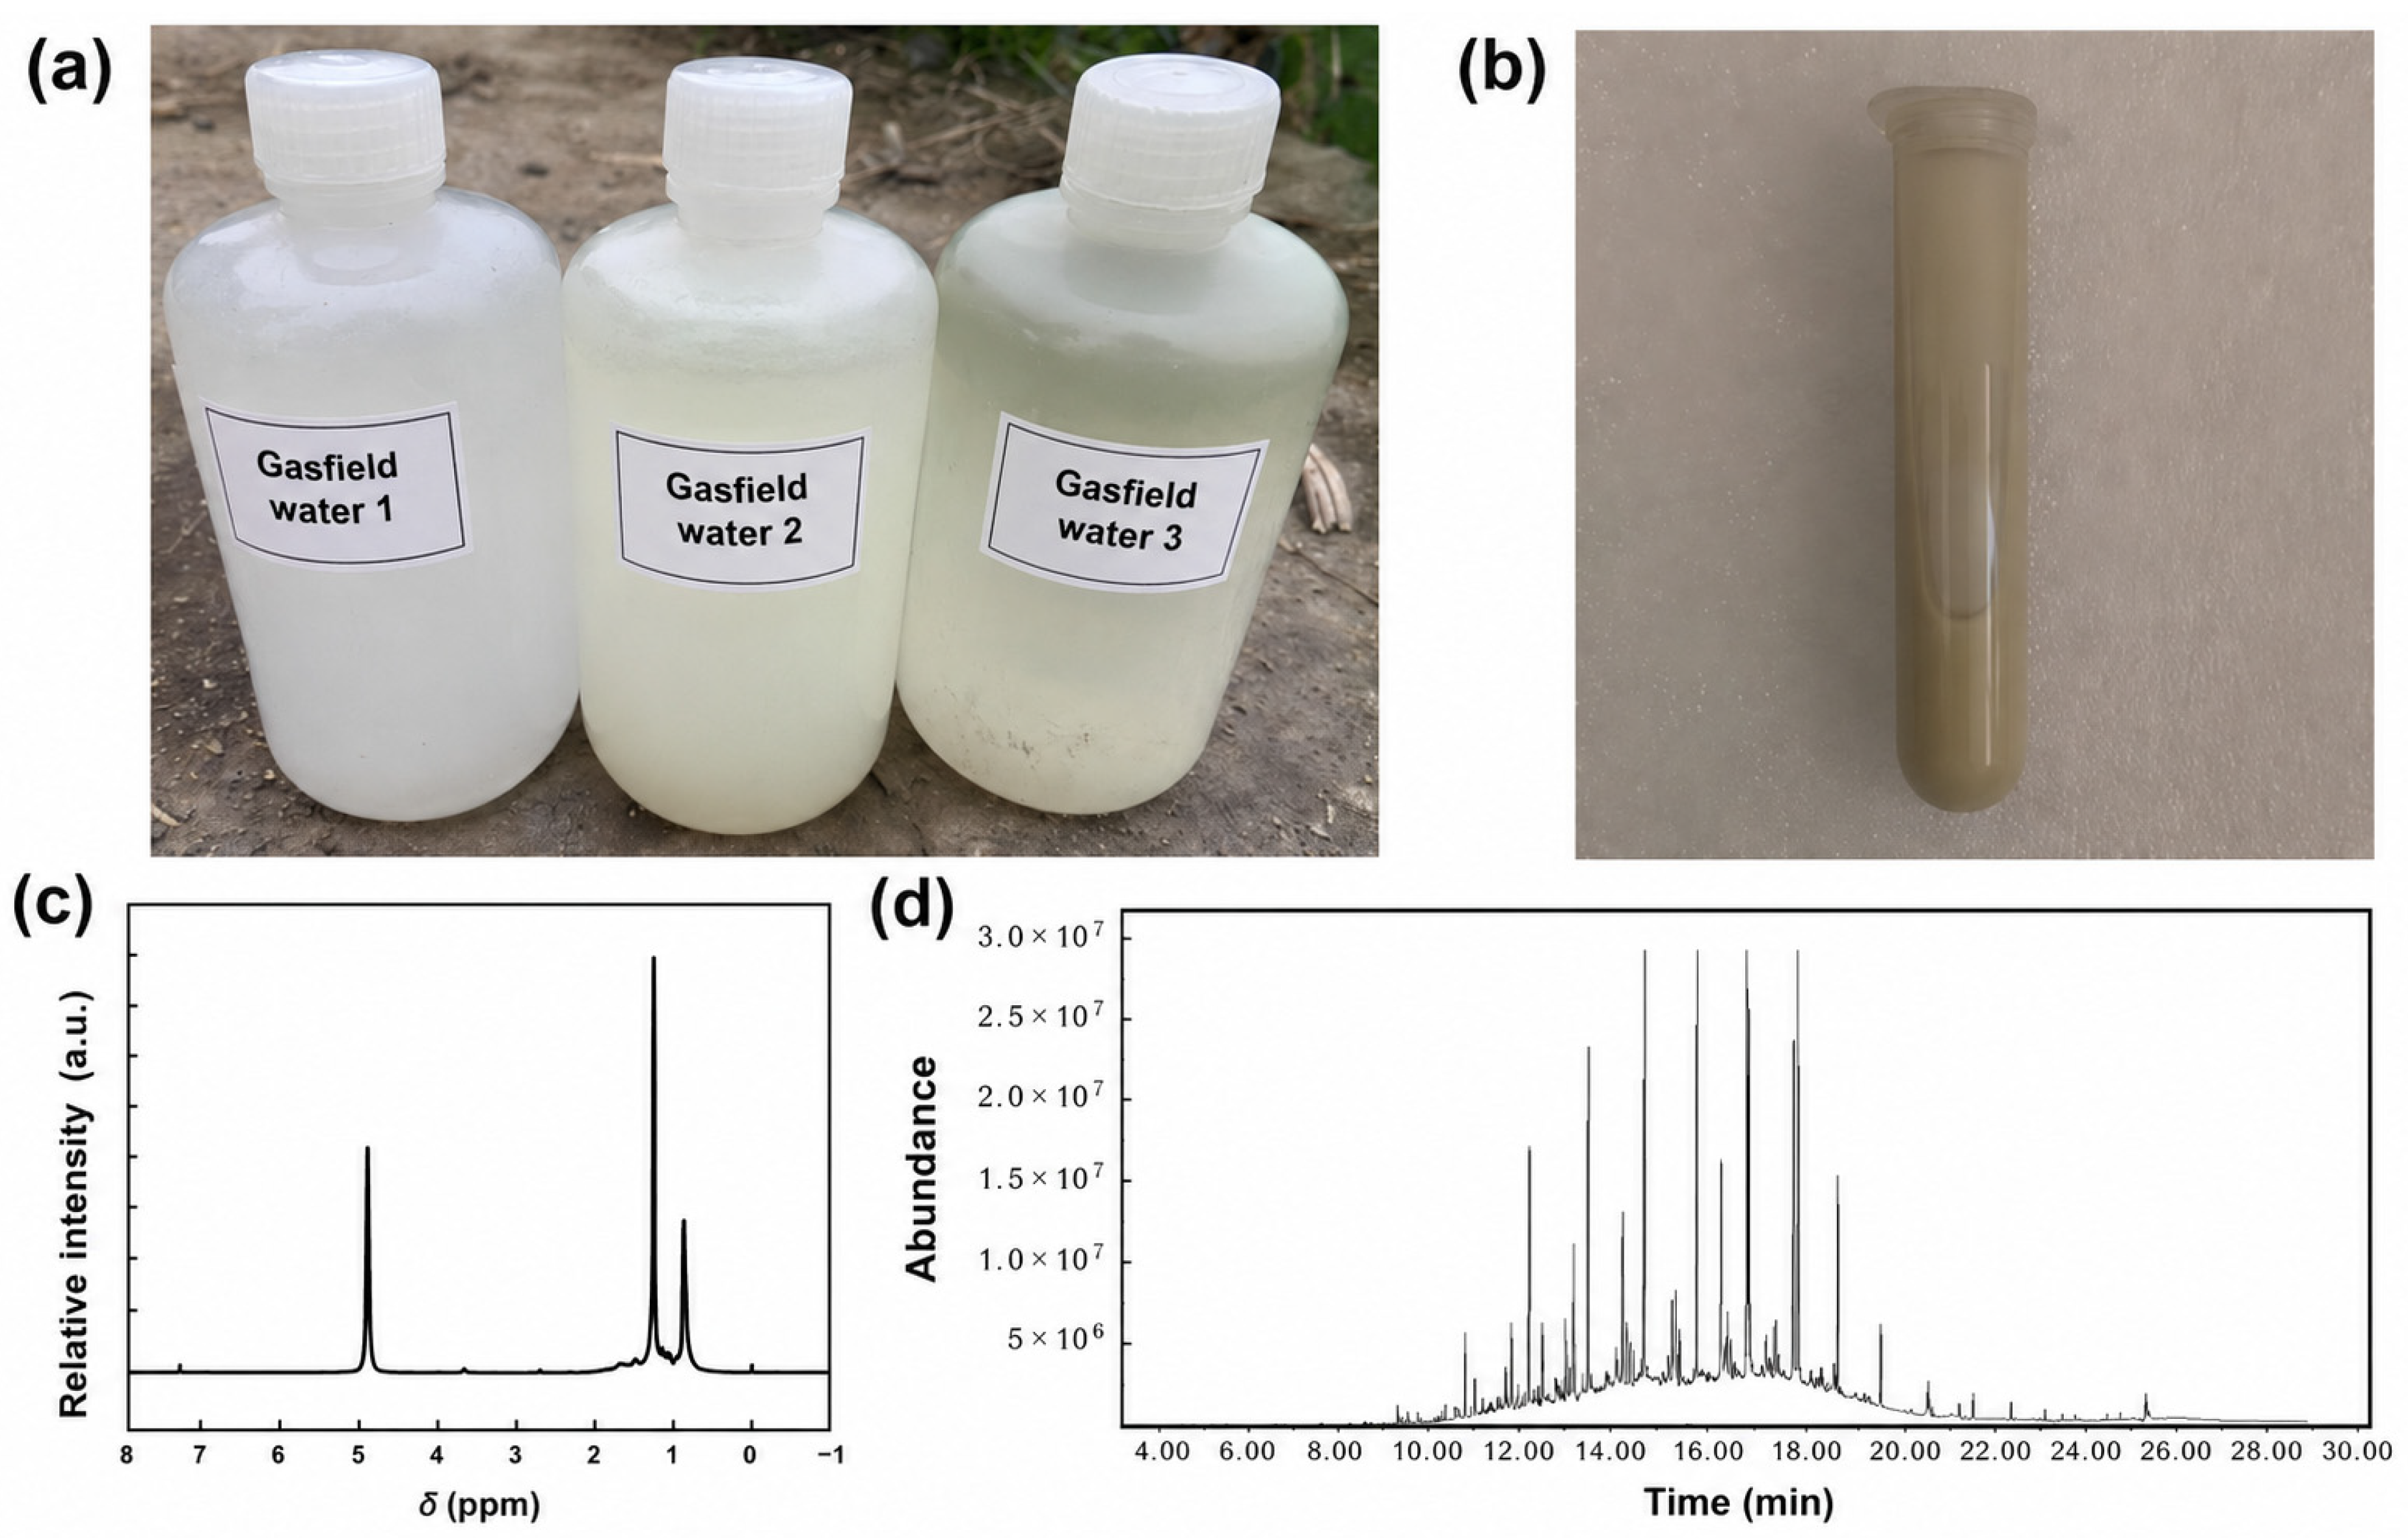
Gasfield water samples were collected from the outlet of the SN-102 stripping tower at processing stations No. 4, 5, and 6 of the Pengzhou gas field (
Figure 1a). The gasfield water contained liquid-phase impurities introduced by wellbore flowback fluids as well as liquid hydrocarbon components entrained in the raw natural gas. A distinct oil-water phase separation was observed in the sample from station No. 5. To accurately determine the composition and content of heavy hydrocarbons in the flowback mixture, the oil phase in the samples was enriched and concentrated prior to analysis. Considering the strong extraction selectivity of n-hexane toward high-carbon-number alkanes, liquid–liquid extraction was performed using three portions of 50.0 g n-hexane to extract 100.0 g of the gasfield water sample. Each extraction was conducted in a separatory funnel with vigorous shaking followed by phase separation. The three organic phases were collected and combined, and the solvent was removed by rotary evaporation at 55 °C to obtain a concentrated extract for subsequent compositional analysis (
Figure 1b).
The major components in the concentrated extract were qualitatively identified using
1H NMR spectroscopy, as shown in
Figure 1c. CDCl
3 containing an internal reference was used as the solvent, with the chemical shift referenced to 7.26 ppm. The signals at approximately 0.9 ppm and 1.2 ppm correspond to the proton resonances of methyl (-CH
3) and methylene (-CH
2) groups in hydrocarbon compounds, respectively, while the signal near 5.0 ppm is attributed to residual water or hydroxyl protons (-OH) from trace alcohols. The
1H NMR results indicate that the oil-like impurities introduced into the gasfield water and raw natural gas by wellbore flowback fluids are predominantly hydrocarbon compounds. To further determine the composition and distribution of these hydrocarbons, the concentrated extract was analyzed using GC-MS, and the results are presented in
Figure 1d. Individual components were identified by comparison with the NIST mass spectral database, and their relative compositions were determined by peak integration using the FID detector. The main hydrocarbon impurities are summarized in
Table 1, which shows that the contaminants are primarily n-alkanes with carbon numbers ranging from C
13 to C
18. These hydrocarbons are introduced into the desulfurization system through gasfield water or raw natural gas, leading to contamination of the UDS solvent. The presence of these impurities alters the surface tension and viscosity of the lean solvent, thereby deteriorating the desulfurization efficiency and antifoaming performance of the amine system.
To establish a quantitative analytical method for hydrocarbon impurities in UDS solvents under the actual production conditions of the Pengzhou gas field, representative components were selected for the preparation of the standard oil. As shown in
Table 1, the impurity composition is relatively complex, including various structural types such as n-alkanes and branched alkanes, among which n-alkanes in the C
13–C
18 range exhibit the highest abundance and diversity. Considering the component content, structural representativeness, and commercial availability of reagents, five high-abundance n-alkanes (n-tetradecane, n-pentadecane, n-hexadecane, n-heptadecane, and n-octadecane) were ultimately selected as the standard oil components (
Table 2). These hydrocarbons possess stable structures and are readily amenable to analysis, while also being consistent with the dominant impurity types observed in field samples, thereby improving the quantitative accuracy and practical applicability of the proposed method.
3.2. Theoretical Screening and Selection of Extractants
To establish a rapid quantitative analytical method for hydrocarbon impurities in MDEA-based UDS desulfurization solvents, the national environmental protection standards HJ 970–2018 and HJ 894–2017 were referenced. Both standards are based on the principle of organic solvent extraction followed by subsequent analytical characterization. However, unlike these standard methods that are primarily designed for environmental water samples such as surface water and seawater, the desulfurization amine solutions employed in natural gas purification are composite organic amine aqueous systems. These systems contain multiple functional organic components and exhibit strong alkalinity, high organic content, and relatively high viscosity, which impose more stringent requirements on the selection of extraction solvents. Therefore, it is necessary to screen efficient extractants capable of selectively extracting high-carbon-number hydrocarbon impurities from such complex aqueous amine systems to ensure the accuracy and stability of subsequent quantitative analysis.
According to the recommended procedures in standard methods and relevant literature [
16,
17,
18], commonly used extractants include n-hexane, cyclohexane, petroleum ether (mainly composed of n-pentane), and dichloromethane. To evaluate the suitability of these extractants in the target system, n-hexadecane was selected as a representative model compound for hydrocarbon impurities, while N-methyldiethanolamine (MDEA) was used as the representative amine solvent matrix. COSMO-RS and quantum-chemical interaction analysis have been used for solvent screening, extraction-separation evaluation, and amine-based gas absorption systems. Here, these methods were used as supporting tools to evaluate extractant suitability for the field-derived long-chain hydrocarbon profile and the MDEA-based UDS solvent matrix, rather than to propose a new theoretical model. The extraction performance of different solvents was compared through theoretical calculations to select a suitable organic solvent for extracting hydrocarbon impurities from the MDEA-based UDS solvent matrix.
To preliminarily evaluate the feasibility of different extractants in the target solvent system, the COSMO-RS model was employed to predict the solubility and selectivity of n-hexadecane and MDEA in n-hexane, cyclohexane, n-pentane, and dichloromethane (
Table 3). The solvent capacity (
C∞) reflects the solubility of the solute in the extractant, where a higher
C∞ indicates that a smaller amount of solvent is required to achieve effective extraction. In contrast, the selectivity (
S∞) represents the separation capability of the solvent toward the target system; a higher
S∞ suggests easier separation and a higher purity of the extracted component in the organic phase. An ideal solvent should therefore exhibit both high
C∞ and
S∞ values. In this study, the performance index (
PI∞) was adopted as a comprehensive indicator to evaluate the extraction efficiency, where a larger
PI∞ value corresponds to a more effective extractant. The predicted extraction performance of the four solvents toward n-hexadecane follows the order: cyclohexane > n-pentane > n-hexane > dichloromethane. Except for dichloromethane, the other three solvents exhibit relatively favorable extraction capabilities. In practical industrial applications, however, solvent selection must consider not only extraction performance but also safety and environmental compatibility. Although cyclohexane and n-pentane show promising extraction performance, both present potential operational risks. Cyclohexane is a volatile organic compound with certain toxicity and may pose health hazards under long-term exposure or poorly ventilated conditions, potentially causing neurological damage [
25]. In addition, n-pentane possesses an extremely low boiling point and high vapor pressure, leading to rapid volatilization at ambient conditions. This may result in significant solvent loss during extraction, making quantitative analysis difficult, and may also increase the risk of fire and explosion due to the formation of flammable vapors. Considering these factors comprehensively, n-hexane was selected as the preferred solvent for extracting hydrocarbon impurities from the MDEA-based UDS solvent matrix because it combines satisfactory extraction performance with practical operational safety.
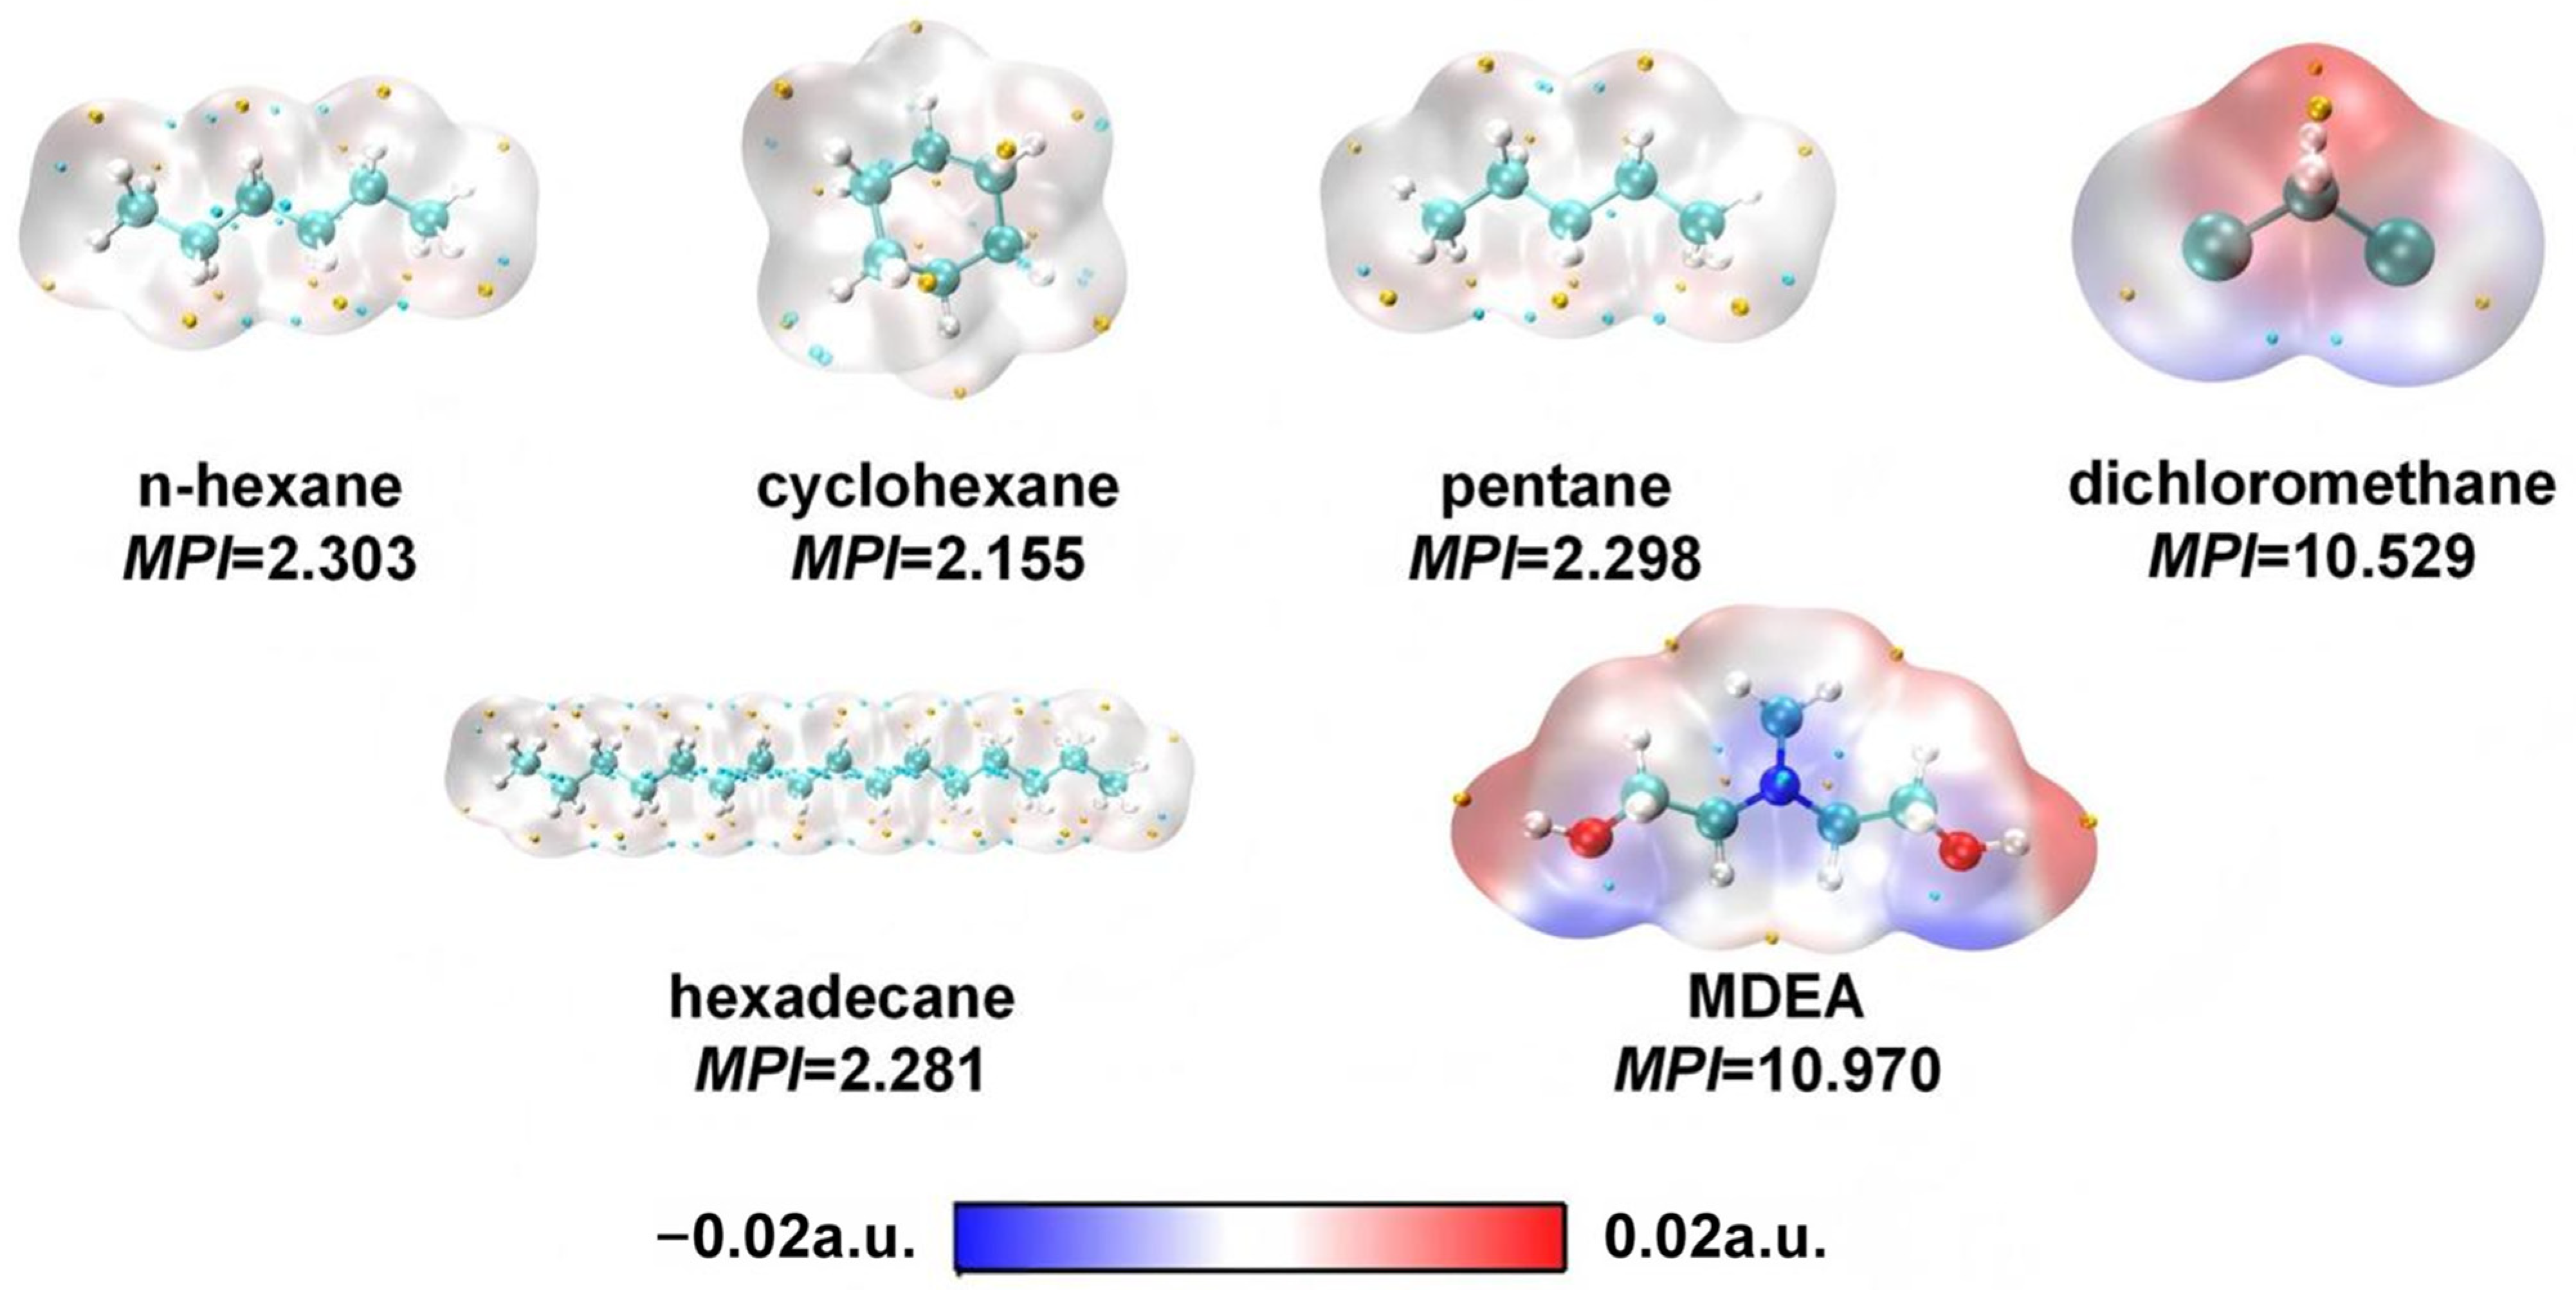
Beyond the prediction of thermodynamic solubility, ESP and MPI analyses were used to compare the polarity matching between the candidate extractants, n-hexadecane, and MDEA. The optimized molecular structures, ESP distributions, and
MPI values of the solvents and solutes are presented in
Figure 2. In the ESP maps, red and blue regions correspond to positive and negative electrostatic potentials, respectively, while the local maxima and minima are indicated by yellow and cyan points. As shown in
Figure 2, n-hexane, cyclohexane, n-pentane, and n-hexadecane exhibit relatively low polarity with a nearly uniform distribution of positive and negative electrostatic potentials. In contrast, dichloromethane displays a pronounced dipole character, where the regions surrounding the Cl atoms are dominated by negative electrostatic potential, while the central region exhibits positive potential. For MDEA, distinct polar regions are observed on the molecular surface: the vicinity of the N atom presents a strong negative electrostatic potential, whereas the -OH groups exhibit positive potential, indicating the relatively strong polarity of the molecule. The
MPI value was employed as a quantitative descriptor of the overall molecular polarity. Solvation behavior is primarily governed by the polarity compatibility between solvent and solute molecules. Compared with MDEA, the
MPI values of n-hexane, cyclohexane, and n-pentane are closer to those of n-hexadecane, suggesting a stronger solvation tendency for n-hexadecane in these solvents. In contrast, MDEA exhibits a higher solvation tendency in dichloromethane, consistent with its relatively higher polarity.
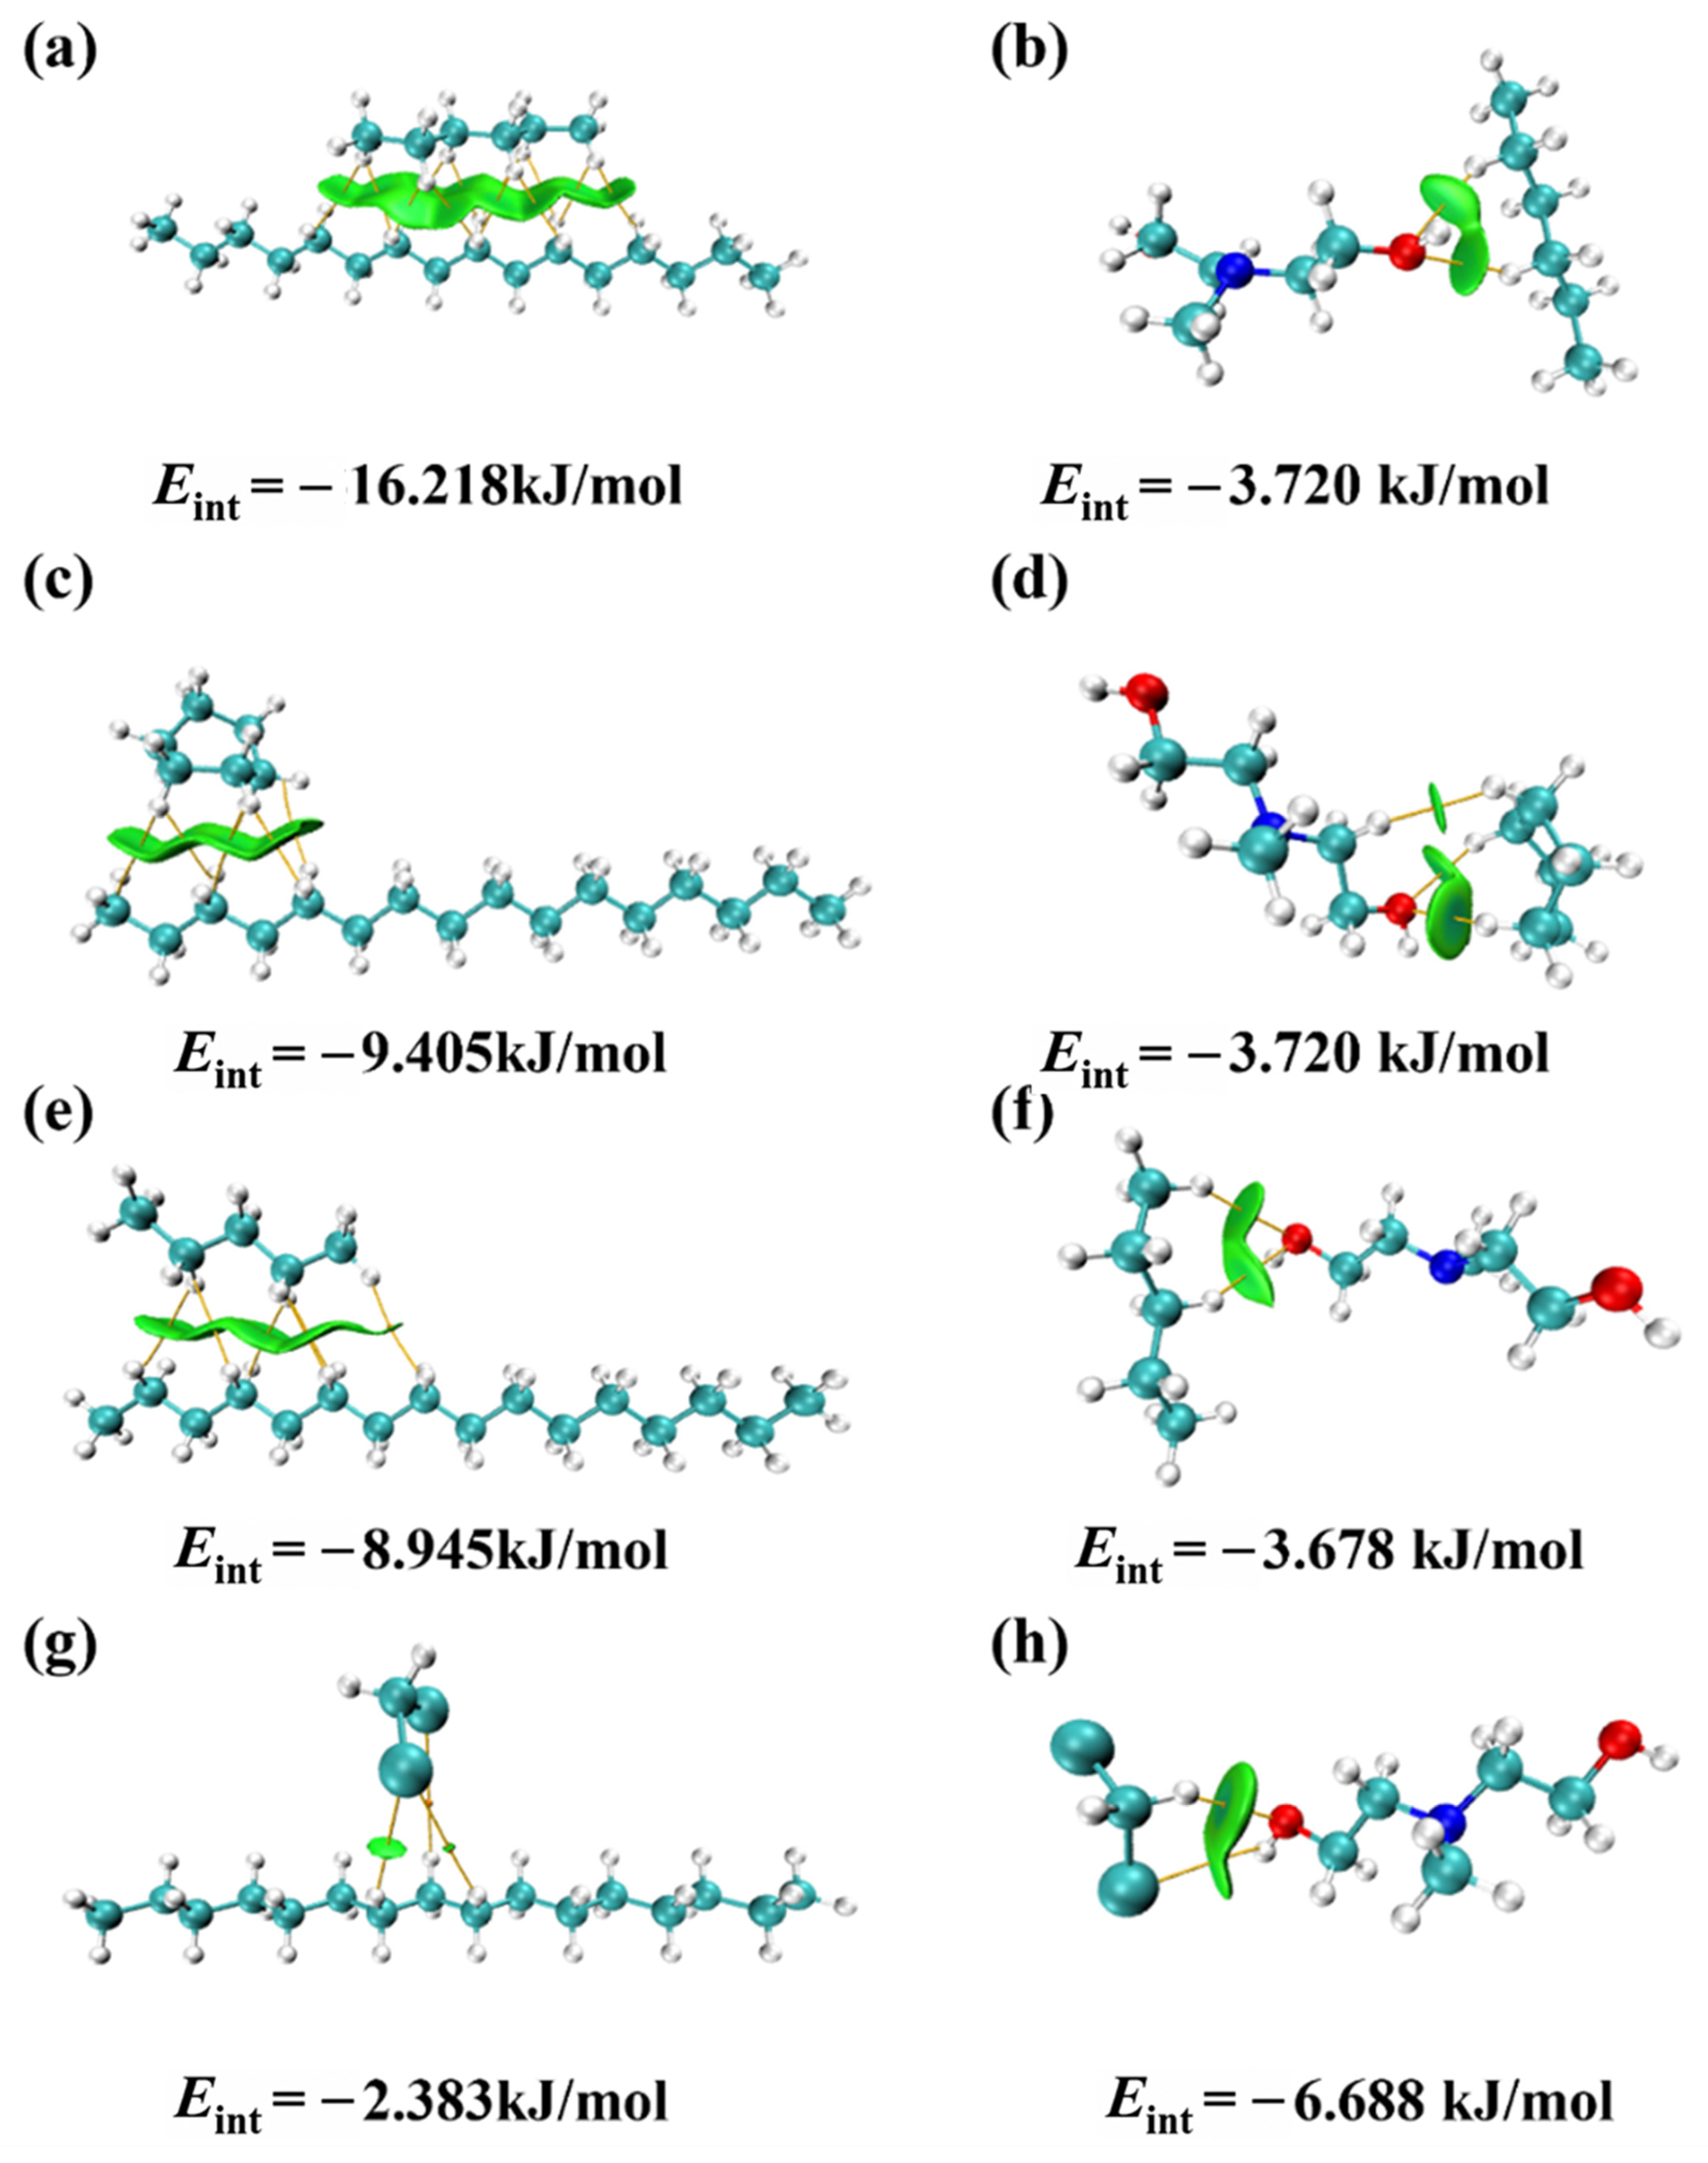
The selectivity and solubility of solvents toward solutes are closely related to the intermolecular interactions within the solvent-solute system. The calculated results show that the Eint between n-hexane, cyclohexane, and n-pentane and n-hexadecane is significantly larger than that between these solvents and MDEA. This result indicates that these three solvents exhibit a stronger affinity for n-hexadecane. The difference in interaction energies provides a driving force for the selective separation of n-hexadecane from MDEA. In contrast, the Eint between dichloromethane and n-hexadecane is smaller than that between dichloromethane and MDEA, indicating that dichloromethane has a relatively weak affinity for n-hexadecane and is therefore not suitable as an extraction solvent in this system. In addition, a larger difference in interaction energy between a solvent and the two solutes indicates higher separation selectivity toward the target component. Among the four solvent systems, n-hexane exhibits the largest , indicating the highest separation selectivity.
To further elucidate the intermolecular interactions between solutes and solvents, the independent gradient model based on Hirshfeld partition (IGMH) method was employed to visualize the weak interactions in different solute-solvent systems. The isosurface maps generated at δ
g = 0.002 a.u. are shown in
Figure 3. The isosurfaces between the extractants and solutes are predominantly green, indicating that van der Waals interactions dominate in these systems. A larger isosurface area and darker color correspond to stronger intermolecular interactions. The n-hexane + n-hexadecane system (
Figure 3a) exhibits a continuous and extensive interaction region, which is more pronounced than the localized chain-ring contact observed in the cyclohexane + n-hexadecane system (
Figure 3c). Compared with n-pentane (
Figure 3e), n-hexane possesses a longer carbon chain, which facilitates the formation of more extended and continuous isosurface regions with n-hexadecane and promotes a more stable parallel stacking configuration. This structural feature enhances the intermolecular interactions between the two molecules. In addition, the attractive interactions between MDEA and the solvent molecules are mainly governed by C-H···O interactions. Except for dichloromethane, the isosurface areas between the solvents and n-hexadecane are larger than those between the solvents and MDEA, which is consistent with the interaction energy analysis and further confirms the extraction selectivity of n-hexane toward n-hexadecane.
Overall, n-hexane showed favorable thermodynamic behavior and intermolecular interactions and was selected as the extraction solvent for hydrocarbon impurities in the MDEA-based UDS solvent system.
3.3. Evaluation of the UV Spectrophotometric Method
Referring to the Chinese environmental protection standard HJ 970–2018 Water Quality Determination of Petroleum Oils by Ultraviolet Spectrophotometric Method (Trial), an attempt was made to establish an analytical method for determining the oil content in UDS lean solution. This standard is mainly applicable to the determination of petroleum substances in surface water, groundwater, and seawater, and is primarily used in environmental monitoring and pollution control. The target analytes are petroleum hydrocarbons, including mineral oils and diesel-like compounds, which mainly consist of low- to medium-polarity hydrocarbons. In this method, the sample is extracted with n-hexane under pH ≤ 2 conditions to transfer hydrocarbon compounds into the organic phase. The extract is then dehydrated using anhydrous sodium sulfate and purified with magnesium silicate to remove interference from polar substances. The absorbance of the final solution is measured at 225 nm. According to the Lambert Beer law, the absorbance shows a linear relationship with the concentration of hydrocarbons. A calibration curve is established, and the hydrocarbon impurity content in the sample (
ρ, mg/L) is calculated using Equation (6).
where
A is the absorbance of the sample,
A0 is the absorbance of the blank,
a and
b are the intercept and slope of the calibration curve,
V1 is the volume of the extract, and
V is the volume of the sample.
This method clearly requires that the transmittance of the extraction solvent n-hexane at 225 nm, using water as the blank reference, should be greater than 90%. Otherwise, a dearomatization treatment is required. In commonly used analytical grade n-hexane products from several domestic suppliers, trace amounts of aromatic compounds are generally present. These impurities exhibit strong absorption in the ultraviolet region and reduce the transmittance, resulting in values that do not meet the standard requirement and therefore cannot be directly used for extraction experiments. In order to screen suitable extraction solvents for ultraviolet detection, several chromatographic-grade or higher purity n-hexane reagents from different suppliers were selected according to the standard for testing. The relevant information is listed in
Table 4.
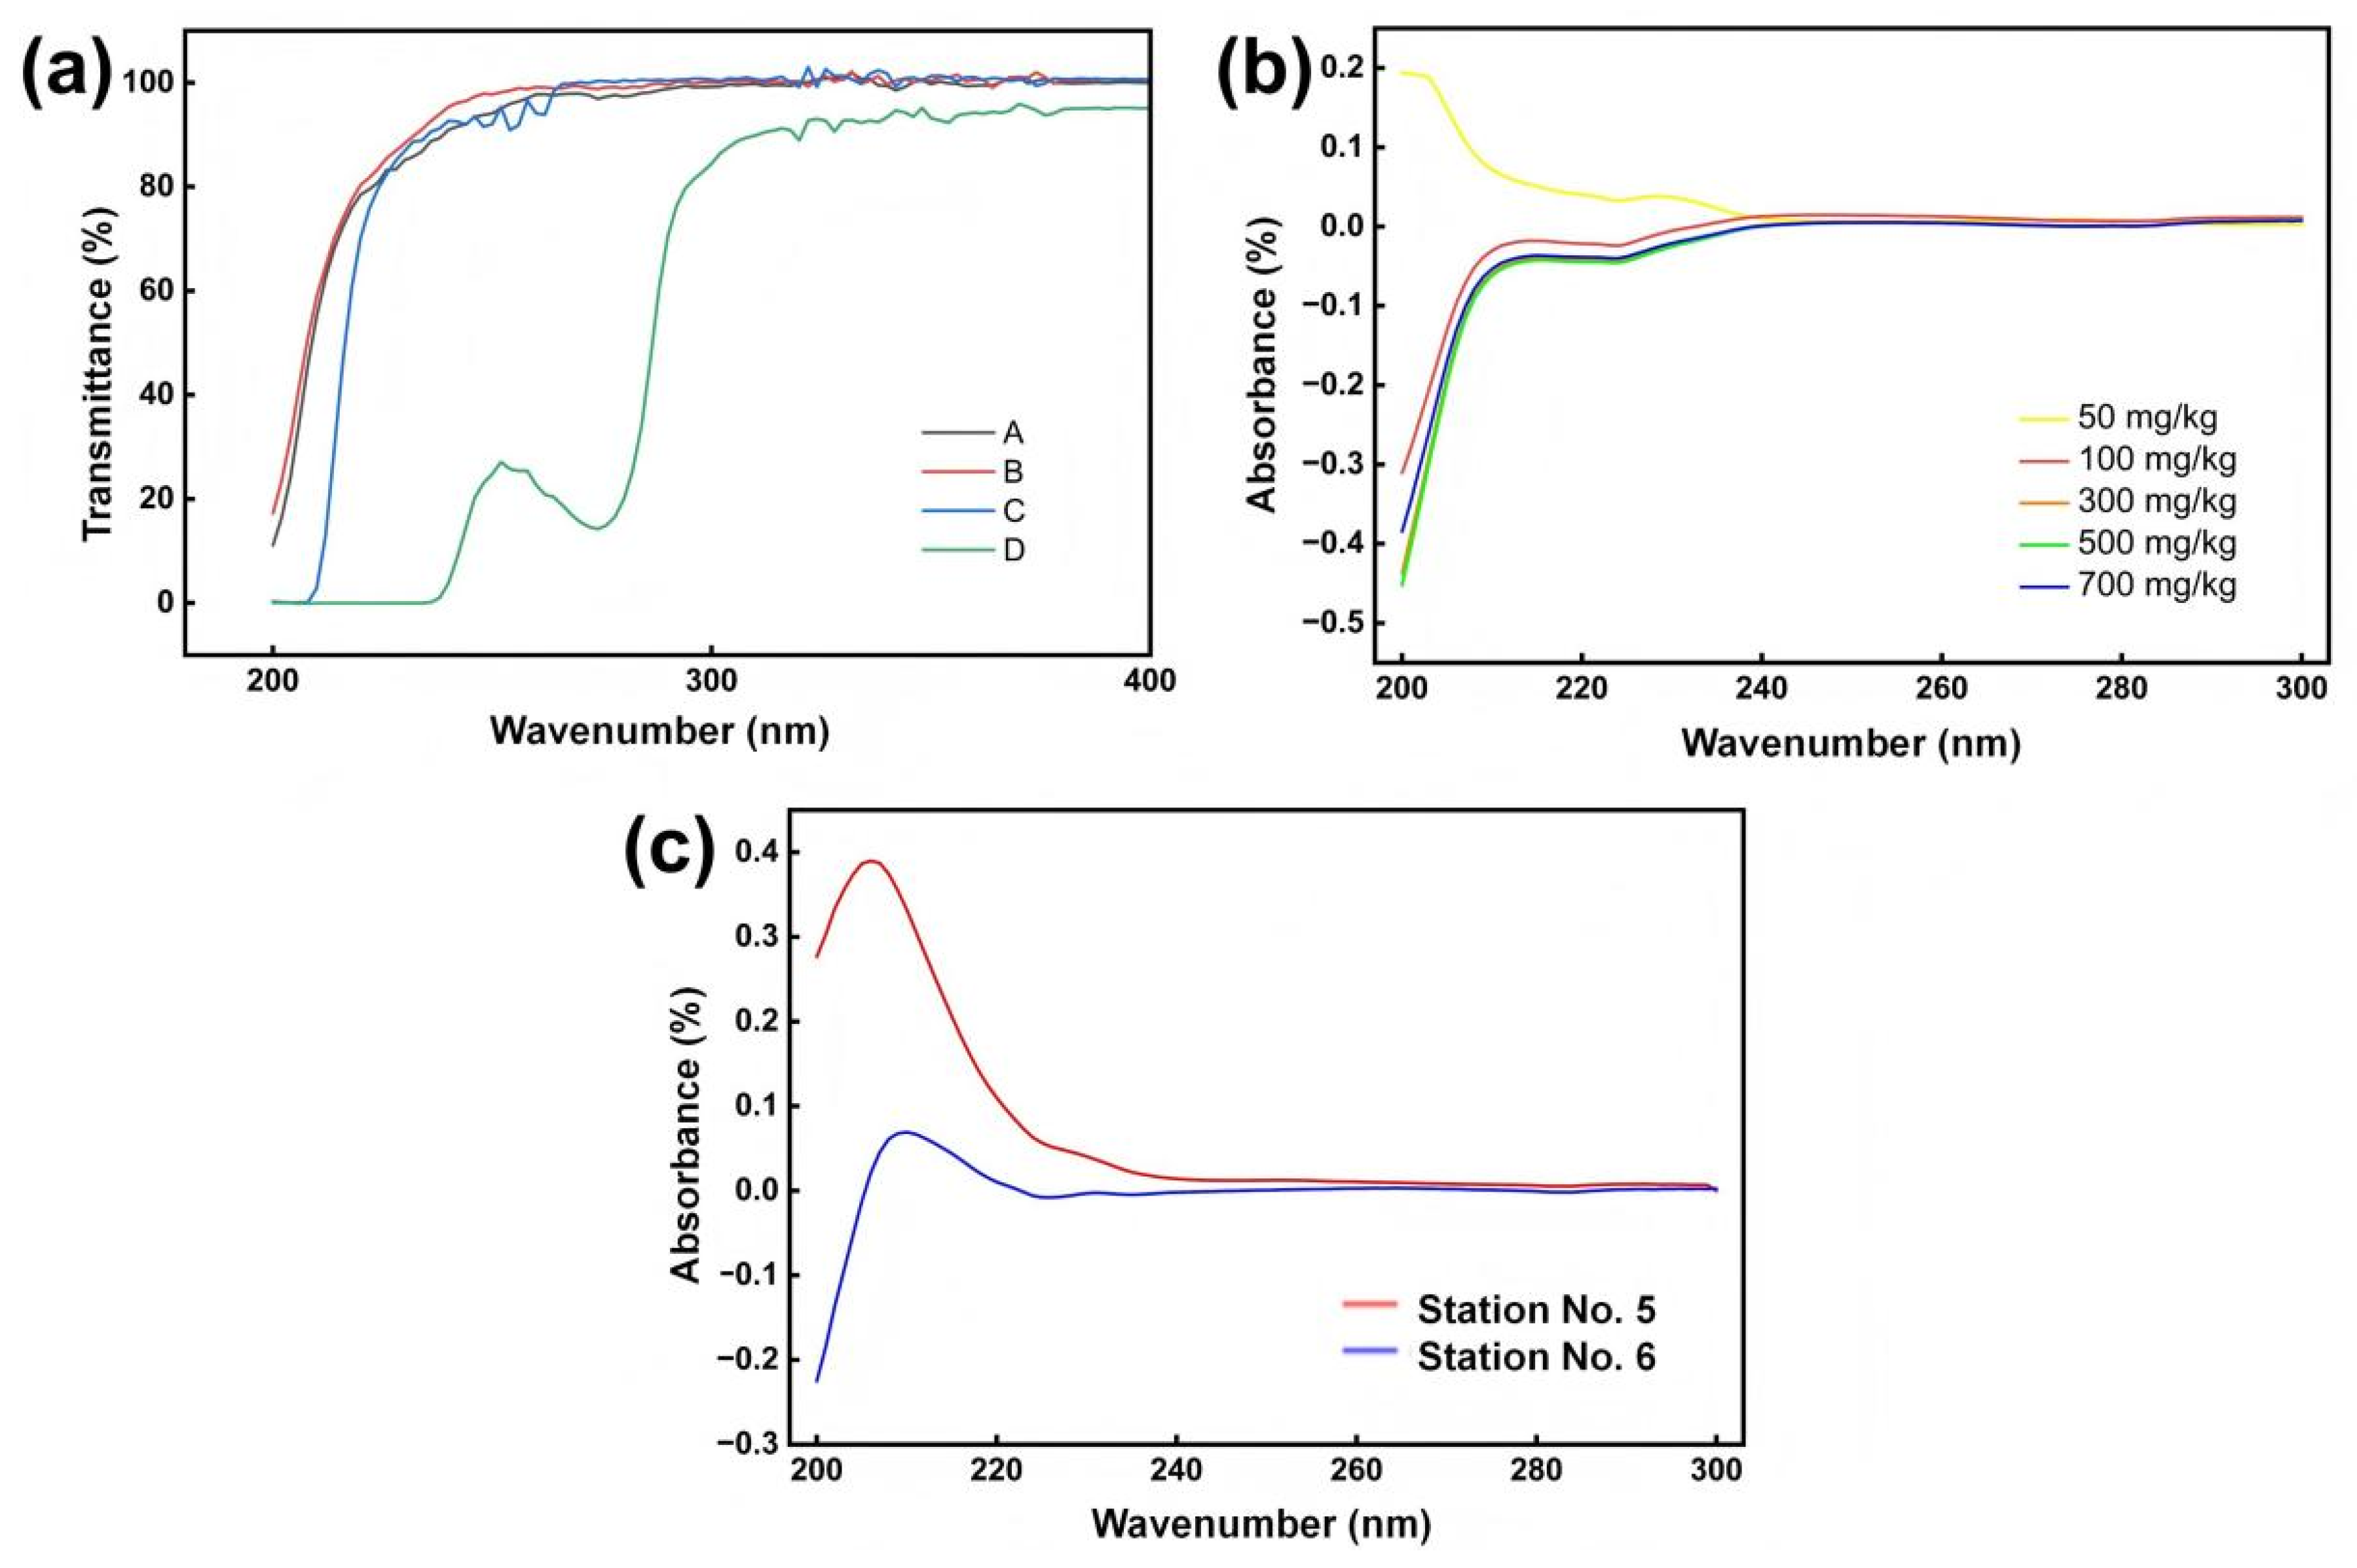
Figure 4a shows the transmittance results of four n-hexane samples at 225 nm. All values are lower than 90%, indicating that the method has strict requirements for reagent purity. Based on n-hexane B, which showed the transmittance closest to the standard requirement, the solvent was alternately washed three times with 5 wt% sulfuric acid and deionized water and then dehydrated using anhydrous sodium sulfate. After treatment, the transmittance at 225 nm increased to 92.35%, meeting the standard requirement and allowing the solvent to be used as the extraction agent in subsequent ultraviolet spectrophotometric determination.
In addition, the ultraviolet absorption method requires the addition of dilute sulfuric acid to the UDS lean solution sample to adjust the pH to below 2 during sample preparation. This treatment contaminates the analyzed sample and prevents the solution from being used for other solvent property tests. The treated solution also cannot be recycled after analysis. Therefore, the ultraviolet spectrophotometric method is not suitable for determining the hydrocarbon impurity content in the UDS composite desulfurization solvent from the western Sichuan gas field.
According to the requirements of the standard method, a standard oil sample was quantitatively added to a 45 wt% UDS-3 solution to prepare five series of samples with oil contents of 50 mg/kg, 100 mg/kg, 300 mg/kg, 500 mg/kg, and 700 mg/kg. The solutions were acidified with 1 wt% dilute sulfuric acid to pH ≤ 2 and then extracted with qualified n-hexane for liquid–liquid extraction. The absorbance of the sample solution
A and the blank
A0 was recorded. The ultraviolet absorption spectra of the five extracts in the wavelength range of 200 to 300 nm are shown in
Figure 4b. The results show that no obvious characteristic peak appears at the recommended wavelength of 225 nm. A weak absorption peak is observed in the range of 203 to 210 nm. However, the ultraviolet transmittance in this region is inherently low, resulting in unstable signals, and negative absorbance values are even observed for some samples. Although a partial response appears near the absorption region, the absorbance does not show a linear relationship with the hydrocarbon impurity concentration, and an effective calibration curve cannot be established. Compared with the example described in the standard method, the problem may originate from the composition of the standard oil used in this study. The standard oil mainly consists of normal alkanes, which are low-polarity saturated hydrocarbons with weak ultraviolet absorption ability. In contrast, the standard method is more suitable for petroleum compounds such as isoalkanes, cycloalkanes, or hydrocarbons containing unsaturated bonds with relatively higher polarity. Therefore, no effective response is observed in the target wavelength region in this study.
For further verification, the same ultraviolet analytical method was applied to directly extract produced water samples from gas treatment stations No. 5 and No. 6. The results are shown in
Figure 4c. Weak absorption peaks appear at 206 nm and 210 nm for the two samples, respectively. This observation indicates that the hydrocarbon impurity compositions differ significantly between different stations, and their ultraviolet absorption characteristics are not consistent. As a result, the universality of this method is limited for practical applications.
3.4. Attempt to Establish an Extraction-Gas Chromatography Method
To further develop an analytical method suitable for determining hydrocarbon impurities in MDEA-based UDS desulfurization solvents, the national environmental protection standard HJ 894-2017 Water Quality Determination of Extractable Petroleum Hydrocarbons (C10–C40) by Gas Chromatography was referenced to establish a quantitative analysis procedure based on liquid–liquid extraction coupled with gas chromatography. This standard method is primarily applicable to the determination of extractable petroleum hydrocarbons in the C10–C40 range in surface water, groundwater, seawater, and industrial wastewater. The target components include medium- and low-polarity hydrocarbons such as aliphatic hydrocarbons, alicyclic hydrocarbons, and certain aromatic hydrocarbons.
In this method, petroleum substances in water samples are extracted with an organic solvent under acidic conditions with a pH ≤ 2. The extract is then dehydrated using anhydrous sodium sulfate, concentrated by rotary evaporation, purified using a magnesium silicate adsorbent, and finally diluted to volume with n-hexane. The prepared extract is analyzed using a gas chromatograph equipped with a flame ionization detector. Qualitative identification is carried out based on retention time, while the peak area within the defined time window is quantified using an external standard calibration curve. The hydrocarbon impurity content in the sample
ρ in mg/L is calculated according to Equation (7).
where
Ax represents the total peak area of the sample after subtracting column bleed,
a and
b denote the intercept and slope of the calibration curve, respectively,
V1 is the volume of the extraction solution,
V is the sample volume, and
f is the dilution factor.
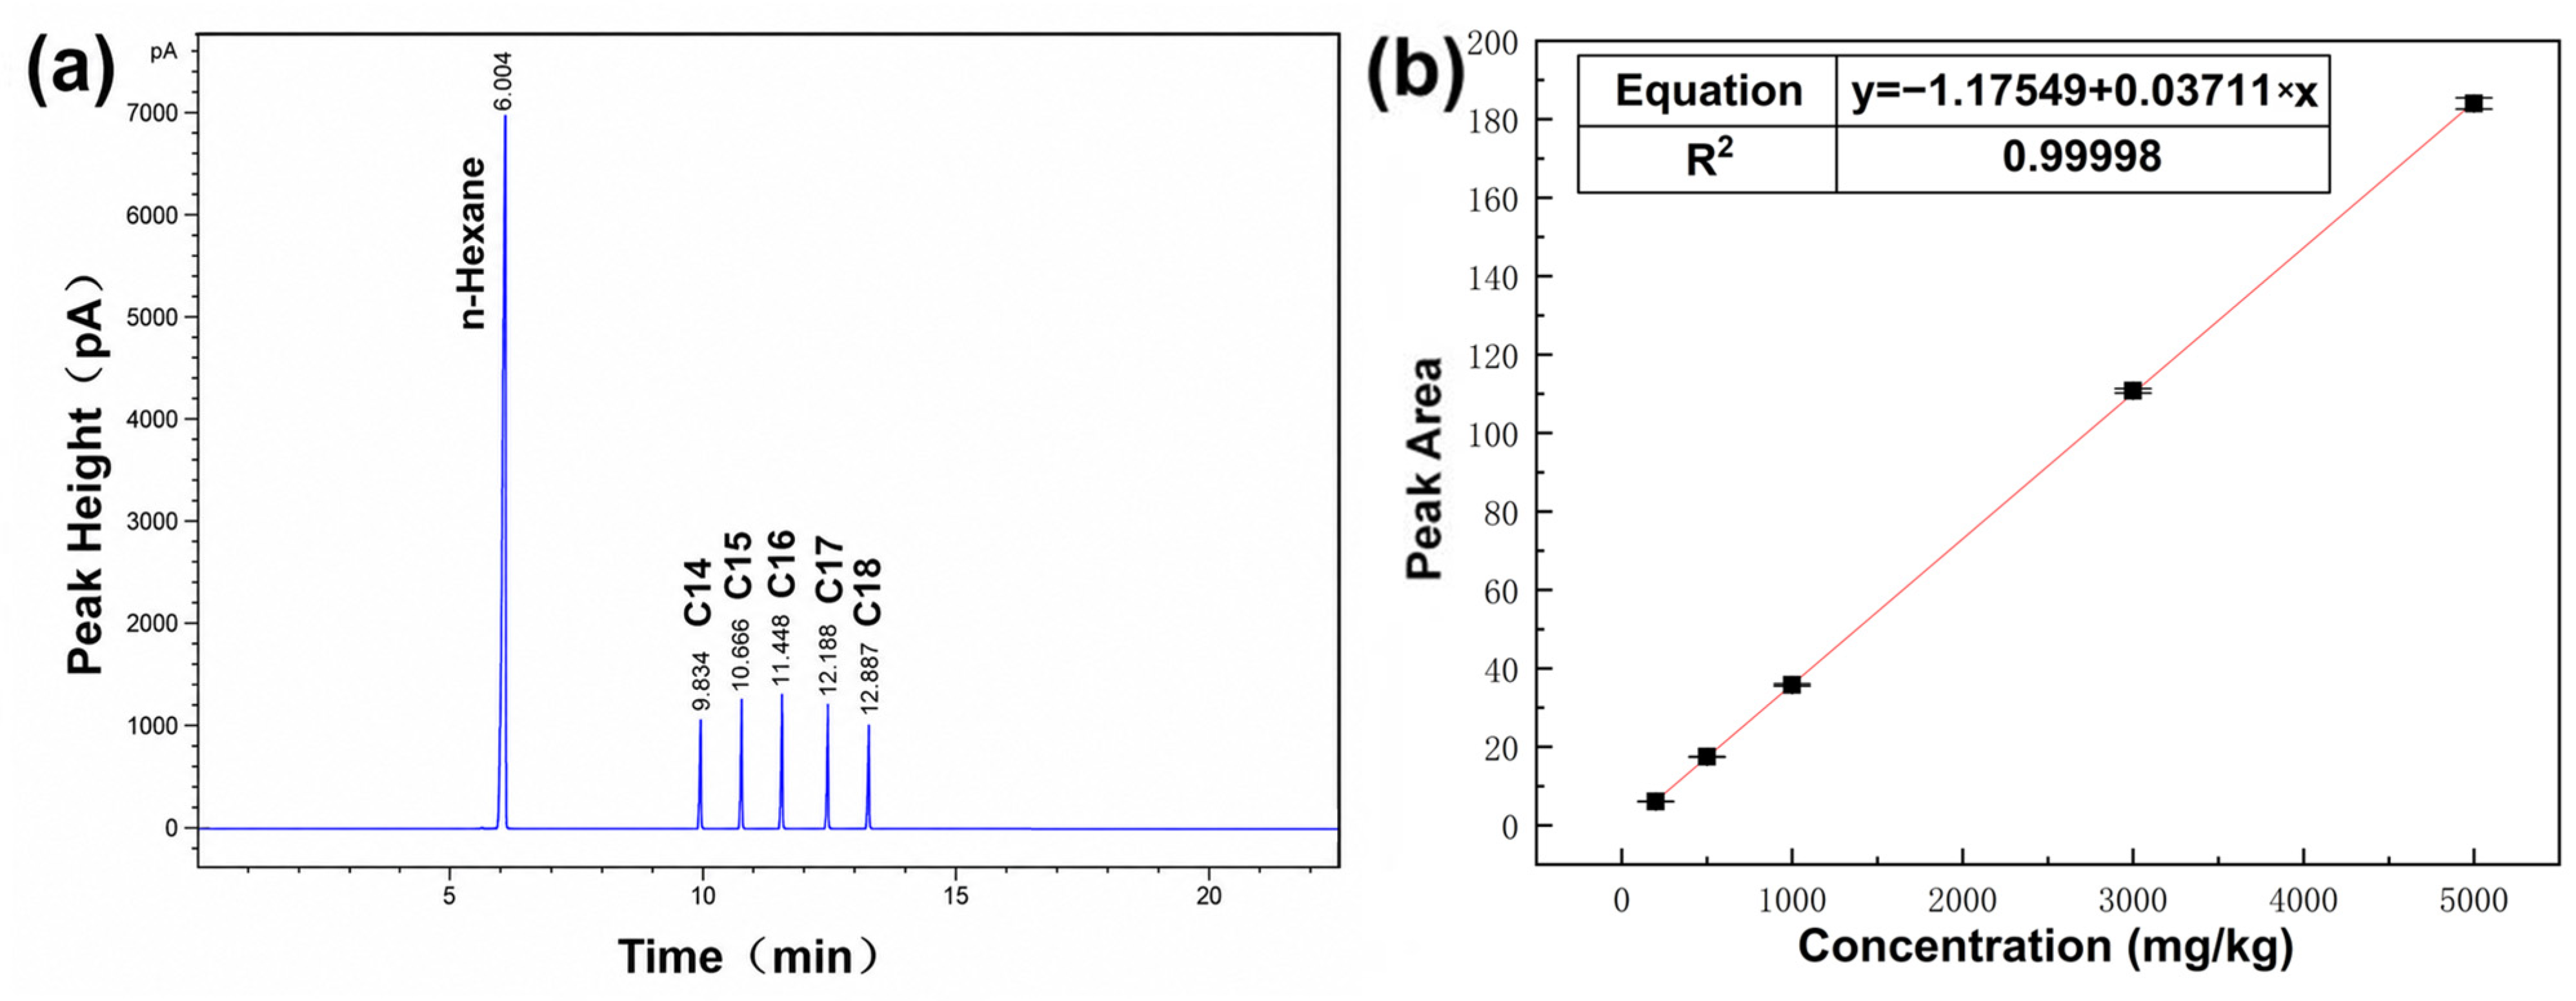
Referring to this standard, and considering the composition characteristics of hydrocarbon impurities in the Western Sichuan gas field as well as the specific properties of the MDEA-based UDS solvent, n-hexane was selected as the preferred extraction solvent. Standard oil masses of 0.006 g, 0.015 g, 0.030 g, 0.090 g, and 0.150 g were accurately weighed into test tubes using a high-precision balance. Each sample was then diluted to 30.00 g with n-hexane and thoroughly mixed. The resulting standard series had mass concentrations of 200 mg/kg, 500 mg/kg, 1000 mg/kg, 3000 mg/kg, and 5000 mg/kg, respectively. A calibration curve was established by plotting the mass concentration of the standard series mg/kg on the horizontal axis and the corresponding total chromatographic peak area on the vertical axis. The gas chromatogram of the standard oil is shown in
Figure 5a, and the calibration curve is presented in
Figure 5b. The regression coefficient of the calibration curve is greater than 0.999, which meets the requirements of the analytical method.
The concentration obtained from this calibration curve is reported as the standard-oil-equivalent total hydrocarbon concentration. Since the method targets total hydrocarbon monitoring rather than individual-component quantification, component-specific FID sensitivity coefficients were not applied. The reference standard oil was prepared from the dominant n-C14 to n-C18 alkanes identified in field samples, making it representative of the target hydrocarbon profile. Possible response differences from branched alkanes, isoprenoid hydrocarbons, and other minor components were evaluated through the spiked-sample validation described below.
Further experiments were conducted to evaluate the precision and accuracy of the extraction-gas chromatography method. Standard oil masses of 0.025 g, 0.025 g, 0.050 g, and 0.150 g were accurately weighed and diluted with 45% desulfurization solution to a total mass of 50.00 g, yielding four samples with concentrations of 500 mg/kg, 500 mg/kg, 1000 mg/kg, and 3000 mg/kg, labeled as 1, 2, 3, and 4. Each sample was completely transferred into a 125 mL separatory funnel. Then 10 g of n-hexane, weighed to an accuracy of 0.0001 g, was used to rinse the sampling bottle and subsequently transferred into the separatory funnel. The mixture was vigorously shaken for 2 min, with the stopcock periodically opened to release pressure. After phase separation, the upper organic phase was collected as the extract, and the mass of the extract was measured and recorded. The extract was transferred into an Erlenmeyer flask containing 3 g of anhydrous sodium sulfate. The flask was sealed and shaken several times, followed by standing for phase separation. If the anhydrous sodium sulfate was completely agglomerated, additional sodium sulfate was added until no further agglomeration occurred. When the petroleum hydrocarbon content in the original sample was relatively high, the extract could be directly analyzed by gas chromatography, in which case the dilution factor
f was equal to 1. If the hydrocarbon content in the original sample was low and possibly below the detection limit of gas chromatography, the extract could be concentrated to a volume not less than 1 mL using a concentration device. The recommended conditions for concentrating n-hexane were a water bath temperature of 30 °C and a vacuum of 260 hPa. The mass of the extract before and after concentration was recorded to calculate the concentration factor. A fresh UDS solution was treated following the same procedure and used as a blank control sample. Each sample was analyzed in triplicate. The mean value, relative standard deviation, and relative error were calculated for each sample. The results are presented in
Table 5. The relative standard deviations of the four prepared samples ranged from 1.14% to 1.68%, and the relative errors ranged from −4.31% to 4.44%. These results indicate that the method is suitable for determining hydrocarbon impurities in MDEA-based UDS desulfurization solvents.
Under conditions without concentration of the extract, the optimal measurement range of this method is approximately 200 mg/kg to 1000 mg/kg. When the petroleum hydrocarbon content is lower than 200 mg/kg, the gas chromatographic signal becomes weak, and the extract should be concentrated before analysis. When the hydrocarbon content in the desulfurization solvent exceeds 1000 mg/kg, emulsification may occur in the original solvent sample, and the system may appear as a suspension. In this case, the sample should be thoroughly shaken to ensure homogeneity before extraction. During phase separation, emulsification may still influence the analytical results. To promote phase separation, the sample can be transferred into a centrifuge tube and centrifuged at 5000 r/min for 3 min. The concentration step is sometimes difficult to control. If the extract volume after concentration is less than 1 mL, n-hexane can be added to adjust the final volume to 1 mL.





 ,
,