Article

Separation and Reutilization of Nitrogen and Phosphorus in Stormwater/Greywater Using Chinese Herbal Plant-Based Green Roof Wetland System

1
Medical College, Pingdingshan University, Pingdingshan 467000, China
2
Institute for Eco-Environmental Research of Sanyang Wetland, Wenzhou University, Wenzhou 325014, China
3
College of Life and Environmental Science, Wenzhou University, Wenzhou 325035, China
*
Authors to whom correspondence should be addressed.
Separations 2026, 13(2), 74; https://doi.org/10.3390/separations13020074
Submission received: 22 January 2026 / Revised: 18 February 2026 / Accepted: 19 February 2026 / Published: 20 February 2026
(This article belongs to the Section Environmental Separations)

Abstract

Stormwater and greywater are increasingly recognized as freshwater resources, and the effective separation and reutilization of nitrogen (N) and phosphorus (P) from these streams is vital for water quality improvement and urbanization sustainability. In this study, we constructed a pilot-scale hydroponic green roof wetland system planted with two economically important Chinese herbal plant species (Mentha spicata L. (ML) and Basella alba L. (BL)) to separate and reutilize N and P from synthetic stormwater/greywater. The results reveal that the highest plant biomass was obtained at an ML:BL ratio of 1:3, indicating their superior adaptation to rooftop hydroponics with synthetic stormwater/greywater. This configuration also achieved the strongest water purification, with substantial separation and reutilization efficiency of N (82.09%) and P (81.90%). Furthermore, the lowest microbial richness in the ML roots at this specific plant ratio suggested that increasing BL may enhance ML’s allelopathic effects. An increase in the BL proportion was further associated with a gradual shift in the dominant ML root-associated microorganisms toward microeukaryotic taxa. The green vegetation of the two plant species also effectively suppressed algal blooms (especially diatoms) in the hydroponic rooftop system. This study demonstrates that a Chinese herb-based green roof wetland system can effectively separate and reuse N and P from stormwater/greywater while concurrently purifying water and producing economic crops.

1. Introduction

Urbanization has accelerated a range of environmental challenges, including water scarcity, acid deposition, under-capacity drainage infrastructure, the urban heat island (UHI) effect, and the deterioration of urban water quality. To address these impacts, cities are increasingly adopting low-impact development (LID) strategies [1].
Stormwater runoff is a significant source of urban pollution. As it flows across impervious surfaces, it mobilizes heavy metals, hydrocarbons, and other contaminants that are discharged to receiving waters (rivers, lakes, and coastal zones). Furthermore, elevated levels of nitrogen and phosphorus in runoff frequently trigger eutrophication and algal blooms. Stormwater can carry pathogens such as Escherichia coli, parasite ova, and viruses (e.g., norovirus), increasing risks of waterborne illness upon exposure. Crucially, stormwater is a key pathway for the transport of microplastics (MPs) into surface water bodies. Consequently, recent research has emphasized approaches that reduce stormwater and wastewater impacts on urban environments. Green infrastructure (GI) is central to this effort, as it improves stormwater management and reduces pollution loads [2,3,4].
Green roofs (GRs) are core components of both LID and GI, utilizing rooftop vegetation to retain rainfall and deliver multiple co-benefits, including energy savings [5], the attenuation of extreme rainfall [6], oxygen release, and carbon sequestration [7,8]. As key mechanisms for the preliminary interception of stormwater runoff pollution, GRs offer a crucial opportunity to reduce the burden on local water treatment facilities. By intercepting runoff near its source, GRs can reduce pollutant loads entering drainage networks and lower demands on downstream treatment. Research increasingly targets rooftops as an urban greening opportunity [9,10], with GRs providing ecosystem services, such as temperature moderation, carbon emission reduction [11,12], air quality improvement [13], UHI mitigation [14], and biodiversity gains [15]. Evidence shows that GRs can remove nutrients (N, P) from runoff and capture emerging contaminants, such as microplastics [16]. The current types, operational mechanisms, and design methodologies of GR systems have been widely studied, aiming to enhance their performance for stormwater and wastewater management, thereby achieving efficient water quality purification and minimizing associated pollution risks [17,18]. Building on this foundation, the hydroponic green roof system (HGRS) incorporates hydroponics to enhance rainwater and wastewater reclamation, reduce loads to sewage treatment plants, lower the bulk density of conventional GRs [19], and stabilize indoor temperatures [20,21].
The selection of appropriate plant species is a critical determinant in the design and efficacy of green roof systems (GRs) [22,23]. Under mixed planting, species differ in survival and green coverage [24], and plant combinations can shape effluent quality [25,26] and carbon sequestration [27]. Therefore, we evaluated Mentha spicata L. (ML) and Basella alba L. (BL) in varied ratios within an HGRS treating stormwater runoff. Some studies have explored green roof systems for water purification, considering the selection of plant species and planting substrates [28,29]. This study is the first to propose constructing a hydroponic green roof wetland system planted with economically important Chinese herbal plant species, aiming to simultaneously separate and reutilize N and P from stormwater/greywater, harvest economic crops, and realize on-site treatment of decentralized wastewater. We assess how plant composition influences purification performance, plant physiological status, water physicochemistry, and algal and microbial communities. Our goal is to identify an optimal planting strategy for decentralized stormwater and wastewater treatment that reduces urban pollution and advances LID practice.

2. Materials and Methods

2.1. Experimental Setup

The experimental apparatus (Figure 1) consisted of a stainless steel tank (260 cm × 40 cm × 30 cm) used as a soilless hydroponic system. Opaque polyethylene boards (30 cm × 40 cm) were used to form floating islands. Seedlings were placed individually in cotton-lined planting baskets (one plant per basket), which were fitted to the boards so that roots were submerged in the water below, while shoots remained above. Each treatment consisted of five polyethylene floating boards, with 12 plants per board (60 plants per group). All treatments were performed in triplicate. The water depth was maintained at 15 cm, with a hydraulic retention time (HRT) of 7 days. Influent (distribution tank) and effluent (apparatus outlet) water were sampled weekly (250 mL, polyethylene bottles), and samples were refrigerated immediately at 4 °C. The experiment ran for 70 days, from October to December, during the autumn–winter season.
Six groups were established: five plant-treatment groups with different ML:BL planting ratios and one plant-free control group (CK). Each group was experimented on in triplicate. Apparatus designations are shown in Table 1. The experiment was conducted on a rooftop, approximately 15 m above ground level. The system was fully exposed (no overhead cover) and ran under ambient weather conditions.

2.2. Influent Preparation

In order to ensure sufficient and continuous influent for the continuous experiments in this study, synthetic stormwater/greywater was synthesized according to the water quality of real stormwater/greywater and the Grade 1-B standard of the “Discharge Standard of Pollutants for Municipal Wastewater Treatment Plant” (GB18918-2002) [30]. Prior to nutrient addition, tap water was left to stand for 24 h to eliminate residual chlorine. Subsequently, the influent was synthesized by adding analytical reagent (AR)-grade glucose (C6H12O6), potassium dihydrogen phosphate (KH2PO4), potassium nitrate (KNO3), and ammonium chloride (NH4Cl), all sourced from Sinopharm Chemical Reagent Co., Ltd. (Shanghai, China). The concentrations were adjusted to the following target values: total nitrogen (TN) at 20 mg/L, ammonium nitrogen ( NH 4 + -N) at 15 mg/L, total phosphorus (TP) at 1 mg/L, and chemical oxygen demand (COD) at 60 mg/L.

2.3. Analytical Methods

2.3.1. Plant Root Morphology and Biomass

Before the trial, 30 ML and 30 BL plants of similar size, uniform vigor, and good overall health were selected. Root and shoot length were recorded. The root systems were scanned using a Microtek scanner (Model: Phantom 9980XL, Shanghai, China), and the images were analyzed with the WSeen Root Analysis System (LA-S, Hangzhou, China) to determine total root length, root surface area, root volume, and average root diameter. Following the length and root morphology analyses, the roots and aerial parts were separated and placed in an oven set at 80 °C. They were dried to a constant weight to determine their initial biomass. At harvest, the planting cotton and baskets were removed, the plants were rinsed, and the same measurements were repeated. Biomass growth rate was calculated as follows:
Biomass   growth   rate   =   Final   biomass initial   biomass   Initial   biomass

2.3.2. Water Quality and In Situ Parameters

The influent and effluent concentrations of TN,  NH 4 + -N,  NO 3 -N,  NO 2 -N, TP,  PO 4 3 -P, and CODcr were determined using Chinese national standard spectrophotometric methods. In situ measurements of dissolved oxygen (DO), water temperature (WT), and pH were obtained with the apparatus using a YSI portable water-quality multimeter (YSI Incorporated, Yellow Springs, OH, USA), and effluent turbidity was measured using a HACH 2100Q turbidimeter (HACH, Loveland, CO, USA).

2.3.3. Rhizosphere Microbiome

Post-harvest roots were transported on ice. Roots were placed in sterile tubes and vortex-washed twice with 10 mL of 0.1 M potassium phosphate (K3PO4) buffer (pH 8.0), and then transferred to 20 mL of the same buffer in a 50 mL sterile bottle and sonicated intermittently (160 W, 30 s on/off cycles; total time: 10 min). The washing solutions from all three steps were pooled and passed through a 0.22 μm filter membrane, which was then flash-frozen in liquid nitrogen and stored at −80 °C for long-term preservation. The remaining root tissue was washed twice with 70% ethanol and stored at −80 °C.
DNA from root surfaces was extracted with the E.Z.N.A.® Soil DNA Kit (Omega Bio-tek, Norcross, GA, USA). The integrity of the extracted DNA was assessed via 1% agarose gel electrophoresis, and its purity was evaluated using a NanoDrop 2000 spectrophotometer (Thermo Fisher Scientific, Waltham, MA, USA). The V3-V4 hypervariable region of the 16S rRNA gene was amplified via PCR using universal primers 338F and 806R. The resulting amplicons were separated on a 2% agarose gel and purified using the AxyPrep DNA Gel Extraction Kit (Axygen Biosciences, Union City, CA, USA). After quantification with a Quantus™ Fluorometer (Promega, Madison, WI, USA), sequencing libraries were constructed using the NEXTFLEX Rapid DNA-Seq Kit (Bioo Scientific, Austin, TX, USA). Finally, paired-end sequencing (2 × 300 bp) was performed on the Illumina MiSeq platform. To characterize the alpha diversity of the plant root microbial community in different treatment groups, the Shannon and Simpson indexes were calculated using the Mothur software package (version v.1.30.2). The Shannon index was employed to evaluate community diversity, incorporating both richness and evenness. Its higher values indicate increased microbial complexity. The Simpson index was used to assess community dominance, where its higher values represent lower diversity levels, providing a reciprocal perspective to the Shannon index. To eliminate potential bias derived from variations in sequencing depth, all samples were subsampled (rarefied) to a uniform depth based on the minimum number of sequences obtained across samples before diversity calculation.

2.3.4. Algae Analysis

Algae were quantified using the 0.1 mL counting chamber-microscopy method (HJ 1216-2021 [31]). At the end of the experiment, 1 L of water samples was collected per group, fixed immediately with 15 mL of Lugol’s iodine solution, mixed, and then left to settle in the dark for 48 h. Following sedimentation, the supernatant was carefully removed via siphoning, and the remaining concentrate (to a volume of less than 50 mL) was transferred to a new sample vial. These concentrated samples were stored refrigerated at 4 °C in the dark. Phytoplankton were enumerated using a 0.1 mL counting chamber. The morphological characteristics and phylum-level taxonomic affiliations were identified using a Zeiss upright fluorescence microscope according to the established pictorial guides, including the Atlas of Major Algae in Poyang Lake Basin [32] and Atlas of Common Algae in Taihu Lake [33]. Finally, the abundance of phytoplankton was calculated.

2.4. Data Analysis

Inter-group differences in water quality variables and plant metrics were examined using one-way analysis of variance (ANOVA) with a significance threshold of α = 0.05, followed by Tukey’s HSD for post hoc comparisons. Normality and homogeneity were assessed using the Shapiro–Wilk and Levene’s tests. If assumptions were violated, the Kruskal–Wallis non-parametric test was employed instead. All statistical computations were performed using SPSS (version 22.0), and data were visualized with Origin 2021b. The bioinformatics analysis and visualization of microbial community diversity data were conducted on the Majorbio Cloud Platform, provided by Shanghai Majorbio Bio-pharm Technology Co., Ltd. (Shanghai, China).

3. Results and Discussion

3.1. Plant Growth

3.1.1. Biomass

Two economically important plant species (ML and BL) were cultivated for 70 days in the rooftop floating island system. All plants survived, most developed extensive roots, and occasional leaf shedding was observed. As shown in Table 2, both aboveground and belowground biomass increased across all groups. Overall, ML showed a higher biomass growth rate than BL (3.20 vs. 1.93), indicating that ML was better adapted to autumn-winter rooftop hydroponics under the conditions tested. For shoots, ML grew faster than BL (growth rates 4.00 vs. 2.06), likely reflecting ML’s greater branching and leaf production. For roots, the shallow-rooted ML increased less than the deep-rooted BL (1.05 vs. 1.45).
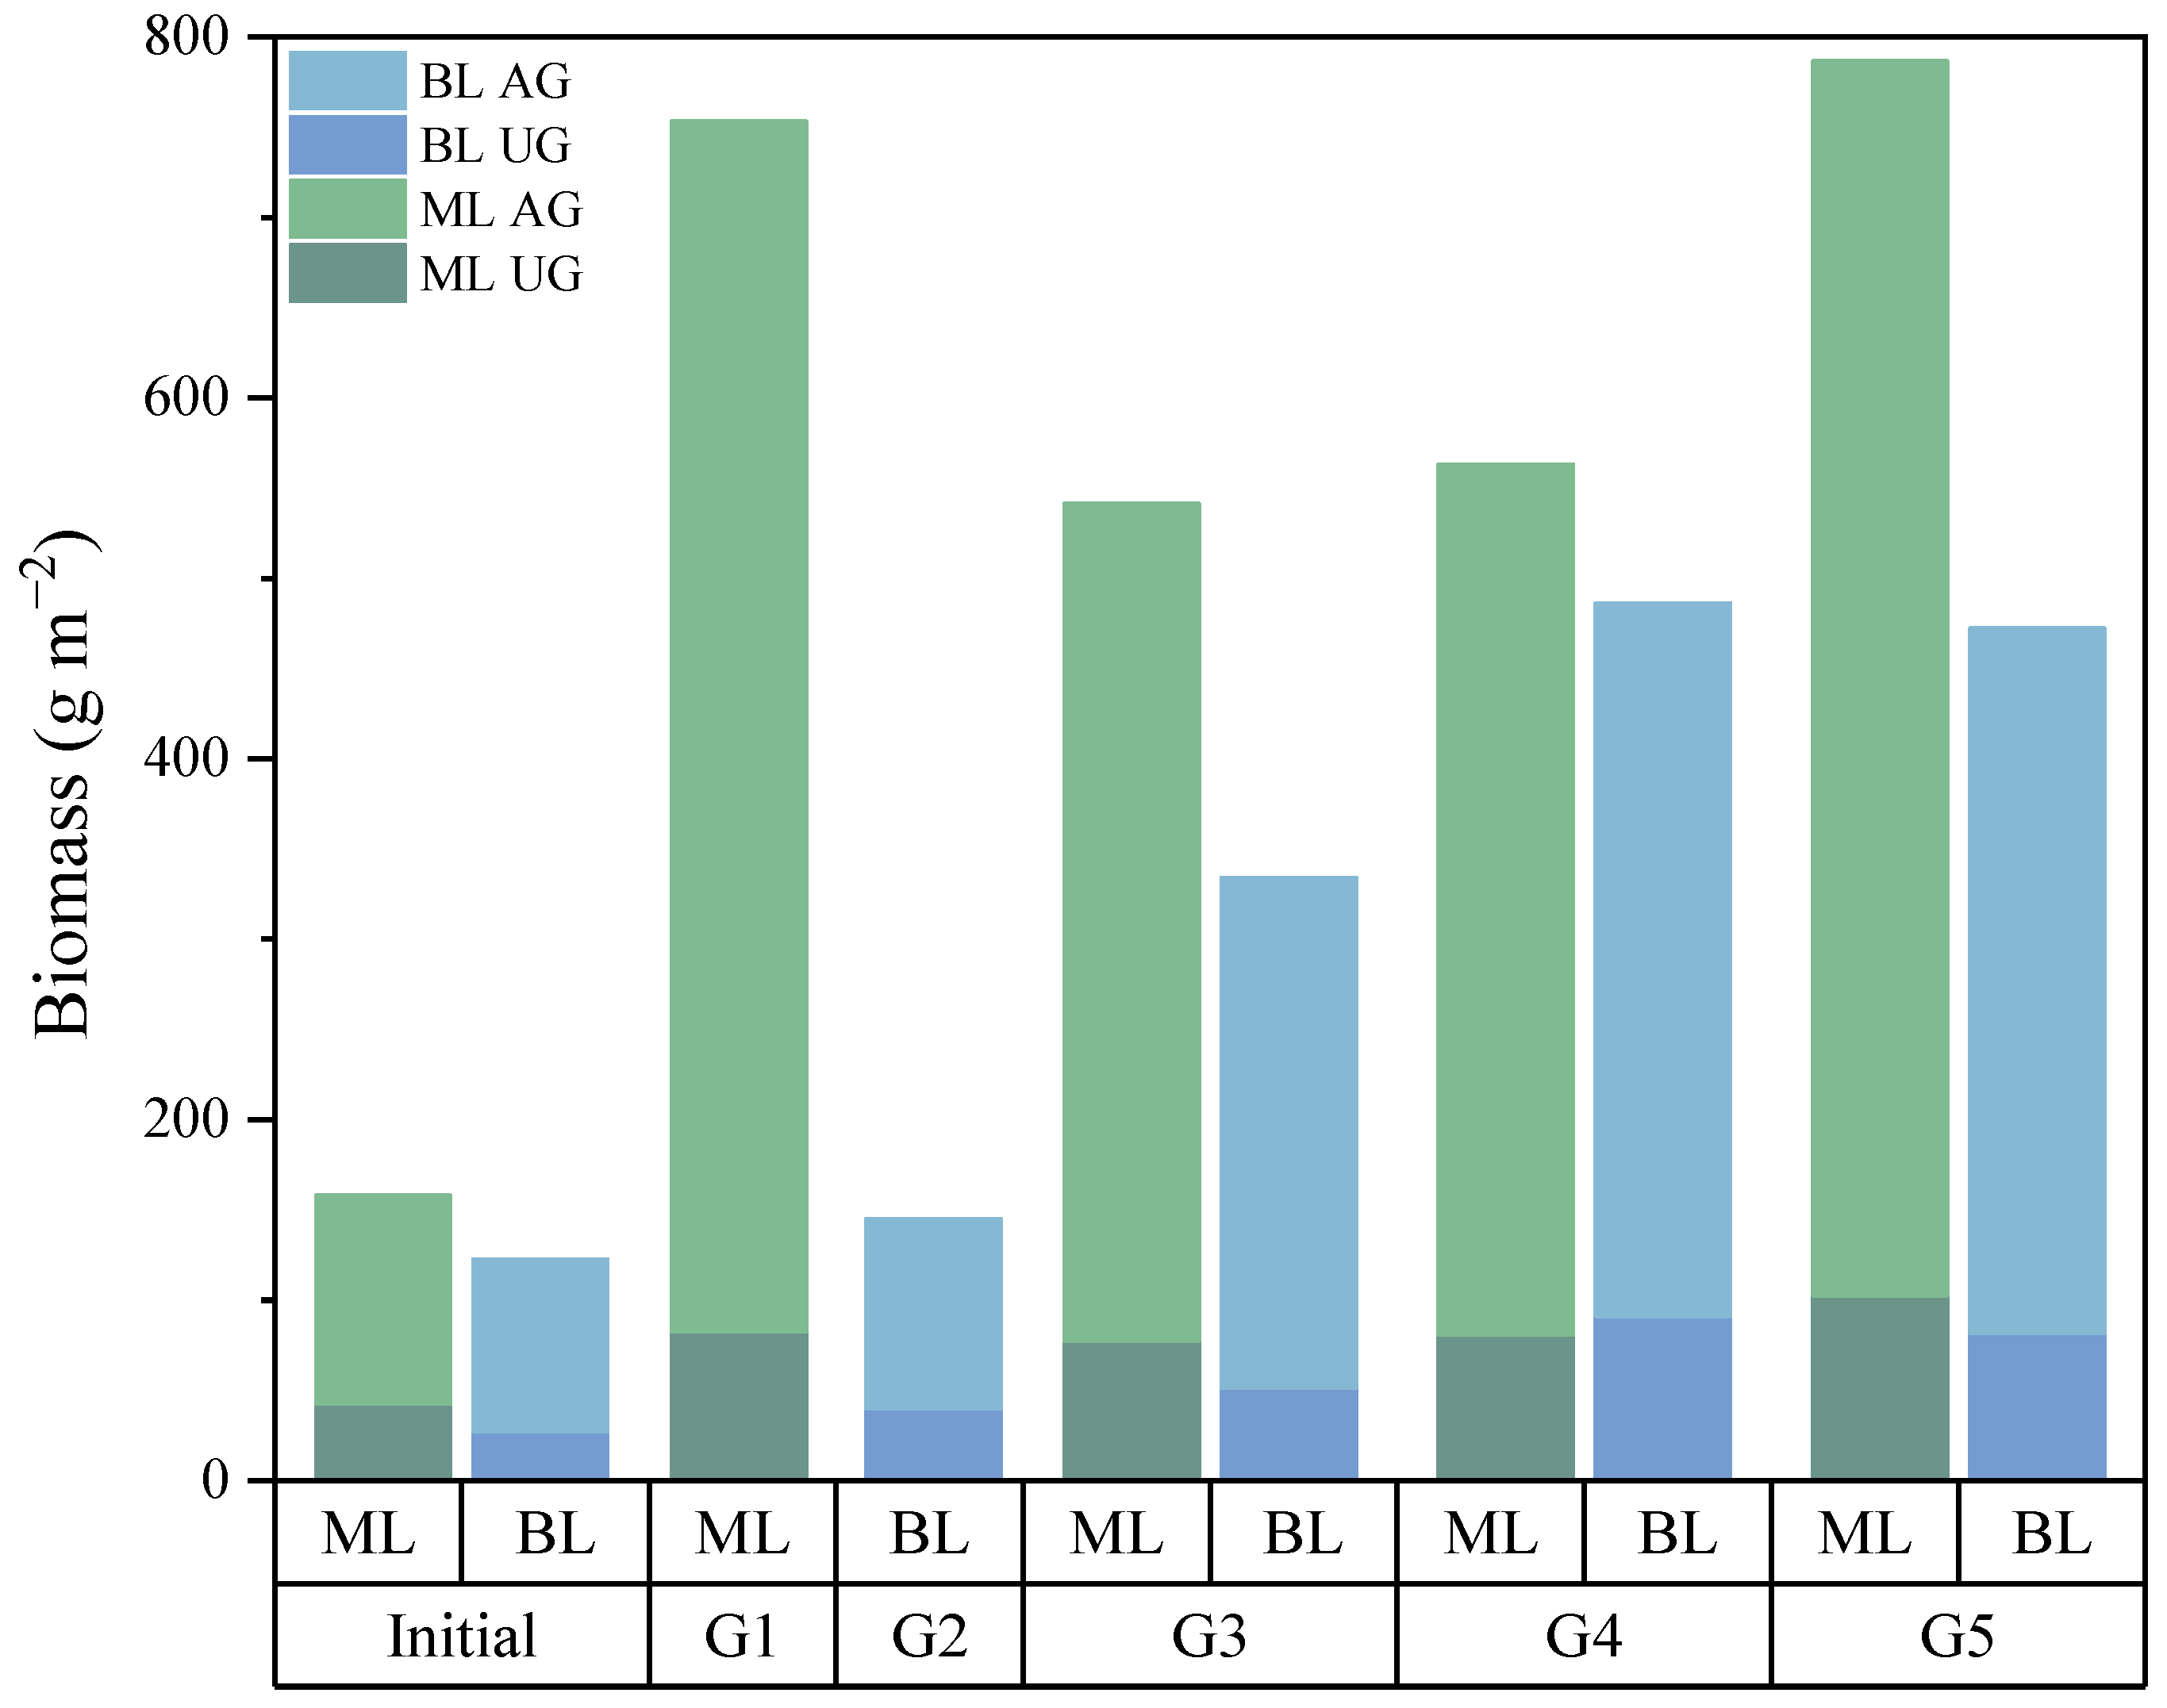
Figure 2 illustrates the aboveground (AG) and underground (UG) biomass for ML and BL at the beginning of the experiment and at harvest for each group. In ML, the biomass in the G5 group showed a significant increase from the initial value. It was higher than that of the other groups, followed by the monoculture ML group. For BL, group G4 produced the highest biomass, followed by G5, and was not statistically different from G4. In contrast, the biomass of the monoculture BL group showed an insignificant difference from its initial value. Under autumn rooftop conditions, G5’s planting ratio produced the most significant increase in plant biomass, supporting the growth of economically important species. In contrast, BL planted as a monoculture in group G2 did not perform well in the autumn rooftop setting, which impeded its growth.

3.1.2. Root System

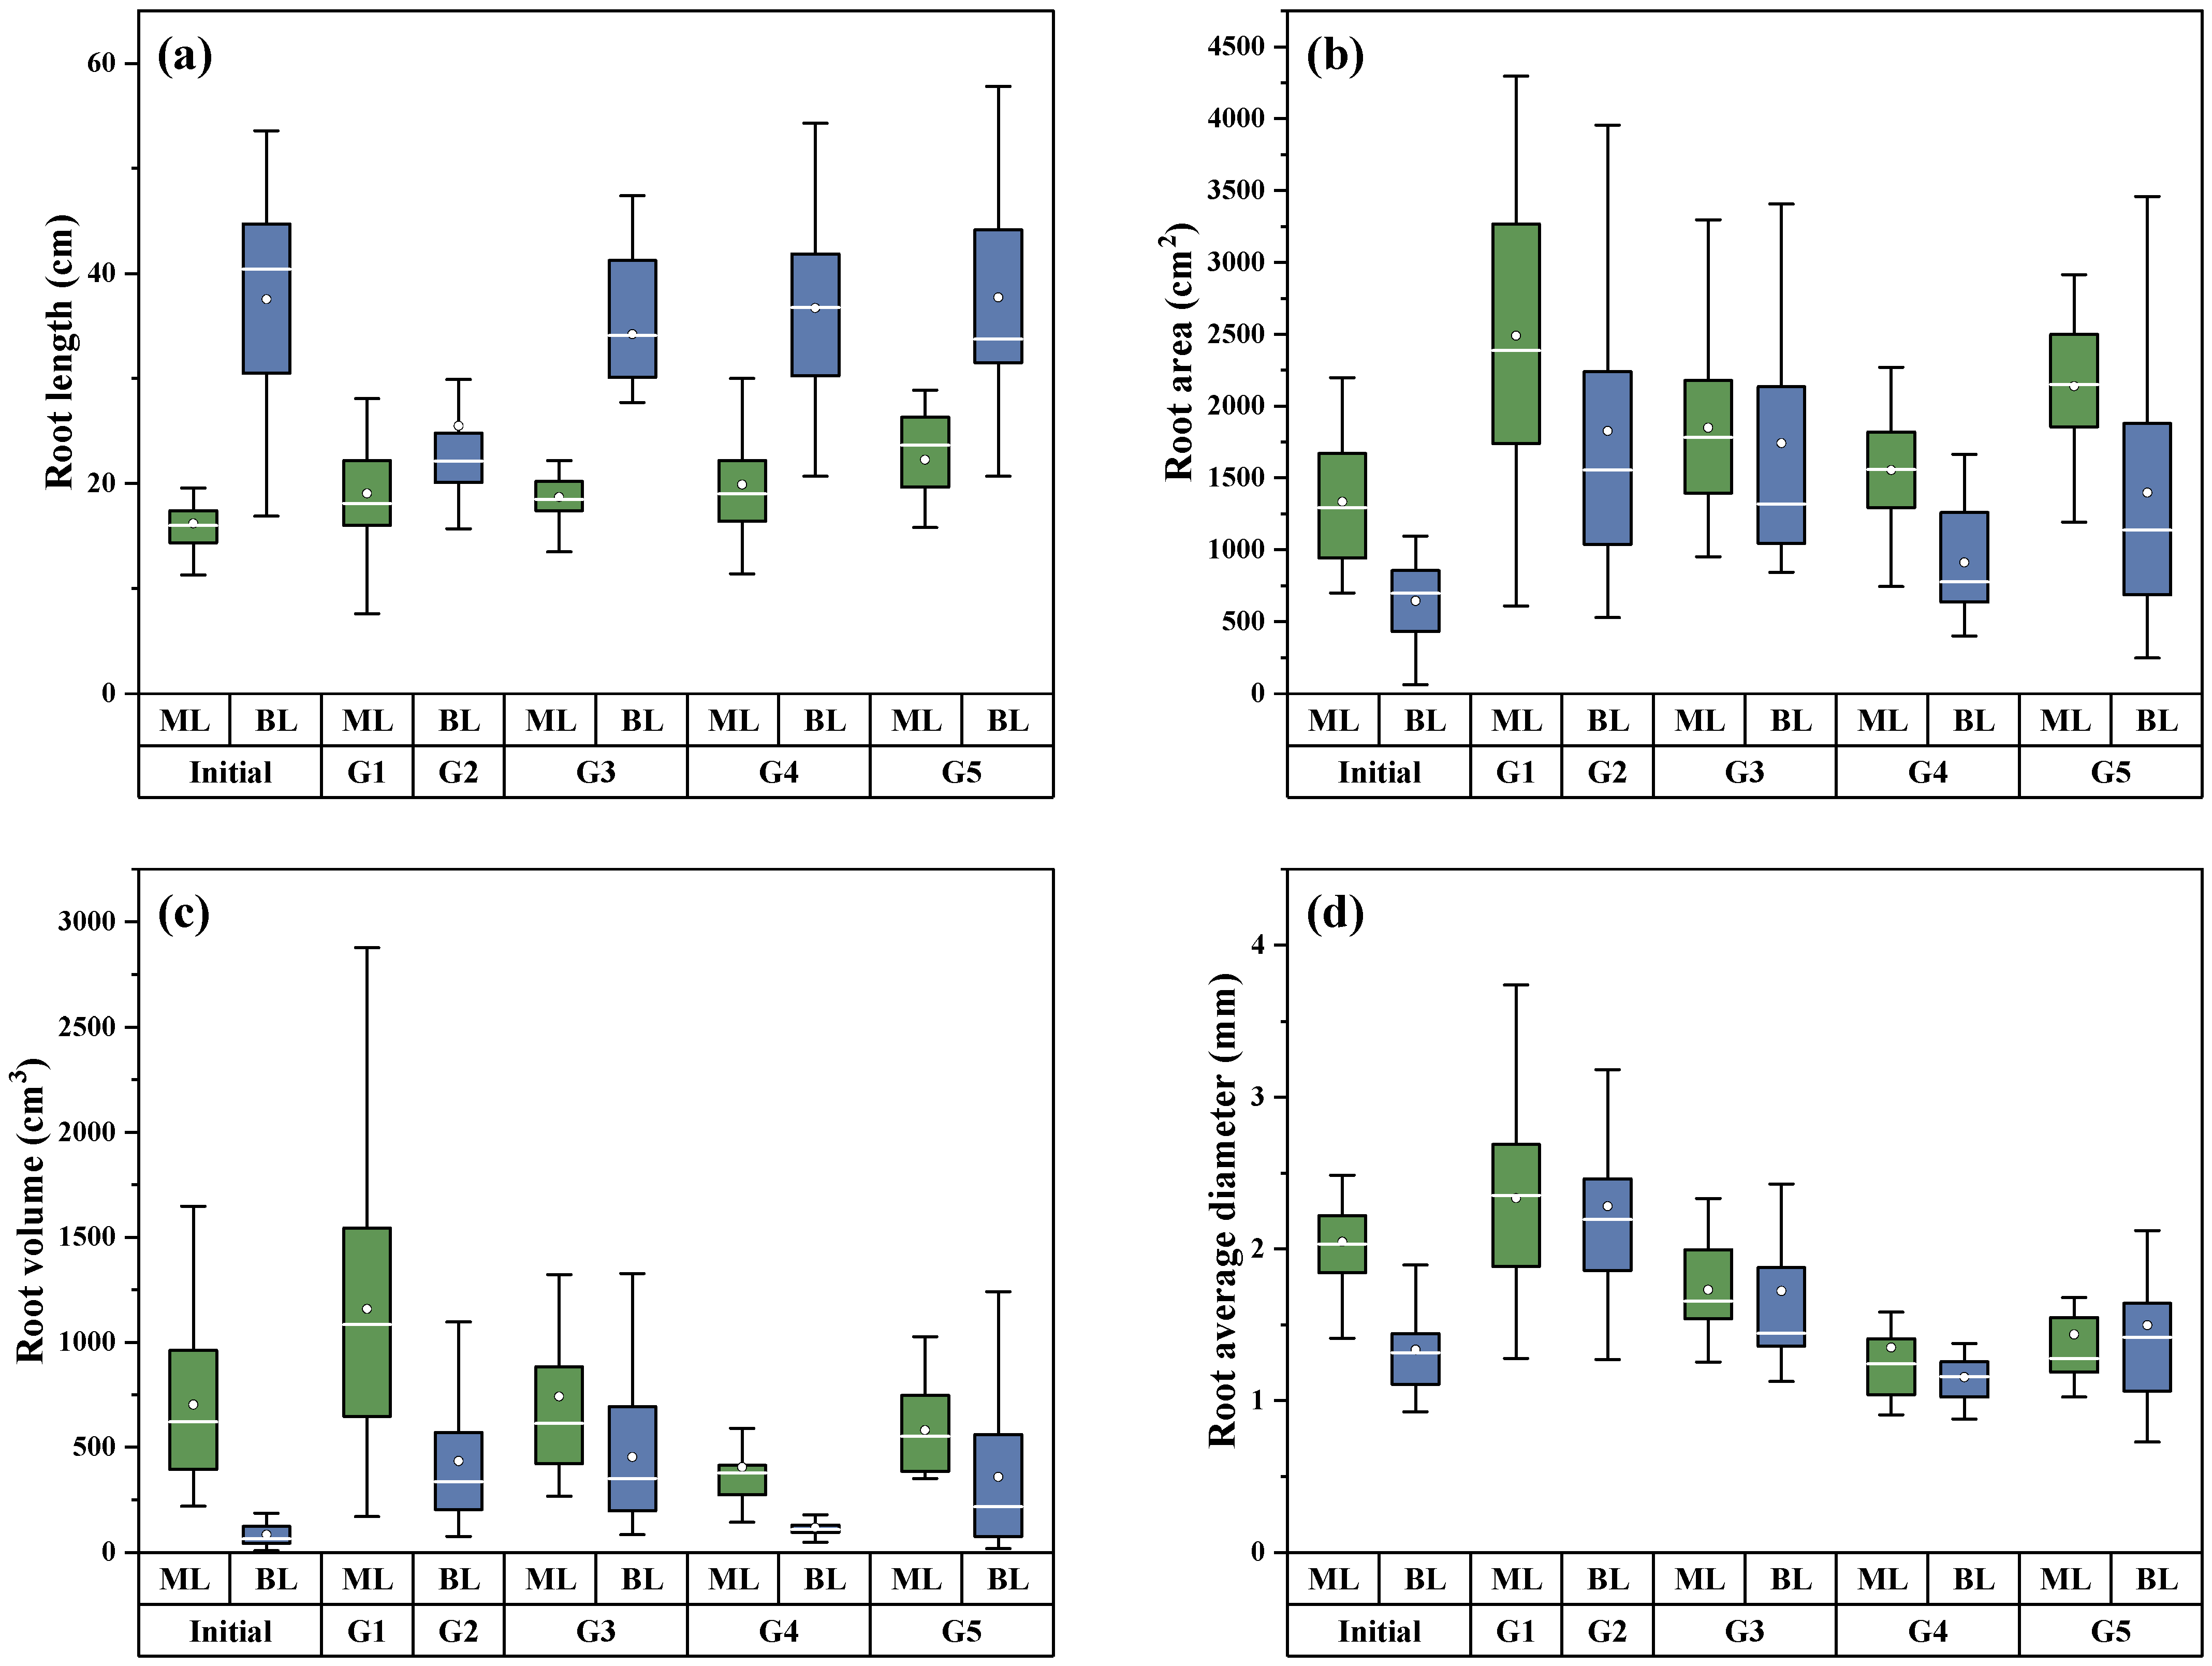
The plant root system is a primary pathway for the absorption of nutrients, water, and oxygen, and serves as a critical habitat for microbial growth. Morphological indicators of the root system are crucial for assessing plant growth status and understanding nutrient removal mechanisms. As shown in Figure 3, the root length, root surface area, root volume, and average root diameter were measured for all groups at the beginning and end of the experiment. For ML, the rate of change in root length followed the order of G5 (0.3745) > G4 (0.2616) > G1 (0.1752) > G3 (0.1555). For BL, the order was G5 (0.0048) > G3 (−0.0884) > G4 (−0.1287) > G2 (−0.3210). Thus, G5 yields the greatest increase in root length for both species, which is consistent with the strong biomass responses in this group. Longer roots can more effectively absorb nutrients from the water, which is likely correlated with the robust growth observed in both plant species in G5. The rate of change in ML’s root surface area followed the order of G1 (0.8656) > G5 (0.6021) > G3 (0.3862) > G4 (0.1658), while for BL, the order was G2 (1.8310) > G3 (1.6998) > G5 (1.1662) > G4 (0.4142). For the rate of change in root volume, ML was ranked as G1 (0.6467) > G3 (0.0549) > G5 (−0.1730) > G4 (−0.4235), and BL was ranked as G3 (4.3772) > G2 (4.1431) > G5 (3.2521) > G4 (0.3945). The rate of change in average root diameter for ML was G1 (0.1396) > G3 (−0.1547) > G5 (−0.2988) > G4 (−0.3408), and for BL, it was G2 (0.7093) > G3 (0.2899) > G5 (0.1211) > G4 (−0.1351). These results indicate that the rates of change for root surface area, volume, and average diameter were generally highest in the monoculture treatments for both ML and BL, with the exception that the rate of change in BL’s root volume was slightly higher in G3 than in G2.

3.2. Water Purification Efficiency

3.2.1. Physicochemical Properties

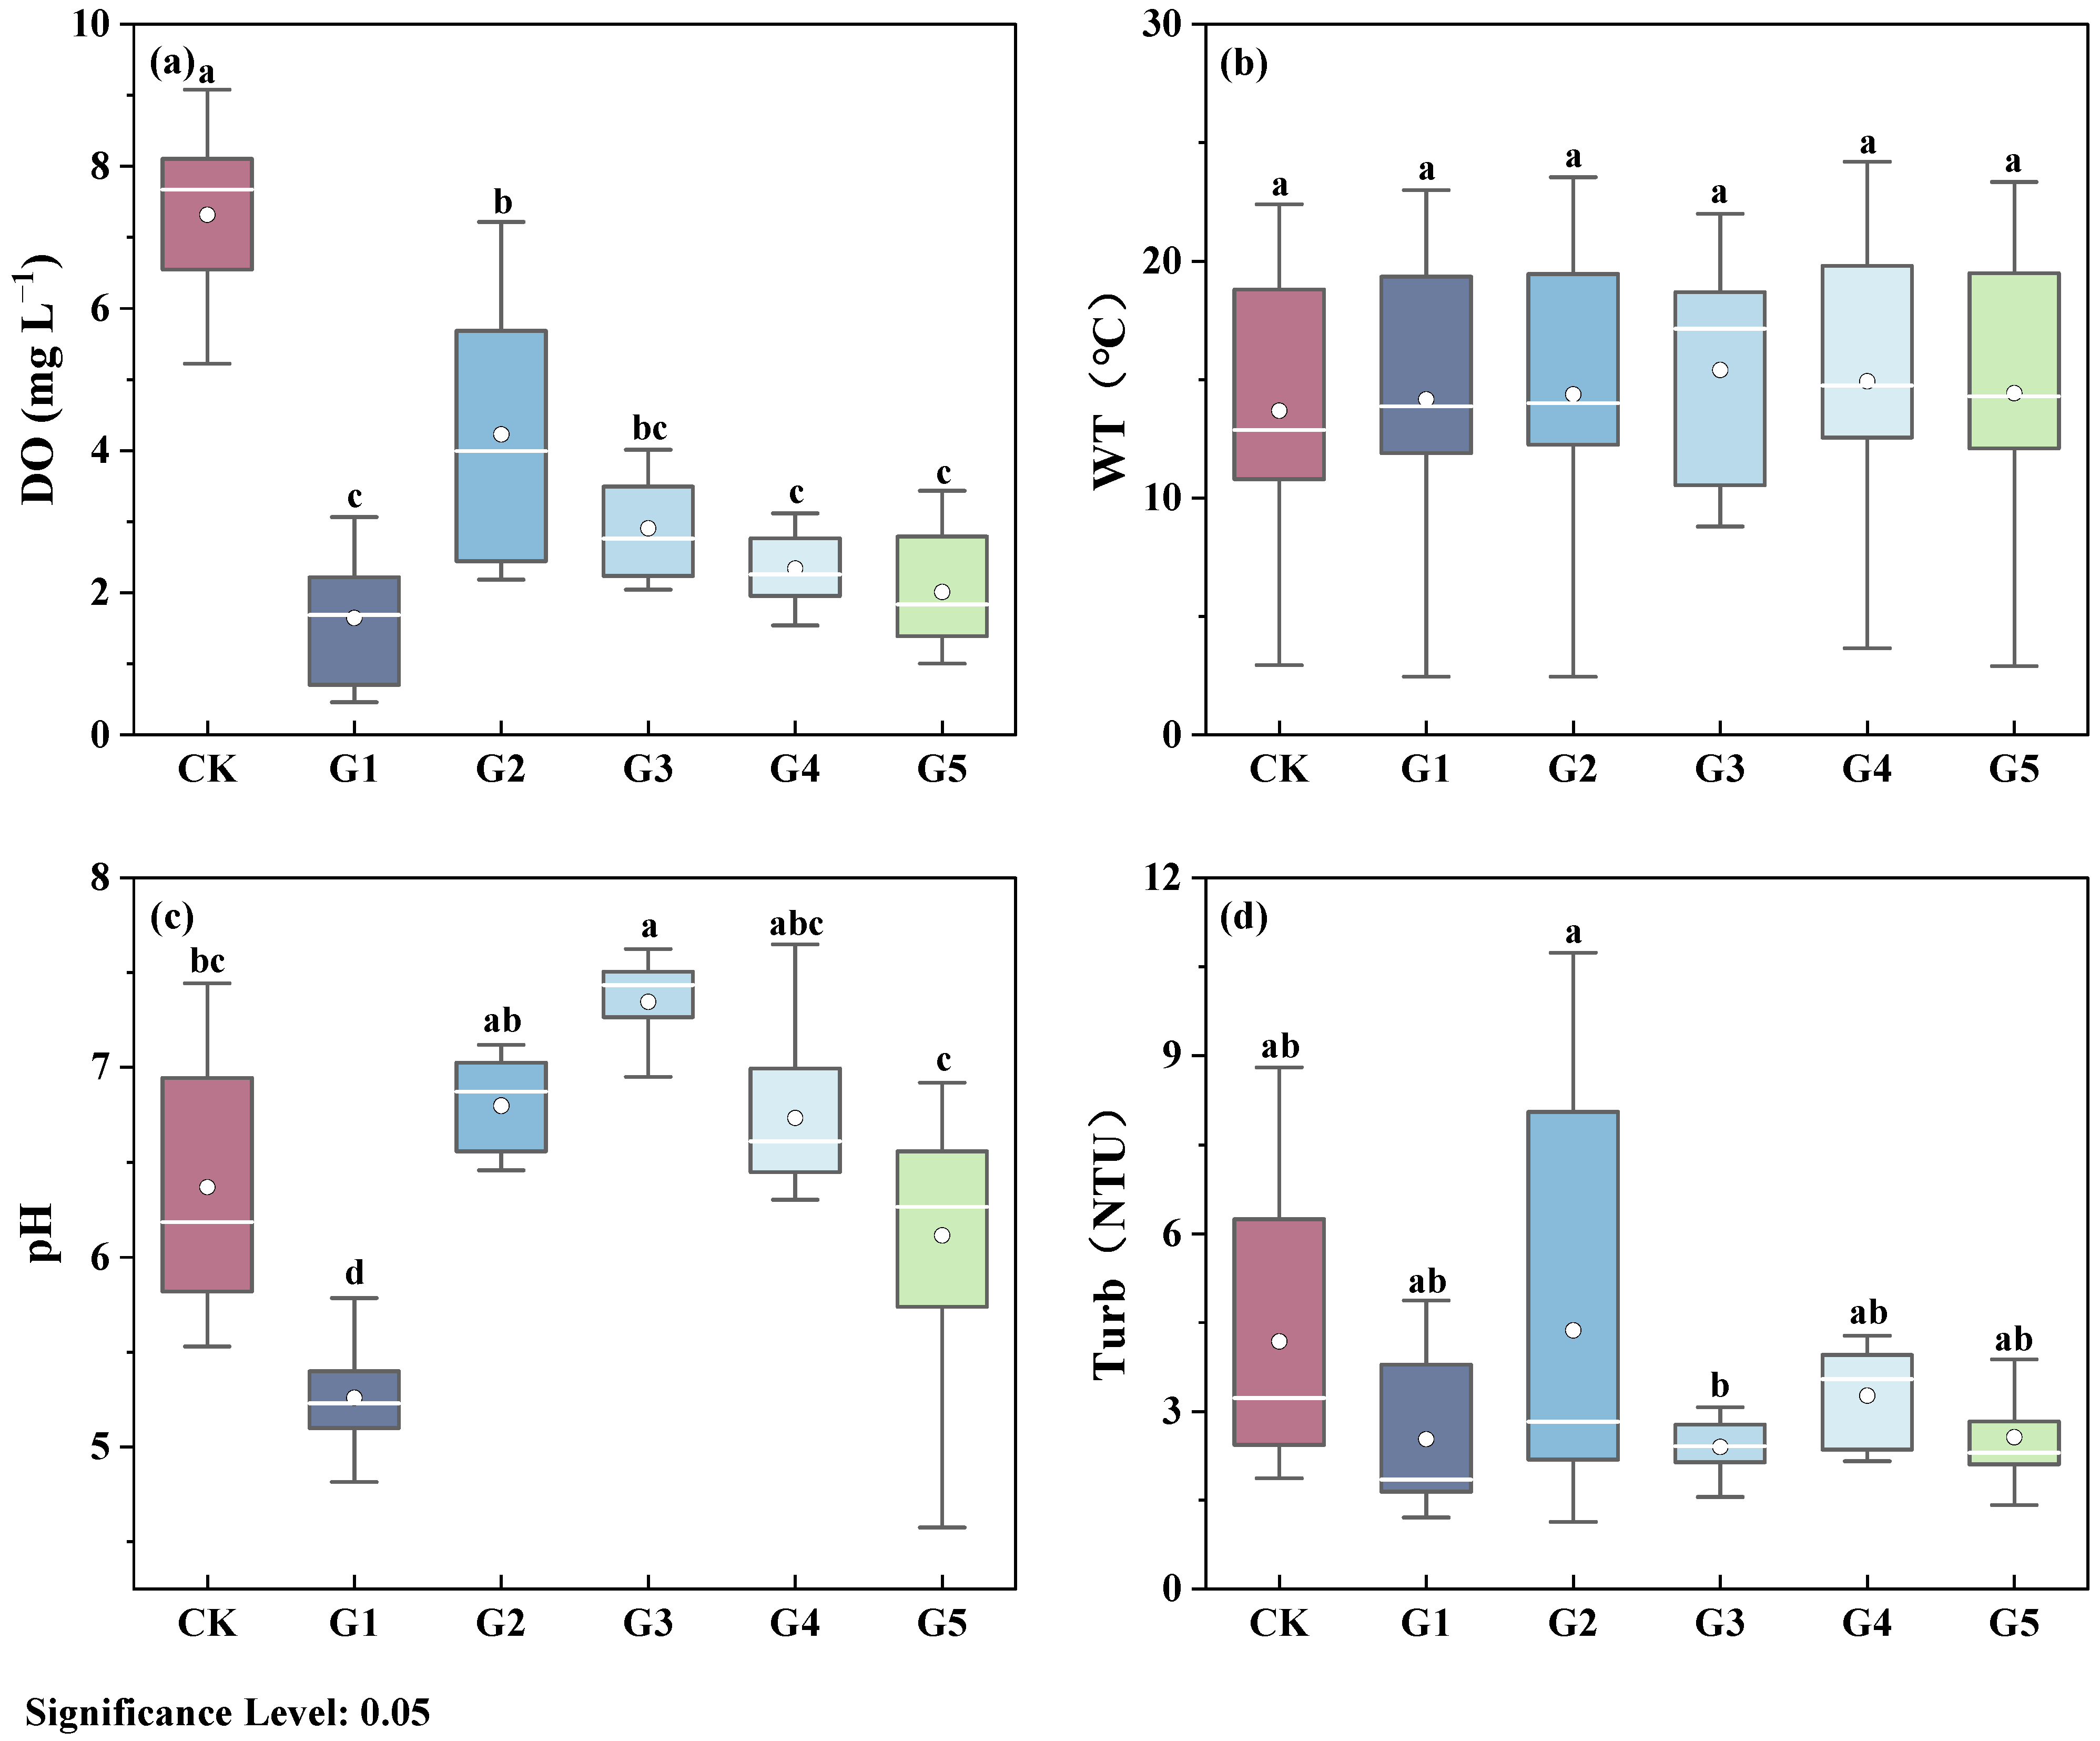
Dissolved oxygen (DO) differed significantly among groups (Figure 4a; p < 0.05). The plant-free control (CK) had the highest DO (7.32 mg/L), followed by BL monoculture G2 (4.23 mg/L). The mixed and ML monoculture groups did not differ significantly from one another, as shown through the following rankings: G3 (2.91) > G4 (2.34) > G5 (2.07) > G1 (1.84). Overall, the planted artificial floating island systems generally lowered DO relative to CK. Within mixed-culture groups, DO decreased as the ML:BL ratio decreased; G5 showed the lowest DO among mixtures. Although G2 (monoculture BL) had higher DO than other planted groups, it remained below CK, suggesting that BL alone did not sustain water-column oxygen. In combination with root morphology and microbiome results, the remarkably low DO in G1 may reflect higher microbial oxygen demand.
WT did not differ significantly across treatments, but its variability was the least in G3 (Figure 4b). The planted groups exhibited a slightly higher mean temperature than the CK group (13.69 °C). This suggests that a vegetated rooftop artificial floating island system can alleviate seasonal temperature drops to some extent, which is consistent with previous research [34].
As shown in Figure 4c, a significant difference in pH was observed between mixed-culture groups G3 and G5, with the ranking G3 (7.33) > G4 (6.74) > G5 (6.12). Furthermore, the pH levels of the mixed-culture groups and group G2 were all significantly higher than those of group G1 (5.27). Regarding Turb (Figure 4d), a significant difference was observed between the CK group and groups G1, G3, and G4. The turbidity of the CK group (4.18 NTU) was significantly higher than that of G5 (2.57 NTU), G1 (2.53 NTU), and G3 (2.40 NTU). Group G2 exhibited the highest Turb (4.36 NTU), slightly greater than the CK group, while group G4 had the lowest Turb (2.26 NTU), slightly lower than G3.

3.2.2. Removal of N, P, and COD

As typical indicators of water quality, TN, TP, and COD in the influent and effluent of the system were monitored to evaluate the efficiencies of water purification and separation of the N and P of the system. Table 3 shows their concentrations in the influent and effluent of different groups, where Influent 1 was pumped into groups CK, G1, and G2 and Influent 2 was introduced into groups G3, G4, and G5. The performance of each system was determined by calculating the removal loads of TN, TP, and COD.
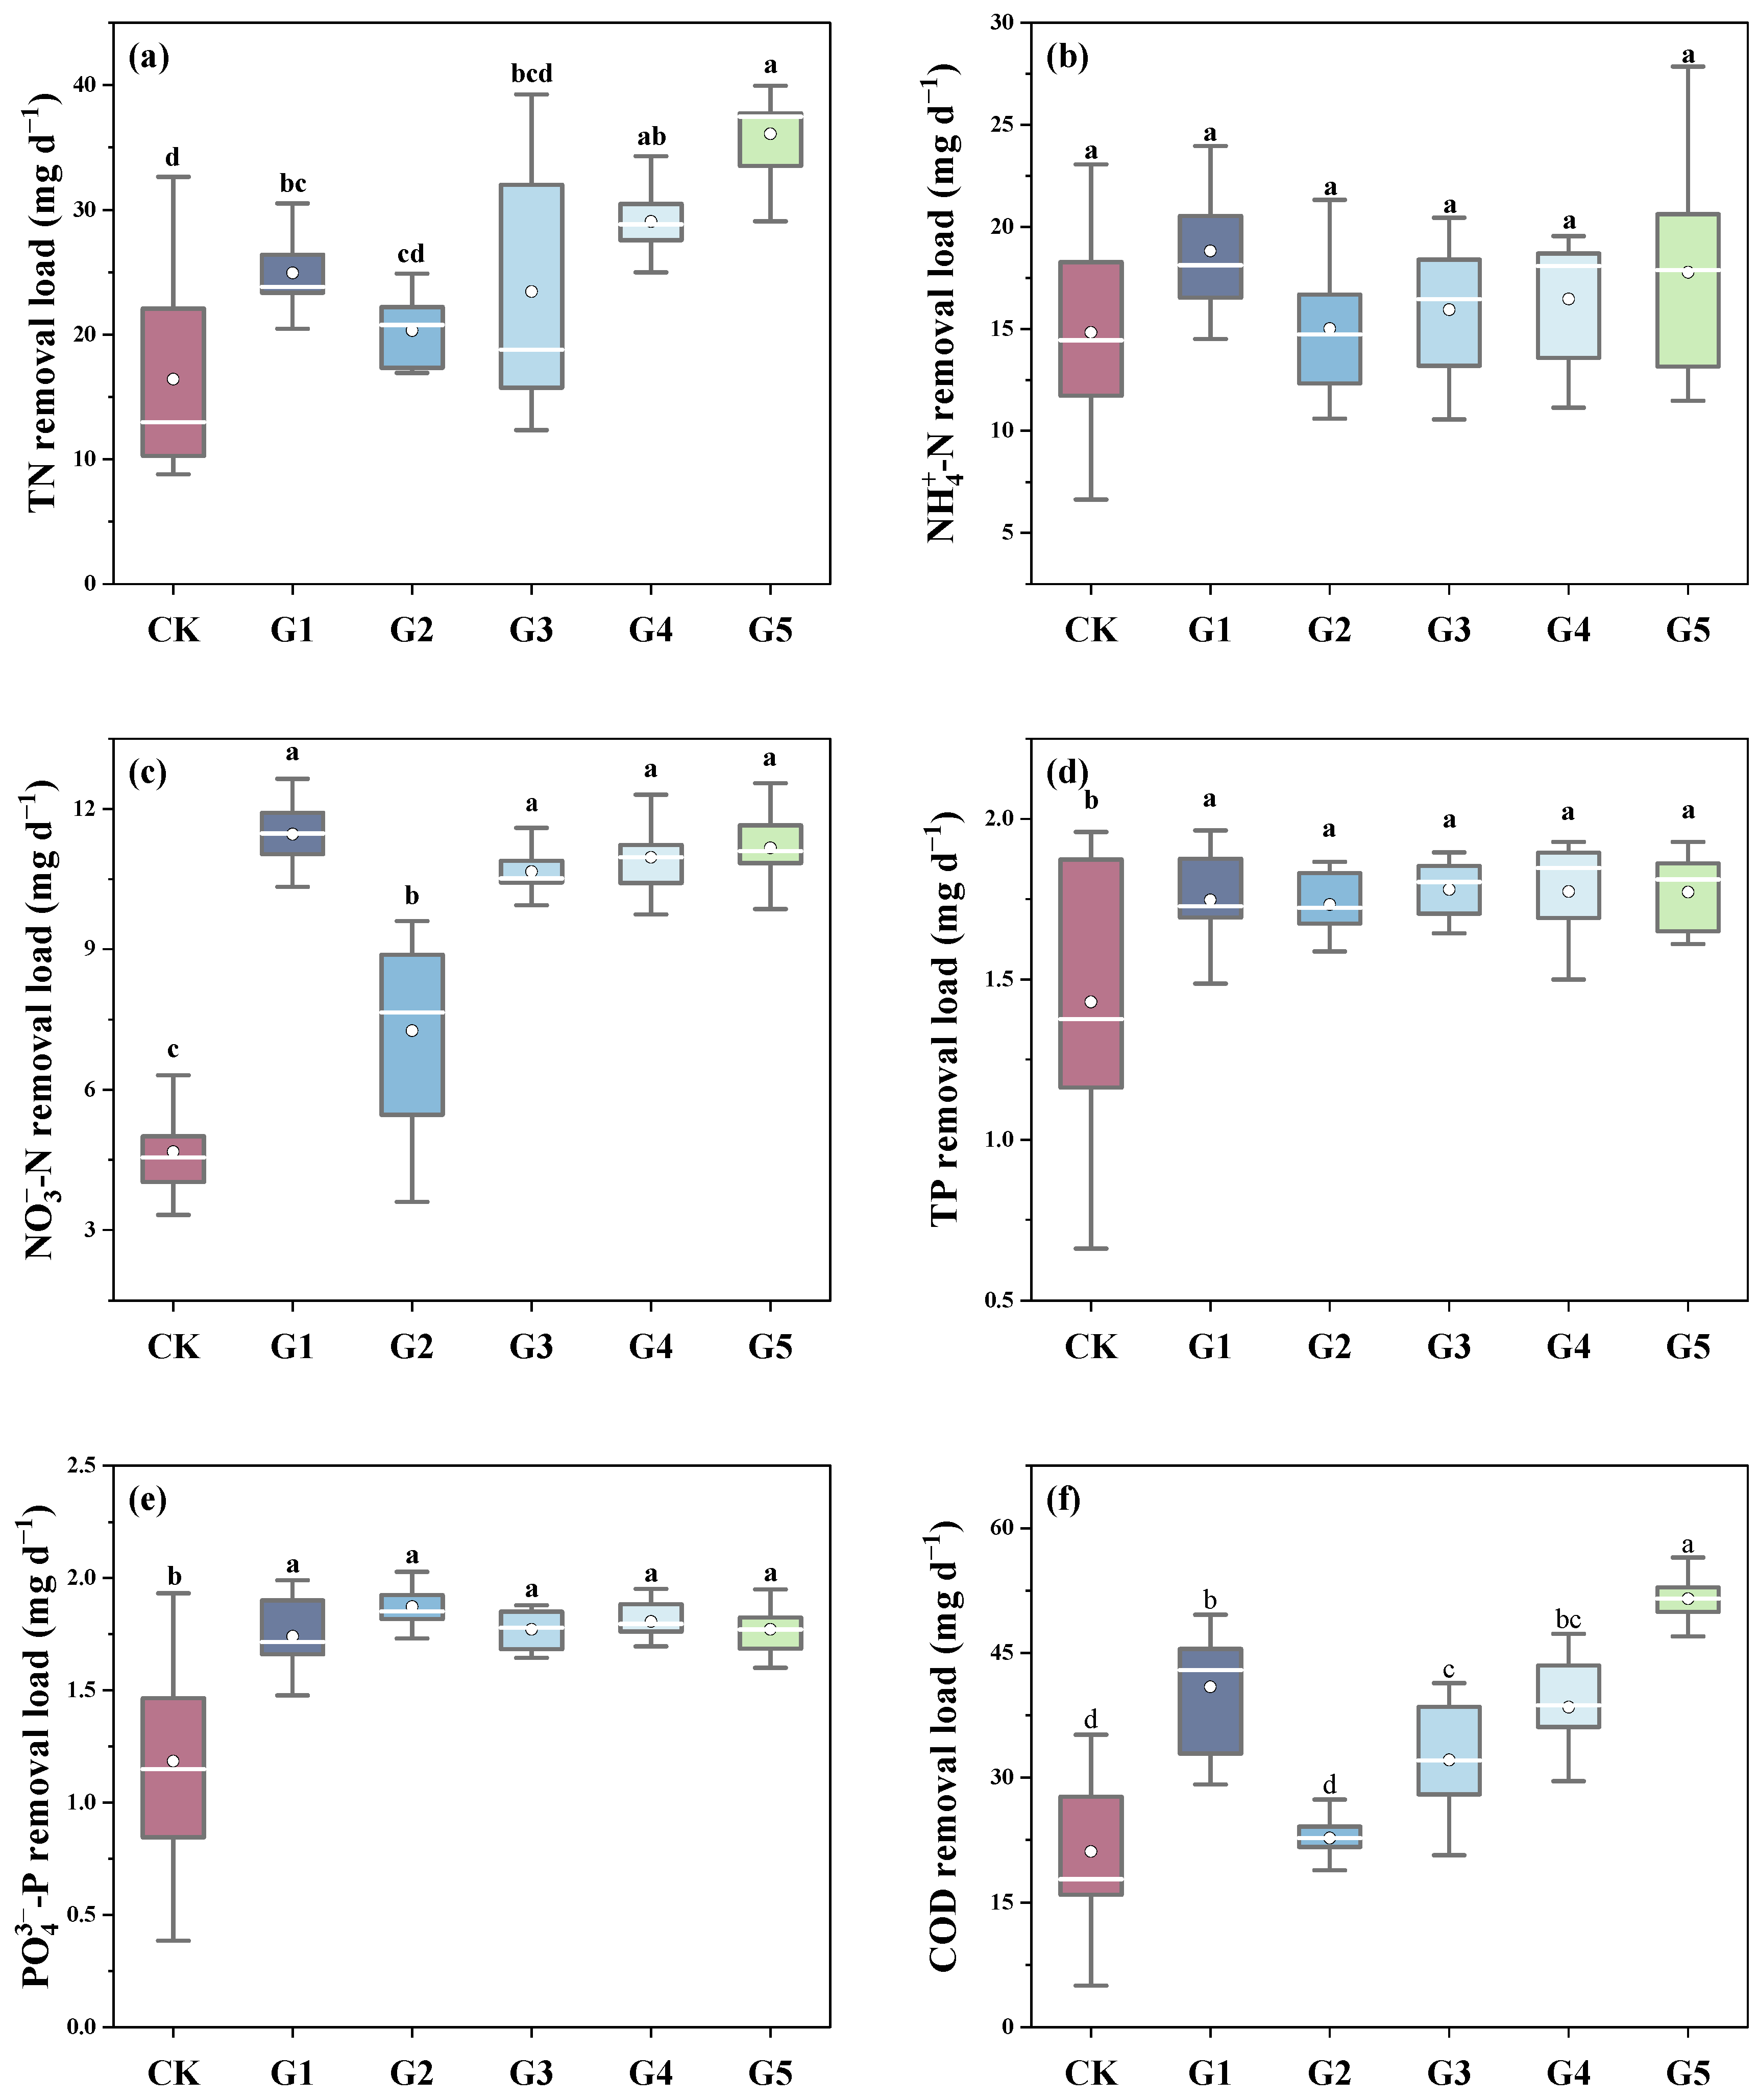
The TN removal load was ranked as follows: G5 (36.10) > G4 (29.08) > G1 (24.94) > G3 (23.45) > G2 (20.33) > CK (16.42) (Figure 5a). All vegetated treatments removed significantly more TN than CK (p < 0.05), confirming the effectiveness of hydroponic rooftop cultivation under the tested conditions. TN removal in G3 was not significantly different from that in G1 or G2, and all three groups underperformed relative to G4 and G5; G5 was the most effective for TN removal.
Ammonium ( NH 4 + -N) removal did not differ significantly among groups (Figure 5b). The average removal load was ranked as follows: G1 (18.82) > G5 (17.78) > G4 (16.47) > G3 (15.95) > G2 (15.01) > CK (14.83). This indicates only modest improvements over CK, with G1 ranking the highest. The nitrate ( NO 3 -N) removal load was ranked as G1 (11.46) > G5 (11.16) > G4 (10.96) > G3 (10.66) > G2 (7.26) > CK (4.67) (Figure 5c). BL monoculture (G2) was least effective among planted systems, whereas G1 was highest and not significantly different from G5. Overall, mixed planting at the G5 ratio consistently enhanced TN removal and maintained high ( NO 3 -N) removal, while BL monoculture underperformed.
With the exception of the CK group, there were no significant differences in the TP and  PO 4 3 -P removal loads among the different experimental groups. However, based on Figure 5d, e, the TP removal loads in groups G3 (1.7803), G4 (1.7741), and G5 (1.7719) were all higher than those in groups G1 (1.7475) and G2 (1.7332), and all were significantly higher than in the CK group (1.4296). The presence or absence of plants directly influenced the removal of TP and  PO 4 3 -P. Both ML and BL can uptake the phosphorus required for growth from the water in the rooftop artificial floating island system. Concurrently, the root systems may harbor microorganisms capable of absorbing phosphorus, thereby reducing TP and  PO 4 3 -P levels in the water. Generally, there were no significant differences in phosphorus removal efficiency among the various vegetated groups. Compared with previous findings, the TP removal loads of the systems in this study are marginally higher than those (1.49 mg d−1) under low-P influent conditions, whereas the  PO 4 3 -P removal loads are substantially greater than the levels (0.89 mg d−1) observed in the low-P treatments (1.04 ± 0.11 mg L−1) [35].
As shown in Figure 5f, the average COD removal load was ranked as follows: G5 (51.51) > G1 (40.90) > G4 (38.48) > G3 (32.13) > G2 (22.73) > CK (21.11). The removal loads in all vegetated groups, both mixed and monoculture, were higher than those of the CK group (21.11). The difference between the G2 and CK groups was not significant, indicating that the monoculture of BL was not effective for COD removal during the autumn–winter season. The COD removal load of G5 was significantly higher than that of all other groups, demonstrating that this configuration was the most effective for COD removal. In the rooftop artificial floating island system, plants absorb and utilize organic matter during their normal physiological processes, and root-associated microorganisms also remove organic matter through adsorption, catabolism, or assimilation. Furthermore, plant roots may secrete enzymes that degrade organic compounds. Therefore, the presence of plants enhances the system’s capacity for COD removal, with the G5 configuration being the most effective. The TN removal rate of G5 (82%) is comparable to the removal levels reported for integrated artificial–natural wetlands. However, the COD removal efficiency (75.9%) is significantly higher than that of conventional coupled wetlands, suggesting superior capacity of organic matter degradation by this system [36]. Furthermore, the COD removal loads in all treatment groups (except the control group) exceed the levels reported for palygorskite-mediated, lab-scale constructed wetlands (8.6 mg/d) [37].

3.3. Correlation Between Plant Traits and Water Treatment Efficiency

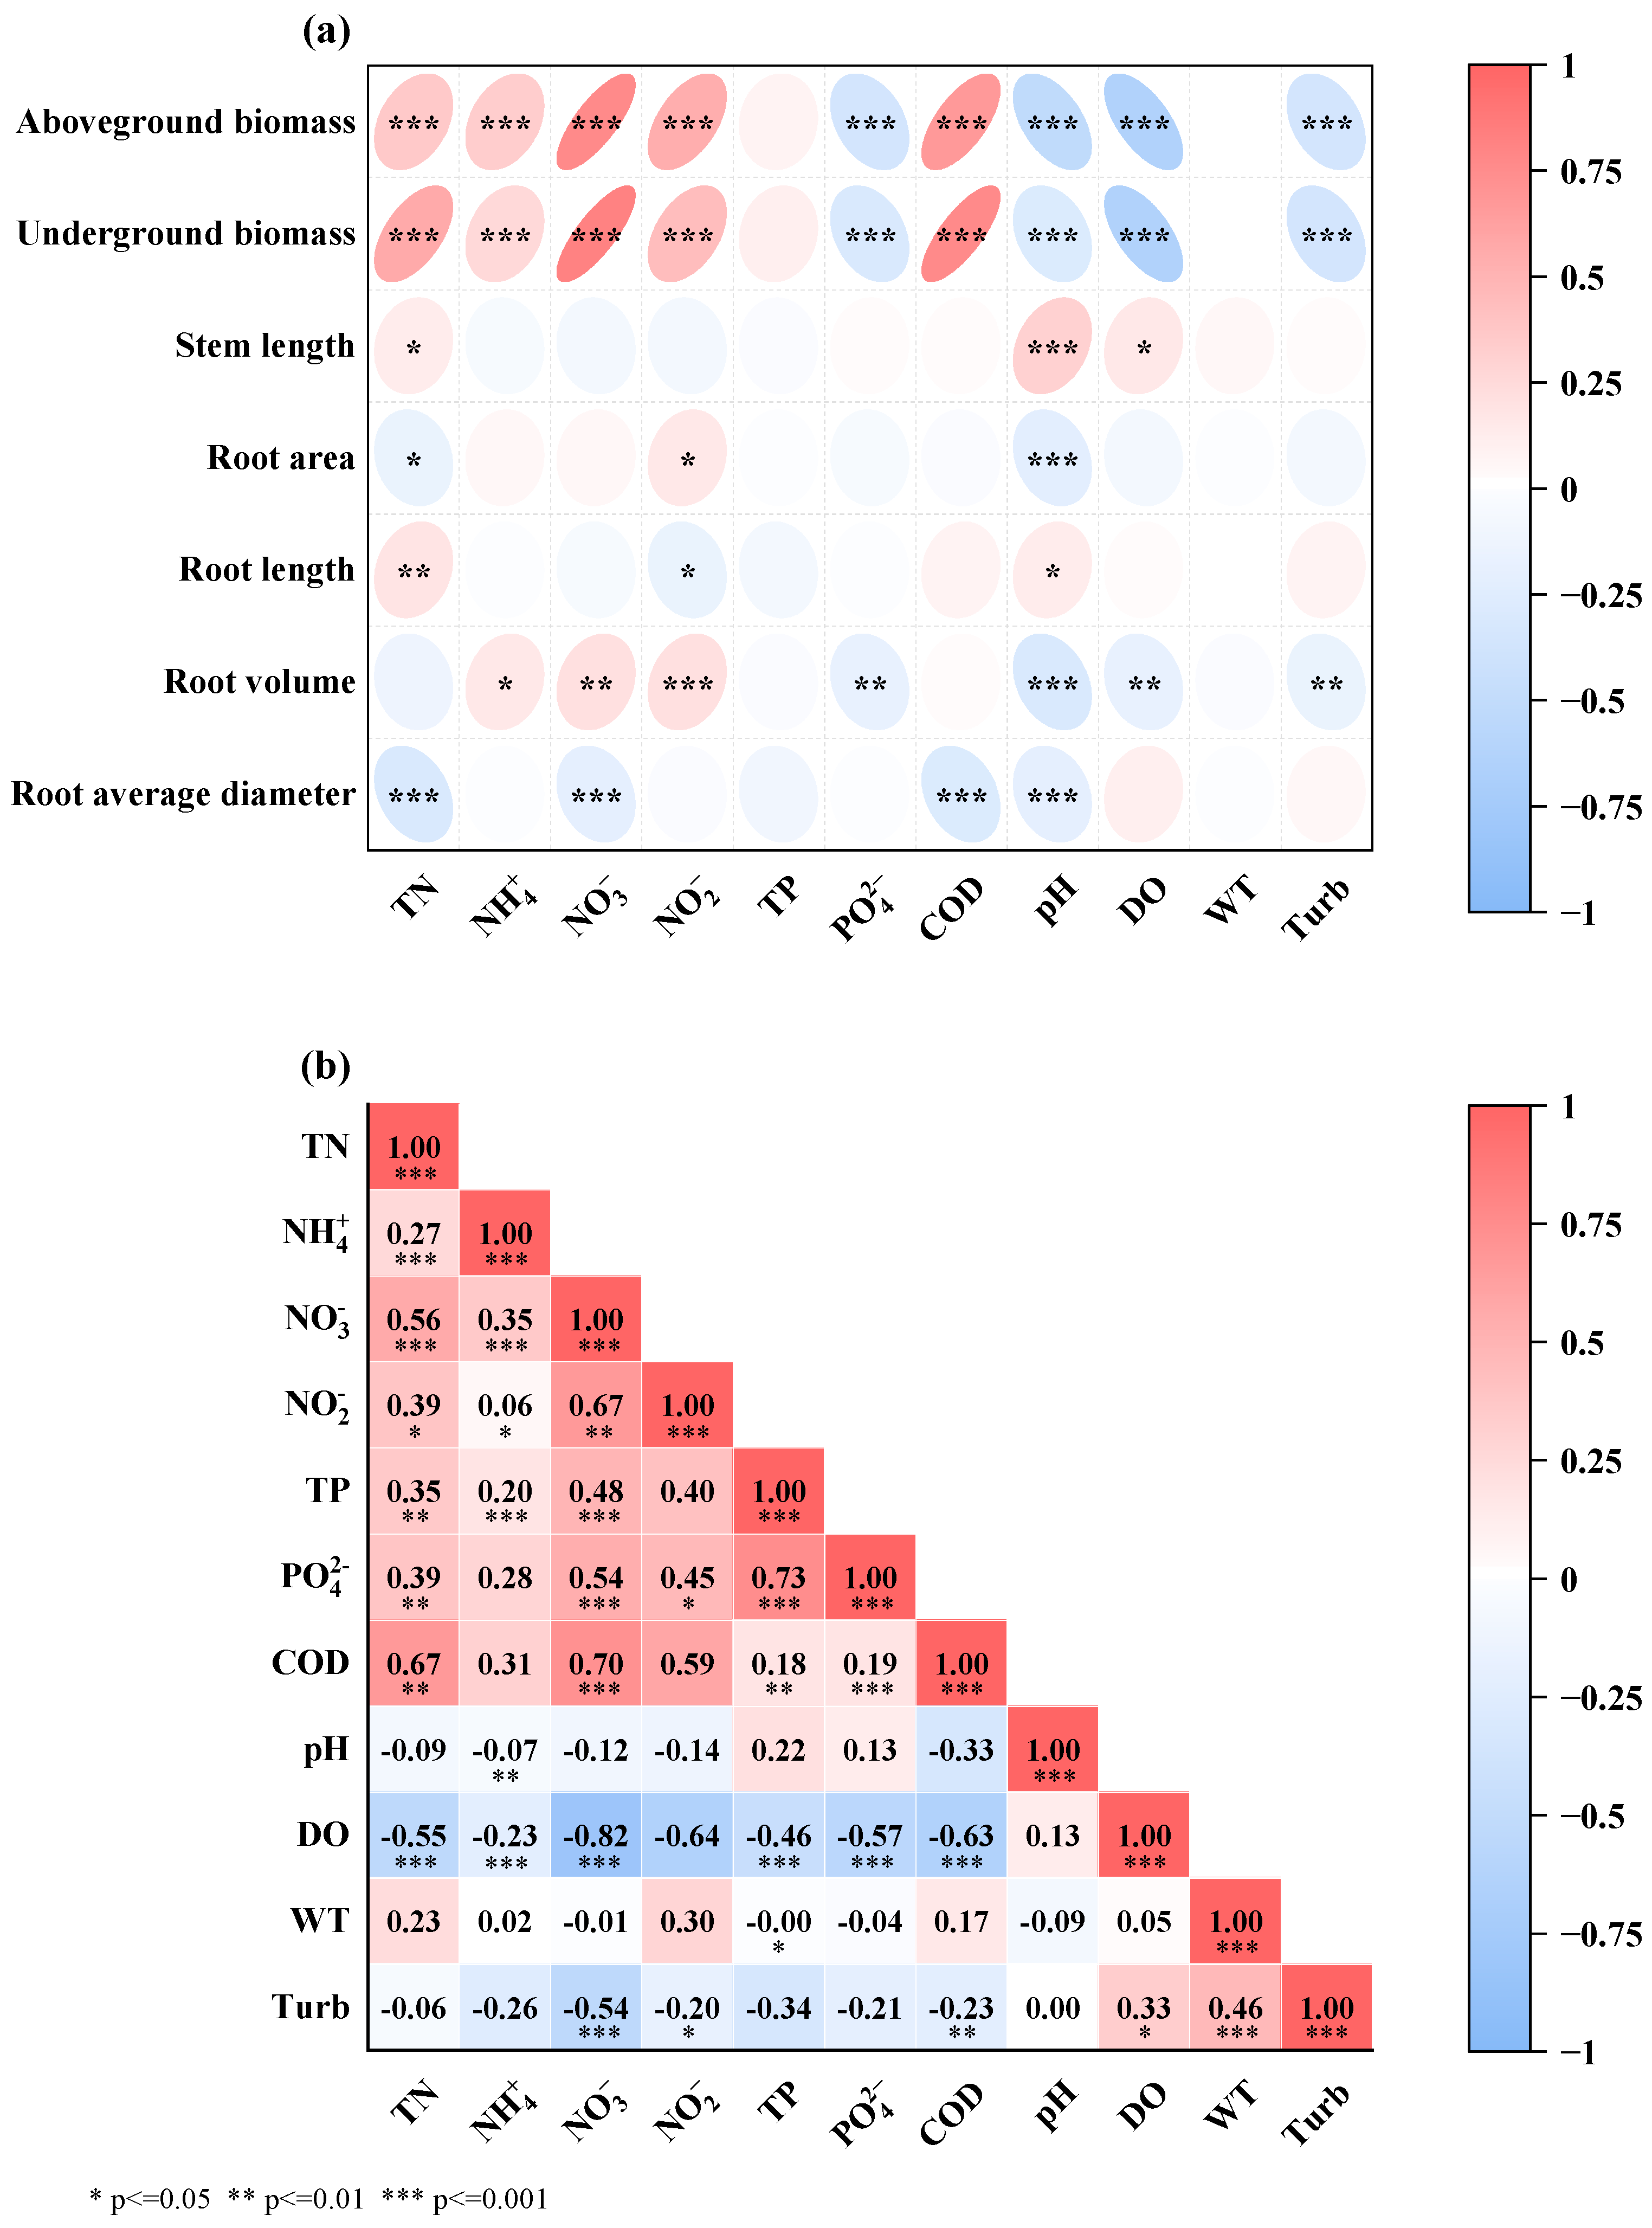
The heatmap below (Figure 6a) summarizes the correlations among plant biomass, physicochemical parameters, and removal loads. Both above- and belowground biomass was positively correlated with TN removal load (Figure 6a), which is consistent with the root uptake of multiple N forms (TN,  NH 4 + -N,  NO 3 -N,  NO 2 -N) supporting growth. The TP removal load showed no significant correlation with biomass. In contrast,  PO 4 3 -P removal was negatively correlated, suggesting that increases in plant biomass and associated rhizosphere activity may elevate orthophosphate cycling, thereby dampening net  PO 4 3 -P removal. COD removal load was positively correlated with biomass, possibly due to the improvement in the extracellular enzyme activities of microorganisms by plant root exudation and rhizodeposits, thus enhancing the degradation of organics [38].
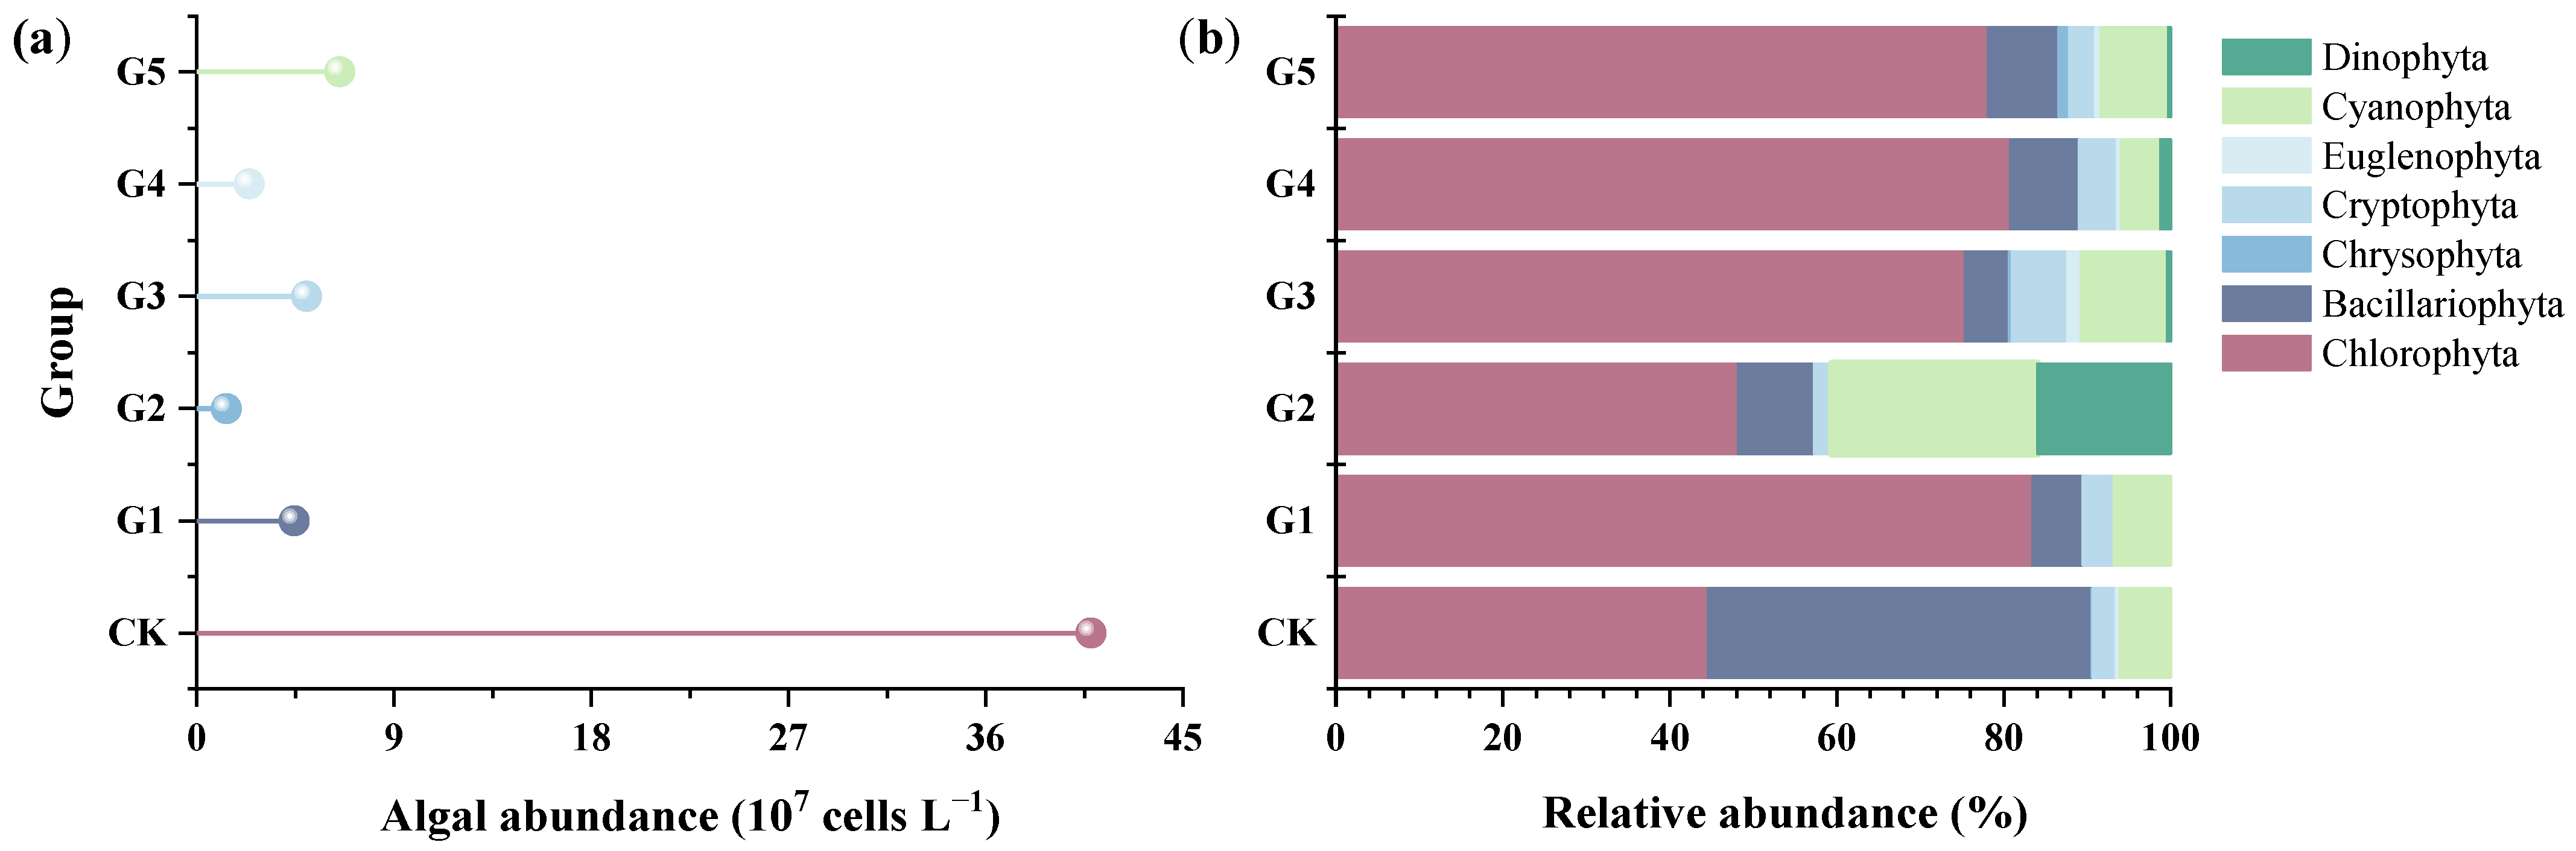
Biomass correlated negatively with pH, DO, and turbidity. The preferential ammonium uptake over nitrate (Figure 5b,c) can acidify the medium (H+ release > OH release), lowering pH. Expanding root systems also increase respiration, reduce DO levels, and release CO2, further acidifying the water. Reduced pH and DO likely suppress algal growth, contributing to lower algal counts in the planted groups relative to the control (Figure 7a) and, consequently, lower turbidity. TN removal load correlated positively with shoot and root length and negatively with root area and mean diameter, indicating that elongation rather than thickening tracked higher N removal.
Correlations among water quality variables and removal loads (Figure 6b) showed that DO was negatively associated with the removal of TN, COD,  NH 4 + -N,  NO 3 -N, TP, and  PO 4 3 -P, implying that lower DO levels favored overall treatment performance. This is consistent with the enhanced denitrification and polyphosphate-accumulating pathways under lower-oxygen conditions [39]. In particular, TN removal was strongly and positively correlated with  NO 3 -N removal (p < 0.001) and positively correlated with  NO 2 -N and  NH 4 + -N removal, indicating that all inorganic-N pathways contributed to TN reduction, with between-group differences in TN removal driven mainly by variation in  NO 3 -N removal. WT correlated positively with turbidity, and turbidity correlated positively with DO, which is consistent with temperature-driven algal growth that elevates oxygen levels via photosynthesis. These observations can be further corroborated by the established findings, identifying that WT is a pivotal determinant of phytoplankton spatio-temporal distribution. It is well known that rising temperatures can catalyze the proliferation of specific taxonomic groups, further consolidating the dominance of Cyanophyta and Chlorophyta within the community [40].

3.4. Algal Community in Water

Algal enumeration at harvest (Figure 7a) showed that the plant-free control (CK) had the highest abundance (4.08 × 10⁸ cells/L), significantly exceeding all planted groups. Thus, the cultivation of economic plants limited algal growth, likely through the root uptake of N and P, thereby reducing bloom risk and associated effluent deterioration.
As illustrated in Figure 7b, Chlorophyta (green algae) dominated in all groups, including CK; in G1, Chlorophyta reached a relative abundance of 84%. The prevalence of Chlorophyta across treatments likely reflects the rooftop’s relatively warm microclimate, the static hydraulic regime, and the 7-day HRT, which together favored green algae. In CK, the absolute counts were highest for Chlorophyta (2.276 × 10⁸ cells/L) and Bacillariophyta (1.86 × 10⁸ cells/L), followed by Cyanophyta (2.42 × 10⁷ cells/L), Cryptophyta (1.11 × 10⁷ cells/L), Euglenophyta (2.1 × 10⁶ cells/L), and Chrysophyta (5 × 10⁵ cells/L). The relative abundance of diatoms in the vegetated groups G1–G5 (5–9%) was far lower than in the CK group (46%), suggesting that planting vegetation in the hydroponic system suppresses the growth of diatoms. G2 exhibited a higher relative abundance of Cyanophyta (25%) and Dinophyta (16%) compared to the other groups. Its Chlorophyta abundance was lower than in other vegetated groups but slightly higher than in the CK group. This suggests that the monoculture of BL may suppress Chlorophyta while promoting the growth of Cyanophyta and Dinophyta. Since Cyanophyta possess strong nitrogen-fixing capabilities, a negative correlation exists between Cyanophyta and nitrogen nutrient levels [41]. Cyanophyta can convert atmospheric N2 into ammonium in the water [42], thereby increasing its concentration and reducing the net ammonium removal load of the system. This explains why the ammonium removal load in the G2 group was lower than in the other groups. Furthermore, Chlorophyta are often found in water of relatively good quality; their lower abundance in G2 compared to other planted groups indicates that G2 had a lower nutrient removal capacity and thus poorer water quality.

3.5. Root Microbiome Community

3.5.1. Alpha Diversity

Alpha diversity was assessed in terms of diversity (Simpson and Shannon indexes), richness (Ace, Chao, and Sobs), and sequencing depth (Coverage). All samples showed coverage greater than 0.99 (Table 4), indicating that sequencing reliably captured root-associated community structure. Richness indicators (Ace, Chao, Sobs) were highest on BL roots in G2, while the lowest richness occurred on ML roots in G5, followed by ML roots in G4, which were both lower than ML monoculture (G1). These patterns suggest that coculturing ML with BL at specific ratios may enhance the ML-mediated suppression of root-associated taxa, reducing microbial richness on ML roots due to the antimicrobial activities of ML [43]. While the mechanism was not resolved here, such effects could arise from altered root exudation, oxygen dynamics, or competitive filtering within the mixed rhizosphere.
As shown in Table 4, group G2 exhibited the highest level of root microbial diversity. Conversely, the roots of ML in G5 had the lowest diversity, followed by those in G4. This conclusion is almost in agreement with the findings for community richness, suggesting that coculturing ML with BL at appropriate ratios can enhance the potential inhibitory (allelopathic) effects of ML, thereby reducing the diversity of its root microbial community.

3.5.2. Relative Abundance at the Genus Level

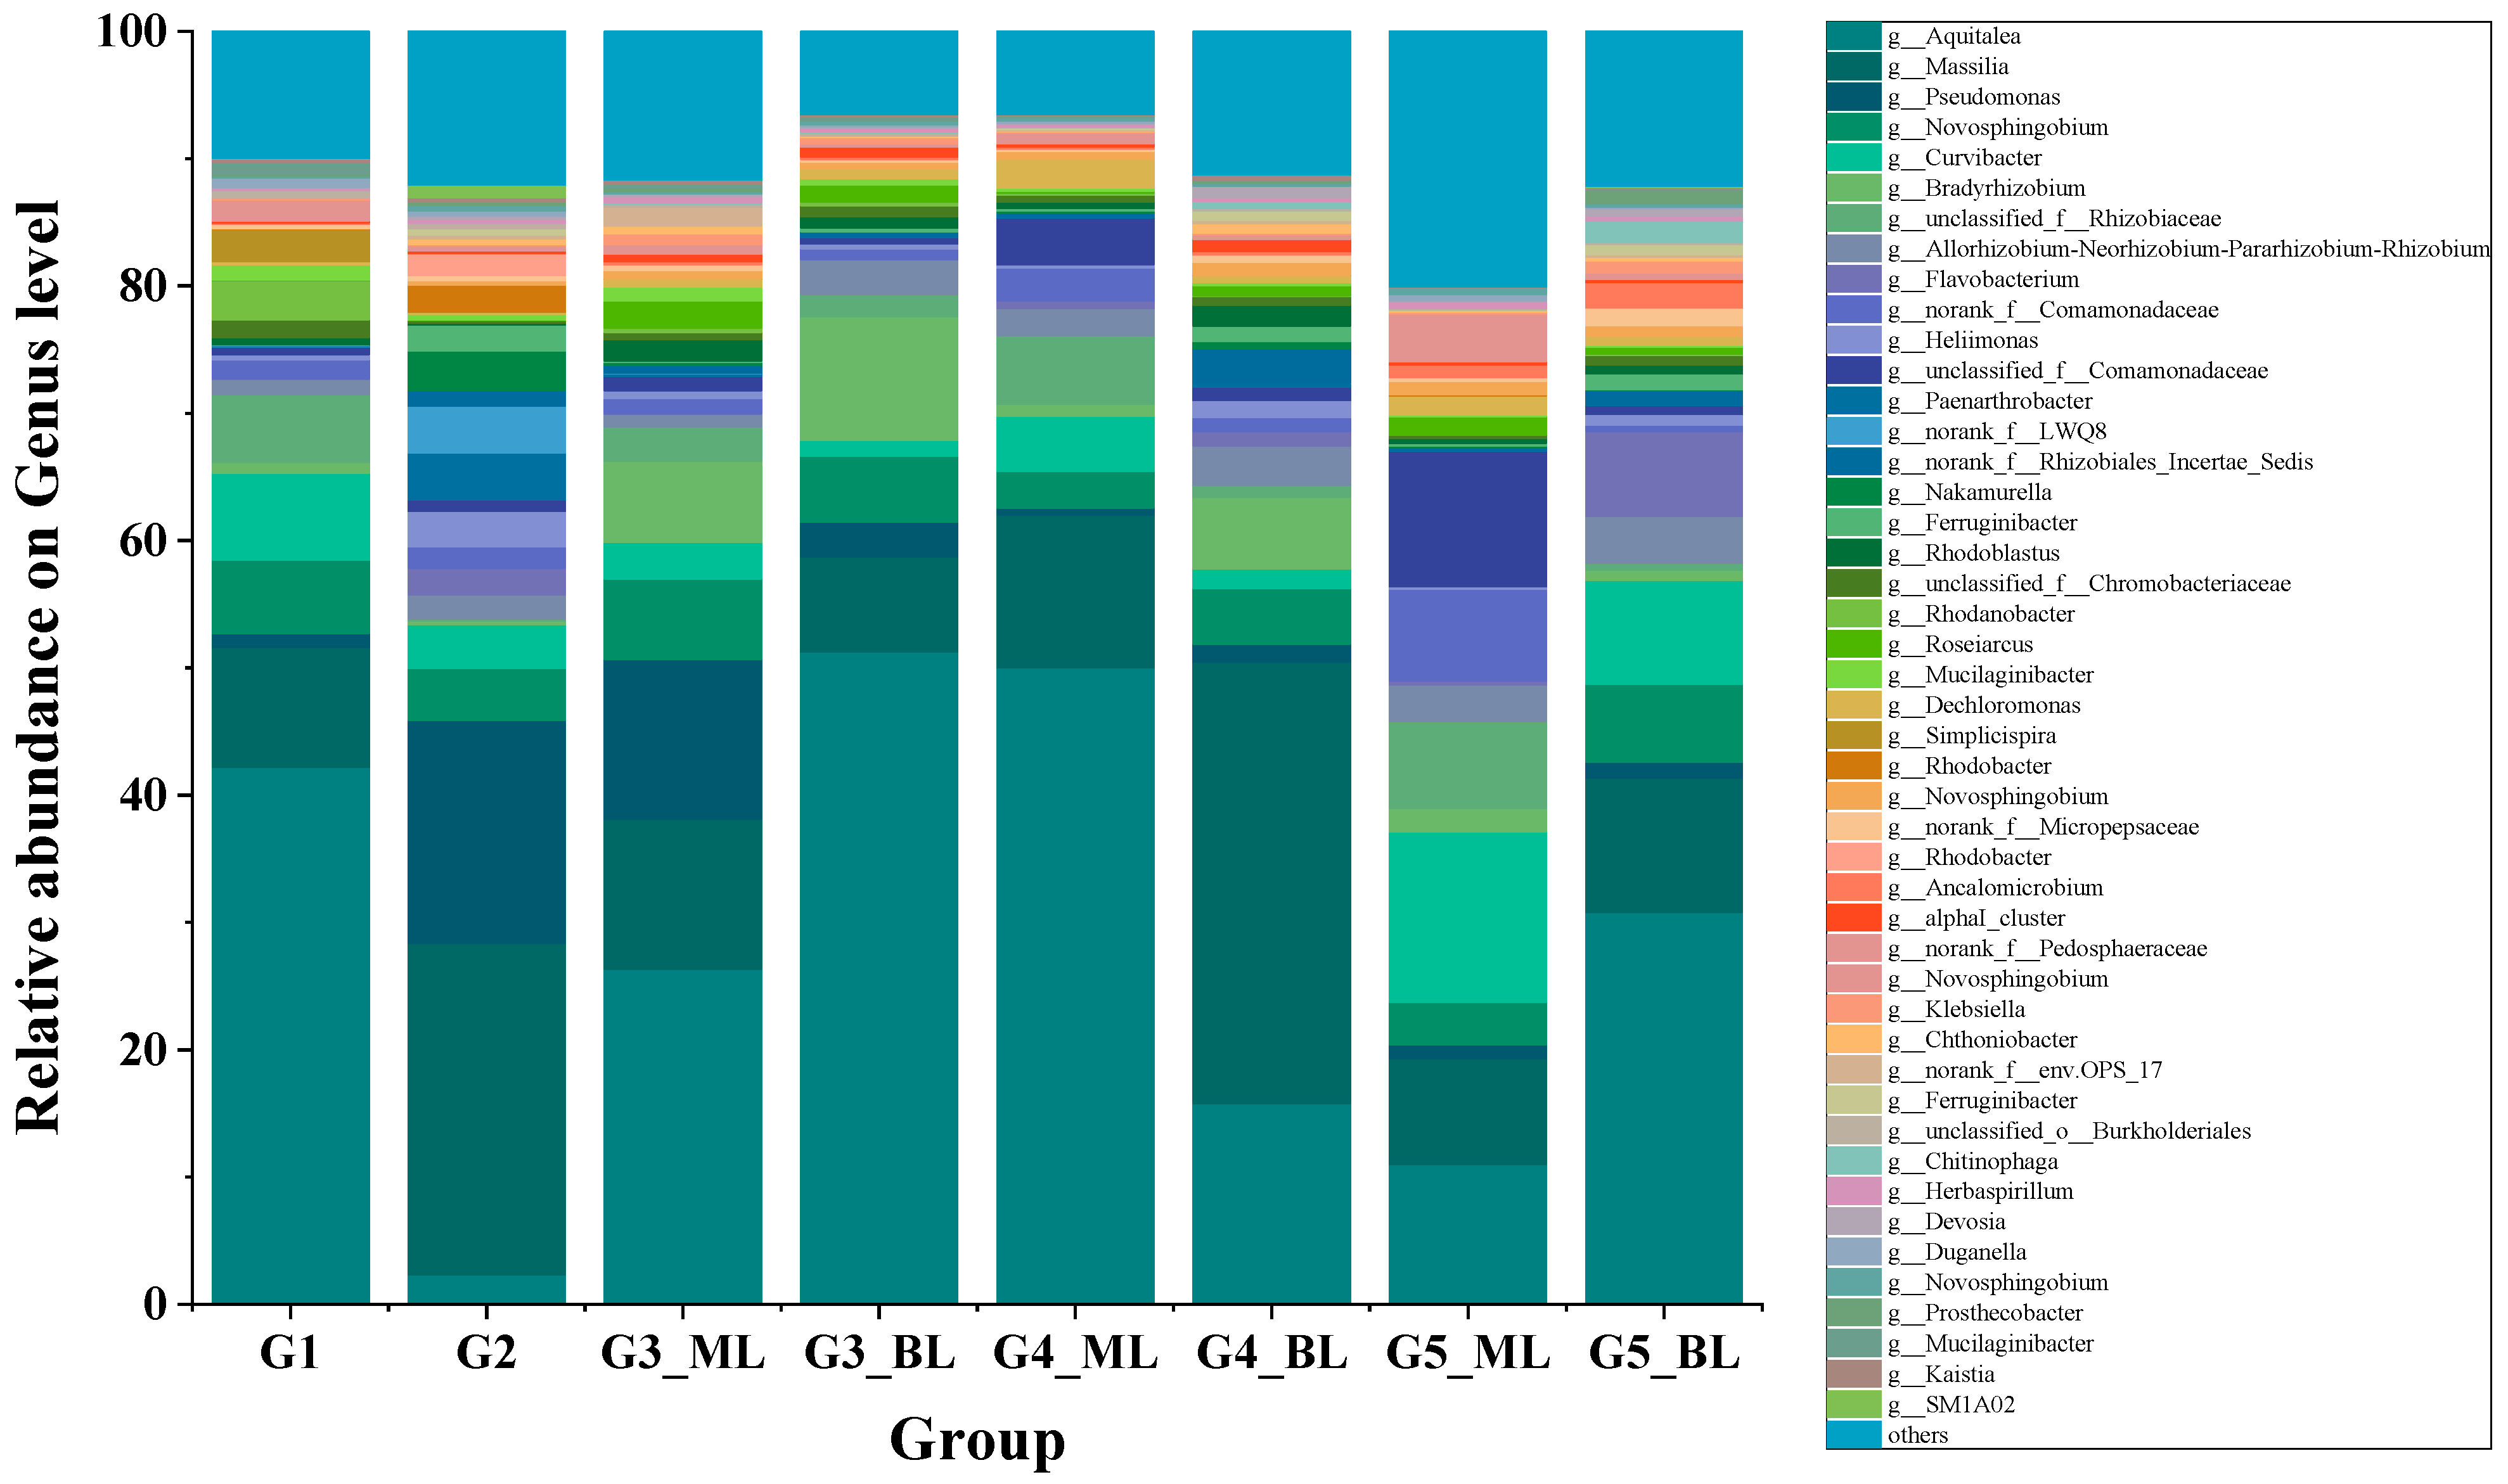
The genus-level community composition (Figure 8; taxa <0.01 pooled as “Others”) was dominated by Aquitalea, Massilia, Pseudomonas, and Novosphingobium. In G1 (ML monoculture), Aquitalea (46.87%), Massilia (8.91), and Curvibacter (7.63%) were most abundant. In G2 (BL monoculture), Massilia (26.03%), Pseudomonas (17.49%), Novosphingobium (4.12%), and LWQ8 (3.71%) dominated. Aquitalea, a widespread aquatic, Gram-negative genus with denitrifying and organic-degrading capacities, likely contributed to N removal and COD attenuation. In contrast, Massilia, as the dominant genus in G2, possesses phosphate-solubilizing traits [44] and nitrogen accumulation capability [45], which may explain the slightly higher phosphate ( PO 4 3 -P) removal load of G2 compared to that of G1. Coculture altered host-specific assemblages. In G3 and G5, Aquitalea on BL roots (51.25% and 30.79%) exceeded its abundance on ML roots, indicating strong cross-species effects of mixed planting on BL’s rhizosphere and its pollutant-removal potential. In the mixed planting groups (G3, G4, G5), the relative abundance of Aquitalea in the BL rhizosphere exhibited a consistent upward trend. Conversely, its abundance in the ML rhizosphere declined in G3 and G5, but slightly increased in G4. In addition, Massilia emerged as the dominant genus in G2, reaching a relative abundance of 26.03%. Its abundance in the BL rhizosphere of G3 and G5 significantly decreased. However, its abundance in the BL rhizosphere of G4 reached 34.69%, becoming the predominant genus in this group. Interestingly, the enrichment of Aquitalea (the dominant genus in G1) and Massilia (the dominant genus in G2) in the ML and BL rhizosphere of G4 coincided with a slightly higher removal load of phosphate in G4 compared with other groups. Although this functional correlation is noteworthy, the difference in phosphate removal does not reach statistical significance (p > 0.05). Thus, Aquitalea and Massilia may remove some phosphate in the water of G4 but may not play a core role. In addition, Pseudomonas was highly enriched in G2 (17.49%) but nearly undetected in G1. In the mixed planting groups, the introduction of ML significantly suppressed the enrichment of Pseudomonas in the BL rhizosphere. Pseudomonas is widely recognized for its versatile roles in nitrification, denitrification, and phosphorus removal, thus exhibiting high potential for high-efficiency wastewater treatment [46,47]. However, its low abundance in the mixed planting groups did not correspond to the low N and P removal roads, indicating that it may not be responsible for N and P removal in these groups.

3.5.3. LEfSe Analysis

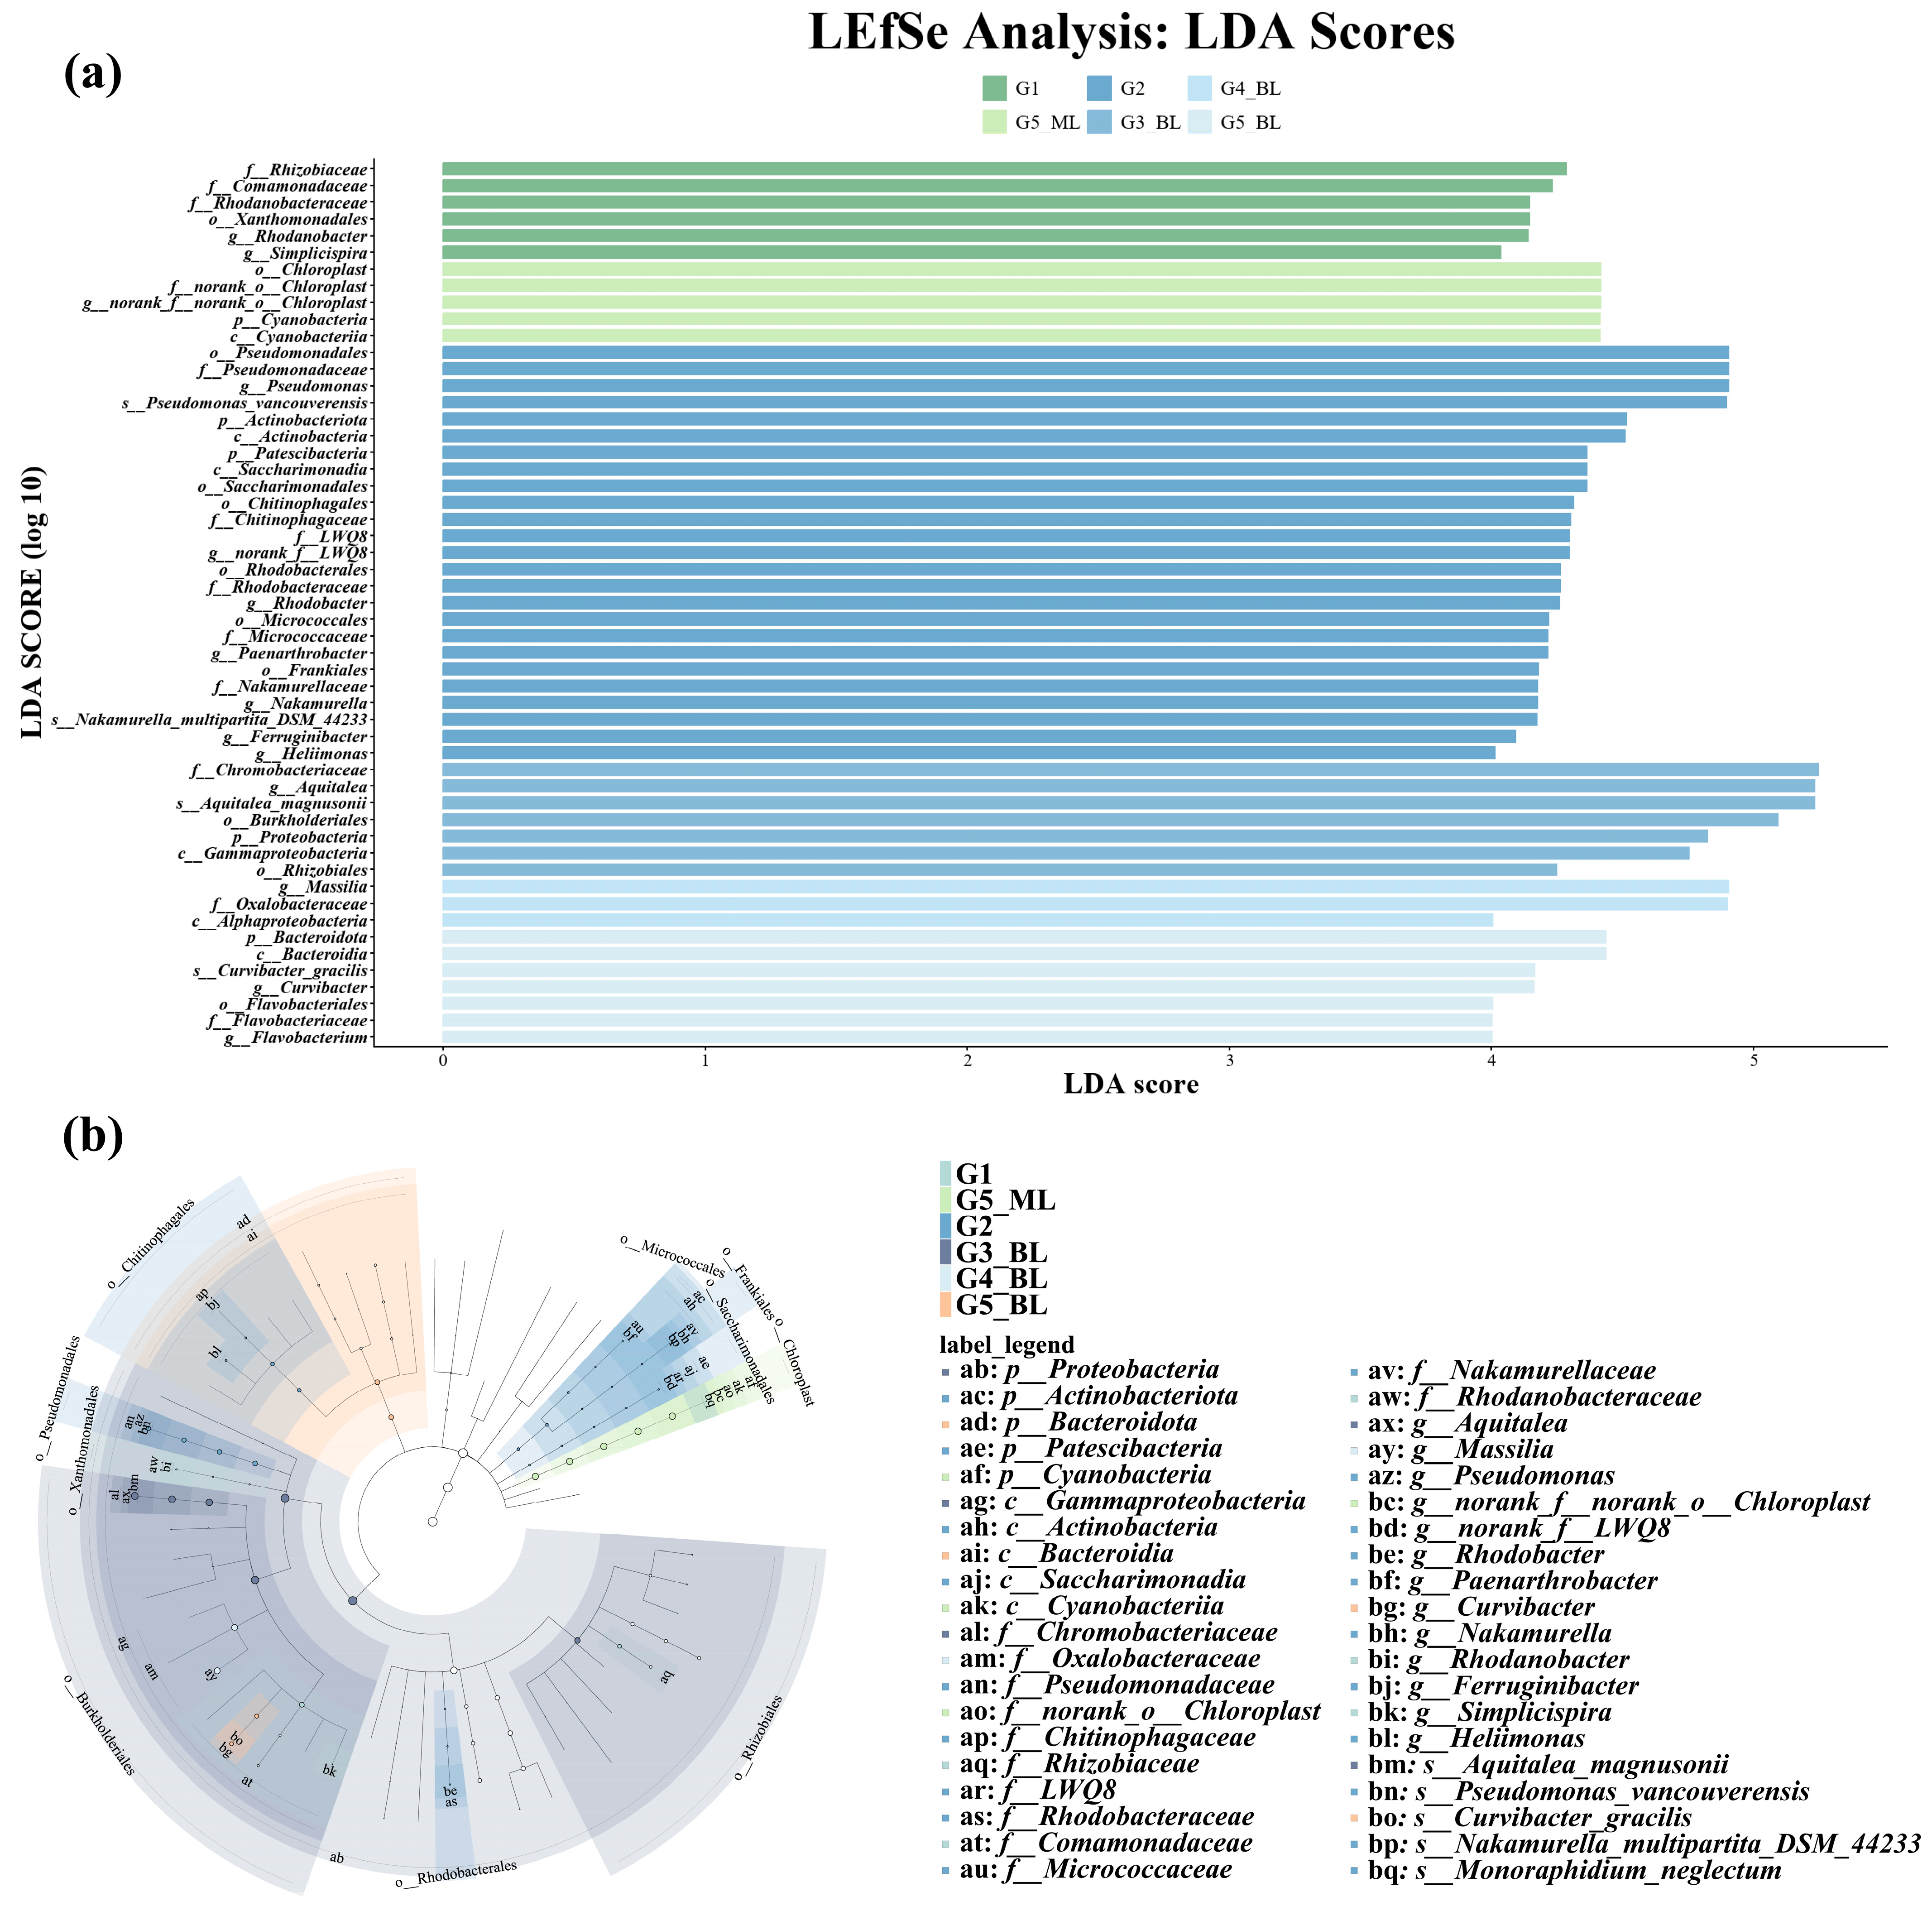
To identify microbial taxa that differed significantly among treatments, we used Linear Discriminant Analysis Effect Size (LEfSe). The cladogram summarizes biomarker lineages from the phylum to the genus level (Figure 9), revealing distinct microbial enrichment patterns for each group. In the ML rhizosphere, G1 was enriched in Rhizobiaceae, Rhodanobacteraceae, Xanthomonadales, Rhodanobacter, Comamonadaceae, and Simplicispira. In contrast, G5 (ML) was characterized by Chloroplast, Cyanobacteria, and Cyanobacteriia.
LEfSe analysis identified microeukaryotic taxa (Chloroplast-derived taxa) as a key biomarker in G4. Detailed taxonomic profiling revealed that these sequences (Chloroplast) were dominated by Chlorella and Tetradesmus. Their enrichment in G4 suggests that the high removal performance of phosphate was likely attributed to the formation of a microalgae–bacteria consortium, where these microalgae worked in tandem with dominant bacterial genera such as Aquitalea and Massilia.
Notably, Rhodanobacteraceae possesses denitrifying capabilities, enabling the conversion of nitrate to N2 or N2O, which may help explain the greater ammonium and nitrate removal loads observed in G1 relative to other groups. Research has also indicated that Rhodanobacter plays a crucial role in the phosphorus cycle by solubilizing soil-fixed, plant-unavailable phosphorus into a bioavailable form [48]. In this study, however, no significant differences in phosphate nutrient removal were observed among the plant groups. It is noteworthy that Rhizobiaceae, recognized for its nitrogen-fixing symbiosis (classically described in leguminous), can reportedly acquire phosphorus by decomposing organic phosphorus compounds, thus playing an important role in the biotransformation and cycling of phosphorus [49]. However, there is no definitive research establishing a strong effect of orthophosphate in this system. Furthermore, the high abundance of microeukaryotic taxa, Cyanobacteria, and Cyanobacteriia within the rhizosphere of the G5-ML group may be linked to the observed nutrient removal performance, although 16S data alone cannot confirm functional activity. These taxa are capable of sequestering N and P from the water column [50], which is consistent with the lower nutrient concentrations observed in G5. Importantly, Chloroplast reflects plastid-derived DNA and should be interpreted cautiously as a marker of phototrophic/plant material rather than a bacterial lineage. In the BL rhizosphere, G2 was enriched in Pseudomonadaceae, Pseudomonas, Pseudomonas_vancouverensis, and Actinobacteriota. G3 (BL) was characterized by Chromobacteriaceae, Aquitalea, and Aquitalea_magnusonii. For groups G4 and G5, the dominant taxa in the BL rhizosphere were Massilia and Bacteroidota, respectively. Many strains within Pseudomonadaceae and Pseudomonas are well-documented phosphate-solubilizing bacteria (PSB) that enhance plant P uptake [51].
Overall, LEfSe indicates that ML- and BL-based treatments restructure root microbiomes in distinct manners, enriching biomarker taxa that are plausibly related to N and P cycling. These compositional shifts provide candidate microbial indicators associated with treatment performance; however, functional attribution should be interpreted cautiously without the direct measurements of process rates or functional genes.

3.6. Practical Implications and Technological Assessment

Based on urban ecology and sustainable development, the herbal plant-based green roof wetland system was proposed in this study. This strategy can simultaneously separate and reutilize N and P from stormwater/greywater, harvest economic crops, and realize on-site treatment of decentralized wastewater, exhibiting significant application potential for urban stormwater and resource management.
Substrate clogging is a common failure mode in terrestrial constructed wetlands [52,53], which can be solved using this rooftop system. It is primarily attributed to the hydroponic mode of the green roof wetland system and the low concentration of suspended solids in influent rooftop runoff and greywater. Furthermore, the robust and fibrous root systems of ML and BL can maintain the porosity of the substrate attached to the plant roof. Thus, system clogging can be effectively reduced, which significantly increases the stability and maintenance of the green roof wetland system.
In addition, this green roof wetland system facilitates the transformation of traditional water ecological treatment systems, shifting from a treatment-only model to a resource recovery coupled treatment model. This system simultaneously achieves the separation and reutilization of N and P from stormwater/greywater, as well as wastewater purification. The medicinal properties of ML and the nutritional value of BL provide tangible economic outputs that can offset long-term operational costs [54], thereby enhancing the return on investment (ROI) and rainwater utilization rate for building owners within the “Sponge City” framework [55,56]. Thus, the application of this system meets the ecological and sustainable development of cities.
Finally, although this system was operated for one autumn–winter campaign (70 d) and the selected species demonstrated inherent environmental resilience, long-term operation of this system should be studied under more seasons and with more plant species. In addition, the collection and utilization of real stormwater/greywater should be considered in future studies on this system. Such studies can increase the practical applicability of this system.

4. Conclusions

In this study, a Chinese herbal plant-based green roof wetland system was constructed and operated in the autumn–winter season for 70 d. The results show that the system can effectively improve water quality and enable the separation and reutilization of N and P from synthetic stormwater/greywater under rooftop hydroponic conditions. Plant composition was a key variable for this system. The optimal plant ratio was 1:3 for Mentha spicata (ML) and Basella alba (BL), which achieved the highest separation and reutilization efficiencies for TN and TP, mainly due to the absorption effect from plant growth removal while effectively suppressing algal blooms and sustaining vigorous plant growth. Compared with single-plant species, cooperation between the two plants exhibited more potent algal inhibition, mainly due to the enhancement of ML’s allelopathic effects. An increase in the BL proportion was further associated with a gradual shift in the dominant ML root-associated microorganisms toward microeukaryotic taxa. For decentralized rooftop applications, a BL-rich mixture is recommended to achieve robust, multi-pathway pollutant removal and bloom control. Further work across seasons and loading regimes should aim to refine the ratio-specific design and verify the implicated microbial pathways.

Author Contributions

Conceptualization, B.L., P.Y., B.W. and C.F.; methodology, B.L., P.Y., B.W. and C.F.; software, B.L., P.Y., B.W. and C.F.; validation, W.K., C.L. and L.L.; formal analysis, B.L., P.Y., B.W. and C.F.; investigation, B.L., P.Y., B.W. and C.F.; resources, B.L., P.Y., B.W. and C.F.; data curation, B.L., P.Y., B.W. and C.F.; writing—original draft preparation, B.L., P.Y. and B.W.; writing—review and editing, H.G. and S.W.; visualization, W.K., C.L. and L.L.; supervision, H.G. and S.W.; project administration, B.L., P.Y., B.W. and C.F.; funding acquisition, B.L., H.G. and S.W. All authors have read and agreed to the published version of the manuscript.

Funding

This research was funded by the Technology Development Project of Pingdingshan University (No. PXY-HX-2025160), the Training Program for Young Backbone Teachers in Higher Education Institutions in Henan Province (2021GGJS147), the Natural Science Foundation of Henan Province (No. 242300420502), and the Wenzhou Ecological Park Research Project (No. SY2022ZD-1002-02).

Data Availability Statement

The data presented in this study are available on request from the corresponding author. The data are not publicly available due to the funder’s restrictions.

Acknowledgments

The authors express their sincere gratitude for the work of the editors and anonymous reviewers.

Conflicts of Interest

The authors declare no conflicts of interest.

References

  1. Lian, F.; Yi, W.; Ji, G.; Xia, J.; Wang, H. The Impact of Green Infrastructure on Mitigating Urban Heat Island Effect: Current Status, Trends, and Challenges. Forests 2025, 16, 1450. [Google Scholar] [CrossRef]
  2. Godyń, I.; Grela, A.; Muszyński, K.; Pamuła, J. The Impact of Green Infrastructure on the Quality of Stormwater and Environmental Risk. Sustainability 2024, 16, 8530. [Google Scholar] [CrossRef]
  3. Nou, C.; Charoenkit, S. The Potential of Green Infrastructure (GI) for Reducing Stormwater Runoff in a Phnom Penh Neighborhood. Geogr. Tech. 2020, 15, 112–123. [Google Scholar] [CrossRef]
  4. Sharma, R.; Malaviya, P. Management of Stormwater Pollution Using Green Infrastructure: The Role of Rain Gardens. WIREs Water 2021, 8, e1507. [Google Scholar] [CrossRef]
  5. Alim, M.A.; Rahman, A.; Tao, Z.; Garner, B.; Griffith, R.; Liebman, M. Green Roof as an Effective Tool for Sustainable Urban Development: An Australian Perspective in Relation to Stormwater and Building Energy Management. J. Clean. Prod. 2022, 362, 132561. [Google Scholar] [CrossRef]
  6. Yang, L.; Wang, J.; Yang, S.; Wang, M.; Li, L.; Chen, T.; Feng, L. A Modified Morris Screening Protocol for Sensitivity Analysis and Calibration of Green Roof Parameters in SWMM. City Environ. Interact. 2025, 28, 100228. [Google Scholar] [CrossRef]
  7. Lin, S.; Han, H.; Liu, X. Green Roofs for a Greener Future: Quantifying Carbon Sequestration and Oxygen Production Potential in Chinese Cities. J. Geogr. Sci. 2025, 35, 2091–2112. [Google Scholar] [CrossRef]
  8. Shao, J.; Yao, W.; Luo, L.; Zeng, L.; He, Z.; Wang, P.; Fu, X.; Qi, J.; Guo, H. Geospatial Big Data-Driven Roof Greening Priority and Benefit Assessment in Hong Kong. Remote Sens. Environ. 2025, 331, 115004. [Google Scholar] [CrossRef]
  9. Lee, H.; He, Y.; Isaac, M.E.; Roberto, A. Investigating Crop Performance on Urban Green Roofs Using Hyperspectral Data. Ecol. Inf. 2024, 81, 102599. [Google Scholar] [CrossRef]
  10. Li, Q.; Taubenböck, H.; Zhu, X.X. Identification of the Potential for Roof Greening Using Remote Sensing and Deep Learning. Cities 2025, 159, 105782. [Google Scholar] [CrossRef]
  11. Shaterabadi, M.; Karimi, H.; Mehrjerdi, H. Advanced Modelling of Green Roof-Enabled Plus-ZEB Energy Systems: A Synergistic Approach Using Taguchi Design and Neural Networks. Renew. Energy 2026, 256, 124314. [Google Scholar] [CrossRef]
  12. Zheng, X.; Kong, F.; Yin, H.; Middel, A.; Yang, S.; Liu, H.; Huang, J. Green Roof Cooling and Carbon Mitigation Benefits in A Subtropical City. Urban For. Urban Green 2023, 86, 128018. [Google Scholar] [CrossRef]
  13. Rafael, S.; Correia, L.P.; Ascenso, A.; Augusto, B.; Lopes, D.; Miranda, A.I. Are Green Roofs the Path to Clean Air and Low Carbon Cities? Sci. Total Environ. 2021, 798, 149313. [Google Scholar] [CrossRef]
  14. Joshi, M.Y.; Teller, J. Assessing Urban Heat Island Mitigation Potential of Realistic Roof Greening across Local Climate Zones: A Highly-Resolved Weather Research and Forecasting Model Study. Sci. Total Environ. 2024, 944, 173728. [Google Scholar] [CrossRef] [PubMed]
  15. Wooster, E.I.F.; Fleck, R.; Torpy, F.; Ramp, D.; Irga, P.J. Urban Green Roofs Promote Metropolitan Biodiversity: A Comparative Case Study. Build. Environ. 2022, 207, 108458. [Google Scholar] [CrossRef]
  16. Huang, J.; Bao, M.; Wu, S.; Wang, Y.; Cheng, S. Green Roofs Act as the First Barrier to Intercept Microplastics from Urban Atmosphere. Commun. Earth Environ. 2025, 6, 452–464. [Google Scholar] [CrossRef]
  17. Leite, F.R.; Antunes, M.L.P. Green Roof Recent Designs to Runoff Control: A Review of Building Materials and Plant Species Used in Studies. Ecol. Eng. 2023, 189, 106924. [Google Scholar] [CrossRef]
  18. Yan, J.; Yang, P.; Wang, B.; Wu, S.; Zhao, M.; Zheng, X.; Wang, Z.; Zhang, Y.; Fan, C. Green Roof Systems for Rainwater and Sewage Treatment. Water 2024, 16, 2090. [Google Scholar] [CrossRef]
  19. Xu, L.; Yang, S.; Zhang, Y.; Jin, Z.; Huang, X.; Bei, K.; Zhao, M.; Kong, H.; Zheng, X. A Hydroponic Green Roof System for Rainwater Collection and Greywater Treatment. J. Clean. Prod. 2020, 261, 121132. [Google Scholar] [CrossRef]
  20. Lin, Z.; Yang, Q.; Li, J.; Huang, A. Assessing Multi-Factor Combinations Impacts on Thermal Effects of Extensive Green Roofs Using ENVI-Met and Response Surface Methodology. Urban For. Urban Green 2025, 113, 129034. [Google Scholar] [CrossRef]
  21. Rapisarda, R.; Nocera, F.; Costanzo, V.; Sciuto, G.; Caponetto, R. Hydroponic Green Roof Systems as an Alternative to Traditional Pond and Green Roofs: A Literature Review. Energies 2022, 15, 2190. [Google Scholar] [CrossRef]
  22. Pham, T.L.; Bui, M.H. Removal of Nutrients from Fertilizer Plant Wastewater Using Scenedesmus sp.: Formation of Bioflocculation and Enhancement of Removal Efficiency. J. Chem. 2020, 2020, 8094272. [Google Scholar] [CrossRef]
  23. Vo, T.D.H.; Bui, X.T.; Nguyen, D.D.; Nguyen, V.T.; Ngo, H.H.; Guo, W.; Nguyen, P.D.; Nguyen, C.N.; Lin, C. Wastewater Treatment and Biomass Growth of Eight Plants for Shallow Bed Wetland Roofs. Bioresour. Technol. 2018, 247, 992–998. [Google Scholar] [CrossRef] [PubMed]
  24. Chai, H.; Tang, Y.; Su, X.; Wang, W.; Lu, H.; Shao, Z.; He, Q. Annual Variation Patterns of the Effluent Water Quality from a Green Roof and the Overall Impacts of Its Structure. Environ. Sci. Pollut. Res. 2018, 25, 30170–30179. [Google Scholar] [CrossRef]
  25. Hu, X.; Song, X.; Song, S.; Li, X.; Li, C.; Zhang, Z.; Li, G.; Chen, Q. Effect of Combinations of Green Roof Substrate with Vegetation Coverage on Rainwater Quality Improvement. Pol. J. Environ. Stud. 2024, 33, 1149–1158. [Google Scholar] [CrossRef] [PubMed]
  26. Cáceres, N.; Robbiati, F.O.; Suárez, M.; Hick, E.C.; Matoff, E.; Jim, C.Y.; Galetto, L.; Imhof, L. Growth Performance of Multi-Species Plant Mixtures on an Extensive Vegetated Roof: A Two-Year Experimental Study. Urban Ecosyst. 2024, 27, 1207–1223. [Google Scholar] [CrossRef]
  27. Nicol, E.; Terzano, K. Modelling the Optimal Green Roof Type for Carbon Capture in an Urbanised University Campus. Urban For. Urban Green 2025, 112, 128946. [Google Scholar] [CrossRef]
  28. Chen, C.; Kang, S.; Lin, J. Effects of Recycled Glass and Different Substrate Materials on the Leachate Quality and Plant Growth of Green Roofs. Ecol. Eng. 2018, 112, 10–20. [Google Scholar] [CrossRef]
  29. Gong, Y.; Zhang, X.; Li, H.; Zhang, X.; He, S.; Miao, Y. A comparison of the growth status, rainfall retention and purification effects of four green roof plant species. J. Environ. Manag. 2021, 278, 111451. [Google Scholar] [CrossRef]
  30. GB 18918-2002; Discharge Standard of Pollutants for Municipal Wastewater Treatment Plant. Ministry of Ecology and Environment: Beijing, China, 2002.
  31. HJ 1216-2021; Water Quality—Determination of Phytoplankton—0.1 mL Chamber—Microscope Counting Method. Ministry of Ecology and Environment of the People’s Republic of China: Beijing, China, 2021.
  32. Dai, G.; Zhong, J.; Hu, J.; Yang, P.; Fang, Y. Atlas of Main Algae in Poyang Lake Basin; Science Press: Beijing China, 2019. (In Chinese) [Google Scholar]
  33. Gu, Z.; Shi, J. Most Common Algal Images of Taihu; China Environment Press: Beijing, China, 2017. (In Chinese) [Google Scholar]
  34. Wei, T.; Jim, C.Y.; Chen, Y.; Chen, A.; Li, X. Complementary Influence of Green-Roof and Roof-Slab Thermal Conductivity on Winter Indoor Warming Assessed by Finite Element Analysis. Energy Rep. 2022, 8, 14852–14864. [Google Scholar] [CrossRef]
  35. Shen, S.; Geng, Z.; Li, X.; Lu, X. Evaluation of Phosphorus Removal in Floating Treatment Wetlands: New Insights in Non-Reactive Phosphorus. Sci. Total Environ. 2022, 815, 152896. [Google Scholar] [CrossRef]
  36. Zhang, Y.; Ji, Z.; Pei, Y. Nutrient Removal and Microbial Community Structure in an Artificial-Natural Coupled Wetland System. Process Saf. Environ. Prot. 2021, 147, 1160–1170. [Google Scholar] [CrossRef]
  37. Xu, C.; Zhu, C.; Li, Y.; Zhang, H.; Lv, W. Palygorskite-Mediated Simultaneous Nutrient Removal and Antibiotic Degradation from Aquaculture Wastewater in Lab-Scale Constructed Wetlands. Chem. Eng. J. 2024, 499, 156568. [Google Scholar] [CrossRef]
  38. Tian, P.; Razavi, B.S.; Zhang, X.; Wang, Q.; Blagodatskaya, E. Microbial Growth and Enzyme Kinetics in Rhizosphere Hotspots Are Modulated by Soil Organics and Nutrient Availability. Soil. Biol. Biochem. 2020, 141, 107662. [Google Scholar] [CrossRef]
  39. Liu, G.; Xu, X.; Zhu, L.; Xing, S.; Chen, J. Biological Nutrient Removal in a Continuous Anaerobic–Aerobic–Anoxic Process Treating Synthetic Domestic Wastewater. Chem. Eng. J. 2013, 225, 223–229. [Google Scholar] [CrossRef]
  40. Yang, J.; Wang, F.; Lv, J.; Liu, Q.; Nan, F.; Liu, X.; Xu, L.; Xie, S.; Feng, J. Interactive Effects of Temperature and Nutrients on the Phytoplankton Community in an Urban River in China. Environ. Monit. Assess. 2019, 191, 688–703. [Google Scholar] [CrossRef]
  41. Kokociński, M.; Stefaniak, K.; Mankiewicz-Boczek, J.; Izydorczyk, K.; Soininen, J. The Ecology of the Invasive Cyanobacterium Cylindrospermopsis raciborskii (Nostocales, Cyanophyta) in Two Hypereutrophic Lakes Dominated by Planktothrix agardhii (Oscillatoriales, Cyanophyta). Eur. J. Phycol. 2010, 45, 365–374. [Google Scholar] [CrossRef]
  42. Nawaz, T.; Joshi, N.; Nelson, D.; Saud, S.; Abdelsalam, N.R.; Abdelhamid, M.M.A.; Jaremko, M.; Rahman, T.U.; Fahad, S. Harnessing the Potential of Nitrogen-Fixing Cyanobacteria: A Rich Bio-Resource for Sustainable Soil Fertility and Enhanced Crop Productivity. Environ. Technol. Innov. 2024, 36, 103886. [Google Scholar] [CrossRef]
  43. Mahendran, G.; Verma, S.G.; Rahman, L. The Traditional Uses, Phytochemistry and Pharmacology of Spearmint (Mentha spicata L.): A Review. J. Ethnopharmacol. 2021, 278, 114266. [Google Scholar] [CrossRef]
  44. Zheng, B.X.; Bi, Q.F.; Hao, X.L.; Zhou, G.W.; Yang, X.R. Massilia phosphatilytica sp. nov., a Phosphate Solubilizing Bacteria Isolated from a Long-Term Fertilized Soil. Int. J. Syst. Evol. Microbiol. 2017, 67, 2514–2519. [Google Scholar] [CrossRef]
  45. Yu, P.; He, X.; Baer, M.; Beirinckx, S.; Tian, T.; Moya, Y.A.T.; Zhang, X.; Deichmann, M.; Frey, F.P.; Bresgen, V.; et al. Plant Flavones Enrich Rhizosphere Oxalobacteraceae to Improve Maize Performance under Nitrogen Deprivation. Nat. Plants 2021, 7, 481–499. [Google Scholar] [CrossRef]
  46. Xu, T.; Liu, W.; Liu, X.; Li, X.; Xian, Q.; Huo, S.; Zhao, C.; Guo, B.; Li, Q. The Symbiotic System between Tribonema sp. and Aerobic Denitrifying Phosphorus Accumulating Bacteria: A Promising Method for Wastewater Treatment. Algal Res. 2025, 85, 103824. [Google Scholar] [CrossRef]
  47. Li, B.; Jing, F.; Wu, D.; Xiao, B.; Hu, Z. Simultaneous Removal of Nitrogen and Phosphorus by a Novel Aerobic Denitrifying Phosphorus-Accumulating Bacterium, Pseudomonas stutzeri ADP-19. Bioresour. Technol. 2021, 321, 124445. [Google Scholar] [CrossRef] [PubMed]
  48. Woo, H.; Kim, I.; Chhetri, G.; Park, S.; Lee, H.; Yook, S.; Seo, T. Two Novel Bacterial Species, Rhodanobacter lycopersici sp. nov. and Rhodanobacter geophilus sp. nov., Isolated from the Rhizosphere of Solanum lycopersicum with Plant Growth-Promoting Traits. Microorganisms 2024, 12, 2227. [Google Scholar] [CrossRef]
  49. Podowski, J.C.; Forrester, S.; Antonopoulos, D.A.; Steeb, J.L.; Kent, A.D.; Davis, J.J.; Schabacker, D.S. Response of Soil Bacteria to PUREX Chemicals Suggests Biomarker Utility and Bioremediation Potential. J. Radioanal. Nucl. Chem. 2024, 333, 1899–1909. [Google Scholar] [CrossRef]
  50. Muñoz-Marín, M.d.C.; López-Lozano, A.; Moreno-Cabezuelo, J.Á.; Díez, J.; García-Fernández, J.M. Mixotrophy in Cyanobacteria. Curr. Opin. Microbiol. 2024, 78, 102432. [Google Scholar] [CrossRef]
  51. Dasila, H.; Sah, V.K.; Jaggi, V.; Kumar, A.; Tewari, L.; Taj, G.; Chaturvedi, S.; Perveen, K.; Bukhari, N.A.; Siang, T.C. Cold-Tolerant Phosphate-Solubilizing Pseudomonas Strains Promote Wheat Growth and Yield by Improving Soil Phosphorous (P) Nutrition Status. Front. Microbiol. 2023, 14, 1135693. [Google Scholar] [CrossRef]
  52. Fang, Y.; Kong, L.; Zhang, P.; Zhang, L.; Zhao, H.; Xiang, X.; Cheng, S.; Zhang, H.; Ju, F.; Li, L. Fifteen-Year Analysis of Constructed Wetland Clogging: A Critical Review. J. Clean. Prod. 2022, 365, 132755. [Google Scholar] [CrossRef]
  53. Wang, H.; Sheng, L.; Xu, J. Clogging Mechanisms of Constructed Wetlands: A Critical Review. J. Clean. Prod. 2021, 295, 126455. [Google Scholar] [CrossRef]
  54. Das, S. Underutilized Crop-Wild Variant of Popular Leafy Vegetable Basella alba L.—A Source of Nutrients and Novel Bioactive Components. Nat. Prod. Res. 2025, 1–5. [Google Scholar] [CrossRef]
  55. Hou, J.; Mao, H.; Li, J.; Sun, S. Spatial Simulation of the Ecological Processes of Stormwater for Sponge Cities. J. Environ. Manag. 2019, 232, 574–583. [Google Scholar] [CrossRef] [PubMed]
  56. Zhao, Z.T.; Cheng, H.M.; Wang, S.; Liu, H.Y.; Song, Z.M.; Zhou, J.H.; Pang, J.W.; Bai, S.W.; Yang, S.S.; Ding, J. SCC-UEFAS, an Urban-Ecological-Feature Based Assessment System for Sponge City Construction. Environ. Sci. Ecotechnol. 2022, 12, 100188. [Google Scholar] [CrossRef] [PubMed]
Figure 1. Schematic of the experimental setup.
Separations 13 00074 g001
Figure 2. Aboveground and underground biomass of plants in each treatment group.
Separations 13 00074 g002
Figure 3. Root length (a), area (b), volume (c), and average diameter (d) in different groups.
Separations 13 00074 g003
Figure 4. Differences in DO (a), WT (b), pH (c), and Turb (d) among various groups. Significance level: 0.05, different letters on the data column indicate significant difference.
Separations 13 00074 g004
Figure 5. Removal loading of TN (a),  NH 4 + -N (b),  NO 3 -N (c), TP (d),  PO 4 3 -P (e), and CODcr (f). Different letters on the data column indicate significant difference.
Separations 13 00074 g005
Figure 6. Heatmap of correlations between water restoration effectiveness and plant growth (a) and between water quality parameters (b).
Separations 13 00074 g006
Figure 7. Variations in algal abundance (a) and relative abundance (b).
Separations 13 00074 g007
Figure 8. Microbial community composition at the genus level.
Separations 13 00074 g008
Figure 9. Differentially abundant microbial taxa identified by (a) Linear Discriminant Analysis (LDA) with a score > 4.0 and (b) cladogram from LEfSe analysis illustrating the discriminative bacterial taxa at multiple taxonomic levels in the root microbiome.
Separations 13 00074 g009
Table 1. Experimental group design and treatment.
GroupMatching RatioNumber
CK//
G1ML:BL = 1:0ML = 60
G2ML:BL = 0:1BL = 60
G3ML:BL = 3:1ML = 45; BL = 15
G4ML:BL = 2:2ML = 30; BL = 30
G5ML:BL = 1:3ML = 15; BL = 45
Table 2. Plant biomass growth rate.
GroupTimeAboveground
Biomass (g/m2)
Growth
Rate
Underground
Biomass (g/m2)
Growth
Rate
Totally
Biomass (g/m2)
Growth
Rate
BLInitial95.772.0627.001.45122.781.93
Final293.4666.03359.49
MLInitial115.694.0042.531.05158.223.20
Final577.8986.99664.89
Table 3. Influent and effluent concentrations of N, P, and COD in each system during the 70 d cultivation period.
GroupConcentration of TN (mg L−1)Concentration of  NH 4 +  (mg L−1)Concentration of  NO 3 (mg L−1)Concentration of TP (mg L−1)Concentration of  PO 4 3  (mg L−1)Concentration of CODcr (mg L−1)
CK12.81 ± 3.506.74 ± 2.063.27 ± 0.480.33 ± 0.190.42 ± 0.2315.53 ± 3.46
G18.99 ± 1.504.95 ± 1.440.22 ± 0.130.19 ± 0.020.11 ± 0.0212.44 ± 2.26
G211.06 ± 1.226.65 ± 1.932.11 ± 0.890.18 ± 0.040.17 ± 0.057.35 ± 1.51
G39.22 ± 4.685.65 ± 1.930.6 ± 0.180.17 ± 0.030.16 ± 0.0320.53 ± 1.65
G46.69 ± 1.545.42 ± 1.990.46 ± 0.20.17 ± 0.060.14 ± 0.0412.38 ± 2.9
G53.55 ± 1.574.83 ± 2.660.37 ± 0.20.18 ± 0.050.16 ± 0.0521.26 ± 3.8
Influent 120.18 ± 0.2713.39 ± 1.185.37 ± 0.320.97 ± 0.030.95 ± 0.0330.73 ± 0.88
Influent 219.74 ± 0.3012.81 ± 1.365.38 ± 0.290.97 ± 0.020.95 ± 0.0230.46 ± 0.79
Table 4. Alpha diversity indexes.
GroupAceChaoSobsShannonSimpsonCoverage
G1407.5563392.70073692.7881820.174410.99869
G2604.8293584.92295703.6792340.070180.998716
G3_ML531.7016515.02254833.3823860.1001830.998392
G3_BL469.7591459.69354102.5858380.2543770.998231
G4_ML376.2545369.753152.1159960.2575870.998337
G4_BL599.79995835393.3449820.1352030.998108
G5_ML247.5274235.66672031.1059960.6040880.999034
G5_BL591.8593574.13165573.4580160.1126580.998719
Disclaimer/Publisher’s Note: The statements, opinions and data contained in all publications are solely those of the individual author(s) and contributor(s) and not of MDPI and/or the editor(s). MDPI and/or the editor(s) disclaim responsibility for any injury to people or property resulting from any ideas, methods, instructions or products referred to in the content.