Article

A Focus on the Emission of Volatile Organic Compounds (VOCs) from Raw Materials Potentially Used in Human Odor Sampling

1
Unité Mixte de Recherche Chimie Biologie Innovation (UMR CBI), Laboratoire des Sciences Analytiques, Bioanalytiques et Miniaturisation, Ecole Supérieure de Physique et de Chimie Industrielle de la Ville de Paris (ESPCI Paris), PSL Research University, 10 rue Vauquelin, 75005 Paris, France
2
SenseBiotek Health-Care, 21 Grande rue, 78240 Aigremont, France
*
Authors to whom correspondence should be addressed.
Separations 2025, 12(9), 250; https://doi.org/10.3390/separations12090250
Submission received: 25 July 2025 / Revised: 5 September 2025 / Accepted: 9 September 2025 / Published: 11 September 2025
(This article belongs to the Topic Advances in Chromatographic Separation)

Abstract

The present study provided an exhaustive examination of VOC emissions originating from 13 different raw materials susceptible to being used in the sampling of the human volatilome and encompassing both polymeric and non-polymeric compositions. To achieve this aim, thermodesorption coupled with comprehensive two-dimensional gas chromatography/time-of-flight mass spectrometry (TD-GC×GC/ToFMS) was employed. For each material, we report the total number of detected peaks, total volatile organic compound (TVOC) concentration, distribution of VOC emissions across different chemical families, minimum and maximum individual concentrations, as well as hypotheses regarding the origins of some specific VOCs depending on the material considered. The findings from this investigation revealed that materials, such as silicone and polyurethane, could emit an extensive array of VOCs, with up to 2000 chromatographic peaks detected, and emissions of total volatile organic compounds (TVOCs) reaching levels of 5.4 µg·g−1 and 9.8 µg·g−1, respectively. In the case of polyamide, some VOCs could be related to potential reagents involved in its synthesis. While highlighting materials that should be used with caution depending on the topic and target analytes, this study identified materials that exhibited minimal VOC emissions, such as polytetrafluoroethylene, aluminum, and stainless steel, after an adequate conditioning step. The selected analytical technique, TD-GC×GC/ToFMS, proved its relevance to identify and characterize semi-quantitatively VOC emissions coming from those materials. Such information was essential within the frame of the development of a body odor sampling system, our primary objective.

1. Introduction

Materials, belonging to different categories such as minerals, organics, metals, and composites, constitute the very fabric of our everyday surroundings. While these materials offer invaluable utility, some also harbor potential drawbacks arising from emissions of volatile organic compounds (VOCs). These emissions are a particular concern due to their impact on air quality [1], since individuals spend more than 80% of their time in indoor settings with increased VOC concentrations [2,3,4]. Additionally, many materials share intimate contact with our daily products, such as food, pharmaceuticals, and cosmetics. While commonly recognized health effects include conditions such as “sick car syndrome” or “sick building syndrome”, the ramifications extend to direct health impact [5]. Efforts to measure the emissions of volatile organic compounds (VOCs) from materials rely mainly on gas chromatography-mass spectrometry. (GC-MS). According to ISO 16000-6, the international standard for determining VOC emissions from materials, GC-MS is the preferred analytical technique for assessing VOC emissions into indoor air [6], after standardized methods, such as chamber tests, sorbent tubes, or headspace-solid phase micro extraction (HS-SPME), for sampling [7,8,9,10]. However, the analysis of the raw material itself remains infrequent.
Similar complexities emerge in health-care monitoring. Recent reviews have indicated that both skin and breath secretions have been found to contain a number of VOCs, ranging from 500 to 1000, respectively, including biomarkers, which are often sought-after and could be present at ppm or ppb levels [11,12]. When breath samples are collected to search for biomarkers, it is often by means of sampling bags, although the VOC emissions of bags introduce contaminations. Thus, the contaminants can directly affect the limit of detection (LOD) or even completely hide the searched biomarkers [13]. The same problem can arise while performing body odor analysis by using, for example, a headspace collection chamber [14]. In this case, the protocol mentioned materials like aluminum, polymethyl methacrylate, acrylonitrile butadiene styrene, nylon, a thermoplastic elastomer, and a chair in polyethylene high-density for the manufacture of the collection chamber. Thus, knowing the VOC emissions of these materials was important not to confound them with the ones emitted by the sampled individual. An underestimation of these emissions can potentially be very problematic, as some studies showed a shift from 2624 chromatographic peaks to 332 peaks after blank emissions removal in the context of body odor sampling [15]. Noteworthy, it has previously been demonstrated that sorbents labeled as “biologically sterile” are not necessarily “analytically clean” [16]. In any case, it is important to bear in mind that volatile organic compounds (VOCs) emitted from materials can mask trace-level biomarkers in the volatilome.
Beyond these challenges, the expected large number of compounds highlights the intricacies of co-elution of peaks in gas chromatography mass spectrometry (GC/MS). This method found utility in tracking VOCs across various media [17], but there is a growing need for a more resolutive technique, like comprehensive two-dimensional gas chromatography/time-of-flight mass spectrometry (GC×GC/ToFMS), which will be used in the present study, enabling a heightened peak capacity [18] and sensitivity by a factor of 10 to 50 principally due to the refocusing effect of the modulation steps compared to GC/MS, thereby enhancing the efficiency of the technique in non-targeted analyses [19]. These enhancements can be attributed in part to the dual separation process. Typically, a GC×GC separation is achieved using a non-polar column to separate compounds based on volatility in the first dimension and a polar column to separate compounds based on polarity in the second dimension.
The overarching objective of the present study resides in spotlighting VOC emissions from 13 distinct polymeric and non-polymeric raw materials thanks to the benefits of TD-GC×GC/ToFMS, the method chosen in the course of body odor sampling under clinical conditions [20,21]. The endeavor to establish a sampling system for body odor prompted the evaluation of VOC emissions from these materials under TD-GC×GC/ToFMS analyses. The resulting findings are presented herein, with broad applications envisaged. TD-GC×GC/ToFMS analysis conditions for investigating the likely emitted compounds from these materials were chosen to copy as best as possible the real conditions further employed for the sampling of body odor [18,19]. This assessment arose from the observation that the sampling system itself produced final non-clean blanks, and a noticeable gap existed in understanding how to address VOC emissions from materials in the specific context of body odor sampling. Moreover, a direct examination of raw materials could help to eliminate any uncertainty about the origin of the observed VOCs, thereby furnishing unequivocal data, which is seldom the case.

2. Materials and Method

2.1. Materials

Thirteen potentially different raw materials considered for the development of our sampling system of body odor, which are already cited in body odor studies [22], have been chosen as the investigated materials. These materials, which could potentially be used in a body odor sampling strategy, were evaluated for their suitability. They are detailed in Table 1. Triplicate analyses were performed for the following 7 materials: polyamide (PA), photopolymer (acrylic-based polymer), polypropylene/acrylonitrile butadiene (PP/AB), polycarbonate (PC), stainless steel, polytetrafluoroethylene (PTFE), and aluminum. Explanations regarding the absence of triplicate for high-modulus polyethylene (HMPE), polyethylene high-density (PEHD), thermoplastic elastomer (TPE), biaxially oriented polyethylene terephtalate (BoPET), polyurethane (PU), and silicone are given in Section 3 (see Section 3.2 Qualitative Observations).
For the purpose of simulating real body odor sampling conditions for the characterization of possible compounds supposed to interact with the body odor volatilome, a similar approach to the one used for further body odor sampling was developed [23,24,25]. In this aim, each material was firstly provided by the suppliers and cut into suitable sizes (~2–3 mm wide) to fit within thermodesorption tubes measuring 3.5“ × ¼”. This was achieved using scissors or cutting pliers as needed. Subsequently, each sample underwent a cleaning process involving immersion in a 96% ethanol bath (Carlo Erba, Val de Reuil, France), associated with a 20 min sonication period, and concluded with a 30 min drying session at 40 °C. This cleaning step aimed to eliminate compounds deposited on the material surface and not originating from the material itself (i.e., environment, manipulation without gloves, etc.) or even from manipulators [26]. The sample weights varied, ranging approximately from 0.05 g to 0.3 g, depending on the material.

2.2. Thermodesorption

For thermodesorption, a TD 100-xr Markes (Markes International, Bridgend, UK) was used. Stainless steel tubes and their content, i.e., raw materials, were desorbed at 40 °C for 30 min with a helium (Alphagaz 1, Air Liquide, Ile-de-France, France) flow rate of 50 mL·min−1 into the built-in cold trap “General Purpose” C4/5-C30/32 UNITY2 at −10 °C containing graphitized carbon. Thanks to the automatic program of the TD 100-xr, two helium purges were carried out on each sample at room temperature before thermodesorption to remove any residual solvent: the first purge lasted 2 min at a flow rate of 50 mL·min−1 in backflush mode, and the second one at the trap lasted 1 min at 50 mL·min−1 in the sampling direction. Thanks to the TD 100-xr features, approximately 1 mL of toluene D8 (TD8, Air Liquide, Ile-de-France, France) at 1 ppm was automatically injected into the trap as an internal standard (IS). The cold trap was finally heated for 5 min at 60–100 °C·s−1 to 320 °C with a 4.2 mL·min−1 counter-current flow of helium for desorption and transfer to the GC×GC for injection with a 3 mL·min−1 split, which led to a split ratio of 3.5.

2.3. GC×GC/ToFMS

The GC×GC/ToFMS system was a LECO Pegasus BT4D (LECO, Villepinte, France). The GC×GC separation was conducted at a helium flow rate of 1.2 mL·min−1 (Alphagaz 1, Air Liquide, Ile-de-France, France). In the main oven, the first-dimension column used for separation was a non-polar column Rxi-5ms 5% diphenyl/95% dimethyl polysiloxane 30 m × 0.5 mm × 0.25 µm (Restek, Lisses, France). Modulation was carried out with a QuadJetTM nitrogen cryogenic modulator while setting a modulation period of 3 s (two 1.5 s cycles divided into 0.90 s of hot jet and 0.60 s of cold jet). A DB1701 14% cyanopropyl-phenyl-methylpolysiloxane 50 cm × 0.18 mm × 0.18 µm (Agilent, Les Ulis, France) medium polar column was used as the second-dimension column in the secondary oven. A temperature gradient was used starting at 35 °C, maintained for 2 min, and increased at 3 °C·min−1 up to 230 °C. The temperature of the secondary oven (2nd column) was set at 15 °C above that of the primary oven, using the same temperature ramp of 3 °C·min−1. The analytes were then transferred to the mass spectrometer using a 31 cm × 0.18 mm transfer line in deactivated silica and heated at 250 °C.
The mass spectrometer was used with an electron ionization source at 70 eV and 250 °C using a scan range of 45–300 m/z at a scan frequency of 200 Hz.

2.4. Data Acquisition and Treatment

The ChromaToF software 5.55 from LECO (Villepinte, France) was used for data acquisition and processing. Initially, an automatic “peak finding” approach was applied, employing a signal-to-noise (S/N) threshold set at 1000 as requested for TD emission, as the background level is drastically higher than for liquid injections, where such a threshold would currently hold values in the 5–10 range. This method allowed us to look for all detected peaks that met the previous criteria across the chromatogram. Integrations were performed on the most predominant m/z value for each compound. Subsequent manual verification was conducted to identify incorrectly combined peaks or to eliminate artifacts. For chromatograms with more than 1000 peaks, the manual verification could last up to three days, and approximately one hour for chromatograms with less than 200 peaks.
During data processing, owing to the complexity of the chromatograms, the compounds were classified into families. Due to the large number of peaks present, the use of authentic standards was not considered when identifying chemical families and chromatographic peaks. To streamline this process, nine chemical families were considered with particular attention: hydrocarbons (HCs, with alkanes and alkenes), aromatics, esters, alcohols, ketones, acids, aldehydes, nitrogen-containing compounds (N), and ethers. Two other groups of compounds were added: the first one, named as “other compounds”, corresponded to compounds not belonging to the previous families, and the second one was associated with a series of “unidentified compounds” (see below). By comparing the total sum of all integrated peak areas and the peak areas within these families, a semi-quantitative estimate of unidentifiable compounds could be determined. The level of these unidentified compounds in the 2D chromatograms somehow reflects the number of compounds measured as TVOCs and participates in the emergence of the so-called noisy chromatograms. Areas were obtained by integrating the various modulated peaks belonging to the same compound, distributed over different modulations, and then recombined.
The classification of a compound into a specific family was established on the basis of its identification performed by using a matching score with the NIST 2020 library exceeding 800; the matching was based on the mass spectrum and corroborated by the retention index values (with a settled window tolerance of 30). In addition, the identification relevance was verified based on the compatibility of the second-dimension retention time of the compound with respect to its polarity. For instance, a compound aligned with the hydrocarbon family would be anticipated to emerge on the contour plot chromatogram at around 1.3 s under our experimental conditions in the second dimension; greater polarity leads to heightened retention as the second-dimension column was medium-polar in this normal-phase configuration. When the second-dimension retention time of a compound significantly differed from the value expected, given its putative attribution without any suitable alternate attribution, it was classified as “unidentified”. Moreover, in instances where a compound featured multiple polar functions, the one most indicative of its polarity, as quantified by its position on the second-dimension axis, was employed. As an example, benzyl alcohol, situated at approximately 2.8 s, was classified in the alcohol family rather than in the aromatic one, as alcohols’ retention times are higher than aromatics’ retention times in the second dimension.
The summation of areas yielded the calculation of total volatile organic compounds (reported as TVOCs in the following), subsequently translated into concentrations employing the deuterated toluene TD8 equivalence, as used previously in the automobile field [27]; TVOCs were expressed in g per gram of material using the following equation (Equation (1)):
T V O C   c o n c e n t r a t i o n g / g   m a t e r i a l = ( a r e a s × m a s s T D 8 / A r e a T D 8 ) / m a s s m a t e r i a l
The categorization into families was employed to compute the composition percentages based on areas using the following equation (Equation (2)):
C h e m i c a l   f a m i l y   i % = a r e a s f a m i l y   i / a r e a s
The software JMP 14 (JMP Statistical Discover, Cary, NC, USA) was used to perform hierarchical clustering of the 13 materials. It was performed using Ward’s method [28], which calculates the distance between two clusters using the ANOVA sum of squares between the two clusters summed over all the variables.

3. Results and Discussion

3.1. Preliminary Results: Cleaning Step Evaluation

Before starting the study on the VOC emissions of materials, different choices needed to be made regarding the protocol in order to obtain representative and reliable results.
The cleaning step described in the Material and Methods Section 2.1 was applied in order to remove compounds deposited on the material surface that did not originate from the material itself (i.e., compounds coming from the environment, previous manipulation without gloves, possible packaging contamination, etc.). The choice of solvent was based on considerations of solvent–material interactions and its properties for extractable and leachable recovery [29]. Ethanol was chosen because it has satisfactory properties for removing organics that are likely to be emitted by the raw materials under investigation [23], ensuring consistent results from sample to sample. Ethanol can also be easily incorporated into a cleaning protocol as part of a clinical approach.
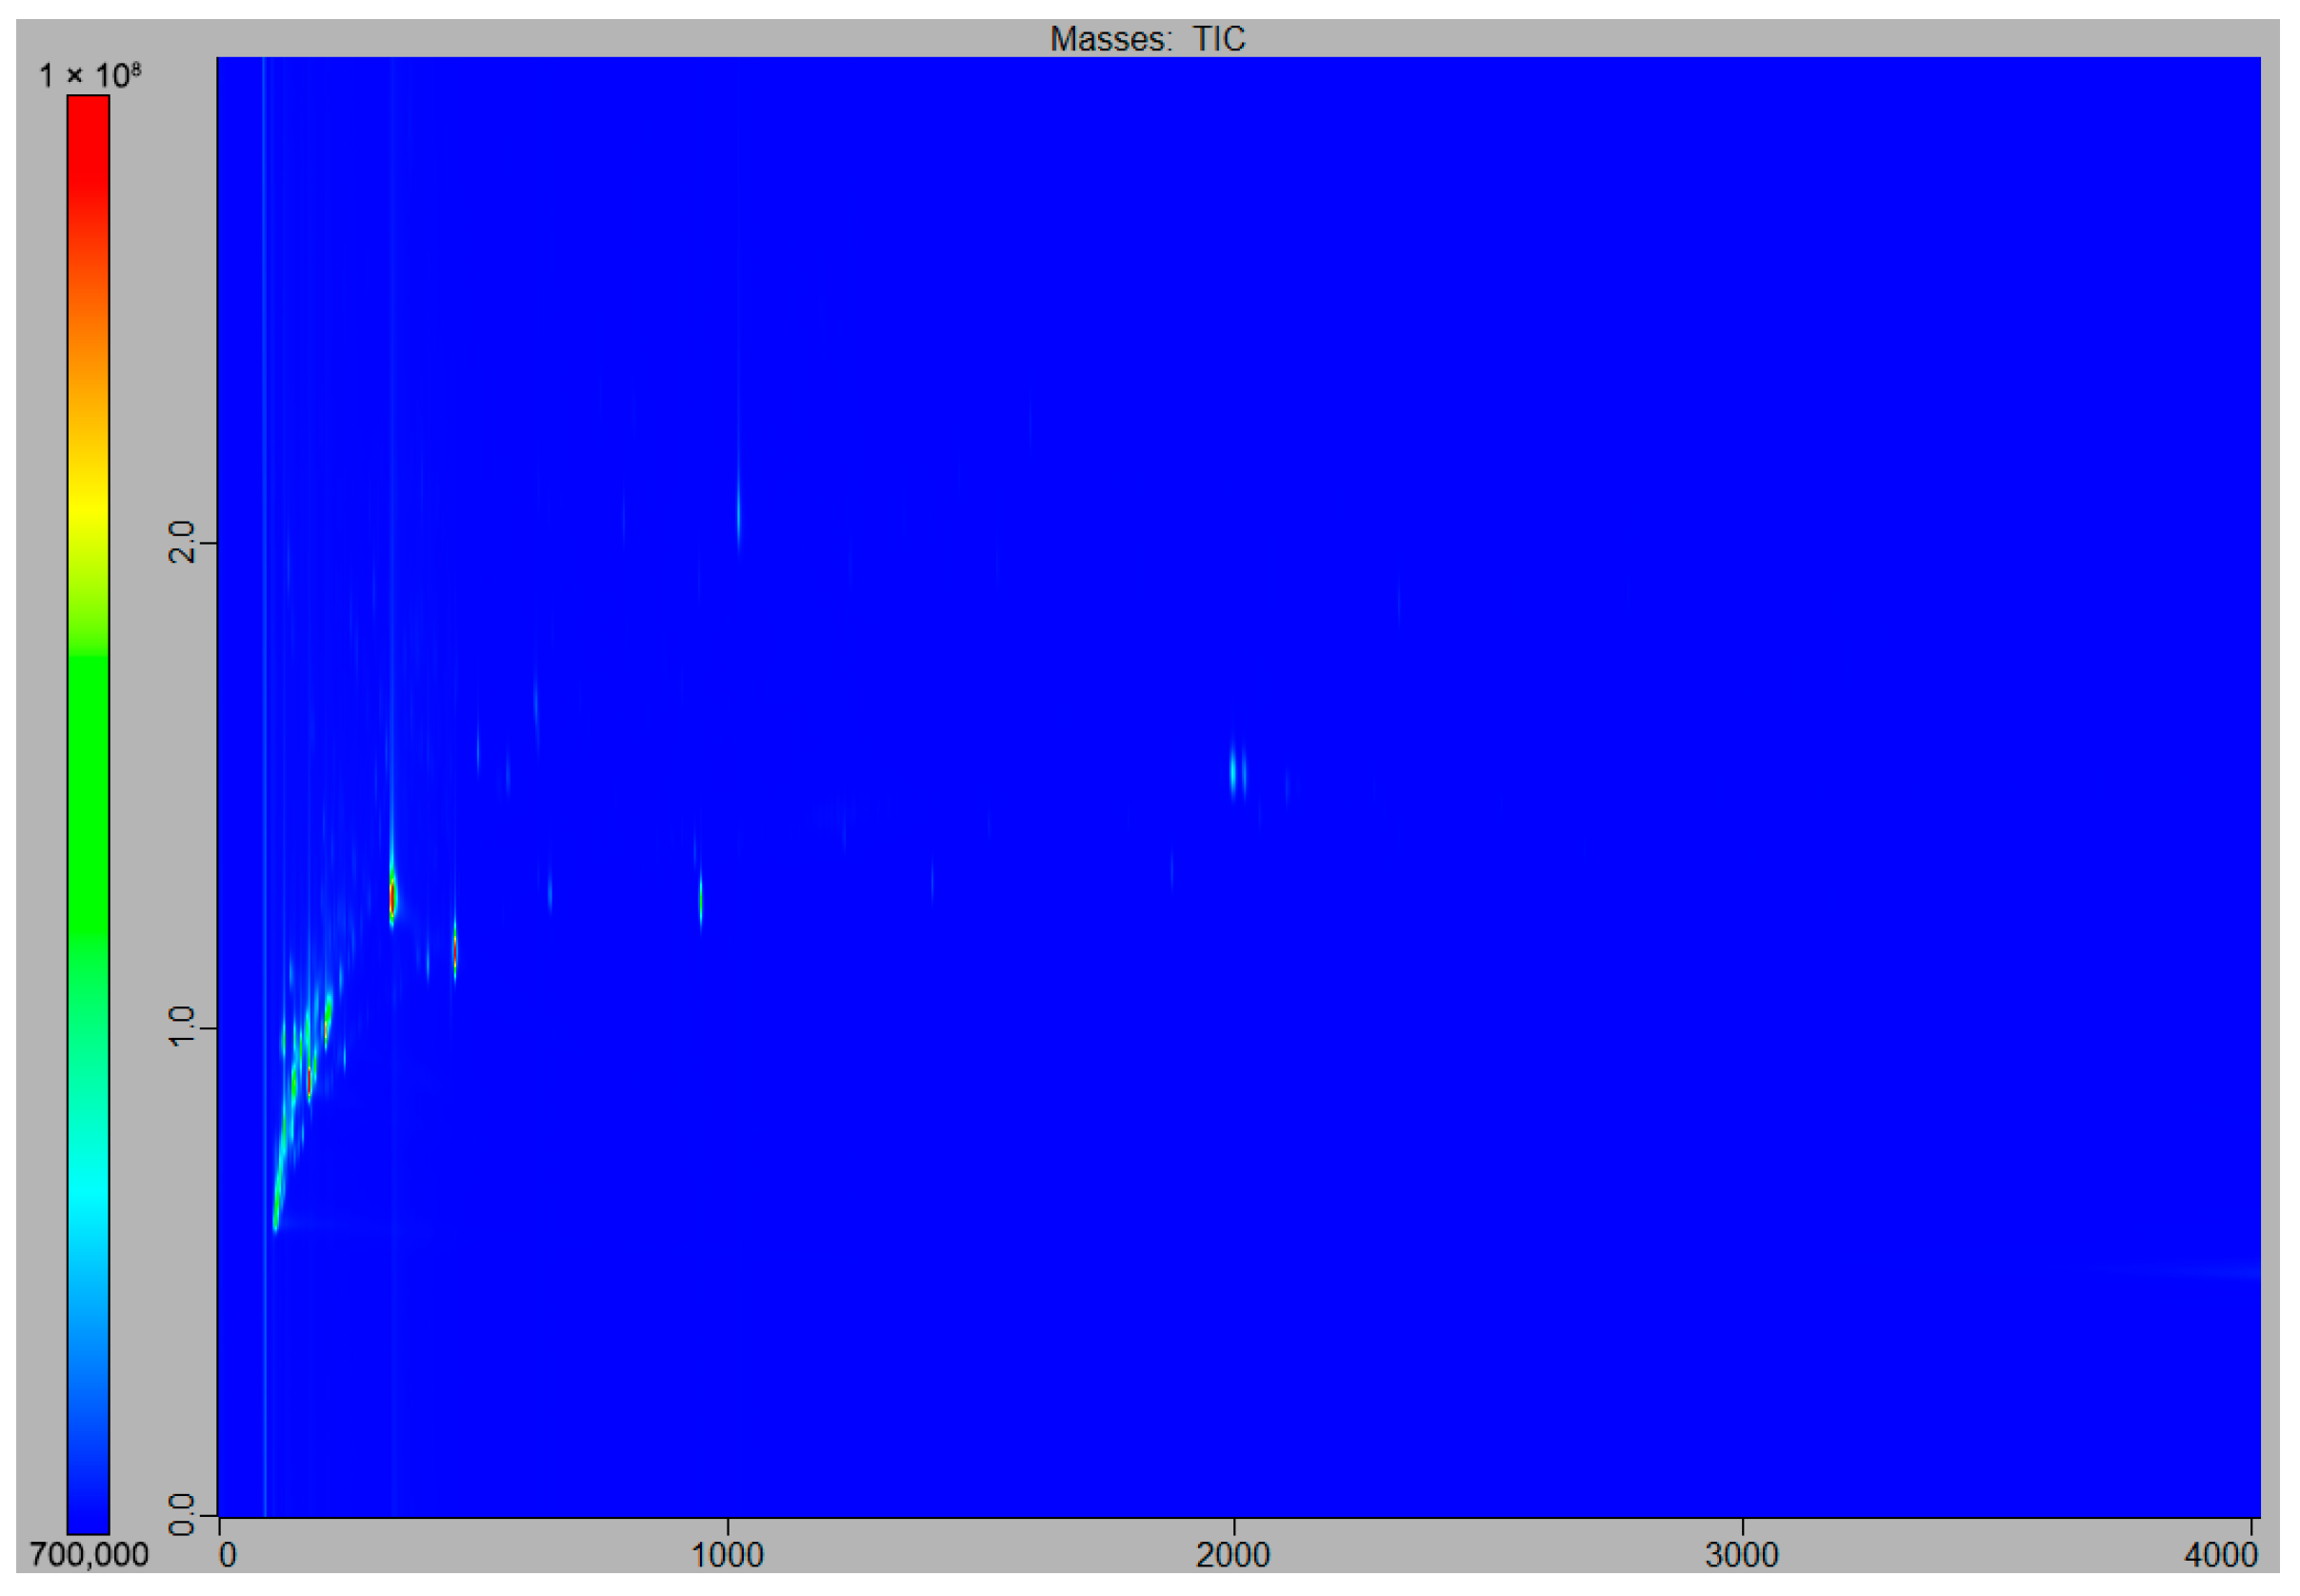
The effectiveness of this process was assessed during the preliminary trials by analyzing a polyurethane (PU) sample before and after the cleaning process. As Figure 1 highlights, the peak intensities have decreased everywhere, but especially in the most intense area of the original chromatogram (the retention times were between 1000 and 3000 s in the first dimension) in applying this cleaning step. The separation strategy, employing a non-polar column in the first dimension and a moderately polar column in the second dimension, segregated molecules into strata based on their polarity. A visual aid for reading this type of 2D contour plot chromatogram is given in Figure S1 (Supplementary Information), which illustrates the position of the main families of compounds recovered in the 2D space. The resulting chromatogram in Figure S1 clearly shows a potential overlay of families in the zone comprised between 1000 and 3000 s in the first dimension, a zone where biomarkers are appearing in the case of probing the volatilome of human odor. Practically, when tracing along the second-dimensional axis, compound families can be found in the following order: hydrocarbons, aromatics, esters, ketones, aldehydes, alcohols, and acids. This allowed us to see that many hydrocarbons and aromatics were frequent contaminants, which were removed during the cleaning process. Thus, this cleaning process was validated and implemented for the study, bringing all samples to an equivalent level of cleaning prior to their analysis.
In a second step, it was important to choose the most suitable method for studying material VOC emissions, as there was a need to simulate the worst possible off-gassing scenario. So, thermodesorption (the method is described in Section 2.2) was compared to a “passive method” described as follows: The passive method tends to simulate a real-case situation where a sorbent phase (PowerSorb®, Action Europe, Sausheim, France) would be used to sample the matrix. Thus, the sorbent phase was put inside a glass jar with the material; the jar of a volume of 1 L was then sealed and left for 1 h in an oven at 40 °C. Then, the sorbent phase was recovered and analyzed by thermodesorption (220 °C, 20 min) to observe which compounds coming from the material would be trapped by the sorbent during an eventual real sampling process. As can be seen from Figure 2, the passive method produced a chromatogram with the same pattern but lower intensity: 2375 peaks and 5 × 10¹¹ for the total sum of areas by thermodesorption and 660 peaks and 8 × 10¹⁰ for the total sum of areas by the passive method. This confirmed and justified the benefit of using thermodesorption to provide a visual and comprehensive representation of material emissions, offering the highest level of recovery in terms of number of peaks and total ionic current value.
Finally, before starting to analyze the materials, blanks of the system were performed in order to evaluate the “blank level” during experiments. Blank level describes the situation that is the closest to the ideal case, as it shows the cleanest possible chromatogram. These blanks were obtained by analyzing clean empty thermodesorption tubes using parameters similar to those for the real samples, as described in Section 2.2, but applying a thermodesorption temperature of 220 °C for 20 min. A representative chromatogram of the blanks obtained under these conditions is shown in Figure 3. The few compounds observed in these analyses can be attributed to the analytical system itself (seals, septum bleed, or methyl silicone column bleed). Moreover, during the rest of the study, blanks were systematically and regularly performed to check and avoid carryover between the samples. If some residual compounds were observed, procedural cleaning steps proposed by the manufacturer were applied to the analytical system: “bake out” for the thermodesorber, consisting mainly of a longer heating and flow period, with flow going directly to the split outlet, and additional blanks. These additional steps might seem trivial, but they ensured reliable results.

3.2. Qualitative Observations

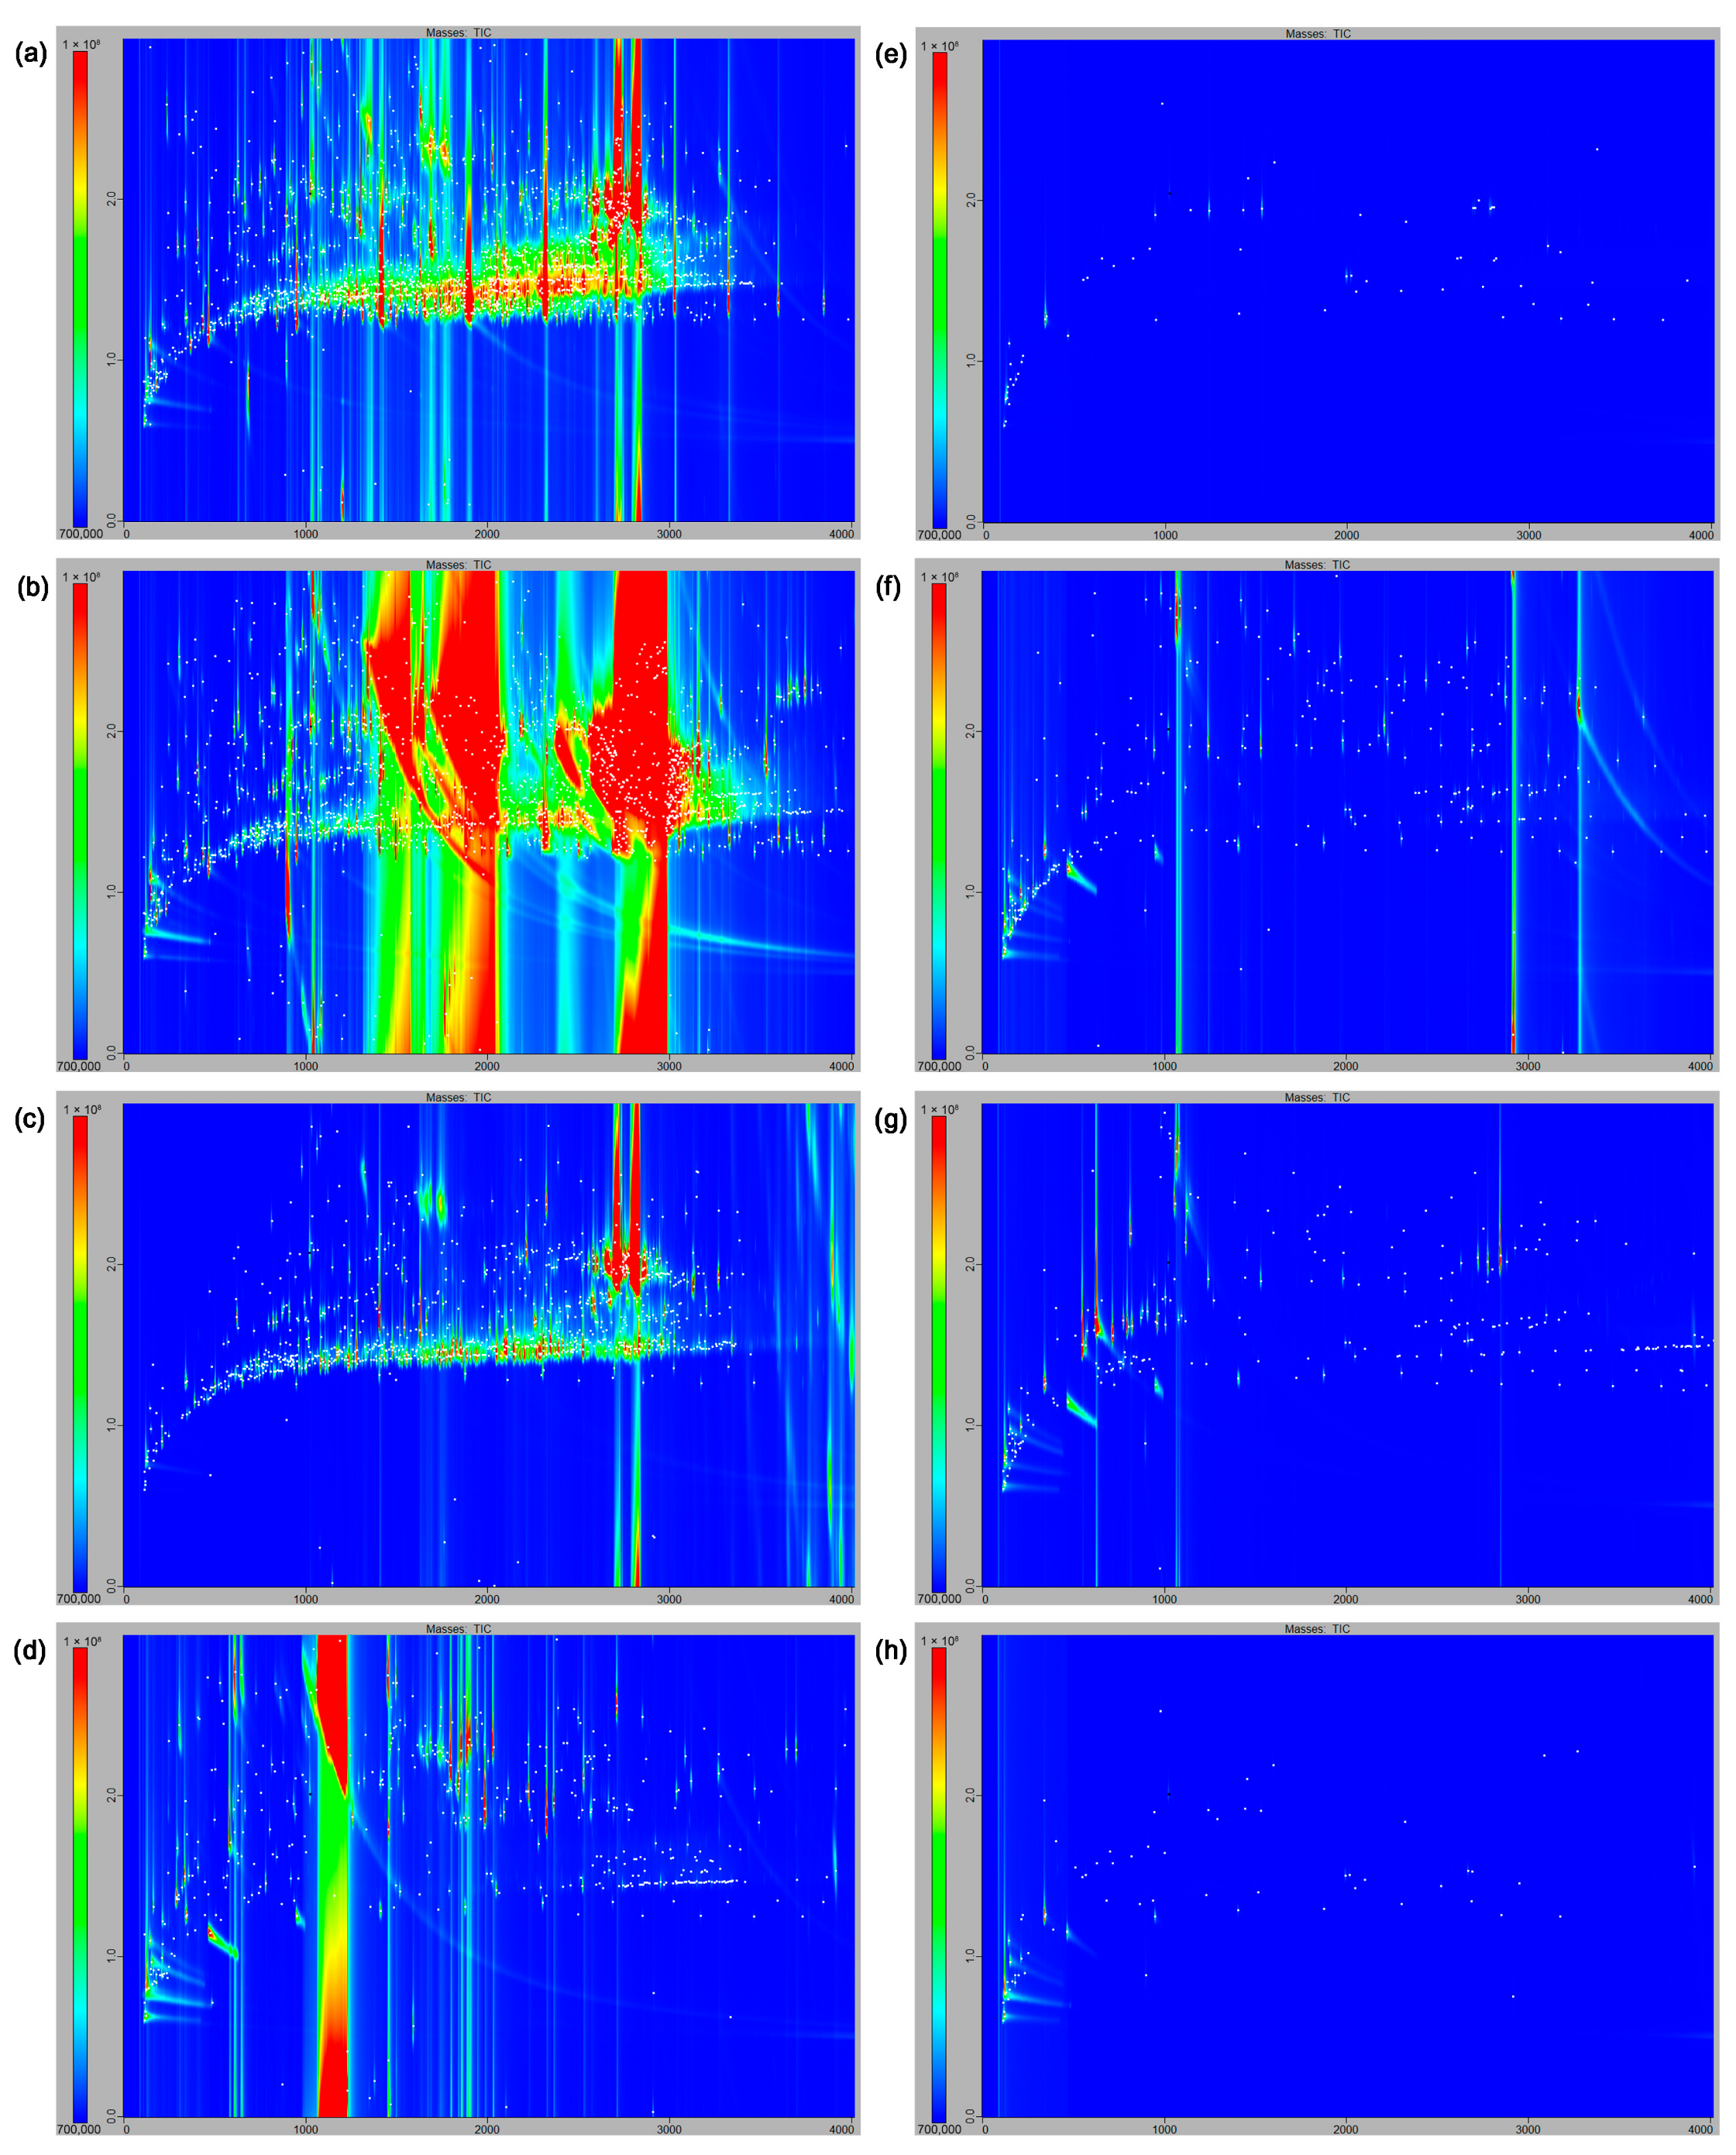
The examination of the 13 raw materials (Table 1) enabled us to discern their volatile compositions and even provided a visual representation of this composition through 2D separation, as described in Section 3.1. Figure 4 shows the obtained contour plot chromatograms for eight materials; put at the same scale, the other five are reported in Figure S2 (Supplementary Information). The eight materials presented were selected as they best represent the variety of chromatograms that were obtained in the course of the present study.
The foremost observation elicited by Figure 4 was the pronounced VOC emissions from certain materials, resulting in chromatograms marked by numerous co-eluting peaks, some of which were even harshly saturated. The main effect of such saturation is likely to be a bias in the identification of trace-level compounds. In particular, saturation can result in deteriorated mass spectra, with adverse m/z fragments potentially being added. This phenomenon was evident in silicone, polyurethane (PU), thermoplastic elastomer (TPE), and photopolymer, corresponding to Figure 4a–d, respectively. For silicone, regarding the second-dimension retention times of the compounds, the chromatogram revealed that the material predominantly released saturated and unsaturated hydrocarbons and aromatics. The PU chromatogram presented a greater complexity in terms of data processing due to the presence of four very concentrated compounds identified as two carboxylic acids, one alcohol, and one aromatic compound toward the end of the chromatogram. This resulted in four prominent spots, potentially preventing other compounds from getting detected. A somewhat similar pattern to silicone emerged in TPE, as shown in Figure 4c, with a distinct line of aliphatic and saturated hydrocarbons and two major concentrated peaks identified as polyaromatics located in the upper right region of the chromatogram. This volatile pattern featuring hydrocarbons and aromatics appeared to be quite common, as a comparable pattern was similarly identified in polyethylene high-density (PEHD), high-modulus polyethylene (HMPE), and biaxially oriented polyethylene terephtalate (BoPET) (Figure S2a,b,e, respectively). In contrast, the acrylic-based photopolymer showed a distinct profile with a predominance of polar compounds. The saturated band between 1100 s and 1200 s (of elution time in the first dimension) in this case corresponded to a compound bearing both ester and alcohol functions, with a conspicuous absence of hydrocarbon or aromatic compounds (Figure 4d). On the contrary, materials such as stainless steel (SS), polyamide 12 (PA), polypropylene/acrylonitrile butadiene (PP/AB), polycarbonate (PC), polytetrafluoroethylene (PTFE), and aluminum manifested considerably fewer peaks in their respective chromatograms, as shown in Figure 4e–h and Figure S2c,d, respectively. In addition, stainless steel (SS), polycarbonate (PC), polytetrafluoroethylene (PTFE), and aluminum displayed similarity between them for the limited number of compounds emitted, and they even equate the result for the blank chromatograms, obtained by analyzing empty stainless steel thermodesorption tubes (see Section 2.2 for the experimental conditions and Section 3.1 for the results).
Notably, PA and PP/AB diverged in their chromatograms (Figure 4f,g), which, although not resembling blank chromatograms, showed in return better-resolved peaks and minimal saturation, even leading to substantial chromatographic voids. Due to the complexity of identifying and determining the origin of compounds related to the blank samples and the fact that these compounds or similar structures are potentially emitted by materials but in varying quantities, the compounds in the blank samples have not been removed from the compound list of the other samples in the following. However, in general, their number and intensity remained insignificant when compared to emissions from all materials that were not at the blank level. The blanks had around 100 peaks and a mean intensity at 3 × 10⁷, while the materials generally had over 500 peaks and a mean intensity of 2 × 10⁸, as illustrated by PU.
For five materials, silicone, PU, TPE, PEHD, HMPE, and BoPET, triplicate analyses were avoided. This decision was based on the high level of measured TVOCs in these samples: TVOC content was 10 times higher in these five materials compared to the others, with many saturated peaks appearing. A repeated analysis of such concentrated samples would have risked contamination of the analytical system, resulting in many carryover effects detrimental to the progress of the study. For high emitters the choice was made to avoid these replicates to preserve the TD (especially the trap). Moreover, considering our objective, these high emitters are de facto disqualified, so it is of little interest to accurately quantify their specific emission levels. In addition, the characteristics listed above have already established a high degree of differentiation of these materials from others, making repetition unnecessary for the characterization of their VOC emissions.

3.3. Semi-Quantification

Semi-quantification was employed to enhance the understanding of the qualitative observations. The comparison of areas with the deuterated toluene TD8 equivalent method was implemented to estimate TVOCs. To ensure the robustness of this semi-quantification, the stability of TD8 throughout the analysis was preliminarily verified and showed a relative standard deviation (RSD) of 18% for its area over 23 analyses, which was considered satisfactory for thermodesorption experiments and without noticeable consequences for the evaluation of raw materials quality in view of the body volatilome sampling. Consequently, Table 2 presents the estimated TVOC concentration (micrograms of TVOCs per gram of material) for each material investigated following this procedure and the corresponding total number of detected peaks. However, it should be noted that in the presence of saturation for certain compounds, TVOC concentration may be underestimated.
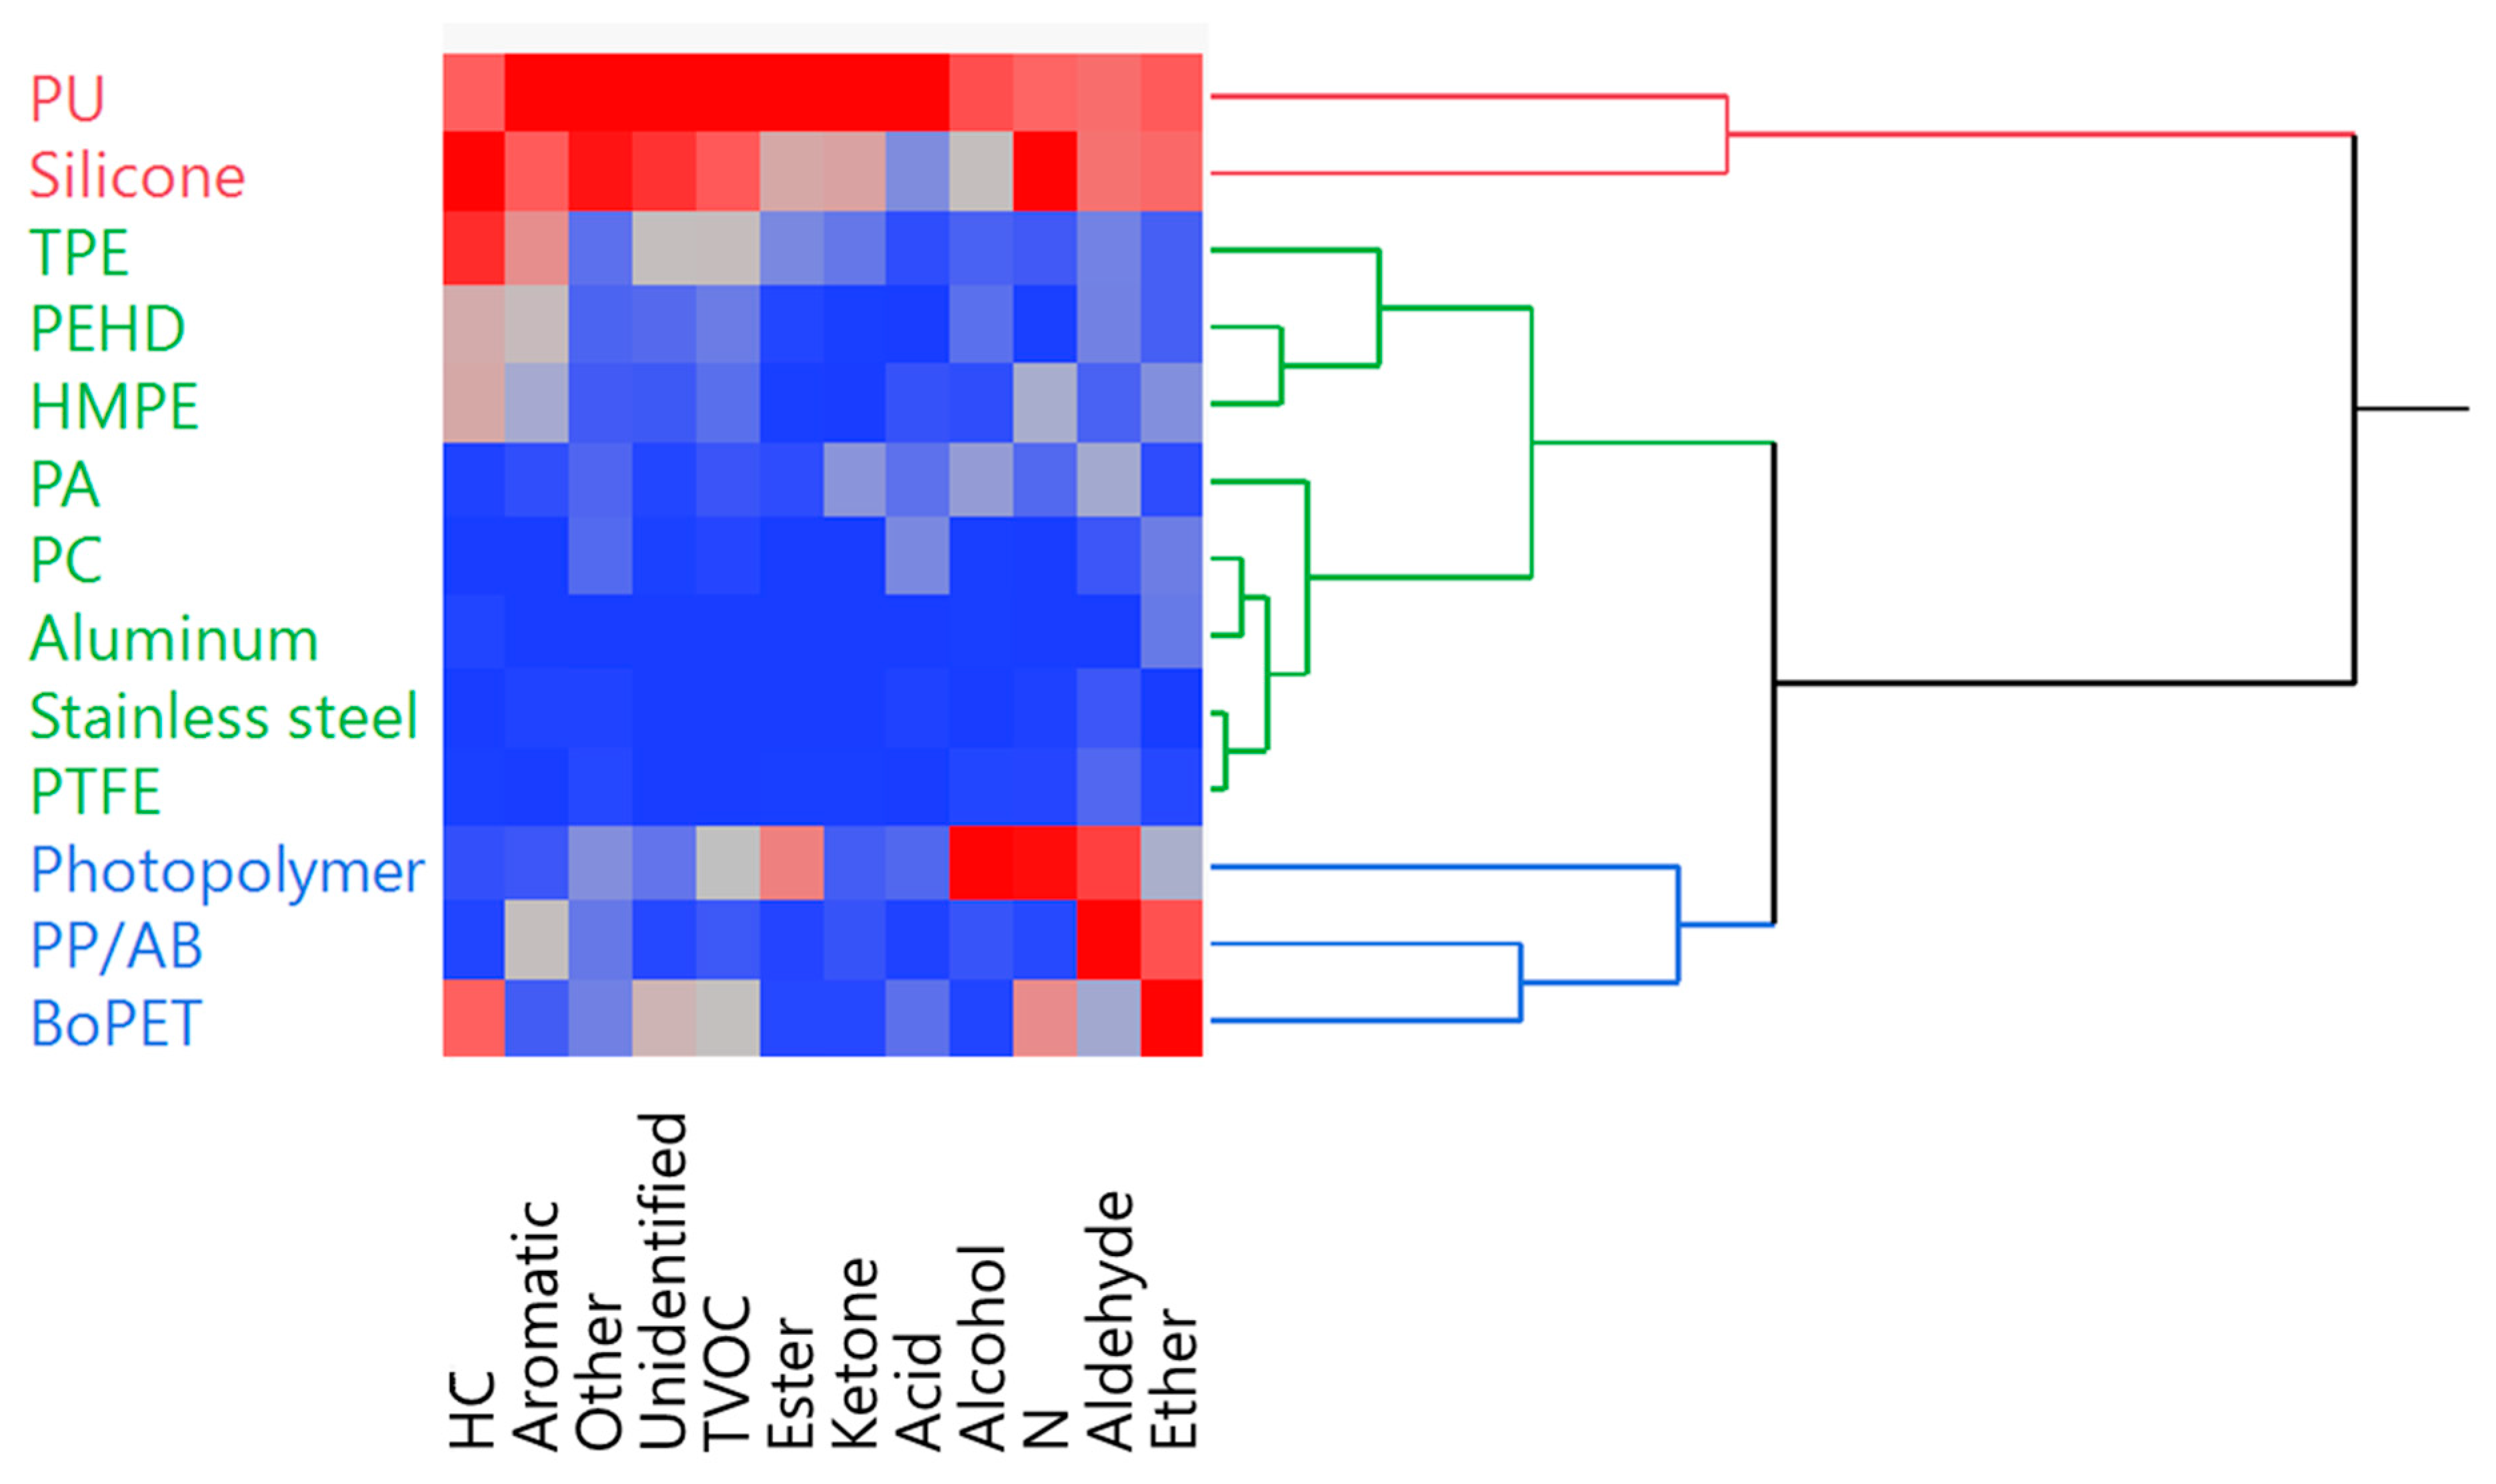
Unsurprisingly, the metallic materials, such as stainless steel (SS) and aluminum, exhibited a minimal number of detected peaks and low TVOC concentrations: around 100 peaks, akin to blank samples, and a maximum concentration of 0.004–0.01 µg·g−1. A similar outcome was observed for the polymeric material polycarbonate (PC), where the total number of peaks aligned with the blank values. In contrast, polyurethane (PU) and silicone demonstrated starkly different outcomes, with a peak count exceeding 1500. In general, the measured TVOC concentrations ranged from approximately 0.01 µg·g−1 to 10 µg·g−1. In order to highlight these similarities and differences among the polymeric materials, we used hierarchical clustering to exhibit groups of materials having similar emission levels. The obtained dendrograms and the corresponding heat map are shown in Figure 5. We chose to consider three groups, which we named according to their emission level: “low emitters” (LE) for SS, PTFE, PC, aluminum, PA, HMPE, PEHD, and TPE, with TVOC concentrations below 0.9 µg·g−1 and fewer than 700 peaks on their respective chromatograms; “medium emitters” (ME) comprising PP/AB, BoPET, and photopolymer, with TVOC concentrations ranging from 0.2 to 3 µg·g−1 and less than 1200 peaks on their respective chromatograms; and finally, the “high emitters” (HE), such as PU and silicone, with TVOC concentrations above 5 µg·g−1 and over 1200 peaks on their chromatograms. Within this latter group of “high emitters,” some were suspected of exceeding certain guidelines. For instance, considering that the US Food and Drug Administration (FDA) recommends a range of 1.1 to 5.0 μg per canister [9], PU would exceed this limit with its TVOC concentration of 9.8 µg·g−1 of material mass. It is important to note, however, that this guideline was established per leachable product, prompting an exploration of how individual VOCs contribute to TVOCs.

3.4. Major Compound Contributions to TVOC Concentration

To delve into the contribution of compounds to the TVOC concentration, Table 2 also displays the individual minimum and maximum concentrations observed across the 13 materials. The minimum concentrations ranged from 2.4 × 10⁻⁶ μg·g−1 in PTFE to ca. 40 × 10−6 μg·g−1 in aluminum. Notably, the compounds found at the lowest concentration were predominantly unidentified. On the other hand, the maximum individual concentrations varied from 3.5 ng·g−1 in PTFE (for a highly volatile alcohol, also found in blanks) to 0.56 µg·g−1 in photopolymer (for 2-hydroxypropyl methacrylate, not found in blanks). This observation highlighted a significant point: for photopolymer and PU, the maximum concentrations were around 0.5 µg·g−1, whereas for a material like BoPET, which fell within a similar TVOC concentration range, the maximum individual concentration was merely 37 ng·g−1. Thus, in the case of photopolymer and PU, the TVOC concentration could be attributed to the presence of major compounds, while for BoPET, silicone, and TPE, the concentration lies more in the high number of trace compounds (Table 2). Indeed, for silicone, 1027 compounds were found at concentrations between 0.1 µg·g−1 and 1.5 × 10⁻⁵ µg·g−1. For the photopolymer, as stated above, the primary compound was identified as 2-hydroxypropyl methacrylate (2-HPMA). The matching score with the NIST library was relatively low at 646, likely due to the signal’s saturation. Another notable point is that 2-HPMA does not produce many m/z peaks in its mass spectrum, namely m/z 41, 69, and 100. The data acquisition range of 45–300 u prevents the m/z 41 peak fragment from being detected in the mass spectrum, which could be another reason for the low match score. Nevertheless, its presence was not suspected, as 2-HPMA finds application in the fabrication of UV-curable photopolymers. Its role lies in viscosity reduction, which consequently enhances the conversion process [24]. For PU, the assignment was also disturbed by the saturation, but extracting mass spectra at the beginning of the peak, where the saturation was weaker, 2-ethylhexanoic acid was assigned with an increased match score of about 900. Despite the uncertainty in attribution due to peak saturation, which illustrates the challenges faced when dealing with very loaded 2D chromatograms, this result seemed consistent, as 2-ethylhexanoic acid was identified as one of the main problematic VOCs emitted by PU in previous studies as early as 1988 [25]. Moreover, in accordance with the unsurprising presence of this compound, a patent even reports the synthesis of polyurethane foam using a catalyst composition consisting of a tertiary amine and 2-ethylhexanoic acid [30].

3.5. Spot Assignment in Correlation with Raw Materials

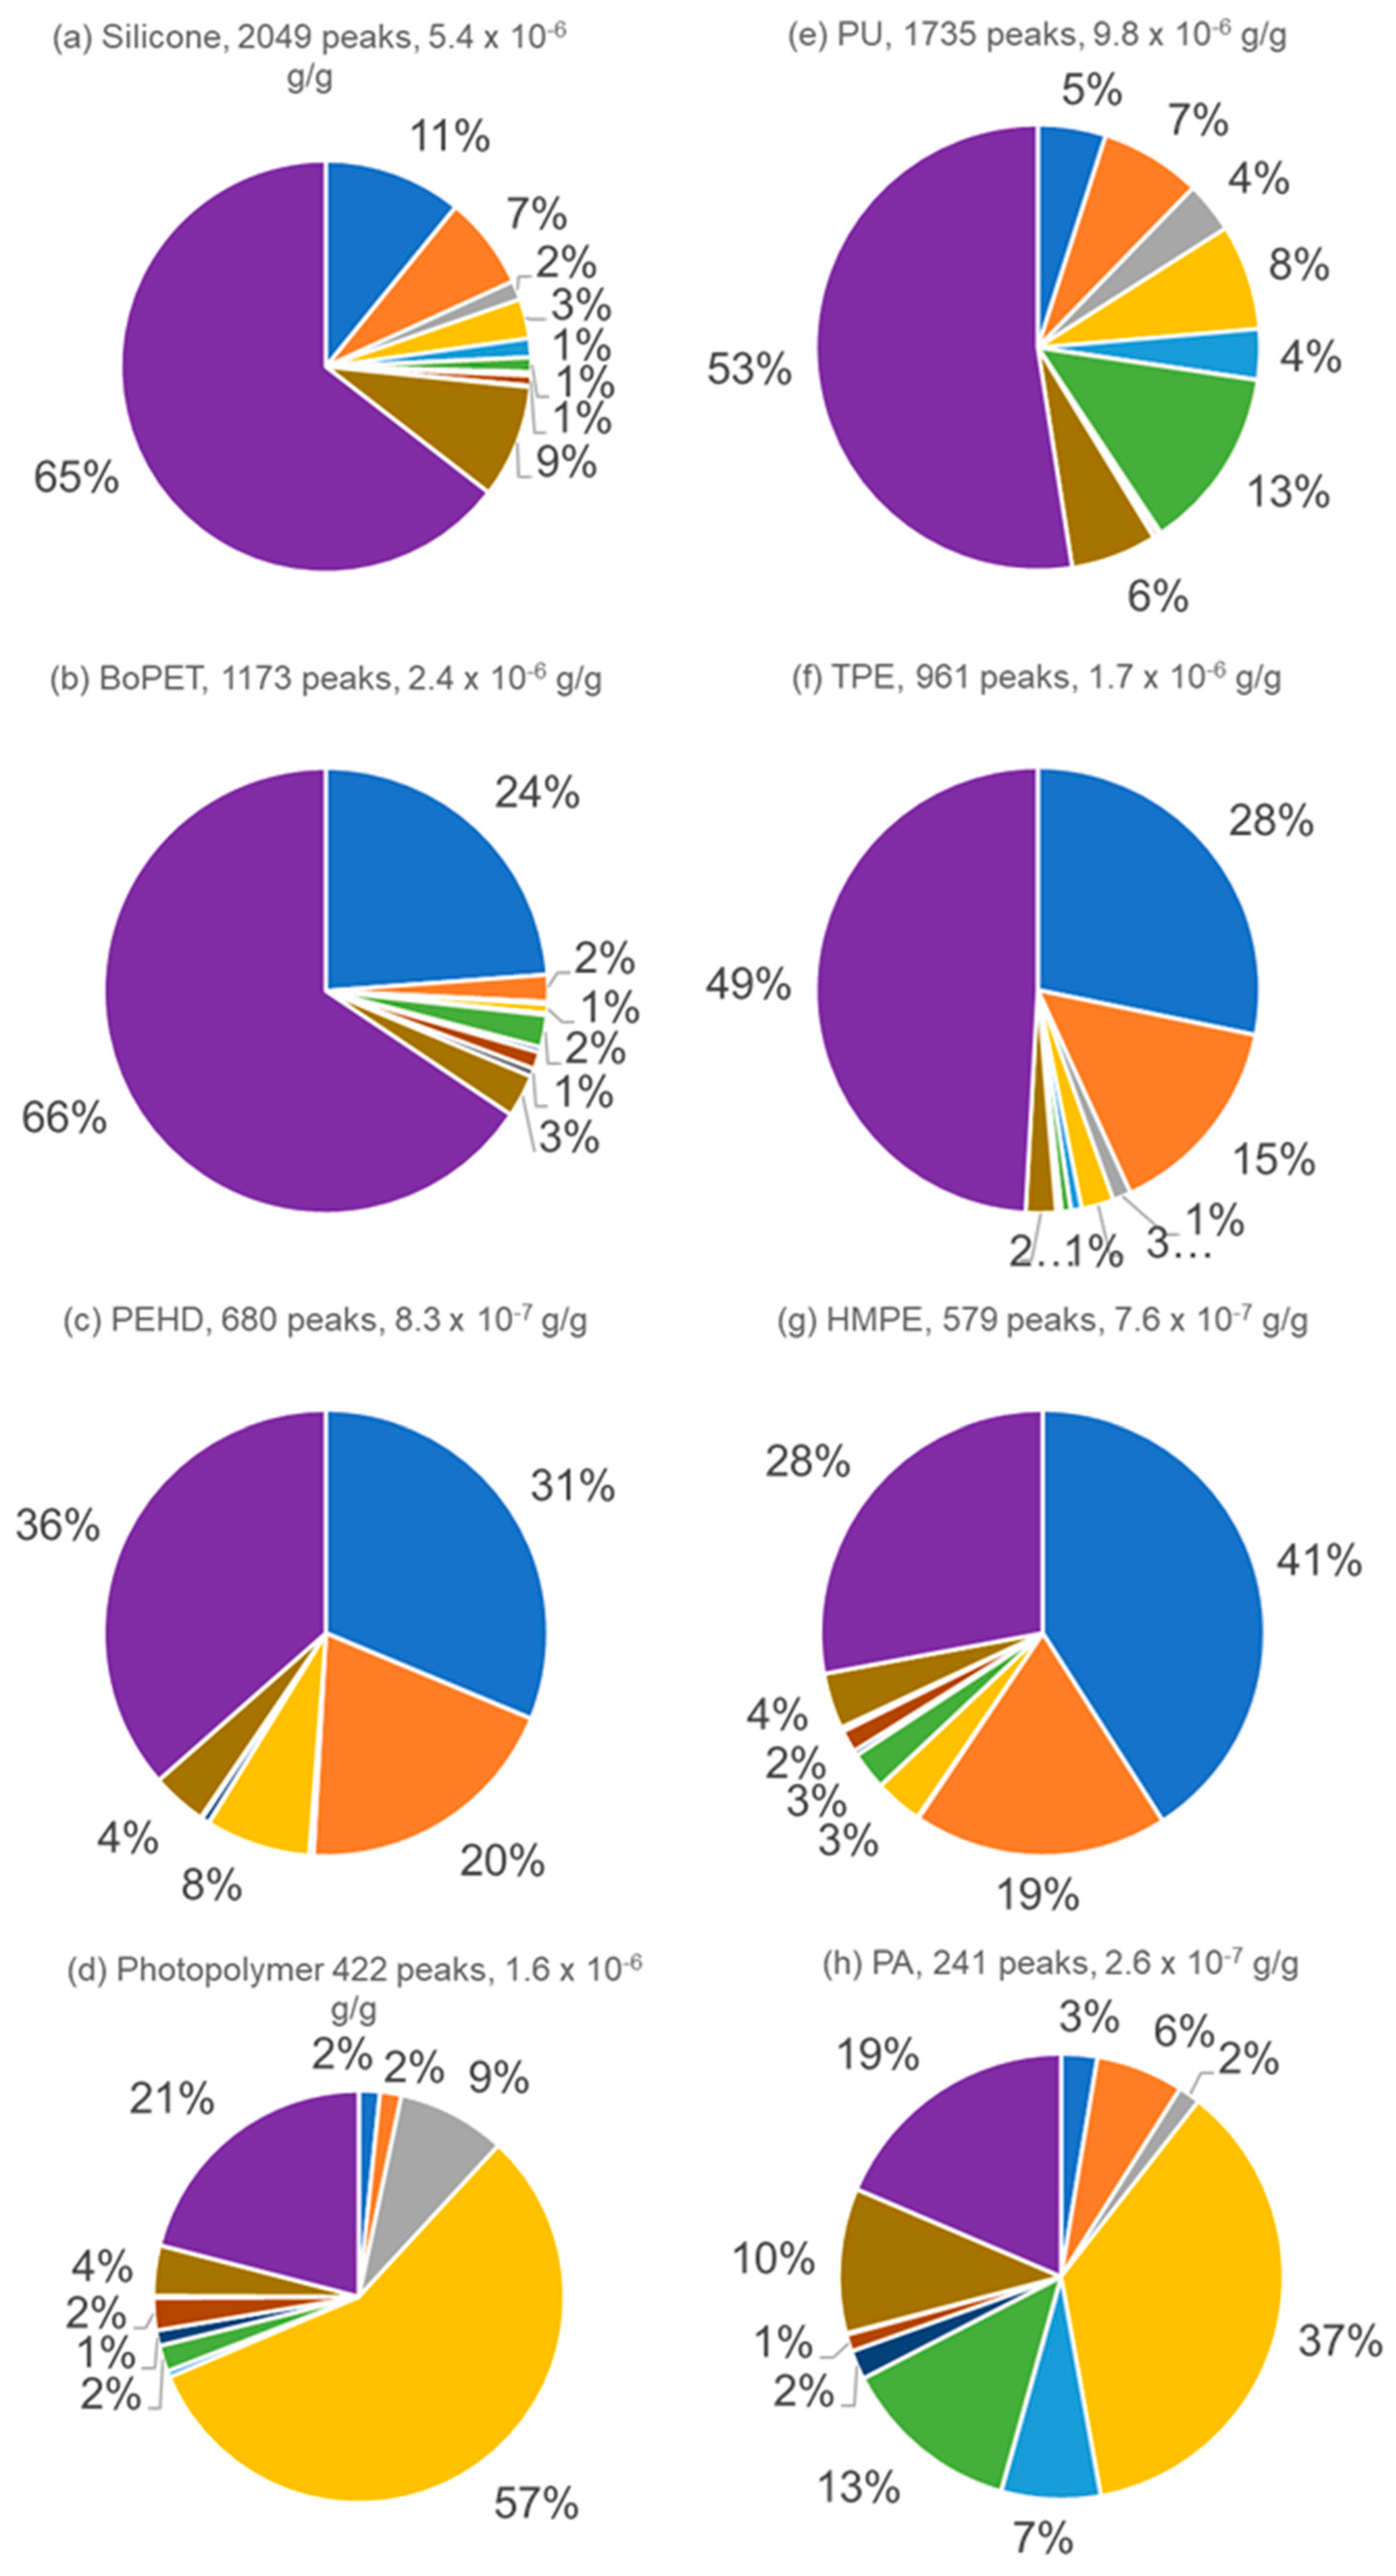
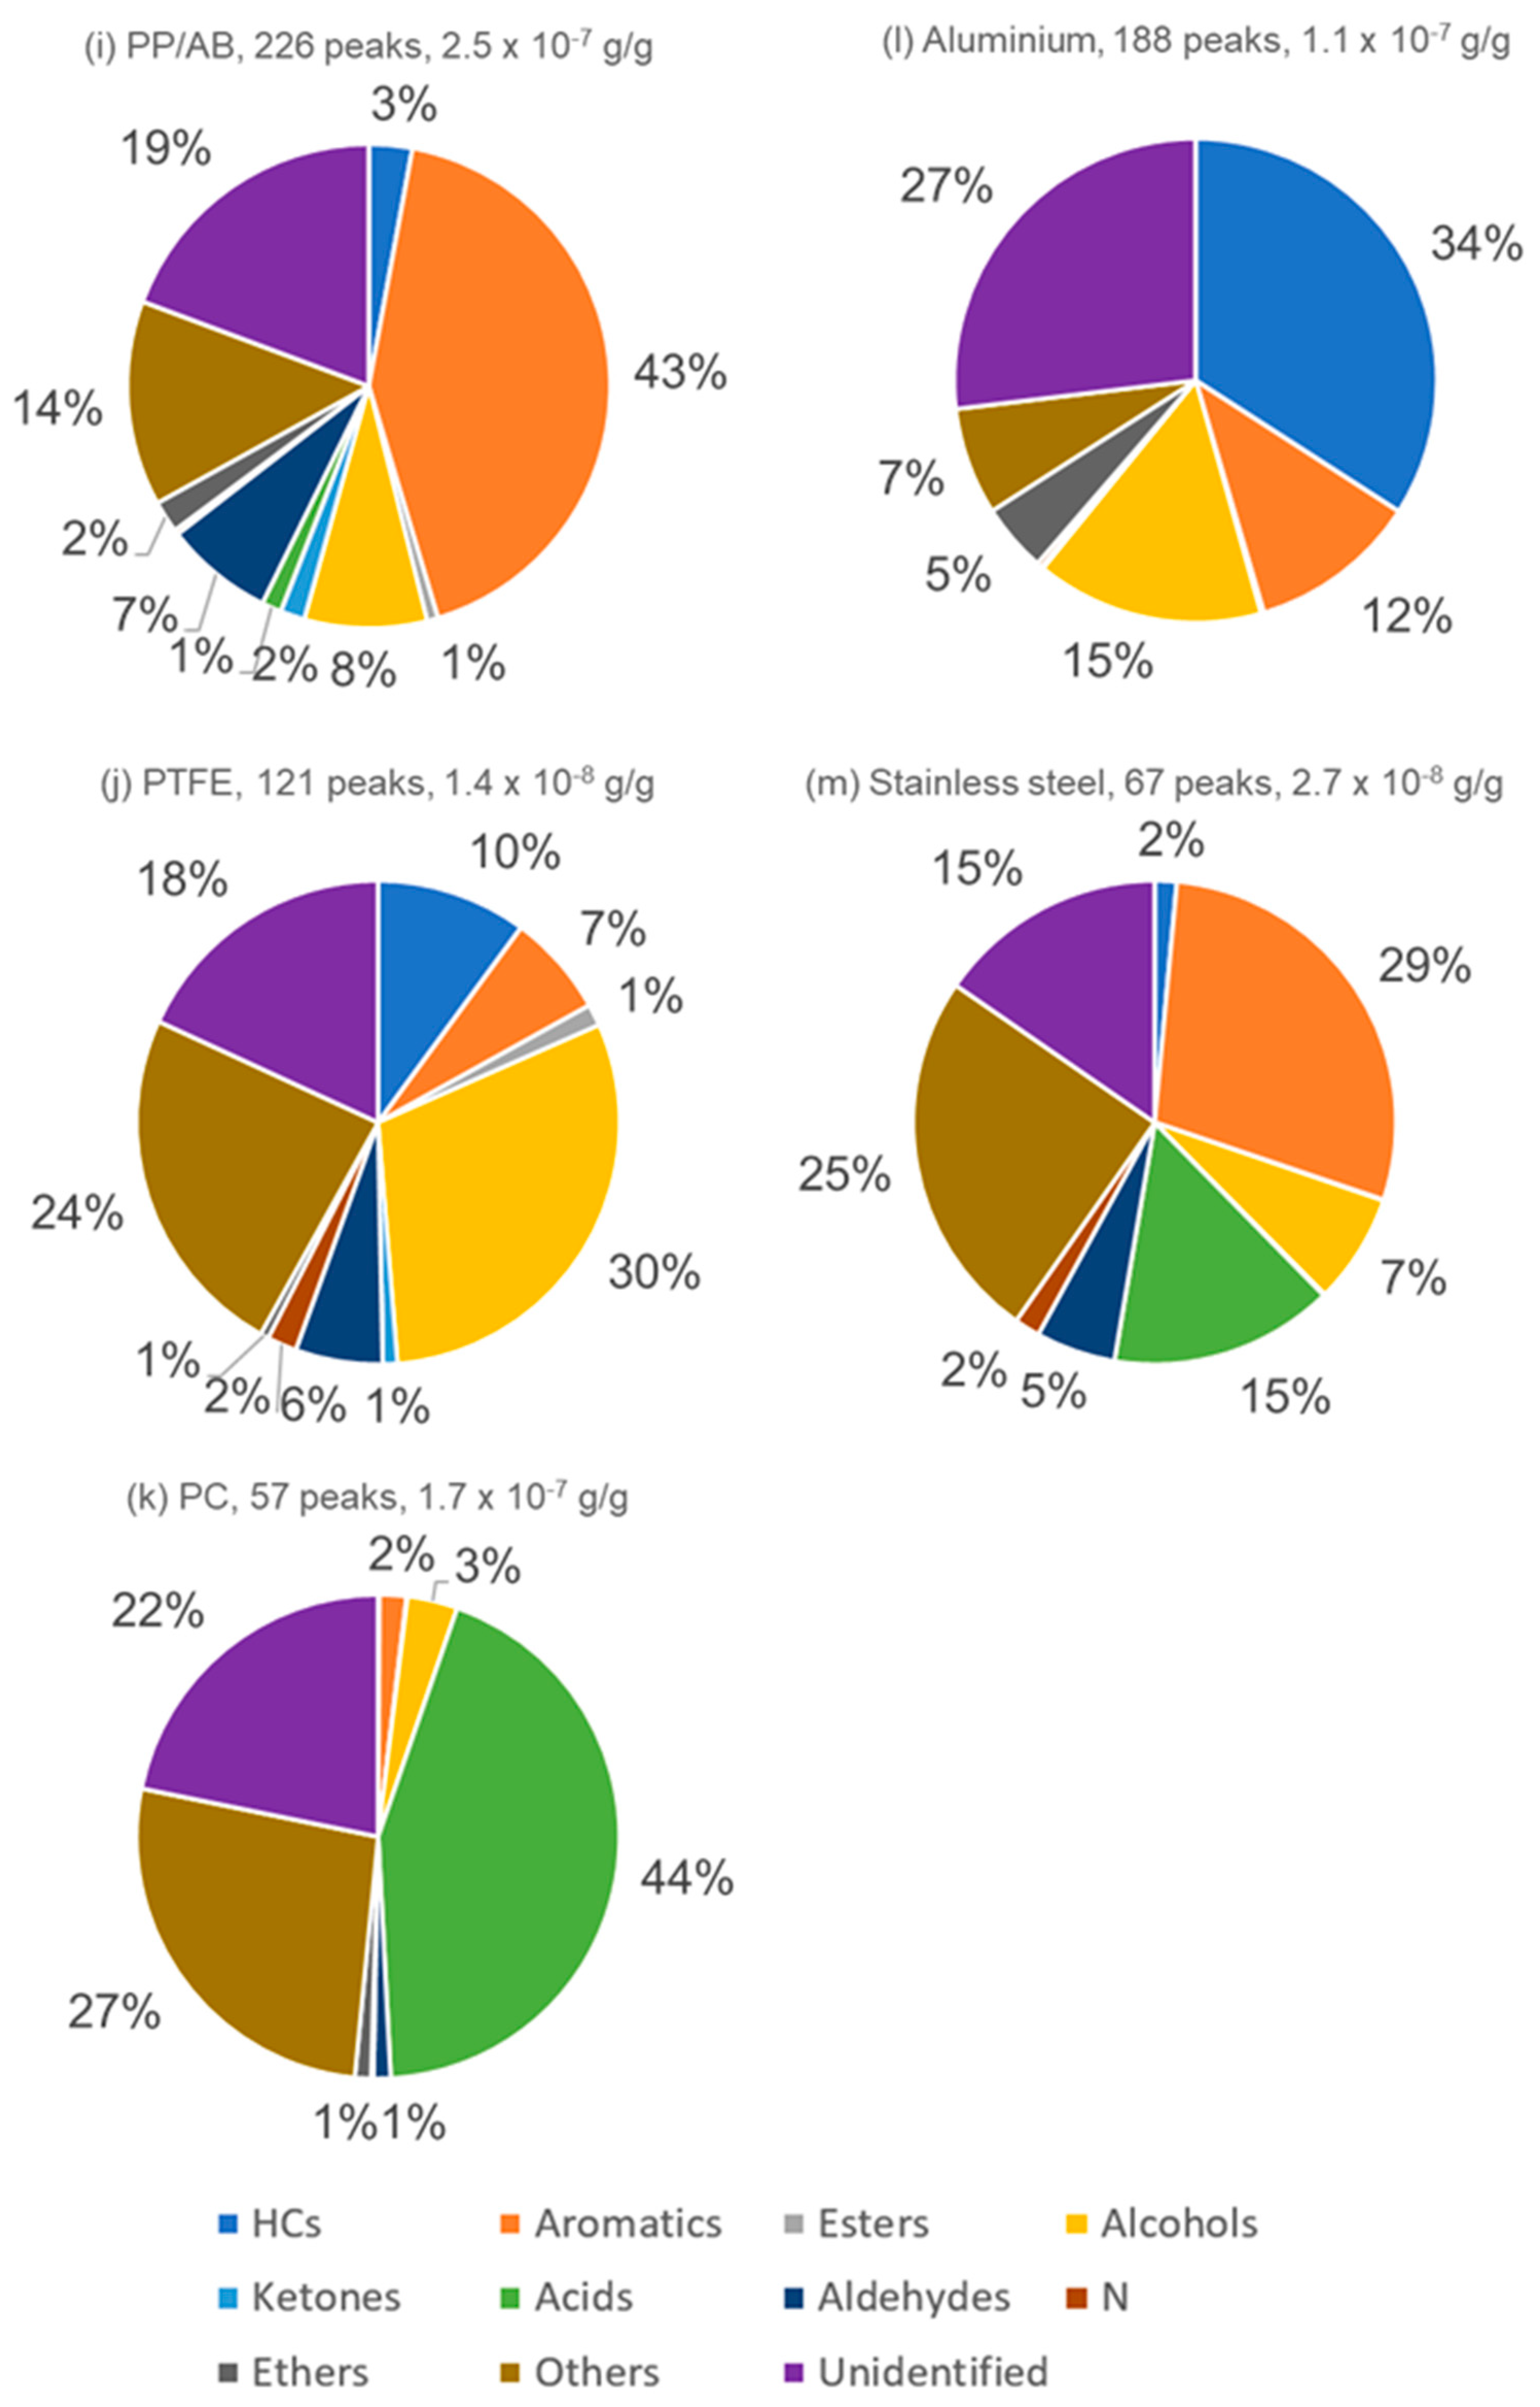
To better understand the differences between the 13 materials studied, the distribution of compounds across different chemical families (based on peak areas) was evaluated. Figure 6 shows these distributions for the families of VOCs detected during the analyses as stated above (Section 2.4): hydrocarbons (HCs), aromatics, esters, alcohols, ketones, acids, aldehydes, nitrogenated compounds (N), ethers, other compounds (not represented by one of the previous functionalities and including siloxanes), and unidentified compounds. The first noticeable aspect upon examining these distributions was the significant occurrence of a large part of compounds classified as “unidentified” in the materials, with over 600 detected peaks in the chromatograms. This phenomenon could be attributed to the emission of numerous VOCs by the materials. Indeed, despite the high peak capacity of GC×GC, densely populated chromatograms can still contain instances of co-elution, making structure elucidation difficult. Nevertheless, their emissions exist and cannot be neglected; consequently, the corresponding VOCs are sometimes present in the chromatograms as major components.
Additionally, co-elutions and saturations primarily resulted in the recording of mass spectra with a high level of noise. During the treatment of data, mass spectra were typically obtained after the elimination of background noise (i.e., by subtracting the background signal on each side of each peak of interest). However, when this noise corresponded to a neighboring peak or a saturated peak that “contaminated” a significant chromatographic area, bearing a resembling mass spectrum, the resultant spectrum essentially translated to noise. This outcome required a time-consuming manual data processing step for operators (approximately 3 days per chromatogram) [31], without eliminating the risk of errors. Moreover, for specific analytical purposes focusing on trace compounds, employing materials presenting high levels of emission should automatically be dismissed due to their VOC emissions overshadowing the target analytes expected from body odor sampling. Furthermore, the utilization of a low split ratio or even splitless analytical injections for trace analyses is commonplace in GC experiments to enhance the response of minor compounds. In these instances, saturated compounds introduced by those HE materials could potentially infiltrate the entire analytical system, causing detrimental contamination during the chain of analysis.
For chromatograms featuring a limited number of peaks (less than 600), only 20% of those contaminating compounds remained usually unidentified. However, in the peak distribution of materials like polycarbonate (PC), stainless steel (SS), or polytetrafluoroethylene (PTFE), a substantial number belonged to the “other compounds” category. Within this category, a majority of compounds can be silane-based compounds stemming from column bleeding or fluorinated compounds originating from seals of the thermodesorber, components also found in blank samples. This observation underscored that, concerning VOC emissions, materials like PC, SS, PTFE, and aluminum tended to approach blank levels.
From a general point of view, assignment of the observed compounds after a TD-GC×GC/MS analysis relates quite well with the expected composition of the investigated polymers or the expected presence of chemicals used in their synthesis. The crucial insights gained from observing these distributions of compounds relate to the dominant chemical families associated with each material. In the cases of BoPET, TPE, PEHD, and HMPE, the majority of compounds identified were hydrocarbons. This observation is consistent with previous reports that identified hydrocarbons as a prevalent type of volatile organic compound (VOC) emitted by polymeric materials [5,27]. Conversely, in the case of polyamide 12 (PA), the primary compounds were largely affiliated with the alcohol family. This conclusion was supported by the presence of its most prominent compound, 2-hydroxypropyl methacrylate (2-HMPA, similarity = 894), which was also present in the photopolymer samples. Additionally, a significant peak corresponding to the macrocyclic lactam, laurolactam (similarity = 916), was intensely visible. This compound was recognized for its role in the synthesis of polyamides through ring-opening [32].
Among the distinct compounds identifiable on the chromatogram of PA, certain noteworthy substances have emerged: p-benzoquinone (similarity score = 916), reported previously as a reagent in polyamide synthesis [32]; nonanoic acid (similarity score = 908), historically involved in the development of Nylon precursors [33]; and 1-benzoylcyclohexanol (similarity score = 919), also known as the non-yellowing photoinitiator Irgacure® 184 [34]. Additionally, compounds previously reported during investigations on emitted VOCs by polymers employed in car manufacturing [7], such as the di-tert-butylated hydroxytoluene (BHT)—a common antioxidant—were found in PA emissions, with higher concentrations in PU, silicone, TPE, photopolymer, and BoPET emissions. Obviously, this example confirms that a wide variety of compounds originating from or involved in the initial polymer synthesis can be detected in the emissions from the final material.
Regarding polypropylene/acrylonitrile butadiene (PP/AB), the predominant chemical family corresponded to aromatic compounds. This finding was logically explained by the identification of styrene (similarity score = 928) as the third most abundant compound in the emissions of this material. This observation raised questions about the labeling of the PP/AB by the material supplier, since it appeared more in line with PP/ABS, where ABS denotes acrylonitrile butadiene styrene, a widely used thermoplastic polymer. Another notable compound found in PP/AB emissions was ethylbenzene (similarity score = 940), a precursor for styrene synthesis [35]. This particular compound has been previously identified as a VOC emitted by polypropylene (PP) [10], alongside toluene. Interestingly, several other aromatic compounds were detected, although they were not previously associated with PP emissions. Further examples include trans-1,2-diphenylcyclobutane, 1-ethyl-4-methyl-benzene, and propyl benzene.
One must conceal here that, even if this exceeds the scope of the present study, the ability to identify the compounds emitted by raw materials could lead to a number of benefits. If such identification enables the establishment of a correlation between polymer composition and the presence of their specific expected compounds derived from the polymer backbone, this could also facilitate the further characterization of raw materials in terms of quality control, compliance, and toxicity risk assessment.

4. Conclusions

The selected analytical technique, TD-GC×GC/ToFMS, appeared to be especially well adapted to identify and characterize semi-quantitatively VOC emissions from materials. This work highlighted the intricate nature of the VOC emissions from 13 materials, emphasizing the substantial contribution of GC×GC/MS in understanding this complexity. It underscored the significance of examining these emissions individually, using thermodesorption directly on a piece of the raw material. This approach was crucial in mitigating the impact of potential external factors that could cause contamination during the analysis of real samples employing TD-GC×GC/MS. Such a material assessment was pivotal for the advancement of our primary objective: the development of a body odor sampling system with its own emissions as low as possible for the analysis of target analytes present in trace amounts.
While the objective of determining the VOC emissions of different materials was relevant to our application, it was noteworthy that materials like silicone, polyurethane, polyethylene terephtahalate, thermoplastic elastomer, polyethylene, and photopolymer were not advisable since around 1000 peaks were detected per chromatogram, and TVOC concentrations up to almost 10 µg·g−1 were estimated from these polymers. On the other hand, materials like polytetrafluoroethylene, stainless steel, or aluminum can be recommended (because around <100 to <200 peaks were detected per chromatogram with TVOC concentrations below 0.1 µg·g−1). It is essential to acknowledge that specific requirements on emissions can vary significantly based on the ultimate application. In our case, the level of requirement (maximum VOC concentrations below 0.01 μg·g−1), although extremely binding, is mandatory; otherwise, analytes of interest can be confounded or hidden during the analysis [24]. Hence, the intention here was not to pass judgment on these materials but rather to furnish essential insights into diverse queries concerning emitted compounds and their concentrations. This was particularly relevant due to the widespread interest in the VOCs examination theme across multiple domains. Nevertheless, the very high TVOC emissions of polyurethane and silicone may raise concerns about their use, particularly in health-related applications.
Finally, these results and the analytical method used suggest a potential for characterizing unknown materials, studying their aging, or selecting them wisely for their intended application. Lastly, this methodology could provide a foundation for a more detailed and precise evaluation of volatile organic compound (VOC) emissions in sectors such as food and pharmaceutical packaging, agrochemistry, indoor air quality control, forensic science analysis, and the construction industry.

Supplementary Materials

The following supporting information can be downloaded at https://www.mdpi.com/article/10.3390/separations12090250/s1, Figure S1: Simplified visual aid to help reading a typical TD-GC×GC/ToFMS contour plot chromatogram; Figure S2: TD-GC×GC/ToFMS contour plot chromatograms of raw materials (a) PEHD, (b) HMPE, (c) PTFE, (d) aluminum, and (e) BoPET.

Author Contributions

Conceptualization, E.B. and D.T.; methodology, E.B., J.D., J.V. and D.T.; validation, J.V.; resources, J.V. and D.T.; data curation, E.B. and M.S.; writing—original draft preparation, E.B.; writing—review and editing, E.B., N.M., J.D., J.V., D.T. and M.S.; supervision, N.M., J.V. and D.T.; project administration, N.M. and J.V.; funding acquisition, N.M. All authors have read and agreed to the published version of the manuscript.

Funding

This research was funded by the ANRT (Association Nationale de la Recherche et de la Technologie), PhD grant (“Bourse Cifre”) #2021/0838. Research reported in this publication was supported by SenseBioTek Health-Care.

Data Availability Statement

The raw data supporting the conclusions of this article will be made available by the authors on request.

Acknowledgments

We would like to celebrate the memory of Isabelle Rivals, who has sadly passed away recently, but whose critical eye on the data and editing of the text contributed greatly to the work presented in this article.

Conflicts of Interest

Author Elsa Boudard and Nabil Moumane were employed by the SenseBioTek Health-Care, 21 Grande rue, 78240 Aigremont, France. The remaining authors declare that the research was conducted in the absence of any commercial or financial relationships that could be construed as a potential conflict of interest.

References

  1. Kumar, P.; Singh, A.B.; Arora, T.; Singh, S.; Singh, R. Critical Review on Emerging Health Effects Associated with the Indoor Air Quality and Its Sustainable Management. Sci. Total Environ. 2023, 872, 162163. [Google Scholar] [CrossRef] [PubMed]
  2. Caron, F.; Guichard, R.; Robert, L.; Verriele, M.; Thevenet, F. Behaviour of Individual VOCs in Indoor Environments: How Ventilation Affects Emission from Materials. Atmos. Environ. 2020, 243, 117713. [Google Scholar] [CrossRef]
  3. Yu, C.; Crump, D. A Review of the Emission of VOCs from Polymeric Materials Used in Buildings. Build. Environ. 1998, 33, 357–374. [Google Scholar] [CrossRef]
  4. Houston, C.T.; Rodrigues, A.D.; Smith, B.B.; Wang, T.; Richardson, M. Principles for Management of Extractables and Leachables in Ophthalmic Drug Products. PDA J. Pharm. Sci. Technol. 2022, 76, 278–294. [Google Scholar] [CrossRef]
  5. Yoshida, T.; Matsunaga, I. A Case Study on Identification of Airborne Organic Compounds and Time Courses of Their Concentrations in the Cabin of a New Car for Private Use. Environ. Int. 2006, 32, 58–79. [Google Scholar] [CrossRef]
  6. ISO 16000-6:2021(Fr); Air Intérieur—Partie 6: Dosage Des Composés Organiques (COTV, COV, COSV) Dans l’air Intérieur et l’air de Chambre d’essai Par Prélèvement Actif Sur Tubes à Sorbant, Désorption Thermique et Chromatographie En Phase Gazeuse Avec Détection MS Ou MS-FID. ISO: Geneva, Switzerland, 2021. Available online: https://www.iso.org/obp/ui/fr/#iso:std:iso:16000:-6:ed-3:v1:fr (accessed on 11 July 2023).
  7. Chien, Y.-C. Variations in Amounts and Potential Sources of Volatile Organic Chemicals in New Cars. Sci. Total Environ. 2007, 382, 228–239. [Google Scholar] [CrossRef] [PubMed]
  8. Domhagen, F.; Langer, S.; Sasic Kalagasidis, A. Modelling VOC Levels in a New Office Building Using Passive Sampling, Humidity, Temperature, and Ventilation Measurements. Build. Environ. 2023, 238, 110337. [Google Scholar] [CrossRef]
  9. Dewulf, J.; Van Langenhove, H.; Wittmann, G. Analysis of Volatile Organic Compounds Using Gas Chromatography. TrAC Trends Anal. Chem. 2002, 21, 637–646. [Google Scholar] [CrossRef]
  10. Cabanes, A.; Valdés, F.J.; Fullana, A. A Review on VOCs from Recycled Plastics. Sustain. Mater. Technol. 2020, 25, e00179. [Google Scholar] [CrossRef]
  11. de Lacy Costello, B.; Amann, A.; Al-Kateb, H.; Flynn, C.; Filipiak, W.; Khalid, T.; Osborne, D.; Ratcliffe, N.M. A Review of the Volatiles from the Healthy Human Body. J. Breath Res. 2014, 8, 014001. [Google Scholar] [CrossRef]
  12. Drabińska, N.; Flynn, C.; Ratcliffe, N.; Belluomo, I.; Myridakis, A.; Gould, O.; Fois, M.; Smart, A.; Devine, T.; Costello, B.D.L. A Literature Survey of All Volatiles from Healthy Human Breath and Bodily Fluids: The Human Volatilome. J. Breath Res. 2021, 15, 034001. [Google Scholar] [CrossRef]
  13. Beauchamp, J.; Herbig, J.; Gutmann, R.; Hansel, A. On the Use of Tedlar® Bags for Breath-Gas Sampling and Analysis. J. Breath Res. 2008, 2, 046001. [Google Scholar] [CrossRef] [PubMed]
  14. Rankin-Turner, S.; McMeniman, C.J. A Headspace Collection Chamber for Whole Body Volatilomics. Analyst 2022, 147, 5210–5222. [Google Scholar] [CrossRef]
  15. Roodt, A.P.; Naudé, Y.; Stoltz, A.; Rohwer, E. Human Skin Volatiles: Passive Sampling and GC × GC-ToFMS Analysis as a Tool to Investigate the Skin Microbiome and Interactions with Anthropophilic Mosquito Disease Vectors. J. Chromatogr. B Anal. Technol. Biomed. Life Sci. 2018, 1097–1098, 83–93. [Google Scholar] [CrossRef] [PubMed]
  16. Prada, P.A.; Curran, A.M.; Furton, K.G. Comparison of Extraction Methods for the Removal of Volatile Organic Compounds (VOCs) Present in Sorbents Used for Human Scent Evidence Collection. Anal. Methods 2010, 2, 470. [Google Scholar] [CrossRef]
  17. Woolfenden, E. Chapter 10-Thermal Desorption Gas Chromatography. In Gas Chromatography, 2nd ed.; Poole, C.F., Ed.; Handbooks in Separation Science; Elsevier: Amsterdam, The Netherlands, 2021; pp. 267–323. ISBN 978-0-12-820675-1. [Google Scholar]
  18. Hilaire, F.; Basset, E.; Bayard, R.; Gallardo, M.; Thiebaut, D.; Vial, J. Comprehensive Two-Dimensional Gas Chromatography for Biogas and Biomethane Analysis. J. Chromatogr. A 2017, 1524, 222–232. [Google Scholar] [CrossRef]
  19. Franchina, F.A.; Zanella, D.; Dubois, L.M.; Focant, J.-F. The Role of Sample Preparation in Multidimensional Gas Chromatographic Separations for Non-Targeted Analysis with the Focus on Recent Biomedical, Food, and Plant Applications. J. Sep. Sci. 2021, 44, 188–210. [Google Scholar] [CrossRef]
  20. Boudard, E.; Moumane, N.; Dugay, J.; Vial, J.; Thiébaut, D. Body Volatilome Study Strategy for COVID-19 Biomarker Identification Considering Exogenous Parameters. Separations 2024, 11, 336. [Google Scholar] [CrossRef]
  21. Boudard, E.; Fisson, L.; Moumane, N.; Dugay, J.; Vial, J.; Thiébaut, D. Study of Sampling Phases for Body Odor Sampling Prior to Analysis by TD-GC×GC/ToFMS. Anal. Bioanal. Chem. 2025, 417, 3177–3190. [Google Scholar] [CrossRef]
  22. Springer Handbook of Odor; Buettner, A., Ed.; Springer Handbooks; Springer International Publishing: Cham, Switzerland, 2017; ISBN 978-3-319-26930-6. [Google Scholar]
  23. Dorey, S.; Pahl, I.; Uettwiller, I.; Priebe, P.; Hauk, A. Theoretical and Practical Considerations When Selecting Solvents for Use in Extractables Studies of Polymeric Contact Materials in Single-Use Systems Applied in the Production of Biopharmaceuticals. Ind. Eng. Chem. Res. 2018, 57, 7077–7089. [Google Scholar] [CrossRef]
  24. Venhoven, B.A.M.; De Gee, A.J.; Davidson, C.L. Polymerization Contraction and Conversion of Light-Curing BisGMA-Based Methacrylate Resins. Biomaterials 1993, 14, 871–875. [Google Scholar] [CrossRef] [PubMed]
  25. Harris, S.H.; Kreter, P.E.; Polley, C.W. Characterization of Polyurethane Foam Odor Bodies. J. Cell. Plast. 1988, 24, 486–494. [Google Scholar] [CrossRef]
  26. Gauthier, Q.T.; Riley, P.; Simon, A.G. Permeation of Human Scent through Laboratory Examination Gloves. J. Forensic. Sci. 2022, 67, 2308–2320. [Google Scholar] [CrossRef]
  27. Brodzik, K.; Faber, J.; Łomankiewicz, D.; Gołda-Kopek, A. In-Vehicle VOCs Composition of Unconditioned, Newly Produced Cars. J. Environ. Sci. 2014, 26, 1052–1061. [Google Scholar] [CrossRef]
  28. Murtagh, F.; Legendre, P. Ward’s Hierarchical Agglomerative Clustering Method: Which Algorithms Implement Ward’s Criterion? J. Classif. 2014, 31, 274–295. [Google Scholar] [CrossRef]
  29. Li, J.; Sobańtka, A. A Systematic Analysis of the Effect of Extraction Solvents on the Chemical Composition of Extraction Solutions and the Analytical Implications in Extractables and Leachables Studies. J. Pharm. Biomed. Anal. 2023, 222, 115081. [Google Scholar] [CrossRef]
  30. Arbir, F.W.; Raden, D.S.; Narducy, K.W.; Casati, F.M. Catalyst for Making Polyurethanes 1984. US4456696A, 26 June 1984. [Google Scholar]
  31. Klein, R. Définition de Critères Moléculaires Simples, Robustes et Industrialisables Pour Prédire la Perception Olfactive et sa Composante Hédonique à Travers Différentes Cultures. Ph.D. Thesis, Université Paris Sciences et Lettres, Paris, France, 2023. [Google Scholar]
  32. Itoh, T.; Kozaki, M.; Kubo, M.; Iwatsuki, S. Synthesis of Aromatic Polyesters and Polyamides by Alternating Copolymerizations of 1,4-Dicarbonyl-1,4-Dihydronaphthalene with Bezoquinones and Benzoquinone Diimines. J. Polym. Sci. Part A Polym. Chem. 1998, 36, 1929–1936. [Google Scholar] [CrossRef]
  33. Cotarca, L.; Delogu, P.; Nardelli, A.; Maggioni, P.; Bianchini, R.; Sguassero, S.; Alini, S.; Dario, R.; Clauti, G.; Pitta, G.; et al. Efficient and Scaleable Methods for ω-Functionalized Nonanoic Acids:  Development of a Novel Process for Azelaic and 9-Aminononanoic Acids (Nylon-6,9 and Nylon-9 Precursors). Org. Process Res. Dev. 2001, 5, 69–76. [Google Scholar] [CrossRef]
  34. Kalgutkar, R.S.; Amos, D.T.; Kadoma, I.A.; Severance, J.A.; Nelson, J.M.; Watts, A.; Anderson, J.J.; Schultz, K.C.M. Branched Amorphous Polyamide (Co)Polymers and Methods of Making and Using Same 2021. WO2021209895A1, 21 October 2021. [Google Scholar]
  35. Cavani, F.; Trifirò, F. Alternative Processes for the Production of Styrene. Appl. Catal. A Gen. 1995, 133, 219–239. [Google Scholar] [CrossRef]
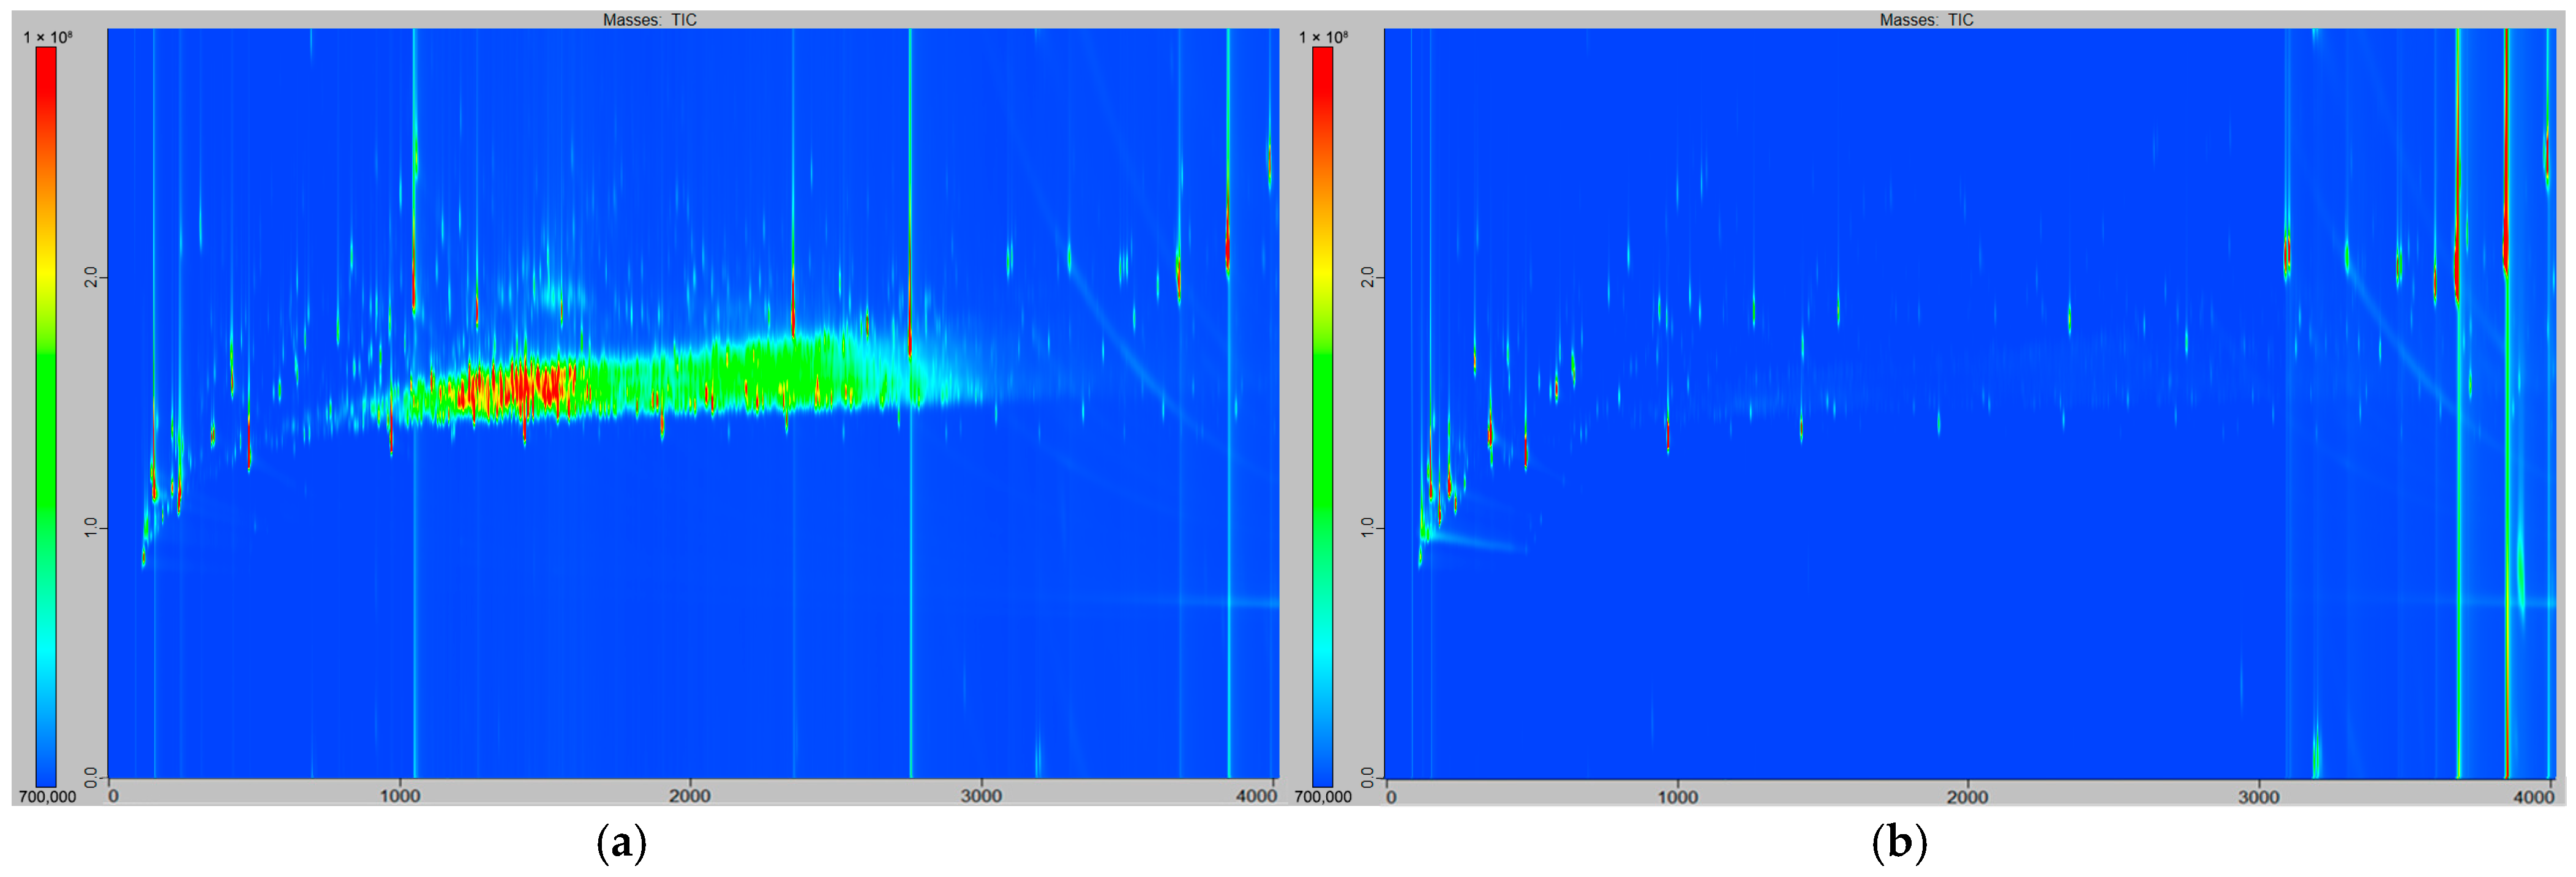
Figure 1. TD-GC×GC/ToFMS contour plot chromatograms of polyurethane (PU) VOC emissions before the cleaning process (a) and after the cleaning process (b); same scale: the bottom axis corresponds to the first column retention time (s), the left axis corresponds to the second column retention time (s), and relative intensity scale (blue to red) is reported on the left.
Separations 12 00250 g001
Figure 2. TD-GC×GC/ToFMS contour plot chromatograms of silicone VOC emissions measured by the thermodesorption (a) and passive method (b); same scale: the bottom axis corresponds to the first column retention time (s), the left axis corresponds to the second column retention time (s), and relative intensity scale (blue to red) is reported on the left.
Separations 12 00250 g002
Figure 3. TD-GC×GC/ToFMS contour plot chromatogram of a blank sample, obtained by analyzing an empty thermodesorption tube. Same scale and conditions as the material chromatograms above (Figure 1 and Figure 2).
Separations 12 00250 g003
Figure 4. TD-GC×GC/ToFMS contour plot chromatograms of the investigated raw materials: (a) silicone, (b) PU, (c) TPE, (d) photopolymer, (e) SS, (f) PA, (g) PP/AB, and (h) PC (same scale: the bottom axis corresponds to the first column retention time (s), the left axis corresponds to the second column retention time (s), and relative intensity scale (blue to red) is reported on the left). For the experimental conditions, see Section 2.
Separations 12 00250 g004
Figure 5. Dendrogram and color map representing the hierarchical grouping of the 13 investigated materials according to the presence of each chemical family, as defined in the experimental section, and TVOC. Color scale from blue to red corresponds to values from low to high.
Separations 12 00250 g005
Figure 6. Distribution of peaks in percentage of area for the 10 families of VOCs (hydrocarbons (HCs), aromatics, esters, alcohols, ketones, acids, aldehydes, nitrogenated compounds (N), ethers, others, and unidentified) detected for the 13 analyzed raw materials: (a) silicone, (b) BoPET, (c) PEHD, (d) Photopolymer, (e) PU, (f) TPE, (g) HMPE, (h) PA, (i) PP/AB, (j) PTEF, (k) PC, (l) Aluminium, (m) Stainless steel. Number of detected peaks by TD-GCxGC/ToFMS, and the measured TVOC concentrations are reported above each associated diagram.
Separations 12 00250 g006aSeparations 12 00250 g006b
Table 1. Thirteen analyzed materials: full name, abbreviation if existing, suppliers, and additional information if available.
MaterialAbbreviationSupplierAdditional Information
Polyamide 12PASilex 3D Print
https://www.silex3dprint.fr/
Thizy-Les-Bourgs, France
Nylon
Photopolymer (acrylic based polymer) Xometry Europe
https://pages.xometry.eu/
Ottobrunn, Germany
VeroBlackPlus RGD 875
Polypropylene/acrylonitrile butadienePP/ABZITFRI
https://www.gosupps.com/
Wilmington, Del, USA
PolyurethanePUARRK LCO Protomoule
https://fr.arrk.com/
Alby-Sur-Chéran, France
PU GM956
Silicone ARRK LCO Protomoule
https://fr.arrk.com/
Alby-Sur-Chéran, France
PolycarbonatePCPlaqueplastique.fr
https://plaqueplastique.fr/
Paris, France
Polyethylene high-densityPEHDPlaqueplastique.fr
https://plaqueplastique.fr/
Paris, France
High-modulus polyethyleneHMPEPlaqueplastique.fr
https://plaqueplastique.fr/
Paris, France
Thermoplastic elastomerTPEAvient
https://www.avient.com/
Pommerloch, Luxembourg
Versaflex HCMT 224
PolytetrafluoroethylenePTFEAction Europe
https://www.actioneurope.fr/
Sausheim, France
Aluminum Fisher Scientific
https://www.fishersci.fr
Illkirsch, France
Food grade
Stainless steel SSHCT group
https://hctgroup.com/
Paris, France
Biaxially oriented polyethylene terephtalateBoPETLaboModerne
https://www.labomoderne.com/
Gennevilliers, France
Mylar
Table 2. Total number of peaks detected in the chromatograms, TVOC concentration in grams of compounds per gram of material using TD8 equivalent, and minimum and maximum individual concentration per compound for the 13 materials. Relative standard deviations are in brackets for the triplicate analyses. The emission level of each material is in brackets next to the material name (LE, ME, and HE—see text).
MaterialTotal Number of PeaksTVOC (µg·g−1)Minimum Concentration (µg·g−1)Maximum Concentration (µg·g−1)
Blank103 (36%)
PC (LE)57 (16%)0.170 (49%)1.4 × 10−50.0740
Stainless steel (LE)67 (7%)0.027 (45%)1.4 × 10−50.0041
PTFE (LE)121 (5%)0.014 (13%)2.4 × 10−60.0035
Aluminum (LE)188 (11%)0.110 (17%)3.8 × 10−50.0130
PA (LE)241 (20%)0.260 (9%)8.1 × 10−60.0440
HMPE (LE)5790.7601.0 × 10−50.0390
PEHD (LE)6800.8308.1 × 10−60.0890
TPE (LE)9611.706.5 × 10−60.0600
PP/AB (ME)226 (14%)0.250 (15%)5.9 × 10−60.0310
Photopolymer (ME)422 (15%)1.60 (10%)9.1 × 10−60.5600
BoPET (ME)11732.401.7 × 10−50.0370
PU (HE)17359.801.3 × 10−50.5400
Silicone (HE)20495.401.5 × 10−50.1000
Disclaimer/Publisher’s Note: The statements, opinions and data contained in all publications are solely those of the individual author(s) and contributor(s) and not of MDPI and/or the editor(s). MDPI and/or the editor(s) disclaim responsibility for any injury to people or property resulting from any ideas, methods, instructions or products referred to in the content.