3.1. Preliminary Study
Preliminary separation and quantification of a mixture containing five standard sugars (xylose, fructose, mannose, glucose, and mannitol) was initially performed using a previously established HPLC method developed for the analysis of glucose, fructose, and sucrose in nectar [
52,
53]. The analysis was conducted on an HPLC system equipped with RID maintained at 40 °C and a Nucleosil 100-5 NH
2 amino column held at a column oven temperature of 30 °C. The mobile phase consisted of acetonitrile and water (80:20,
v/
v), delivered at a constant flow rate of 1 mL/min. The effectiveness of separation was evaluated based on the resolution (Rs) between adjacent peaks, calculated using the following formula:
where
w1 and
w2 are the peak widths at 50% and
Rt1,
Rt2 are retention times.
In chromatographic terms, a Rs value greater than 1.0 is generally considered acceptable, while Rs ≥ 1.5 indicates baseline (complete) separation. As shown in
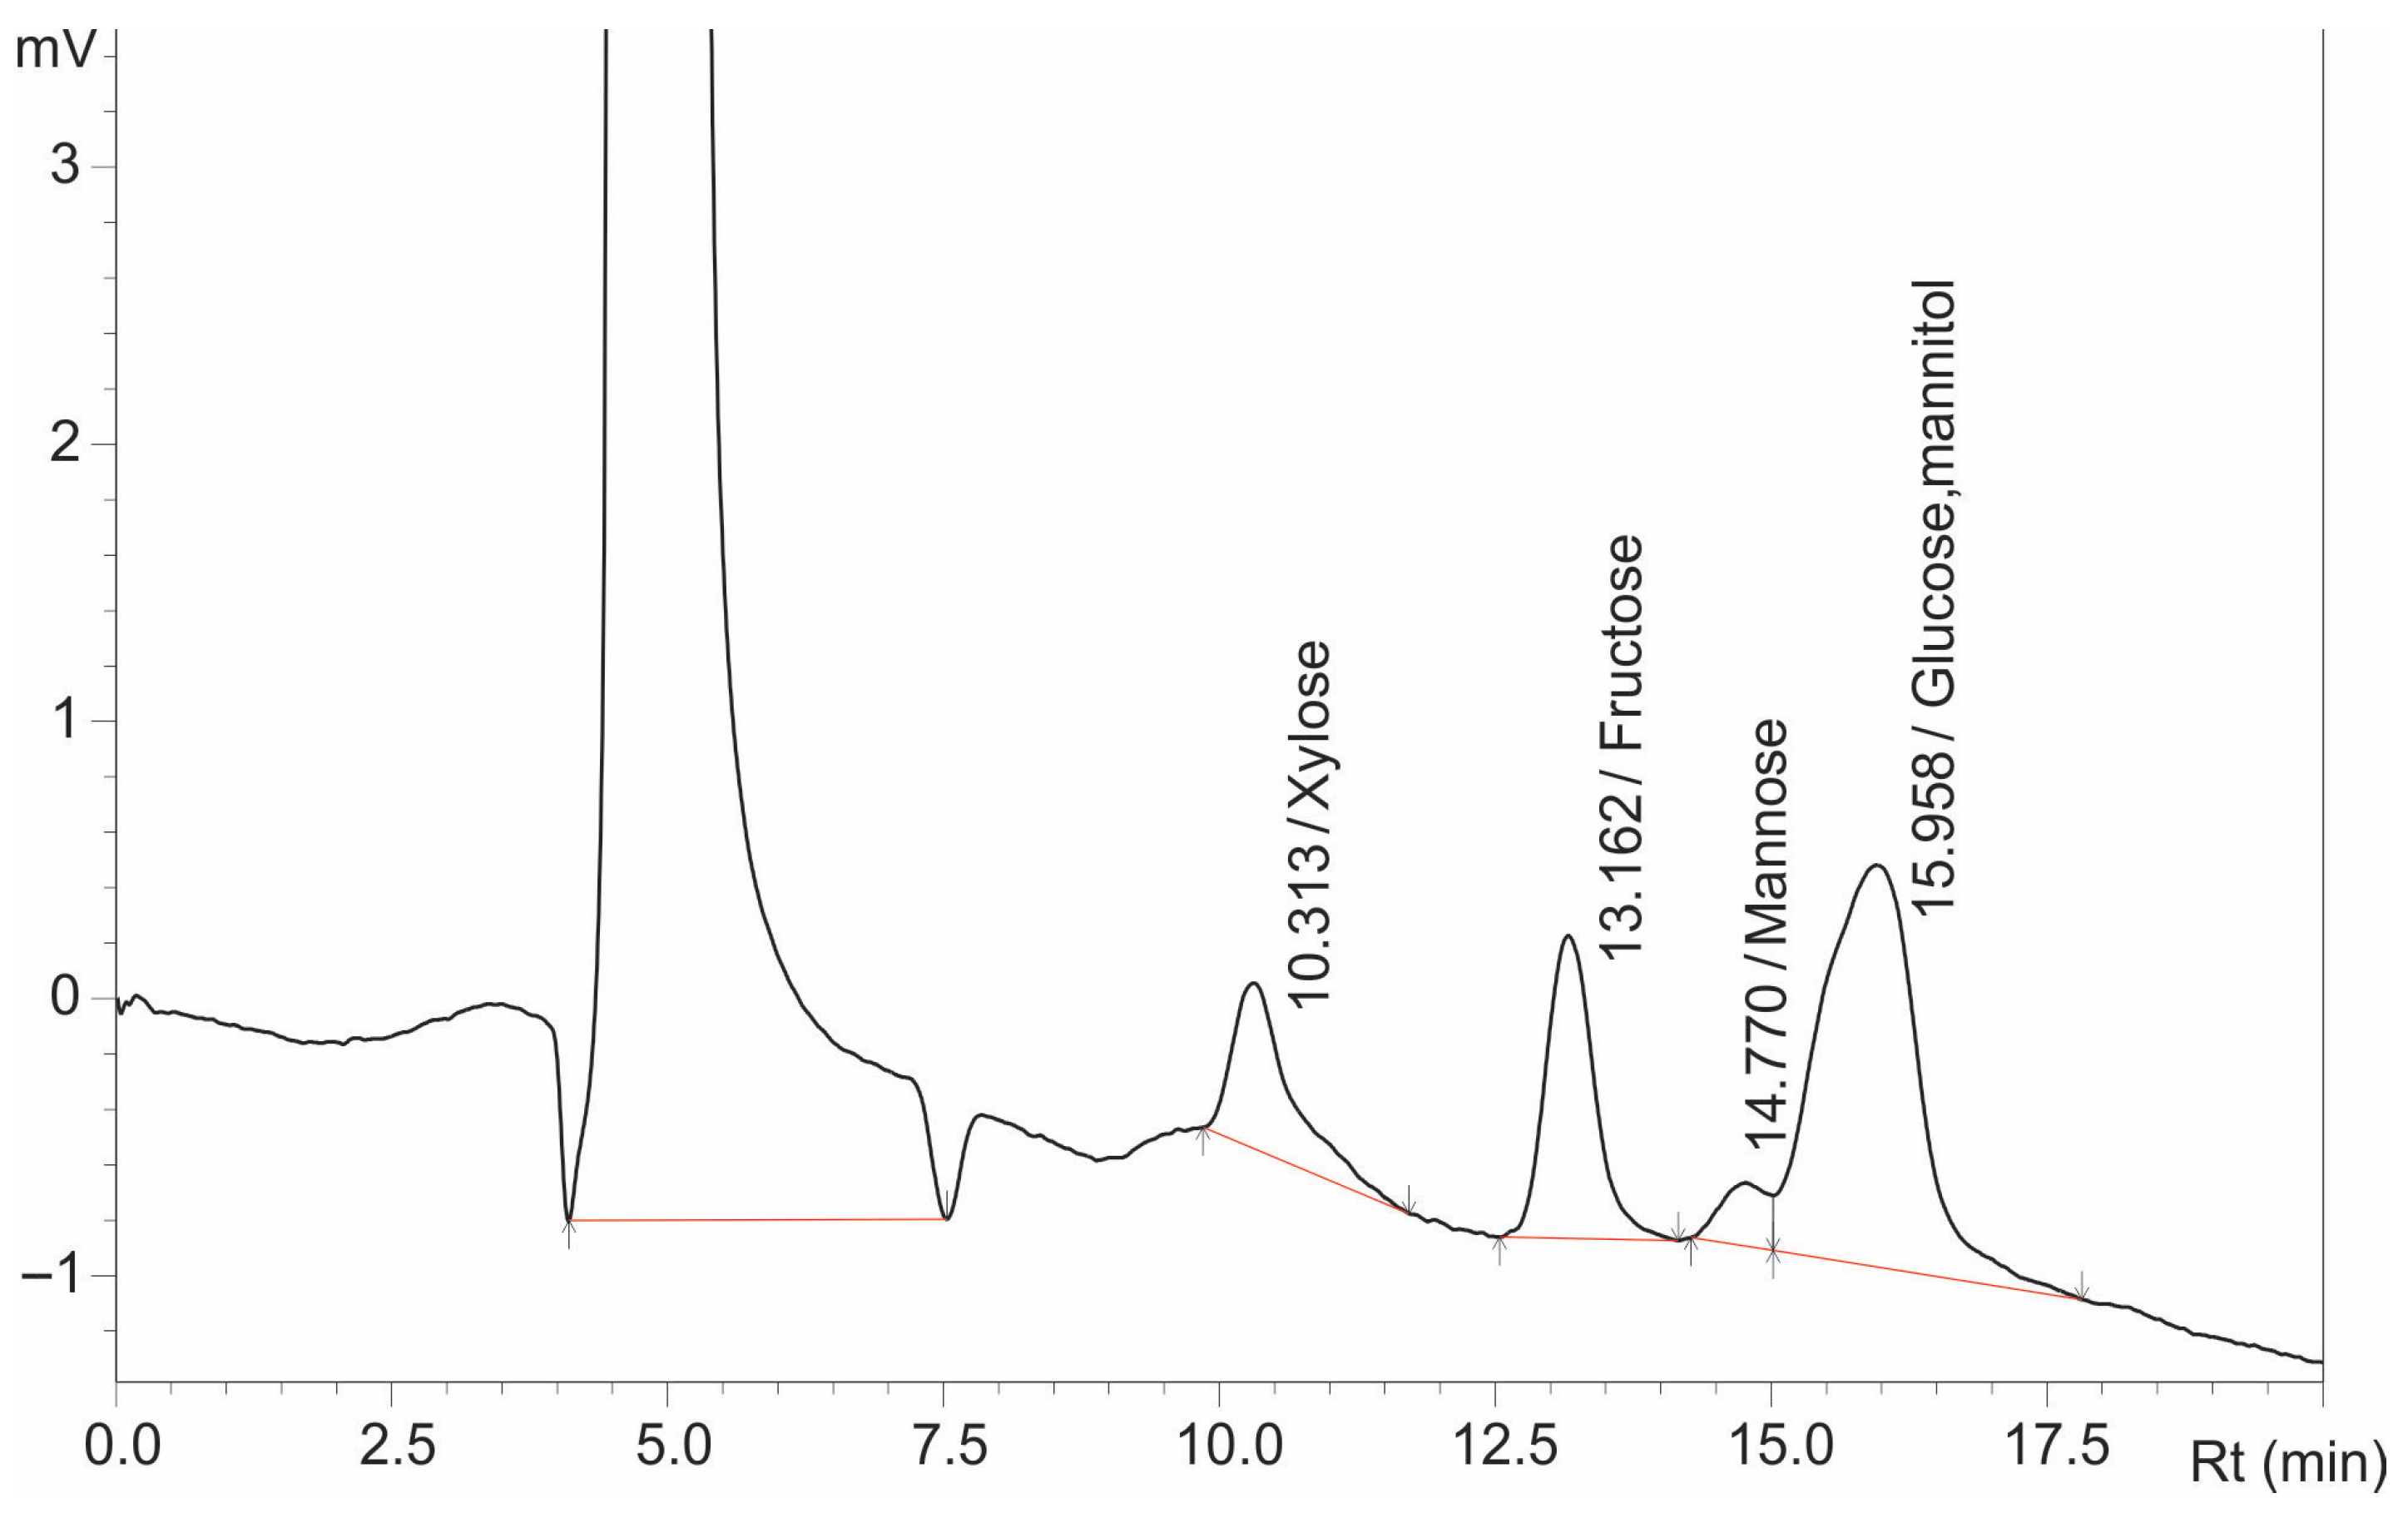
Figure 1, the previously applied method, as reported by Das et al., 2022 [
52], failed to provide sufficient separation of some sugar components: the peaks of glucose and mannitol completely overlapped, and glucose and mannose were only partially resolved.
In contrast, xylose and fructose exhibited a resolution value above 1.5, confirming complete separation.
Experimental trials were performed to overcome the limitations of the previously published HPLC method and facilitate separation of mannose, glucose, and mannitol. These involved systematic adjustments to the key chromatographic parameters such as column temperature, mobile phase composition, flow rate, and elution mode, with the aim to improve resolution, particularly between the critical sugar pairs, and attain Rs values approaching or exceeding 1.5.
Among the investigated parameters, column temperature had a particularly significant impact on the separation efficiency of the critical sugar pairs mannose/glucose and glucose/mannitol. Column temperature is known to influence retention time, peak shape, and resolution by affecting analyte–stationary phase interactions [
54,
55]. For amino columns used in this study, such as the Nucleosil 100-5 NH
2, hydrogen bonding plays a key role in the retention of sugars. As the temperature increases, hydrogen bonds weaken, leading to faster elution but often at the cost of resolution. Conversely, lower temperatures strengthen hydrogen bonding, thereby improving separation and sensitivity [
29]. This effect is particularly important for structurally related sugars, such as glucose and mannose, where subtle stereochemical differences in hydroxyl group orientation are discriminated more effectively at lower temperatures. Stabilization of hydrogen bonding under these conditions adds fine structural distinctions, resulting in enhanced chromatographic selectivity [
56,
57,
58]. Temperature also affects the viscosity of the mobile phase, affecting analyte migration and overall retention. Higher temperatures reduce viscosity, allowing compounds to elute more rapidly, but may result in insufficient resolution [
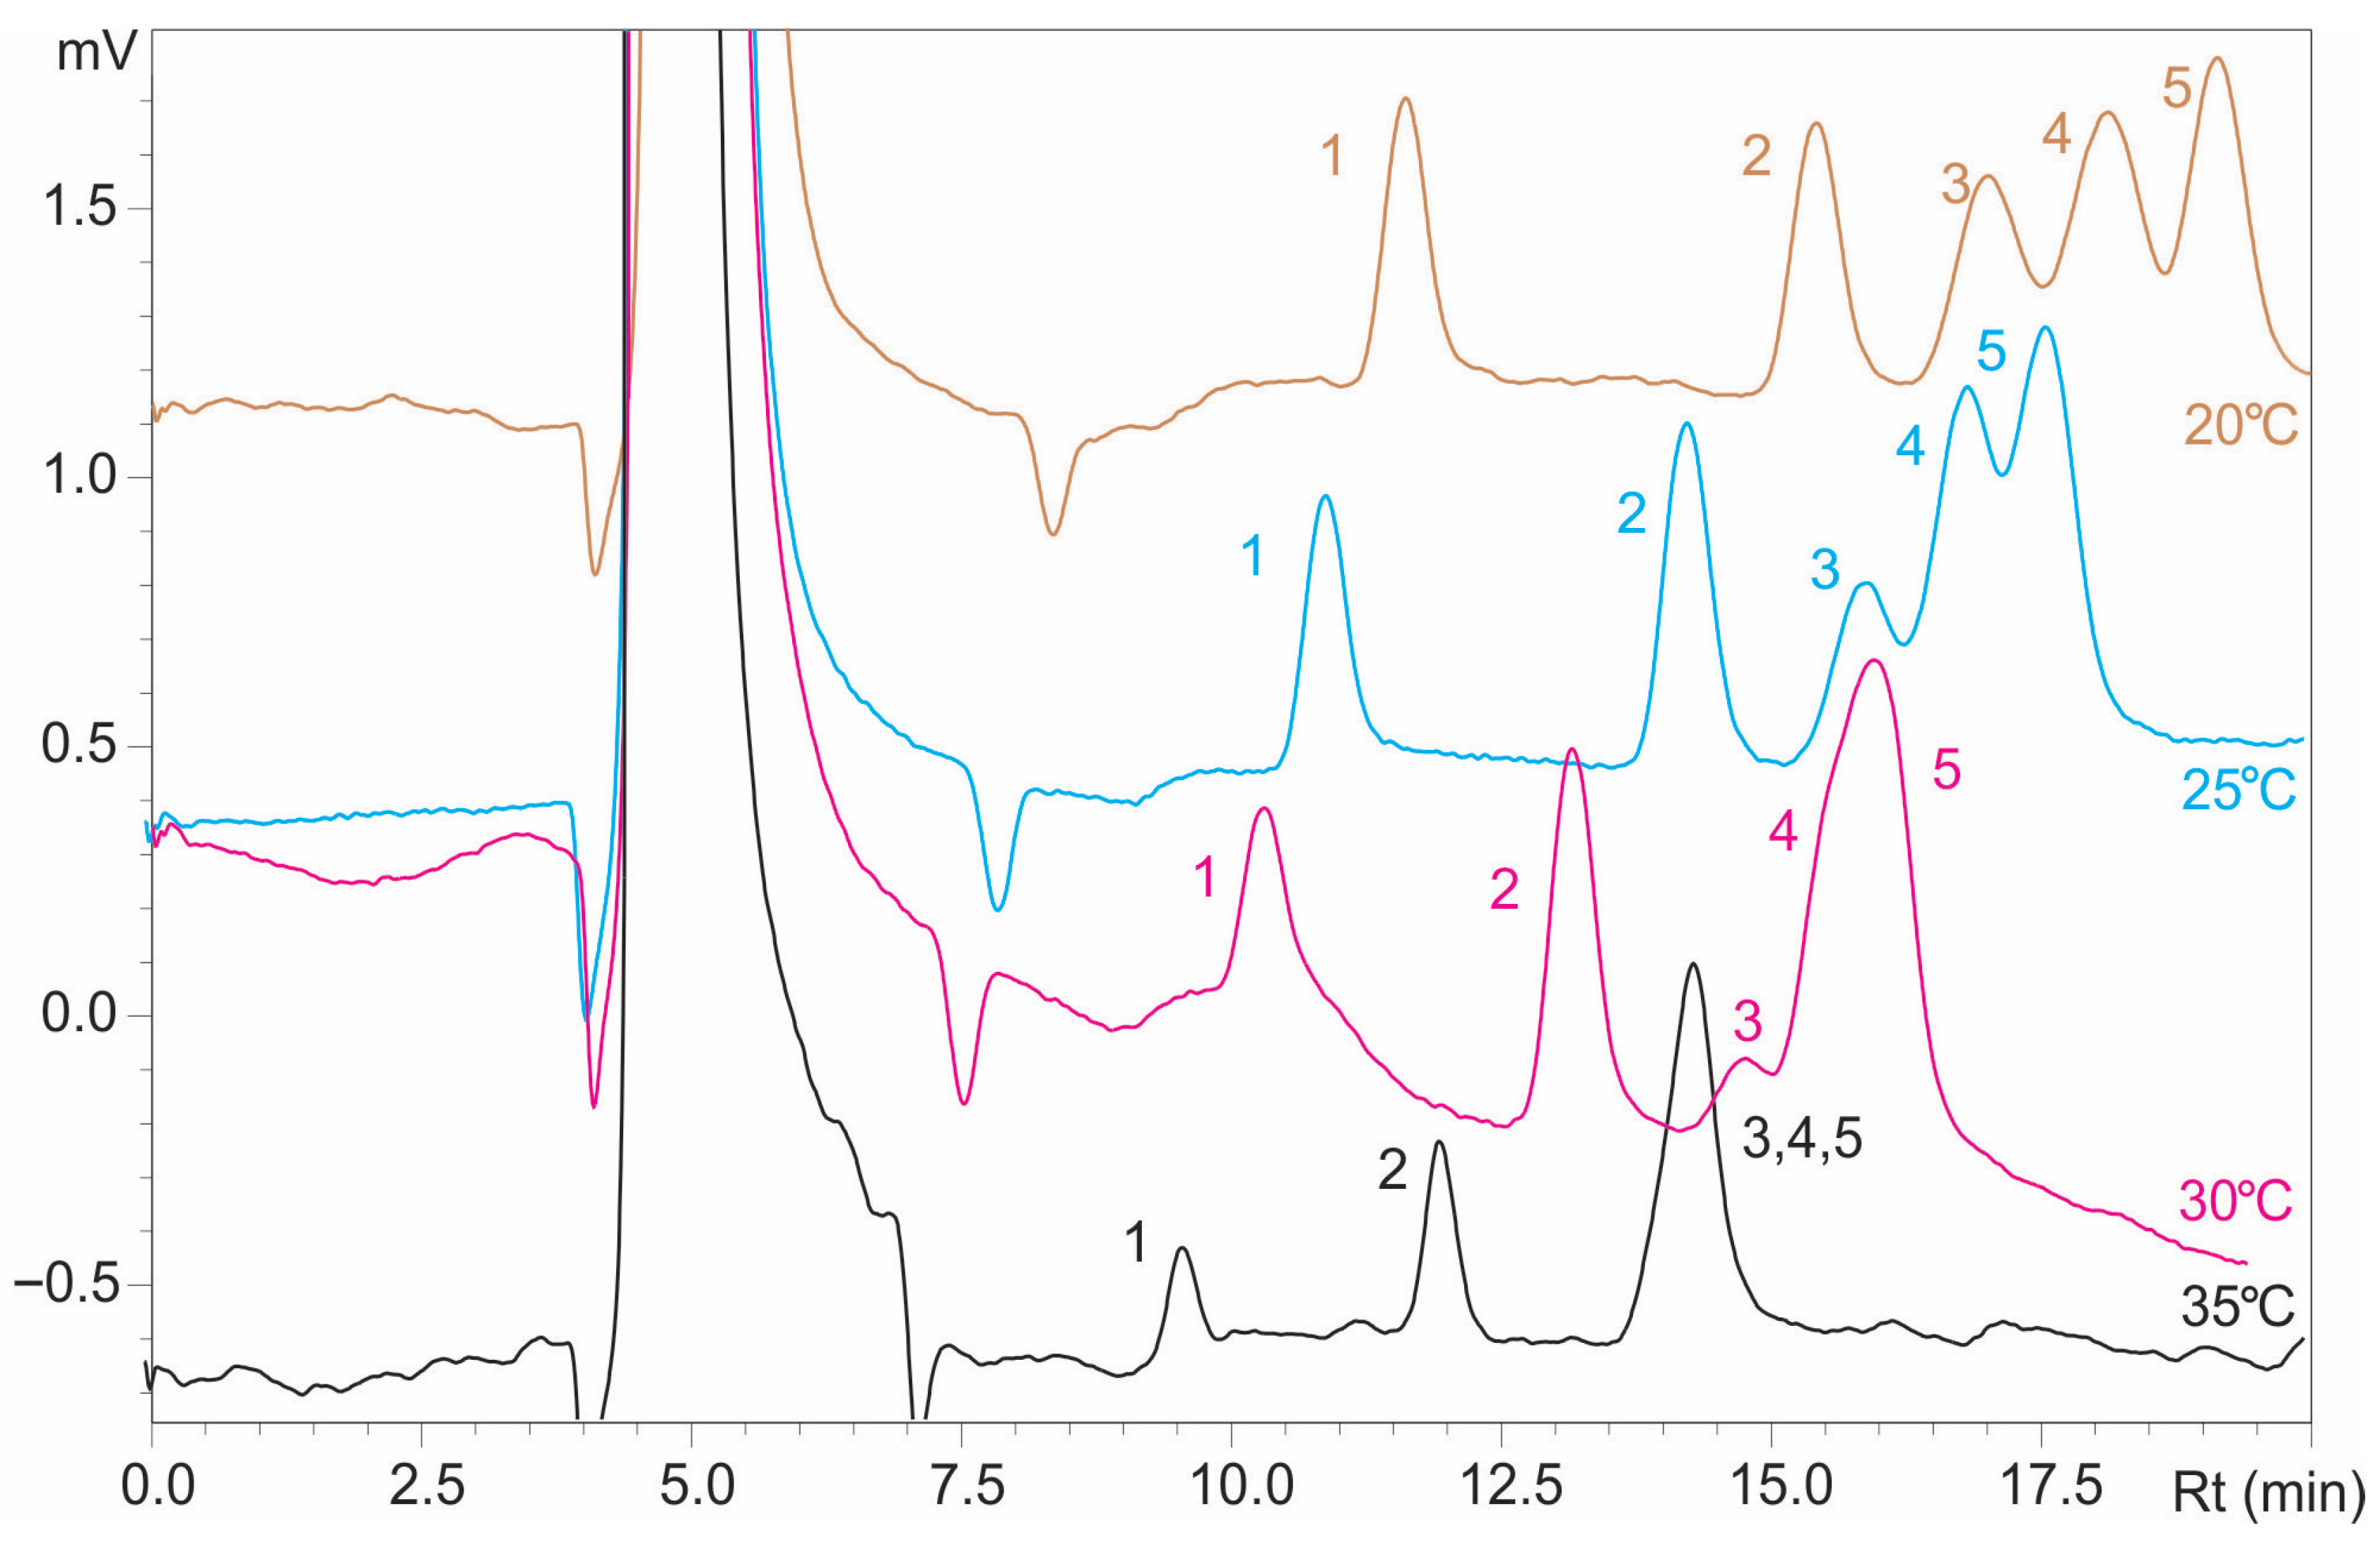
59]. To evaluate the influence of column temperature on the separation of mannose, glucose, and mannitol, a series of experiments was conducted at 20 °C, 25 °C, 30 °C, and 35 °C, by using a mobile phase of acetonitrile:water (80:20,
v/
v) while keeping the flow rate constant at 1 mL/min. At higher temperatures (30 °C and 35 °C), the resolution values were below 1.0 for both sugar pairs, indicating inadequate separation. At 25 °C, an improved separation was observed, with the resolution between mannose and glucose (Rmg) reaching 1.200, which is acceptable, although the glucose and mannitol resolution (Rgm) remained insufficient at 0.916. The optimal separation was achieved at 20 °C, where Rmg was 1.160 and Rgm reached 1.066, as shown in
Figure 2 and
Table 1, highlighting that lower temperatures stabilize hydrogen bonding and enhance selectivity for structurally similar sugars, such as glucose and mannose, by effectively discriminating subtle stereochemical differences.
In addition to improving resolution, lower column temperatures enhanced detector response, which is particularly beneficial for sensitive and accurate quantification resulting in increased peak areas and improved signal quality.
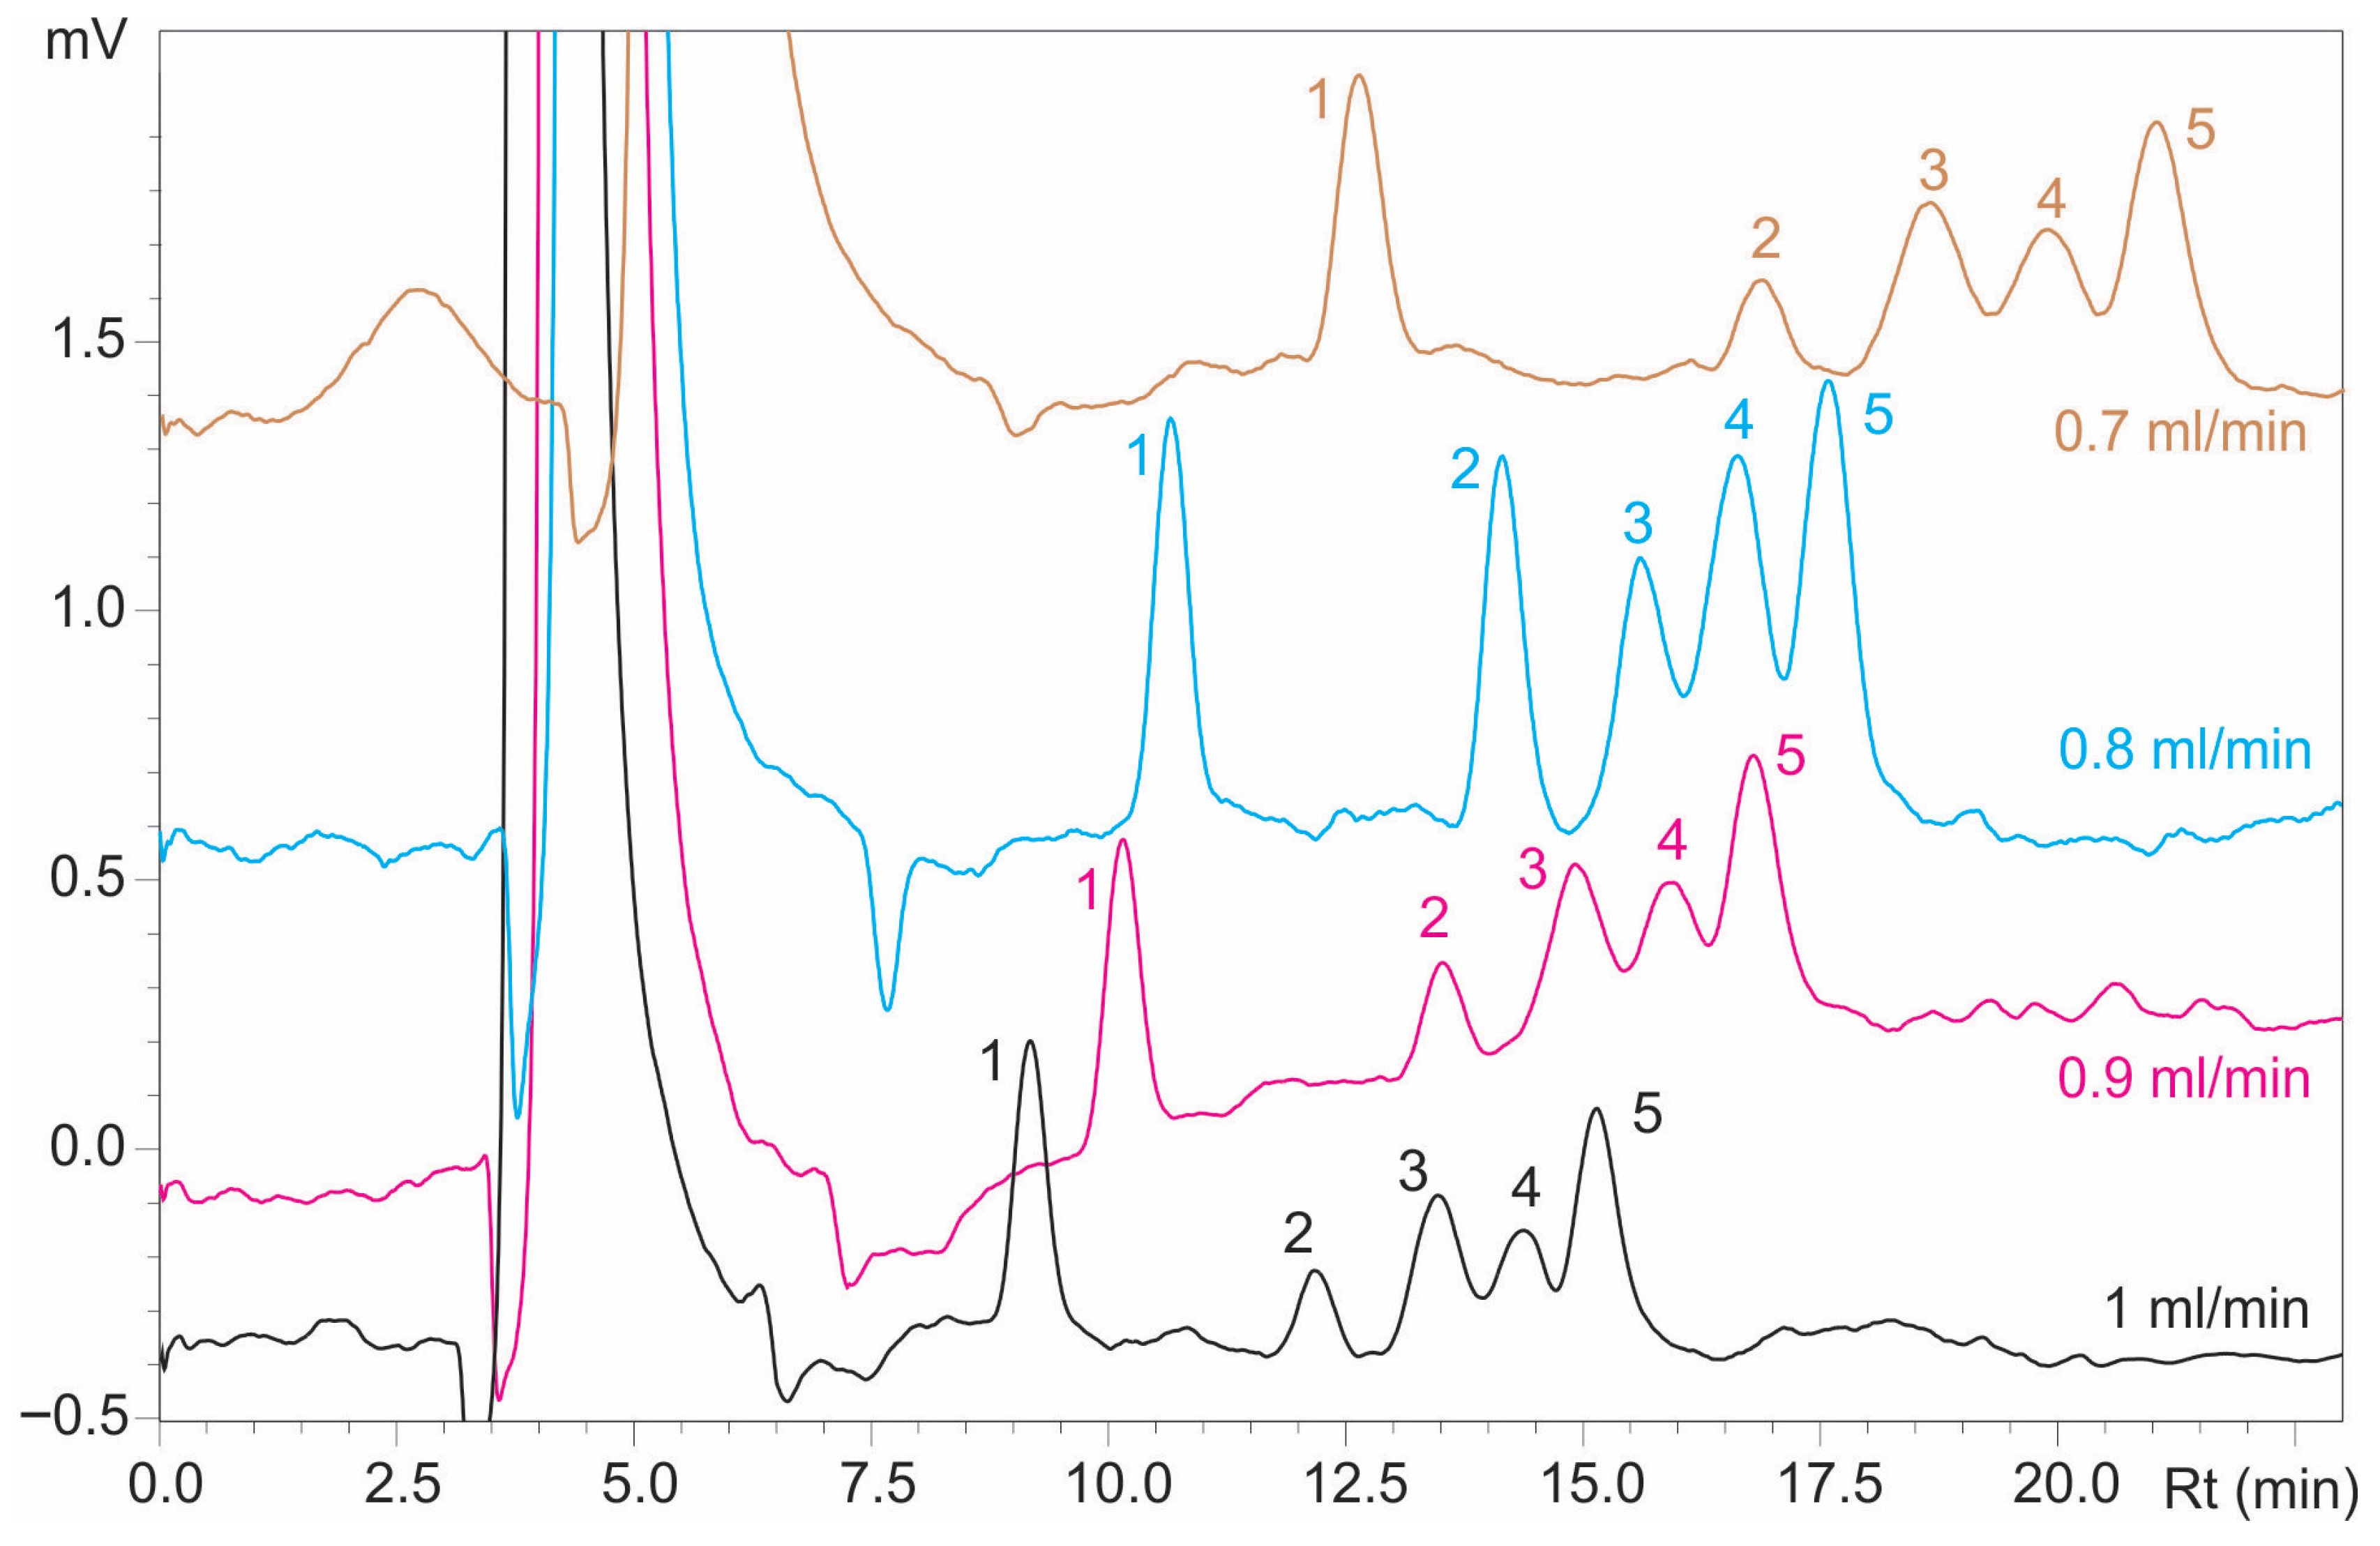
Furthermore, the effect of flow rate on sugar separation was investigated by varying it from 1 mL/min to 0.7 mL/min. A reduction in flow rate contributed to better resolution, but it also led to longer elution. As shown in
Figure 3, retention times were extended at flow rates of 0.8 and 0.7 mL/min. The highest resolution factors (Rmg = 1.217 and Rgm = 1.032) were achieved at 0.9 mL/min, though the improvement over 1 mL/min was marginal, highlighting the balance between analyte–stationary phase interaction and peak broadening for optimal high-resolution separation, as summarized in
Table 2.
The mobile phase composition is a critical factor influencing separation efficiency. Given the polar nature of carbohydrates, highly polar solvents—such as water, methanol, or acetonitrile—are essential for effective resolution. A widely employed mobile phase for carbohydrate separation consists of acetonitrile and water in varying ratios [
25,
29,
30,
60,
61]. The optimal acetonitrile content (typically 75–85%) depends on the column chemistry, flow rate, temperature, and the characteristics of the analyte. Increasing the water fraction accelerates elution but often compromises resolution and peak symmetry. Conversely, higher acetonitrile concentrations enhance separation selectivity at the expense of prolonged retention times and increased baseline noise [
27,
29,
61,
62,
63]. In summary, higher acetonitrile content reduces analyte solvation, strengthening hydrogen bonding and dipole interactions with the stationary phase, and thereby improving retention and selectivity for structurally similar sugars. On the other hand, lower acetonitrile ratios favor solvation in the mobile phase, and reduce selectivity [
57,
64,
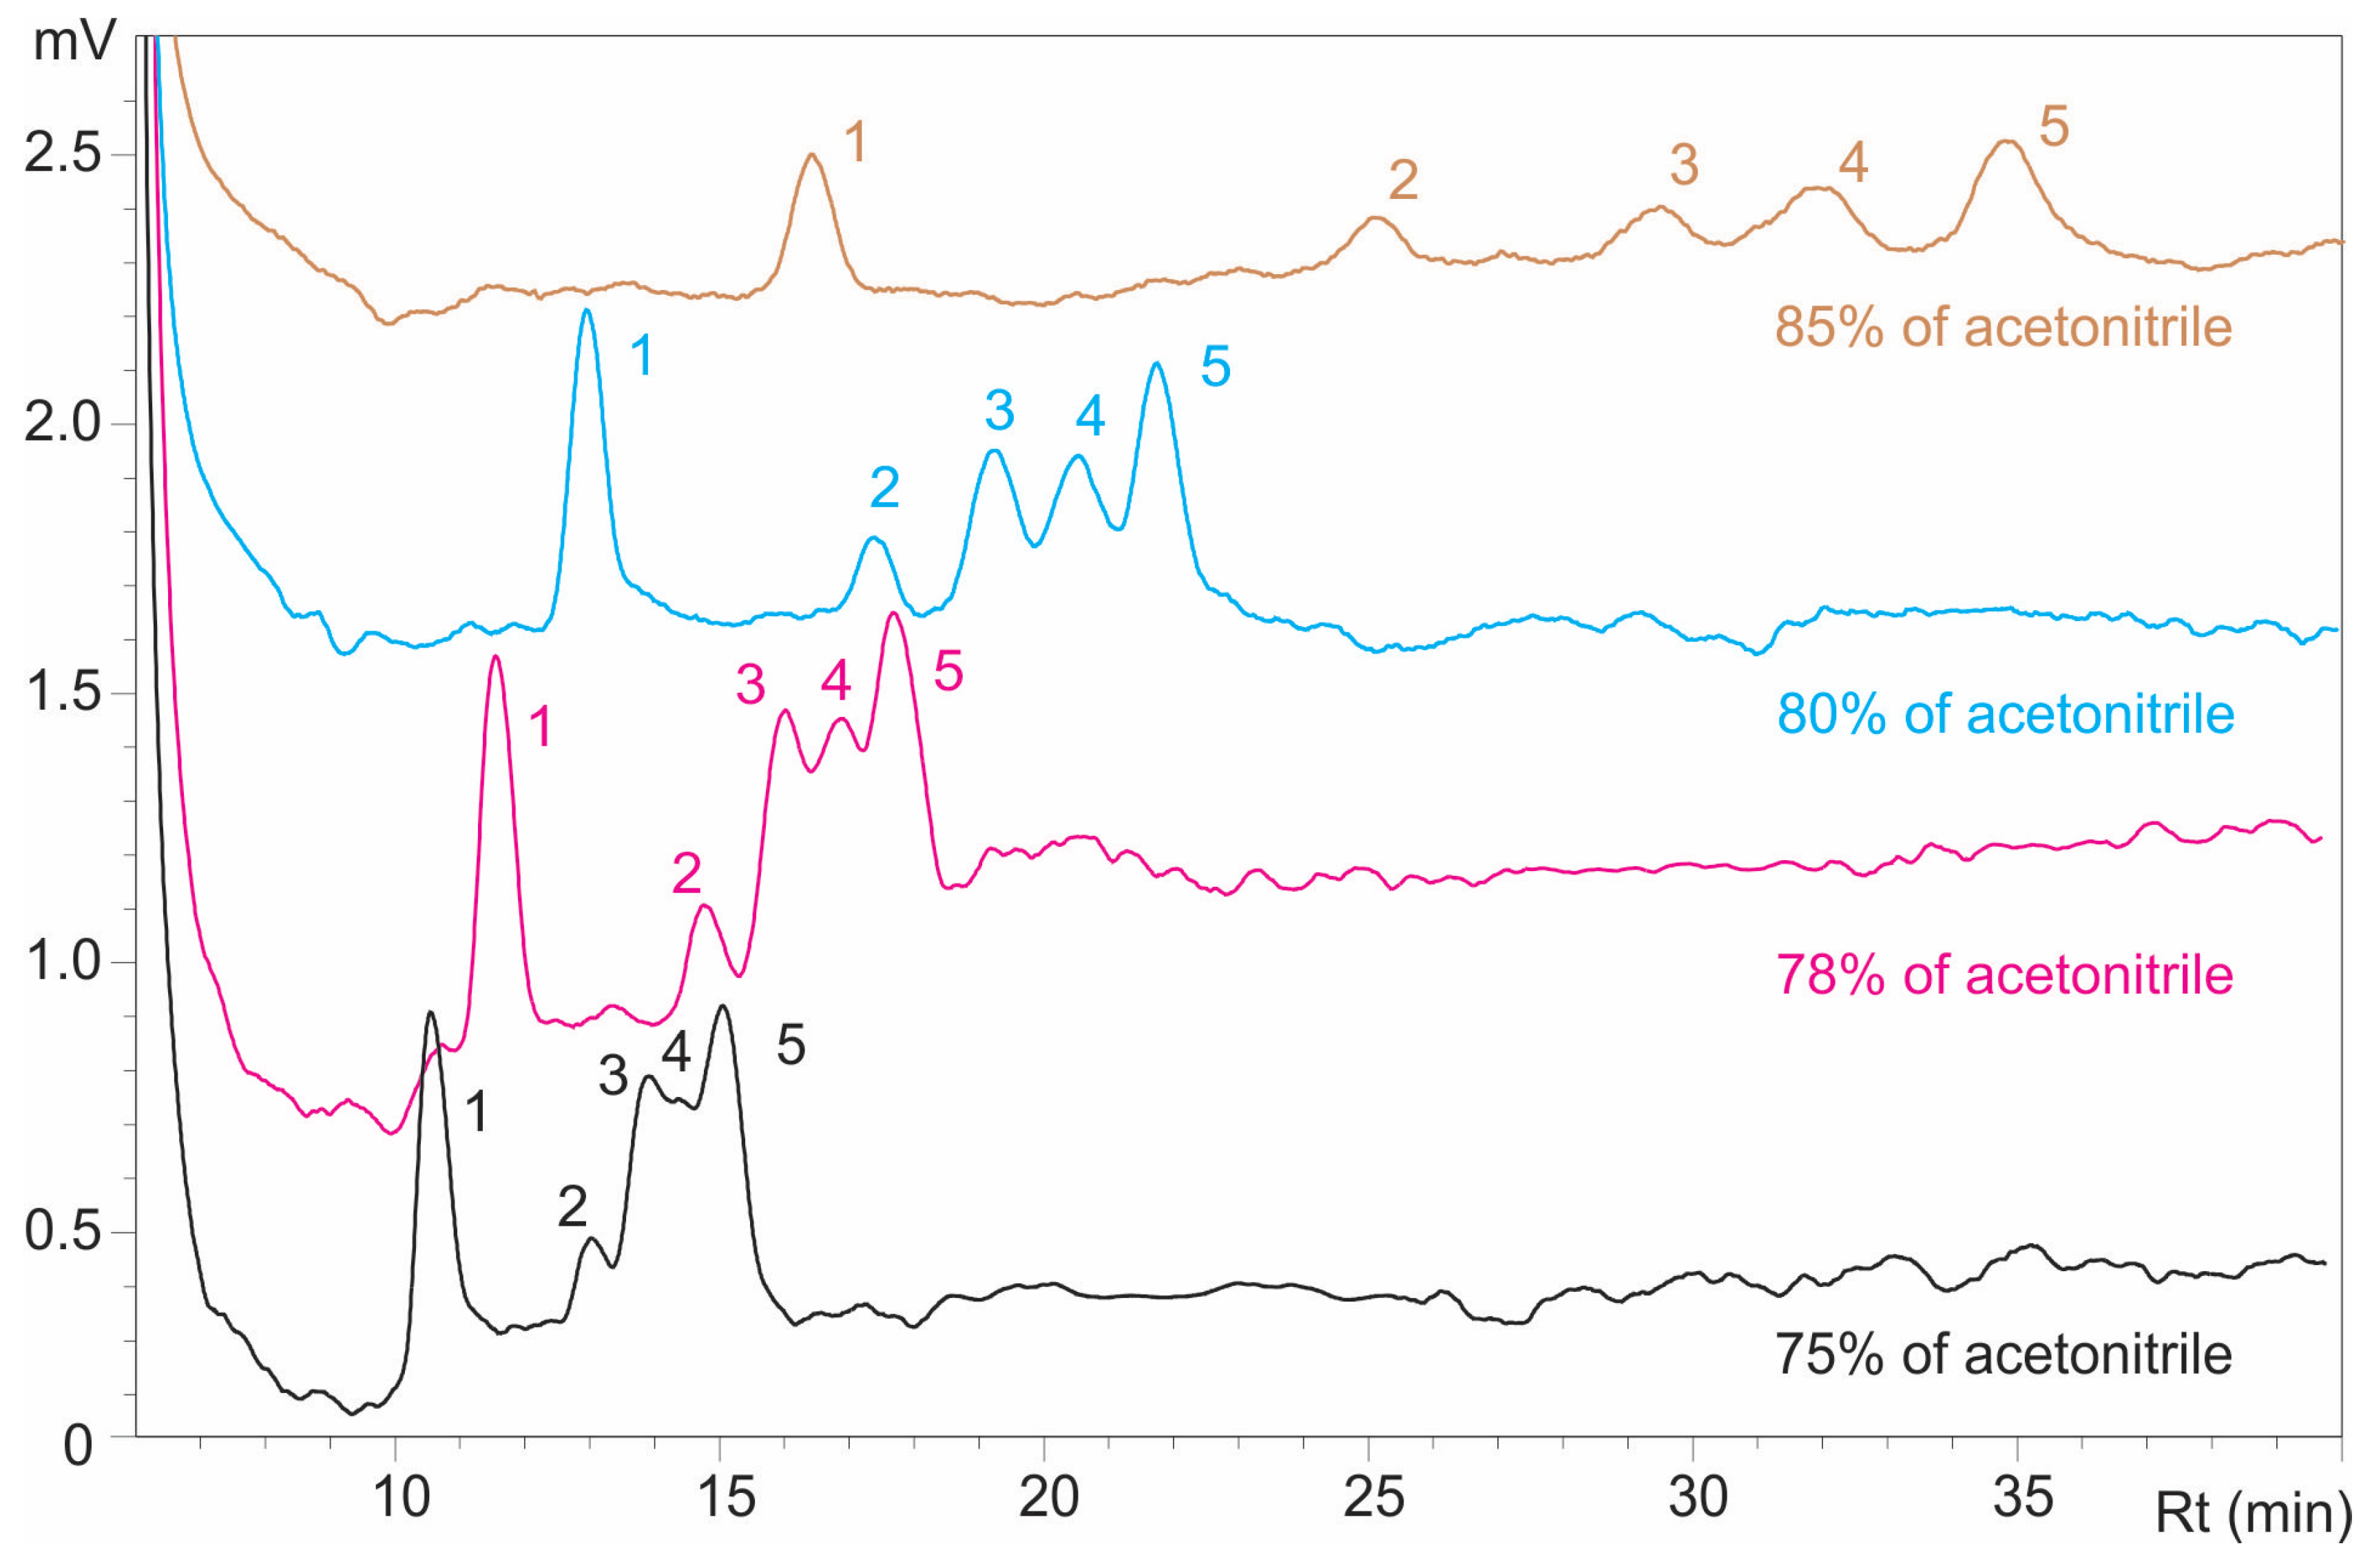
65]. To systematically evaluate these effects, analyses were performed using acetonitrile compositions ranging from 75% to 85% under fixed chromatographic conditions (flow rate: 0.7 mL/min; column temperature: 20 °C).
Faster elution of components was observed with mobile phases containing 75% and 78% acetonitrile (
Figure 4); however, inadequate separation was achieved under these conditions. At 75% acetonitrile, resolution factors of 1.068 (Rmg) and 1.076 (Rgm) were obtained, while at 78%, resolution factors had very similar values of 1.042 (Rmg) and 1.040 (Rgm). Separation improved when acetonitrile concentration was increased to 80%, with Rmg and Rgm values rising to 1.184 and 1.106, respectively (
Table 3), reflecting the mechanistic effect of higher acetonitrile content in reducing analyte solvation and enhancing interactions with the stationary phase for better retention and selectivity of structurally similar sugars.
In contrast, separation was satisfactory attained when using a mobile phase with 85% acetonitrile, yielding which resulted in resolution factors of 1.200 (Rmg) and 1.433 (Rgm) but also in broad peaks, prolonged elution times, and elevated baseline noise, as illustrated in
Figure 4.
Mobile phase pH optimization can significantly enhance chromatographic separation. However, in aminopropyl-silica columns, pH modification induces covalent bond formation between the stationary phase amino groups and analytes, ultimately leading to column poisoning and efficiency degradation [
27,
60]. Given this pH sensitivity, no pH adjustments were made, and the mobile phase maintained the inherent pH of the pure solvent mixture (acetonitrile/water, 80:20
v/
v) in all the experiments.
3.2. Experimental Design
Following the results of the preliminary study, a three-level, three-factor Box–Behnken experimental design was used to determine the influence of A. temperature T (°C), B. acetonitrile (%), and C. flow rate (mL/min) on the resolution between mannose and glucose (Rmg) and glucose and mannitol (Rgm). Upper and lower levels of variables were chosen based on the results of the preliminary study. The best results were achieved at column temperatures between 20 °C and 23 °C, with the percentage of acetonitrile in the mobile phase ranging from 80% to 85%, and flow rates between 0.7 and 1 mL/min. Although resolution (Rgm) was obtained at 25 °C, its relatively low value (0.91) was considered insufficient for reliable separation, and this temperature was excluded from the optimal range. Since the best result was observed at 20 °C, the authors decided to test a narrow temperature range between 20 and 23 °C for further method optimization The Design-Expert software (free trial) was used at three levels: A: 20 °C (−1), 21.5 °C (0), 23 °C (1); B: 80% (−1), 82.5% (0), 85% (+1); C: 0.7 mL/min (−1), 0.85 mL/min (0), 1 mL/min (+1) listed in
Table 4.
The Box–Behnken design matrix demonstrated consistent and reliable results (
Table 5), particularly evident from the replicated center point runs (Runs 3 and 4), which yielded identical values (Rmg = 1.258, Rgm = 1.036), and a third center point (Run 15) with a minor variation. The responses (Rmg: 1.017–1.320; Rgm: 0.986–1.330) indicated a strong influence of the experimental factors. The highest values for both responses were observed in Run 9 (T = 20 °C, Acetonitrile 85%, Flow = 0.85 mL/min), suggesting a synergistic effect of low temperature and high acetonitrile concentration. Lower flow rates (e.g., 0.7 mL/min in Run 14) also appeared to enhance Rmg, potentially due to increased residence time or improved mass transfer. The data supported a second-order model, as expected in Box–Behnken designs, showing evidence of nonlinear behavior and interaction effects between temperature, acetonitrile concentration, and flow rate. The near-identical values of Rmg and Rgm in several runs (e.g., Runs 2, 12, and 13) under different combinations of factors suggest possible factor interactions that offset each other, and stabilize the response. The center point replicates provide a good estimation of experimental error and confirm model reproducibility.
Notably, higher acetonitrile percentages (85%) generally led to improved Rgm values, likely due to enhanced solubility or better chromatographic behavior under these conditions. Flow rate also played a significant role, with lower values tending to increase Rmg, as seen in Runs 7 and 14, while excessively low flow (0.7 mL/min) sometimes diminished Rgm, possibly due to peak broadening. These trends highlight the importance of carefully balancing the three factors to achieve optimal response values, which will be further confirmed and quantified through regression analysis and response surface modeling.
3.2.1. Linear Model
A linear model with main effects can be expressed as:
where
Y represents the dependent variable,
β0 is the intercept,
β1,
β2,
β3, are the coefficients for the main effects of the variables
X1,
X2,
X3, and the term
ϵ denotes the error term.
The ANOVA results for the response variable Rgm indicate that the overall regression model is statistically significant, with an R2 value of 0.71579 and an adjusted R2 of 0.63827. The individual factor analysis showed that temperature and acetonitrile percentage have statistically significant effects on Rgm. The flow rate, however, is not a significant factor (p > 0.05).
From the regression coefficients, temperature had a negative effect on Rgm (β1 = −0.0536), meaning that increasing temperature tends to reduce Rgm values. Conversely, the acetonitrile percentage had a positive effect (β2 = 0.0384), indicating that higher acetonitrile concentrations lead to increased Rgm. The flow rate showed a positive coefficient (β3 = 0.085), but this effect is not statistically reliable due to its high standard error and non-significant p-value.
The linear model for the response variable Rmg showed a moderate fit, with an R2 value of 0.61588 and an adjusted R2 of 0.51112. The mean square of the residuals (0.005502) suggested acceptable variation remaining in the model.
According to the ANOVA table, acetonitrile percentage had a statistically significant positive effect on Rmg (p < 0.05), with a regression coefficient of β2 = 0.03115, indicating that the increase in acetonitrile concentration tends to increase Rmg values. The flow rate also showed a significant negative effect (p < 0.05), with a coefficient of β3 = −0.46167, indicating that higher flow rates are associated with a decrease in Rmg. In contrast, temperature did not have a statistically significant impact (p > 0.05), and its confidence interval included zero, suggesting its effect is not distinguishable from random error under the current model.
The linear model for Rmg suggested that acetonitrile concentration and flow rate are the key variables influencing Rmg, and their inclusion significantly improves the model’s explanatory power.
3.2.2. Linear Model with Main Effects Two Ways
A linear model with main effects and two-way interactions can be expressed as:
where
Y represents the dependent variable,
β0 is the intercept,
β1,
β2,
β3, are the coefficients for the main effects of the variables
X1,
X2,
X3, and
β12,
β13,
β23 represents the interaction between
X1,
X2,
X3. The term
ϵ denotes the error term.
The linear model with main effects two ways for the response variable Rgm demonstrated a relatively good fit, with an R2 of 0.74799 and an adjusted R2 of 0.55898, indicating that the total variability in Rgm is explained by the model, although the adjusted R2 suggests that the inclusion of several non-significant terms reduces its overall efficiency. According to the ANOVA results, temperature (p < 0.05) and acetonitrile concentration (p < 0.05) showed significant main effects, while the flow rate was not statistically significant (p > 0.05). However, in the regression coefficient output, none of the main effects showed statistical significance (all p > 0.05), likely due to high standard errors and multicollinearity caused by the inclusion of interaction terms, as reflected in the wide confidence intervals. Furthermore, none of the interaction terms (temperature×acetonitrile, temperature×flow rate, acetonitrile×flow rate) were statistically significant, with all p-values exceeding 0.05, indicating the absence of meaningful synergistic or antagonistic interactions between the examined factors. These results suggest that the variation in Rgm is primarily influenced by the linear effects of temperature and acetonitrile, as indicated by the ANOVA, while the overall model could benefit from simplification by removing non-significant interaction terms to enhance precision and interpretability.
The linear regression model for the dependent variable Rmg, based on three factors (temperature, acetonitrile, and flow rate) and their interactions, explains the total variability (R2 = 0.77465), with an adjusted R2 of 0.60564, indicating a moderate model fit. Among the linear terms, acetonitrile exhibits a statistically significant effect (p < 0.05), suggesting a meaningful contribution to the prediction of Rmg. The factor flow rate was also significant at the 5% level (p < 0.05), while the effect of temperature was not statistically significant (p > 0.05). None of the interaction terms reached statistical significance, although the interaction between temperature and flow rate approached the 10% significance level (p < 0.10), indicating a possible synergistic effect that may warrant further investigation. The relatively low mean square residual (MS = 0.0044381) suggests that the model captures the response variability well, though the wide confidence intervals for regression coefficients and large standard errors—particularly for flow rate and its interactions—point to a certain degree of imprecision and variability in the estimates.
The results suggested that acetonitrile was the most influential factor affecting Rmg under the conditions tested, while temperature and flow rate may have had weaker or more complex roles. The non-significant but borderline interaction between temperature and flow rate could indicate potential combined effects not fully captured by the current experimental design. The adjusted R2 indicated some overfitting, as the model lost its explanatory power when accounting for the number of predictors. Further refinement through model simplification or expansion of the dataset could help improve model reliability and interpretability. Validation through replication or external data testing is recommended to ensure the generalizability of these findings.
3.2.3. Quadratic Model
A quadratic model can be expressed as:
where
Y represents the dependent variable,
β0 is the intercept,
β1,
β2,
β3, are the coefficients for the main effects of the variables
X1,
X2,
X3, and
β12,
β13,
β23 represents the interaction between
X1,
X2,
X3. The term
ϵ denotes the error term.
The quadratic regression model for the response variable Rgm explained approximately 82.82% of the total variability in the data (R2 = 0.82817), indicating a good overall model fit. However, the adjusted R2 was substantially lower at 0.51889, suggesting that the inclusion of additional terms (quadratic and interaction) may not substantially improve model performance relative to model complexity, particularly due to the small sample size (15 runs).
Among the linear terms, the factor acetonitrile showed a statistically significant effect (p < 0.05), indicating it plays an important role in predicting Rgm. Temperature also contributed significantly in its linear form (p < 0.05), while the linear and quadratic terms for flow rate, as well as all interaction terms, were not statistically significant. The quadratic effects of temperature and acetonitrile were not significant either, with p-values of p > 0.05, respectively, suggesting slight curvature in their relationships with Rgm.
The model’s residual mean square (MS = 0.0060742) was acceptably low, but the high standard errors and wide 95% confidence intervals for regression coefficients—especially for linear and quadratic terms of flow rate—indicated high variability and low precision of these estimates, further implying that some terms may have been overfitted the data or affected by collinearity.
The quadratic model identified acetonitrile and temperature as the most influential factors in determining Rgm, primarily through their linear effects. The overall predictive robustness of the model was limited by the small sample size, non-significant higher-order terms, and wide confidence intervals, suggesting that a simpler linear model or additional data may yield more reliable and interpretable results.
The quadratic model for the response variable Rmg, based on three factors and their linear, quadratic, and two-way interaction terms, explained 83.2% of the total variability (R2 = 0.83208), though the adjusted R2 dropped to 52.98%, suggesting potential overfitting or the inclusion of non-informative terms. According to the ANOVA table, only the linear effects of acetonitrile (p < 0.05) and flow rate (p = 0.0432) were statistically significant at the 0.05 level, while all quadratic and interaction terms showed no significant contribution (p > 0.05). Although linear terms of acetonitrile and flow rate appeared to be significant in the ANOVA, their corresponding regression coefficients were not statistically significant, likely due to collinearity, limited degrees of freedom, or low statistical power stemming from the small sample size (15 runs). The mean square residual was low (0.005291), indicating minimal unexplained variance, but the inconsistency between the ANOVA and regression p-values suggested that the model may benefit from simplification by removing non-significant terms to improve interpretability and model parsimony.
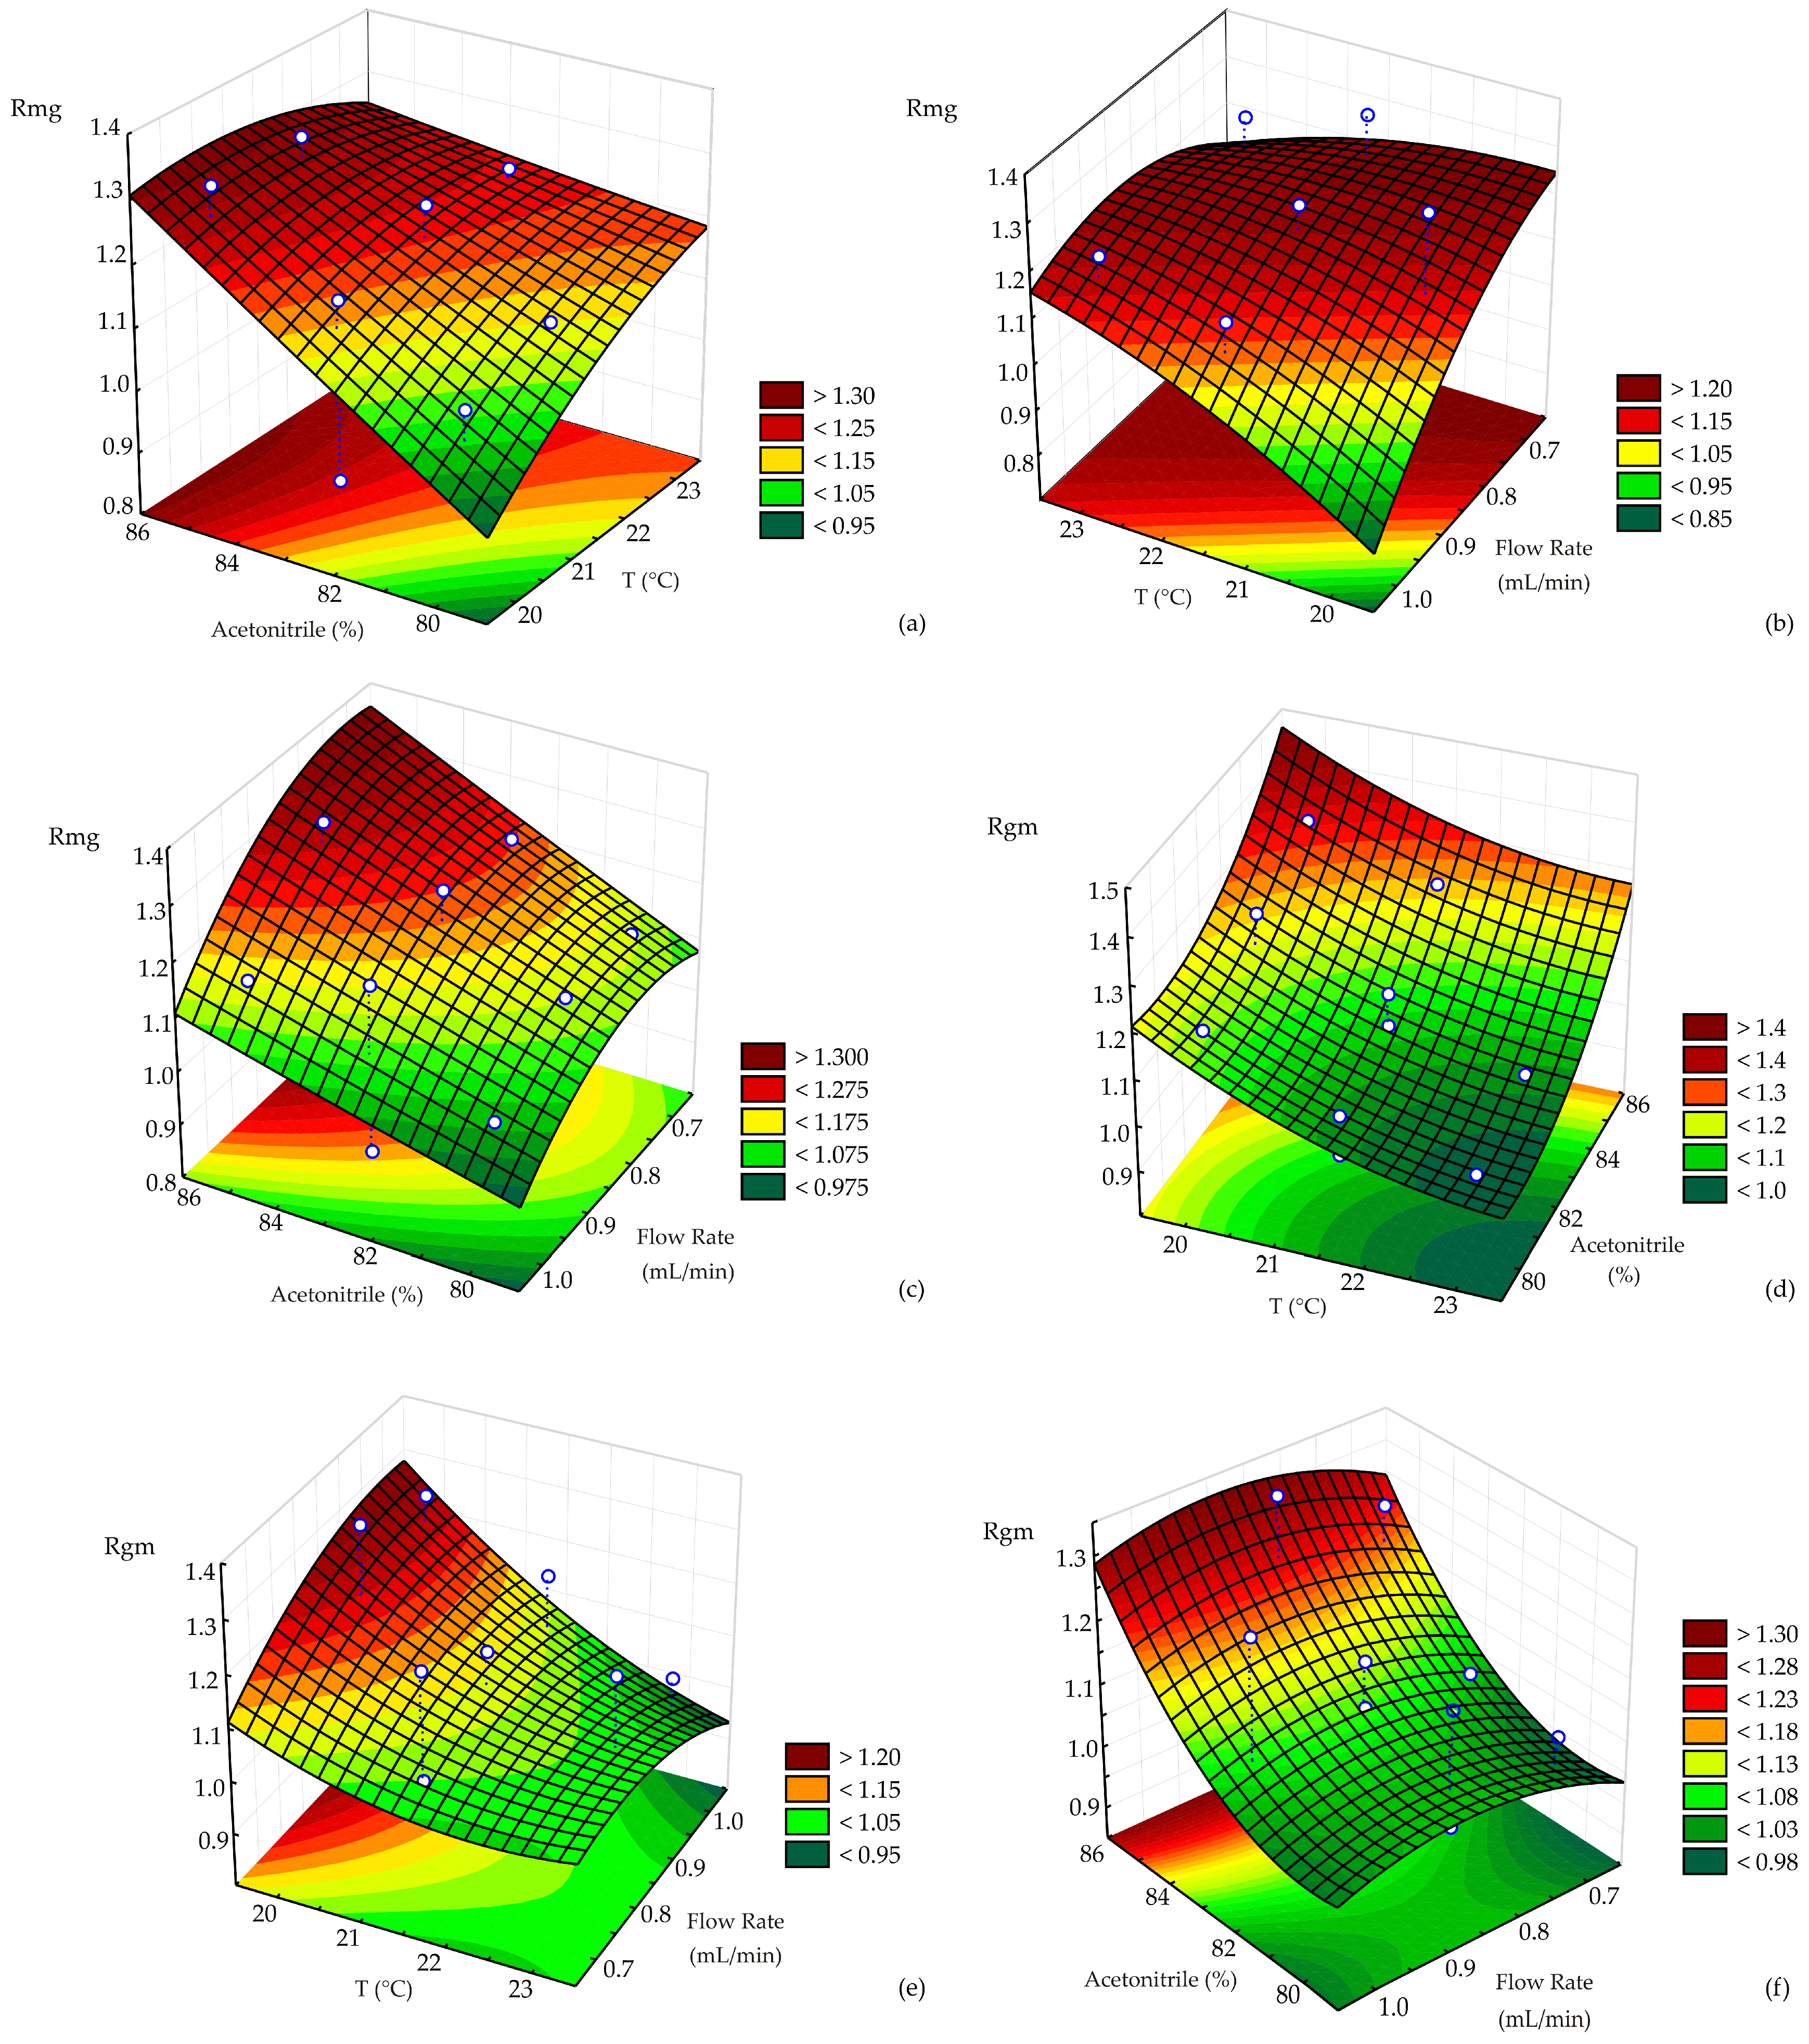
The effects and interactions of key process variables (temperature, acetonitrile, and flow rate) on Rmg and Rgm were visually presented using 3D surface plots, as shown in
Figure 5.
The critical value analysis for the response variable Rmg indicates a saddle point solution with a predicted value of 1.213, suggesting that this point is not a clear maximum or minimum but a transitional region on the response surface where the effect of variables changes direction. The critical values identified by the model were 24.04 °C for temperature, acetonitrile = 82.25%, and flow rate = 0.92 mL/min. While the acetonitrile and flow rate values lied within the experimental range (80–85% and 0.7–1.0 mL/min, respectively), the temperature slightly exceeded the tested maximum of 23 °C, indicating that further experiments at higher temperatures may help clarify the response trend. The saddle point nature implies that small changes in these variables could lead to either an increase or decrease in Rmg, depending on the direction, highlighting the significance of interaction effects between parameters in determining Rmg.
The critical value analysis for the response variable Rgm revealed a saddle point solution with a predicted value of 0.989, indicating a transitional zone on the response surface rather than a distinct maximum or minimum. The critical values determined by the model were temperature = 23.32 °C, acetonitrile = 79.74%, and flow rate = 0.76 mL/min. All three values lied within or very close to the boundaries of the experimental range, suggesting that the saddle point occurs near the edge of the tested conditions. The slight deviation of acetonitrile below the minimum and the proximity of temperature to the upper limit indicated that minor changes in these variables may significantly influence the Rgm response.
3.3. Mathematical Verification of the Models
The verification table compares the predictive performance of three models—Linear, Linear model with main effects two ways, and Quadratic—for two dependent variables (Rgm and Rmg) using multiple statistical metrics (
Table 6). Overall, the quadratic model demonstrated the best performance, followed by the linear model with interaction terms, and then the purely linear model.
For both Rgm and Rmg, the quadratic model yielded the lowest values of RMSE (0.045 and 0.042), MPE (3.549 and 3.191), and SSE (0.030 and 0.026), indicating higher accuracy and lower prediction error. The R2 values were also highest in the quadratic model (0.828 for Rgm and 0.832 for Rmg), confirming that this model explains the greatest proportion of variance in the observed data. Additionally, the χ2 values were lowest for the quadratic model (0.002 for both variables), further supporting its superior fit.
The mean bias error (MBE) was zero across all models and variables, indicating no systematic over- or under-prediction, and the mean percentage error (MPE) remained relatively low across all models, with the quadratic model again showing the smallest values (3.549 for Rgm and 3.191 for Rmg). The skewness and kurtosis values for the residuals were close to zero across all models, with no extreme departures from normality, although some negative kurtosis (platykurtic distribution) was observed.
The standard deviation (StDev) and variance (Var) of residuals were the lowest in the quadratic model, reflecting more consistent prediction errors.
3.4. Experimental Verification of the Models
The optimization was carried out with the objective of maximizing both Rmg and Rgm, as high resolution between these sugar pairs is critical for reliable quantification. Among the tested models, the quadratic model provided the best fit to the experimental data and allowed reliable prediction of factor–response relationships. The optimal chromatographic conditions identified (
Table 7), which yielded the highest simultaneous values of Rmg and Rgm. To interpret the optimization results statistically, the examination of each model’s predictions for Rmg and Rgm was aligned with experimental values; for the Linear model, the optimized Rmg (1.202) was somewhat higher than the experimental (1.151), while the optimized Rgm (1.184) closely matched the experimental (1.180) (
Table 7). Similarly, the Linear model with main effects two ways model showed a higher optimized Rmg (1.267) compared to the experimental (1.151) and a slightly lower optimized Rgm (1.147) than the experimental (1.180). In contrast, to these results, the Quadratic model’s optimized Rmg (1.208) was closer to its experimental counterpart (1.171), while its optimized Rgm (1.163) also closely approximated the experimental value (1.155), with the added distinction of an optimized flow rate of 0.766 mL/min compared to the fixed 0.7 mL/min for the other models (
Table 7).
Based on the closeness of the optimized values to the experimental values, the Linear and Quadratic models showed promising fits for Rgm, while the Quadratic model appeared slightly better for Rmg. To statistically validate these observations, the MSE and RMSE values were calculated for each model. For the Linear model, the MSE was 0.003 for Rmg and 0.000 for Rgm, resulting in RMSE values of 0.053 and 0.004, respectively. The Linear model with main effects and the two-way model exhibited higher errors, with an MSE of 0.014 for Rmg (RMSE 0.118) and 0.0011 for Rgm (RMSE 0.033), indicating a less accurate fit. Notably, the Quadratic model demonstrated the lowest errors for Rmg, with an MSE of 0.0013 and RMSE of 0.036, and also a low MSE of 0.000 (RMSE 0.009) for Rgm. These statistical metrics confirm that the Quadratic model generally provides the best fit to the experimental data for both Rmg and Rgm, while the Linear model performs comparably well for Rgm, and the Linear model with the main effects two-way model exhibits the poorest predictive capability among the three models.
3.5. Chromatographic Separation and Sugar Composition Analysis
The developed method was applied to a real sample of wild sunflower (
Helianthus annuus L.) nectar. The Box–Behnken linear model-optimized parameters (column temperature: 20 °C; flow rate: 0.7 mL/min; mobile phase: acetonitrile/water 82.5:17.5,
v/
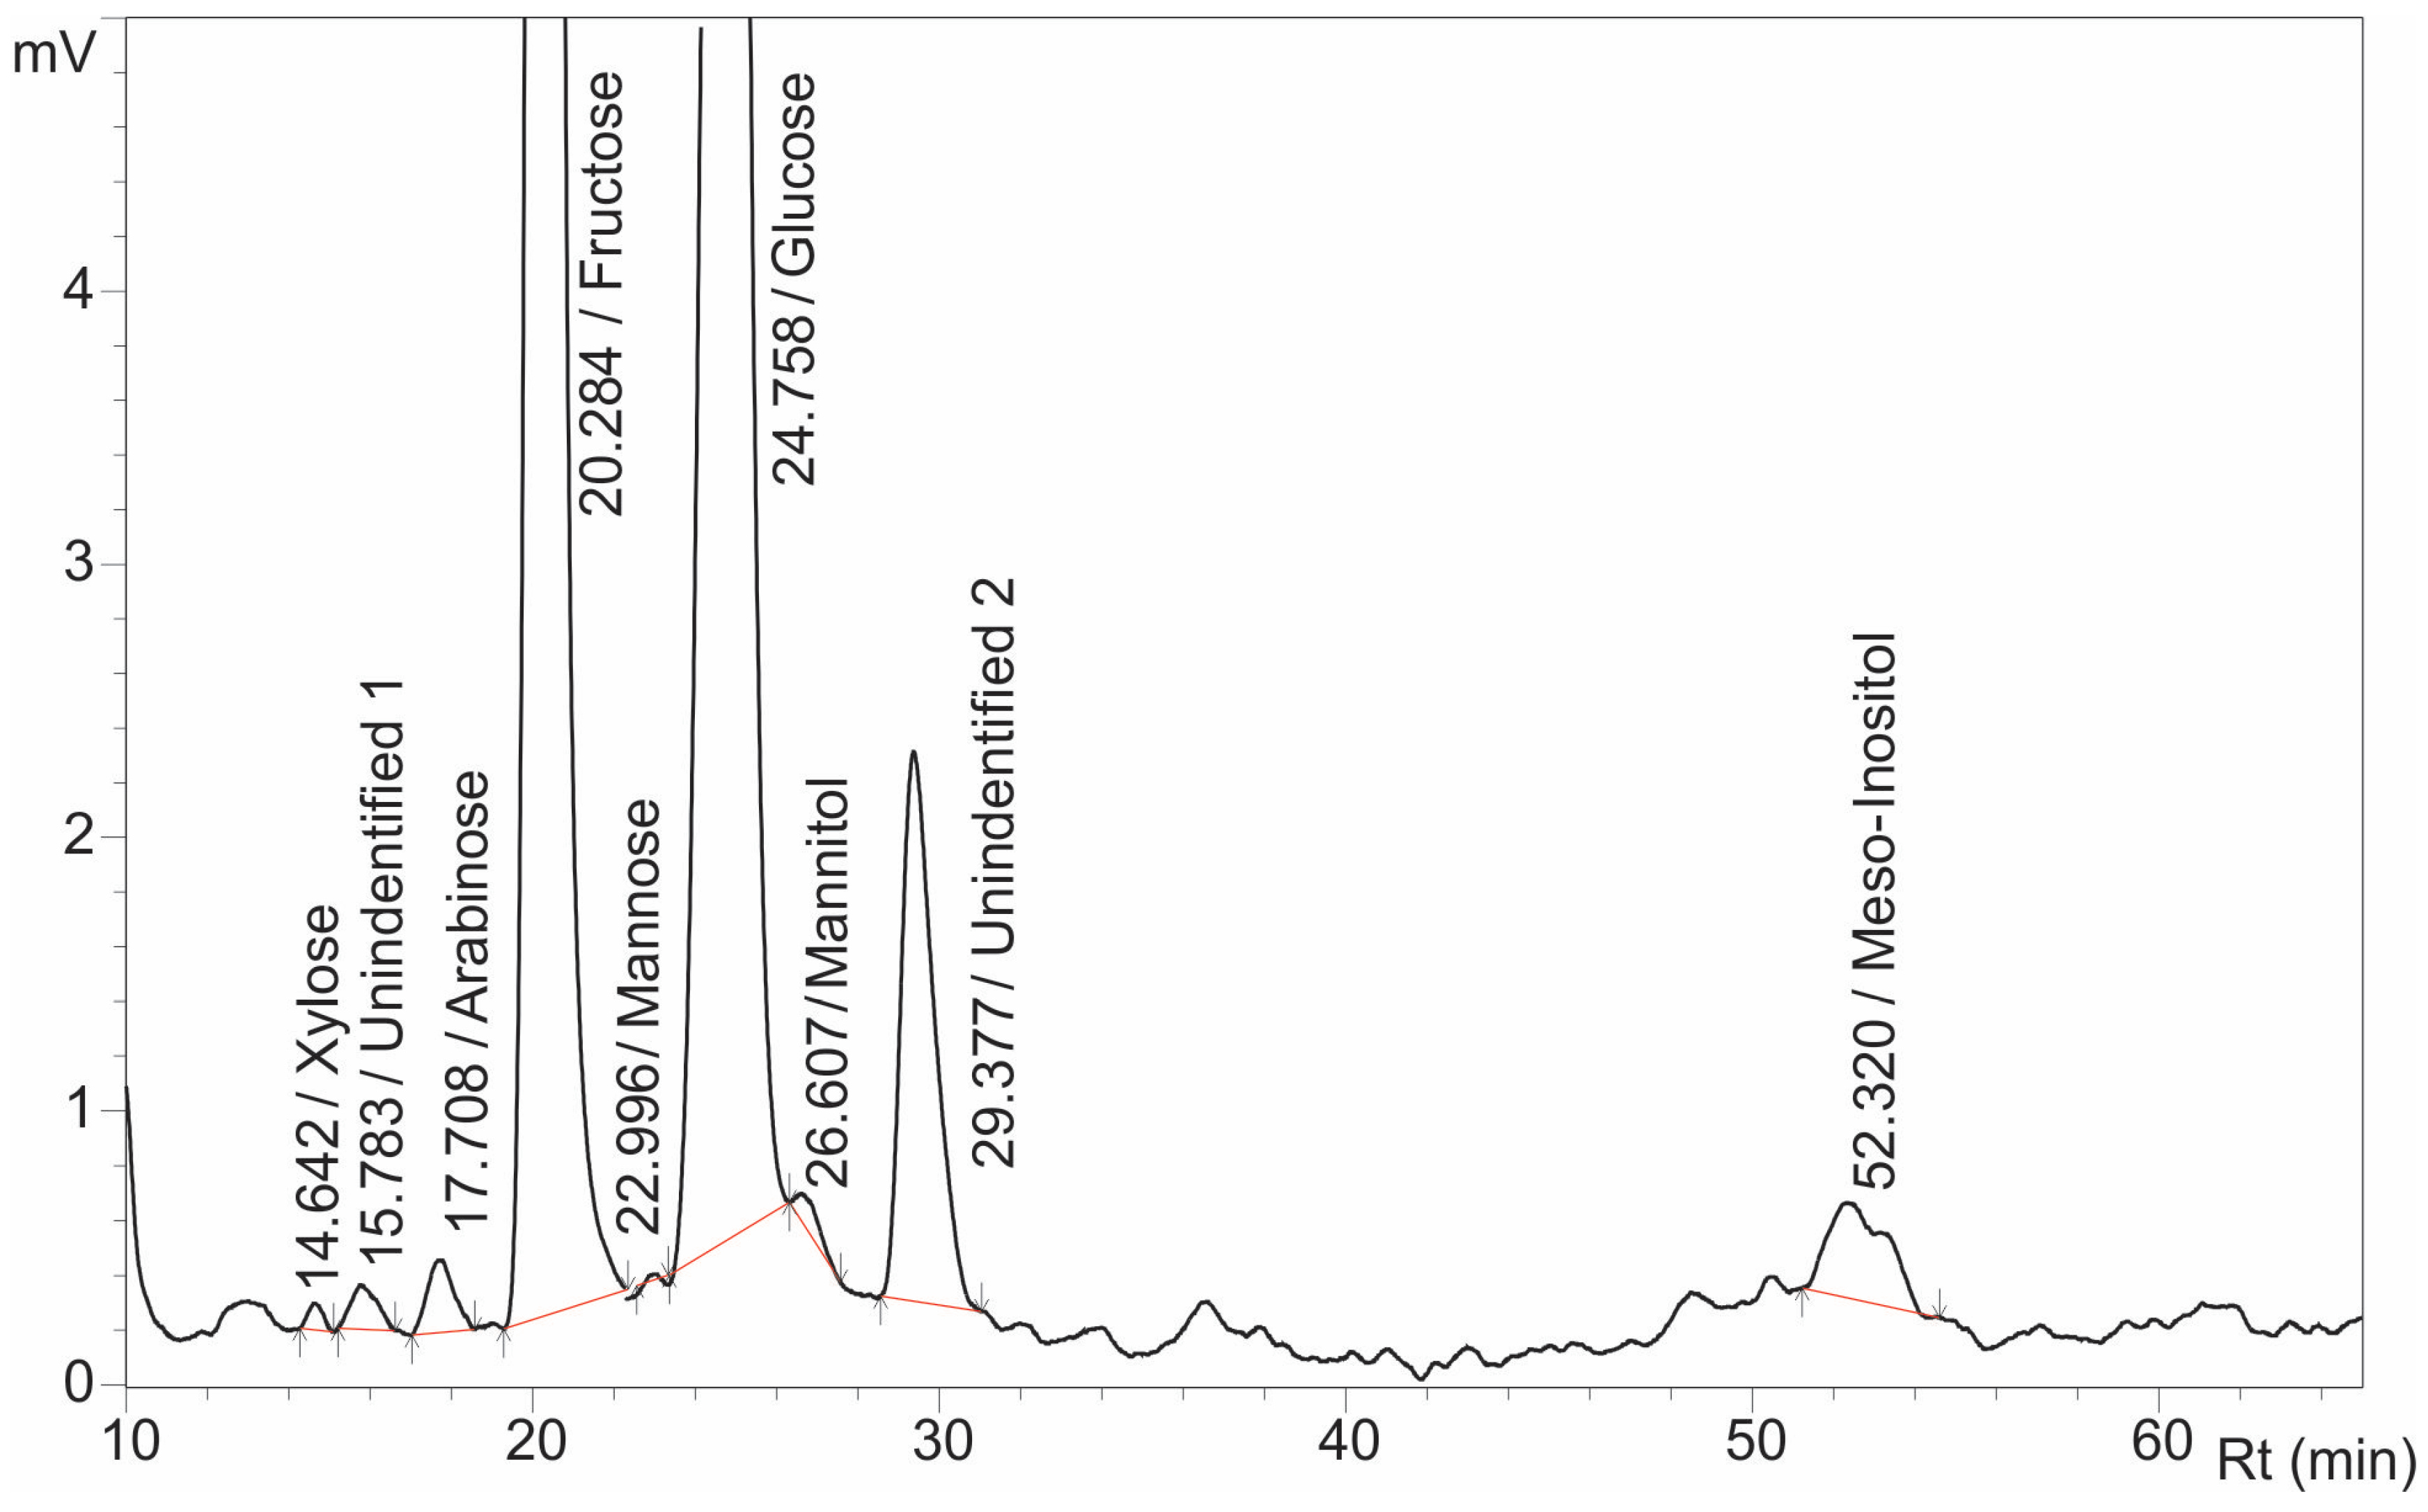
v) yielded chromatograms with nine resolved peaks, as shown in
Figure 6. Seven sugars were identified: arabinose,
meso-inositol, xylose, fructose, mannose, glucose, and mannitol (two peaks remained unassigned). Resolution values for critical pairs—mannose/glucose (Rmg = 1.47) and glucose/mannitol (Rgm = 1.30)—exceeded the baseline separation threshold (Rs > 1) for all components (
Table 8).
Quantitative analysis revealed a hexose-dominated profile: fructose (4914.341 mg/L) and glucose (4506.217 mg/L) constituted the primary sugars, while sucrose was undetected. Fructose accounts for 50% of the total sugars, closely followed by glucose at 48.9%, consistent with the findings of Bergonzoli et al., 2022 [
22]. Trace amounts of stress-associated mannitol (33.677 mg/L) comparable to levels in non-hybrid sunflower nectar (Bergonzoli et al.), indicated the exposure to drought stress during flowering and likely reflected an adaptive plant response [
7,
16,
17,
18,
66,
67]. Minor sugars included arabinose (164.818 mg/L), xylose (35.039 mg/L), and mannose (27.144 mg/L)—compounds known to affect pollinator attraction and toxicity [
10,
21]. In addition to mannitol, a notable concentration of
meso-inositol (140.738 mg/L) was detected. This cyclitol is rarely reported in nectar but is frequently found in honey [
68]. The occurrence of mannitol, sorbitol, and cyclitols such as
meso-inositol is often linked to extreme abiotic stress, as these compounds contribute to plant protection against water deficit, salinity, frost, and osmotic stress [
69,
70,
71]. Further studies are needed to clarify how temperature, rainfall, and soil composition shape nectar sugar profiles.
3.6. Linearity
To determine the linearity of the HPLC method, a series of standard solutions were prepared with concentrations ranging from 50 mg/L to 500 mg/L for arabinose, xylose, mannose, mannitol, and
meso-inositol, and from 50 mg/L to 5500 mg/L for fructose and glucose (
Table 9). Calibration curves were constructed by plotting the peak area against the initial concentration of each sugar standard solution.
Linearity was evaluated with six-point calibrations over 50–500 mg/L for most sugars and sugar alcohols, and 50–5500 mg/L for fructose and glucose. Calibration curves exhibited strong correlation coefficients (R = 0.985–0.999), with fructose, arabinose, xylose, and mannose (R > 0.995) meeting stringent validation criteria (
Table 9). Although mannitol (R = 0.994) and
meso-inositol (R = 0.992) slightly deviated from the 0.995 threshold, their performance remained analytically acceptable. Maltose (R = 0.985) indicated potential matrix interference, warranting method refinement.
The LOD and LOQ values were determined to assess the method’s sensitivity, using a dilution series followed by replicate measurements at the lowest detectable concentration (
Table 10). Five replicate measurements at the minimum detectable concentration were used to calculate the limit of detection (LOD) and limit of quantitation (LOQ), defined as three and ten times the standard deviation, respectively [
67,
72]
The LOD values for the analyzed sugars and alcohols ranged from 4.037 mg/L (glucose) to 19.461 mg/L (mannose), while LOQ values varied between 13.456 mg/L and 194.610 mg/L. The detection and quantification limits were lowest in glucose, whereas mannose had the highest.
Accuracy was evaluated using six different concentrations of sugar and sugar alcohol, with each concentration injected in triplicate. Recoveries were calculated to assess the accuracy in laboratory-prepared mixtures, ranging from 90.177% to 106.906%, which is consistent with AOAC (1993) guidelines [
73]. The results are presented in
Table 11.
Intra-day precision was assessed using three mixtures (50, 300, and 500 mg/L) of the tested sugars and sugar alcohols, with %RSD values below 1%. Inter-day precision was evaluated over three consecutive days using the same concentrations, yielding %RSD values below 2%.
