Article

Experimental Study on Spatiotemporal Evolution Mechanisms of Roll Waves and Their Impact on Particle Separation Behavior in Spiral Concentrators

1
School of Mechanical and Electrical Engineering, Jiangxi University of Science and Technology, Ganzhou 341000, China
2
School of Mechanical and Electronic Engineering, Jiangxi College of Applied Technology, Ganzhou 341000, China
3
Jiangxi Mining and Metallurgical Mechanical and Electrical Engineering Technology Research Center, Ganzhou 341000, China
*
Author to whom correspondence should be addressed.
Separations 2025, 12(9), 245; https://doi.org/10.3390/separations12090245
Submission received: 20 July 2025 / Revised: 28 August 2025 / Accepted: 2 September 2025 / Published: 8 September 2025

Abstract

Spiral concentrators are gravity and centrifugal force-based devices designed for mineral concentration. During processing operations, dynamic variations in the slurry’s liquid film thickness can induce hydrodynamic instability, generating roll waves on the free surface that compromise particle separation efficiency. To ensure operational stability and efficacy, this study establishes a theoretical shallow-water flow model for slurry dynamics in spiral concentrators based on hydraulic principles. Through L27(313) orthogonal experiments and real-time ultrasonic film thickness monitoring, the influence of key parameters on roll wave evolution is quantified. Results indicate that roll waves follow an “instability-development-dissipation” sequence. The pitch-to-diameter ratio (P/D) exerts a highly significant effect on roll wave intensity, while particle properties (density and size) exhibit moderate significance. In contrast, feed flow rate and solid concentration show negligible impacts. Roll waves amplify fluid turbulence, triggering stochastic migration of particles (especially low-density grains), which increases the standard deviation of zonal recovery rates (ZRR) and degrades separation precision. This work provides critical insights into particle behavior under roll wave conditions and offers a theoretical foundation for optimizing spiral concentrator design and process control.

1. Introduction

Spiral concentrators are pivotal film-flow-based mineral processing devices, renowned for their advantages, including low energy consumption, pollution-free operation, high separation efficiency, and broad applicability across particle size ranges. Consequently, they are extensively utilized in the beneficiation of metallic ores such as chromite, tungsten, and magnetite, as well as non-metallic minerals like coal [1,2,3,4]. During the separation process, spiral inclined flow represents the dominant flow regime within the concentrator. Under the coupled effects of centrifugal, frictional, and gravitational forces, both a primary flow (the main slurry stream longitudinally descending the groove) and a secondary flow (a transverse annular circulation across the groove) develop within the liquid film [5,6]. The synergistic action of these two flow patterns induces differential movement of particles based on density within the slurry [7,8]: higher-density particles concentrate towards the inner region of the spiral groove, while lower-density particles migrate towards the outer region, thereby achieving effective density-based separation and stratification [9,10,11]. It is evident that the characteristics of the flow field during separation directly influence the effectiveness of particle segregation. Consequently, investigating the flow field characteristics within spiral concentrators is paramount for enhancing separation efficiency.
To date, research methodologies for characterizing the flow field in spiral concentrators primarily include theoretical modeling, physical measurement, and numerical simulation. Concerning theoretical modeling, given the complexity of the spiral separation process, researchers often introduce assumptions of steady flow and thin films to simplify the governing equations [12,13,14]. However, existing theoretical models are primarily applicable to steady-state conditions and possess limited capability for analyzing dynamically evolving flow fields. Physical measurement is considered a reliable means of acquiring flow field characteristics. For instance, Lingguo Meng employed Laser Doppler Anemometry (LDA) to calibrate the water–air interface position and subsequently measure film thickness [15]; Guichuan Ye established a water depth test rig, utilizing multiple probe sets to synchronously measure water depth at various radial positions along the groove [16]; PR Ankireddy conducted experiments with pure water in two spiral concentrators of different geometries, measuring fluid depth and free-surface velocity under varying flow conditions using depth probes and high-speed cameras [17]; Thomas Romeijn utilized 3D-printed free-surface sampling fixtures to comparatively analyze the free-surface morphology of three fluids: pure water, hematite slurry, and magnetite slurry, for the first time [18]. In summary, while these measurement techniques effectively capture transient flow field information at specific instants, they struggle to capture the continuous temporal evolution of film thickness or velocity at fixed points, failing to provide dynamic flow field parameter data over continuous time scales. In summary, while these measurement techniques effectively capture transient flow field information at specific instants, they struggle to capture the continuous temporal evolution of film thickness or velocity at fixed points, failing to provide dynamic flow field parameter data over continuous time scales.
In recent years, numerical simulation methods have been widely adopted to study the flow state within spiral concentrators. For example, Purushotham Sudikondala applied a CFD model combining the Volume of Fluid (VOF) and Reynolds Stress Model (RSM) to predict flow stability and water depth distribution across different spiral turns [19]; Lingguo Meng employed an Eulerian multi-fluid VOF model incorporating the Bagnold effect and a lift model to simulate changes in the liquid free surface under high-concentration conditions [20]. Such studies, often analyzing parameters like turbulence intensity or Reynolds number, typically categorize the flow state within spiral concentrators as follows: turbulent flow in the outer groove, laminar flow in the inner groove, and laminar or transitional flow in the middle groove [21]. However, the present study finds that the flow in the inner- and middle-groove regions is not strictly laminar. The liquid film thickness in this zone exhibits quasi-periodic fluctuations, with clearly observable ripple structures on the free surface that continuously evolve over time (as shown in Figure 1). Furthermore, the morphology of these surface ripples varies under different operating conditions (e.g., groove cross-section dimensions, mineral type, feed flow rate). GK Loveday [22] referred to the surface waves forming in the radial zones of the groove as “bulges”, proposing that these bulges weaken the outward driving force of the secondary flow, thereby reducing particle separation efficiency. Overall, current research in mineral processing on liquid film thickness within spiral concentrators predominantly focuses on transient analysis. For special flow field manifestations like surface waves, which represent continuous variations in film thickness, their formation mechanisms, dynamic characteristics, and their influence on particle motion behavior remain inadequately explored and lack systematic, in-depth investigation.
The structure of a spiral concentrator resembles a spiral-shaped inclined open channel. To address the phenomenon of free-surface waves occurring in spiral inclined flow, we draw upon relevant research in hydraulics concerning open-channel flow over slopes. In hydraulic studies, such surface waves are defined as roll waves [23,24]. Research indicates that roll waves are periodic undulations formed by the destabilization of the free surface in shallow water flow within open channels [25,26]. The presence of roll waves not only causes fluctuations in the free liquid surface but also significantly enhances inter-layer shear within the fluid [27] and intensifies oscillatory forces within the water body [28]. Thomas [29] pioneered the theoretical analysis of large-amplitude roll waves, deriving discontinuous analytical solutions for their evolution equations. Guilherme H. Fiorot [30] utilized an experimental setup with ultrasonic sensors to quantify the frequency and energy characteristics of roll wave disturbances. Chen’s flume experiments [31] observed that roll wave form, velocity, and period all exhibit dynamic variations. Zanuttigh [32] applied the Weighted Average Flux (WAF) method to solve the one-dimensional shallow water equations, successfully simulating the evolution of natural roll waves in a rectangular channel and revealing that wave merging leads to increased wave intensity. Jianbo Fei et al. [33] identified three distinct stages of roll wave propagation (initiation, maturation, and decay) through numerical simulation and elucidated the variation patterns of wave peak values during each stage.
In summary, hydraulic research on roll waves in open-channel shallow flow is relatively mature, encompassing instability theory models, evolution laws, numerical simulations, and experimental methodologies. However, the governing equations for standard open-channel shallow flow cannot be directly applied to spiral concentrators. The reasons are twofold: (1) Spiral concentrators involve rotational effects, necessitating consideration of centrifugal force-induced secondary circulation; (2) The flowing medium within spiral concentrators is mineral slurry, where shear flow induces drag forces between particles and fluid, and particle–fluid interactions significantly influence flow field characteristics. Therefore, this study proposes an innovative research framework: First, it introduces modified shallow-water equations for the dynamic modeling of slurry flow in spiral concentrators to identify key state parameters influencing continuous variations in film thickness (i.e., roll wave dynamic morphology). Second, construct a fluid film thickness monitoring system to continuously capture the spatiotemporal evolution of roll waves under different state parameters, employing multivariate statistical methods to quantitatively analyze the significance of these parameters on roll wave characteristics. Finally, quantitatively analyze the influence mechanisms between roll waves and mineral particle migration.

2. Theoretical Model

The thickness of the liquid film is closely related to the structure of the spiral concentrator. The spiral concentrator can be conceptualized as a curved surface structure composed of multiple helical paths with varying pitch angles [34,35]. As illustrated in Figure 2, the spiral groove exhibits variations in both transverse and longitudinal inclination angles. In this study, the transverse inclination angle is denoted as α , and the longitudinal inclination angle as β . When the cross-sectional profile of the groove bottom follows a cubic parabola, the two angles can be calculated as follows:
  tan β = P 2 π r
tan α = H m a x r o r i tan arc sin r r i r o r i
D = 2 r o
where P denotes the pitch, D represents the maximum diameter of the spiral concentrator, H m a x is the maximum depth of the groove, r i is the inner radius, r o is the outer radius, and r refers to the radial distance from any point on the groove surface to the central axis. It can be inferred that the morphological characteristics and evolution behavior of roll waves vary significantly at different radial positions within the concentrator. This study selects a single helical path, stretches it into a planar configuration, and establishes a right-handed Cartesian coordinate system: the X-axis aligns with the primary flow direction (longitudinal) of the groove (inclined at the slope angle β to the horizontal plane), the Y-axis corresponds to the groove width direction (transverse), and the Z-axis is normal to the surface (denoted as the O-XYZ coordinate system).
When the slurry fluid flows downward along the inclined groove and its depth h is significantly smaller than its characteristic transverse dimension (satisfying the shallow-water flow condition), an average-depth model for the slurry medium—namely the shallow-water equations—can be derived by integrating the three-dimensional Navier–Stokes equations along the depth direction [33]. Given that the separation medium within the concentrator is slurry, additional considerations for the drag effect between particles and fluid, as well as the influence of centrifugal force-induced secondary circulation, are necessary. Based on this, the established shallow-water equations for slurry flow in spiral concentrators are as follows:
  h t + U x + V y = 0
U t + x U 2 h + y U V h = 1 2 g h 2 cos β x + g sin β · h + μ h 2 u ¯ x 2 τ b x ρ + f d x ρ
V t + x U V h + y V 2 h = 1 2 g h 2 cos β y + μ h 2 v ¯ y 2 τ b y ρ + U 2 h r + f d y ρ
where h   is the water depth (liquid film thickness). u ¯ is the depth-averaged velocity of the slurry fluid in the X-direction. v ¯ is the depth-averaged velocity of the slurry fluid in the Y-direction. β is the slope angle of the spiral concentrator. r is the radius of curvature of the groove. μ is the fluid viscosity. f d x and f d y are the drag forces per unit volume between the liquid and particles in the X and Y directions, respectively. U is the unit-width discharge in the X-direction, typically related by U = h u ¯ . V is the unit-width discharge in the Y-direction, typically related by V = h v ¯ . τ b x and τ b y are the bed shear stress components, representing the bed friction resistance along the longitudinal (X-axis) and transverse (Y-axis) directions, respectively. Their expressions are as follows:
  τ b x = ρ C f U h U h 2 + V h 2
τ b y = ρ C f V h U h 2 + V h 2
where C f is the bed friction coefficient, dependent on the material of the spiral concentrator. The drag force terms f d x and f d y are expressed as follows:
  f d x = 3 4 C D φ ρ l h d p u p ¯ u ¯ u p ¯ u ¯
f d y = 3 4 C D φ ρ l h d p v p ¯ v ¯ v p ¯ v ¯
where C D is the drag coefficient, a dimensionless number determined by the Reynolds number (Re). φ is the volume fraction of solid particles. d p is the particle diameter. u p ¯ and v p ¯ are the averaged particle velocities in the X and Y directions, respectively. ρ is the slurry density, given by the following:
  ρ = 1 φ ρ l + φ ρ p
where ρ l is the liquid phase density. ρ p is the solid particle density. Furthermore, the solid volume fraction φ and the solid mass fraction C w can be interconverted using the following relationship:
  φ = C w / ρ p C w / ρ p + 1 C w / ρ l
It should be noted that when the solid mass fraction in the pulp is high (typically above 25–30%), the Bagnold force generated by interparticle collisions will significantly affect the rheological behavior and film stability [36]. The magnitude of the Bagnold force depends mainly on shear rate, particle concentration, particle size, and density. Although the shallow water equations established in this study do not explicitly introduce a Bagnold stress term, parameters such as solid particle density ρ p , viscosity μ , particle diameter d p , and solid mass fraction C w have been incorporated, which essentially capture the dominant mechanisms of this stress. Therefore, the model in this study remains capable of effectively predicting dynamic changes in film thickness even in high-concentration pulp.
In summary, the shallow-water equations reveal that the liquid film thickness h is intrinsically linked to key state parameters within the model, including β , r , ρ , d p , μ , C f , C w , U and V .

3. Orthogonal Design and Experiments

3.1. Orthogonal Design

Orthogonal experimentation is a multi-factor, multi-level optimization design method based on the principle of orthogonality, enabling the efficient screening of representative test points [37,38]. This method is particularly well-suited for quantitatively analyzing the influence degree and significance level of key parameters (identified by the model in Section 2) on roll wave characteristics. The modified shallow-water equations reveal that the liquid film thickness of the slurry fluid within the spiral concentrator is closely related to numerous variables: β (slope angle), r (radius of curvature), ρ (slurry density), μ (slurry viscosity), C f (bed friction coefficient), C w (solid mass fraction), d p (particle diameter), U (longitudinal unit-width discharge), and V (transverse unit-width discharge). Given the multitude of influencing factors, simplification through variable integration and substitution is necessary:
Parameters β and r , being structural parameters of the spiral concentrator, can be comprehensively expressed by the pitch-to-diameter ratio ( P / D ). Parameter ρ depends on the liquid phase density and solid particle density. In this experiment, the liquid phase is water with constant density, while ρ p varies with mineral type. Therefore, the solid particle density ρ p is used to represent the slurry density ρ . Parameters U and V can be correlated and characterized by the inlet feed flow rate Q . Given a specific slurry composition, solid mass fraction, and particle size distribution, the slurry viscosity can be considered relatively constant. Furthermore, spiral concentrators are typically constructed from alumina, making the bed friction coefficient effectively constant for a fixed material. Consequently, parameters μ and C f are not treated as independent influencing factors in this experimental system. Based on the above variable substitution and simplification strategy, five key influencing factors were ultimately selected for orthogonal experimental design: Pitch-to-diameter ratio ( P / D ), Average density of pulp particles ( ρ p ), Particle diameter ( d p ), Solid mass fraction ( C w ), and Inlet flow rate ( Q ). Preliminary single-factor pre-experiments established reasonable value ranges for different levels of each factor. The solid particle density represents the average density of the slurry particles. Three representative slurry systems were selected: a mixed slurry of quartz and magnetite (mass ratio 1:1), a pure magnetite slurry, and a pure quartz slurry. Specific combinations are detailed in Table 1.
This study employs a five-factor, three-level orthogonal analysis method. Orthogonal tables are commonly denoted as L N j i , where L signifies the orthogonal table, N is the total number of experiments, j is the number of levels, and i is the number of factors (including empty columns). To fully account for orthogonality between different factors and enhance analysis precision, the orthogonal table L 27 3 13 was chosen to analyze the influence of multiple factors on the dynamic variation in liquid film thickness. This table includes eight empty columns. The specific orthogonal design is presented in Table 2.

3.2. Measurement and Analysis of Roll Waves in Spiral Concentrators

3.2.1. Experimental Setup and Slurry Preparation

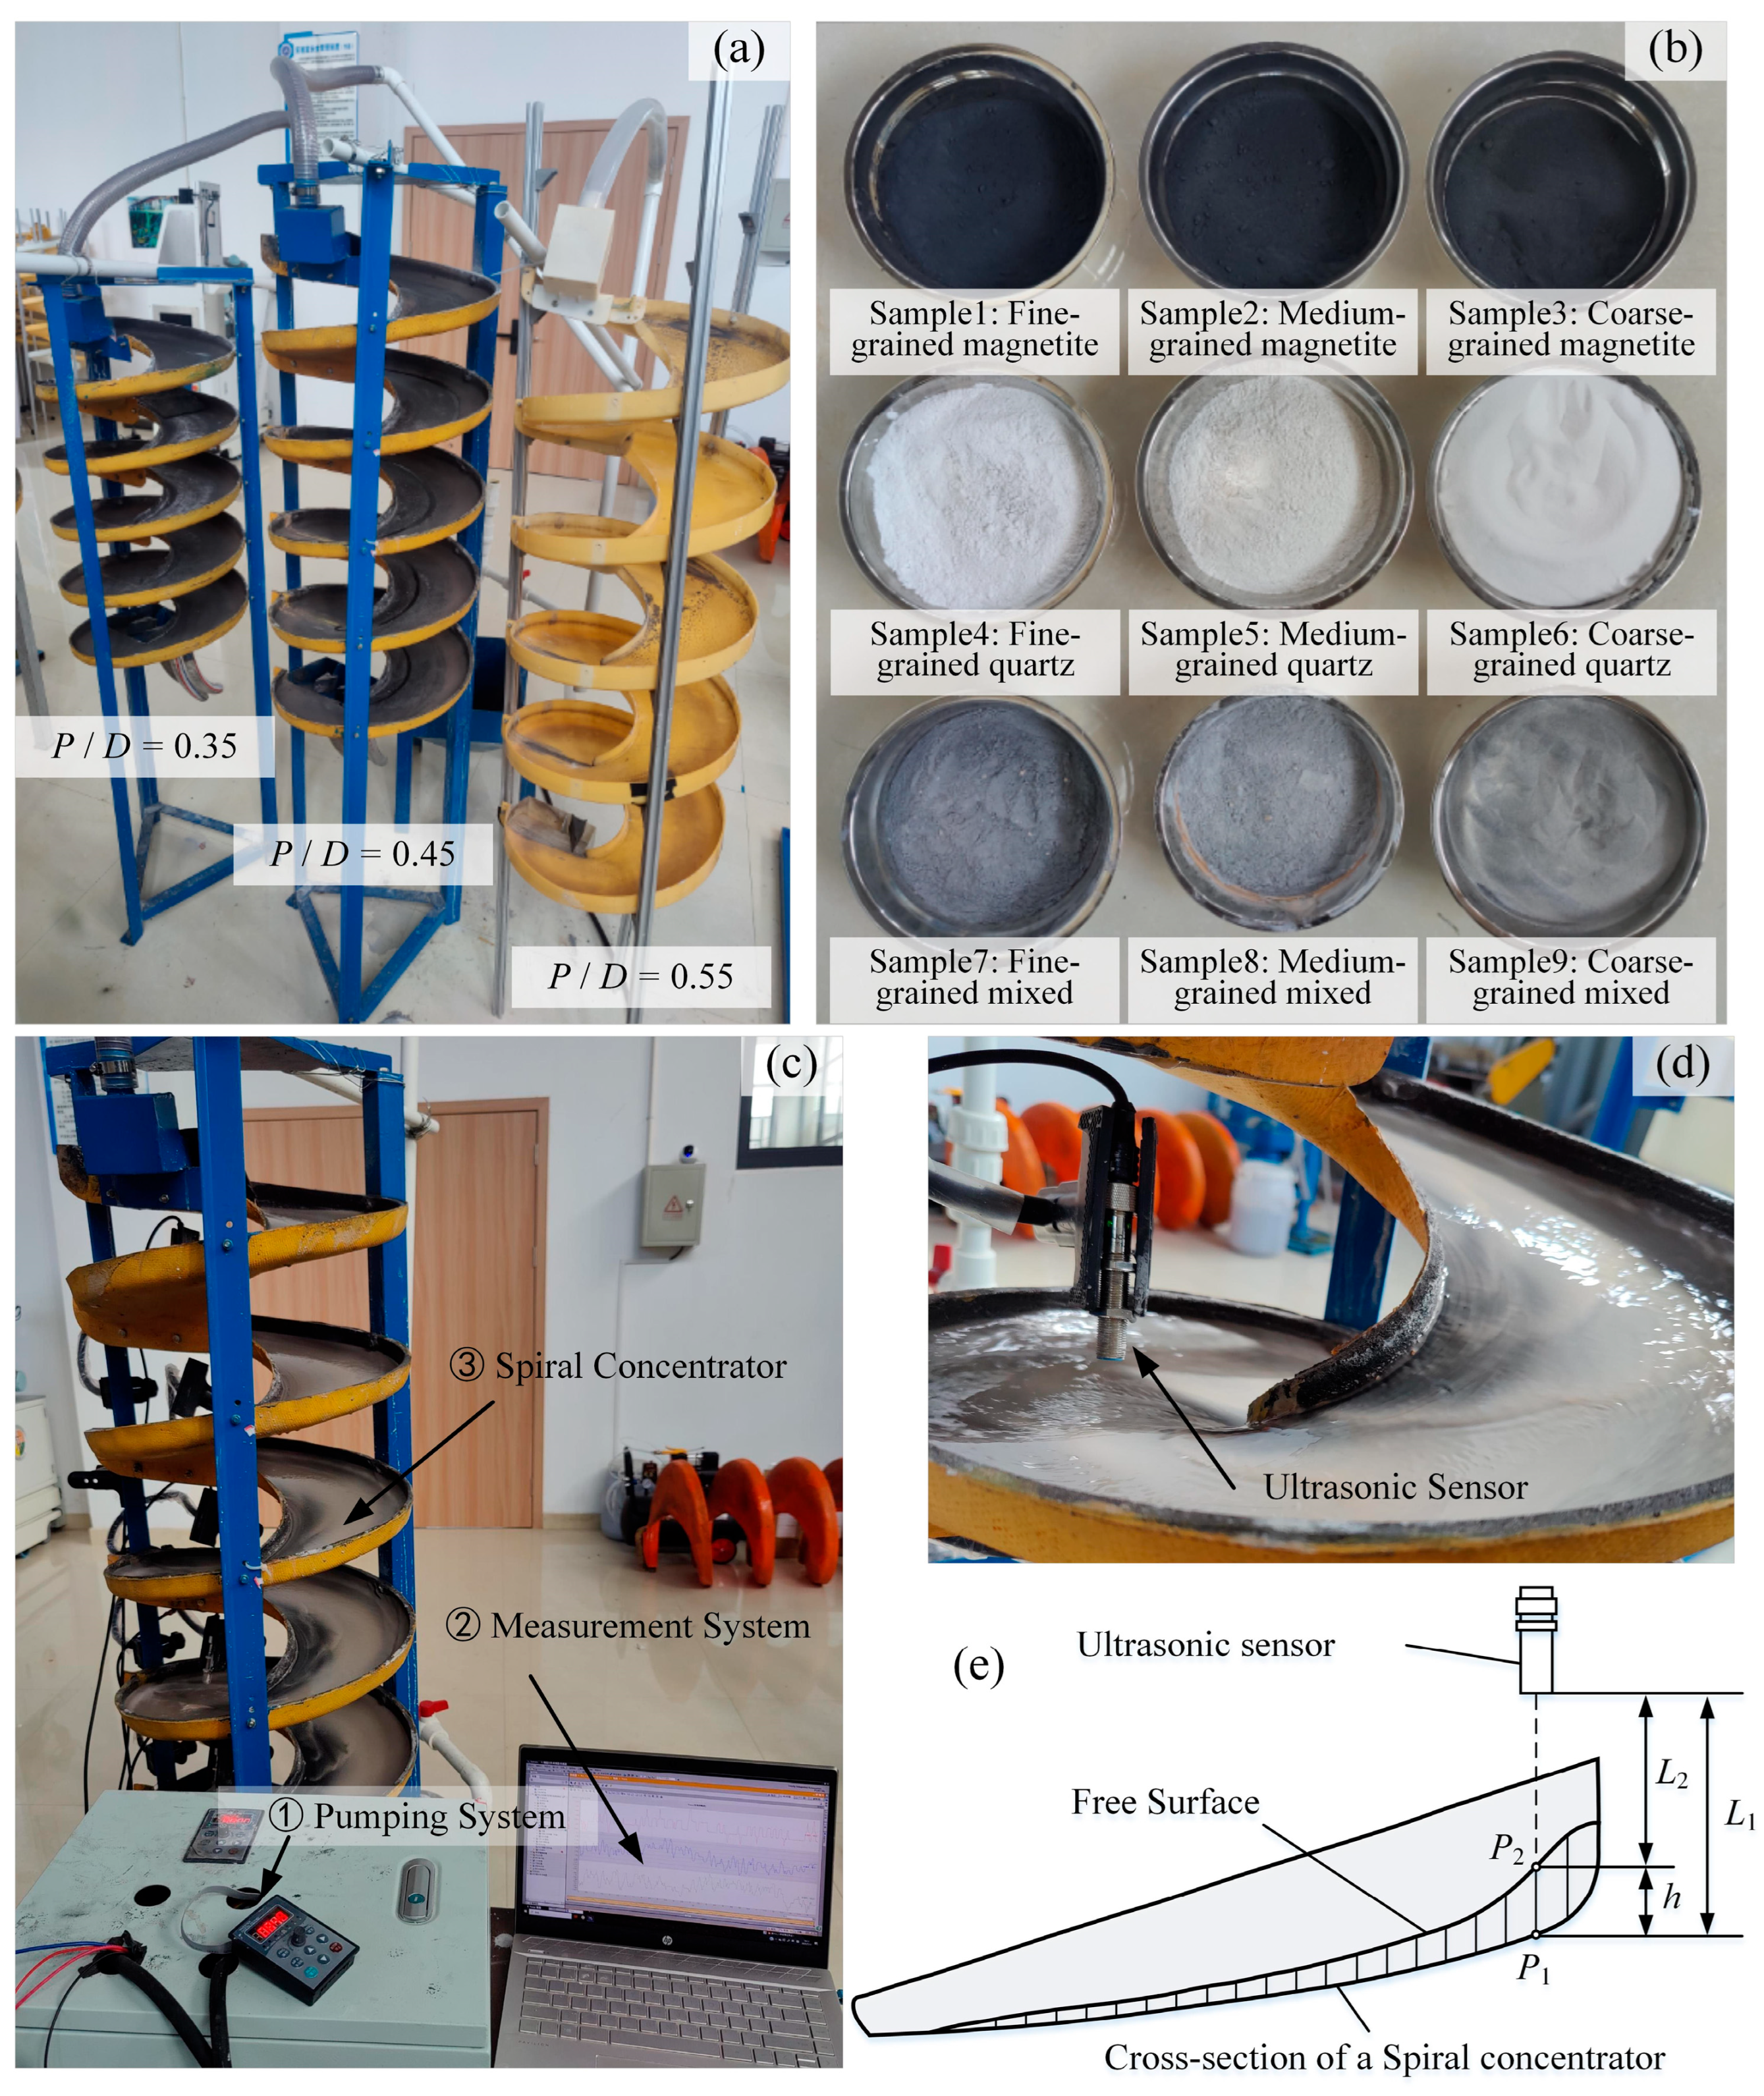
The spiral concentrator used in the experiments is shown in Figure 3a, with the following specifications: diameter 400 mm, transverse inclination angle 9°, and effective separation turns 5. The pitch-to-diameter ratio ( P / D ) was set at three levels: 0.35, 0.45, and 0.55. The ore materials, shown in Figure 3b, include quartz, magnetite, and a 1:1 mass mixture of both. The particle size distribution of the solid samples is detailed in Table 3. The samples were classified into three distinct size fractions: a fine fraction (d50 ≈ 22–23 μm), a medium fraction (d50 ≈ 58–59 μm), and a coarse fraction (d50 ≈ 96–97 μm). Additionally, all quartz and magnetite samples were obtained from the same ore deposit and processed through the same grinding-classification system. This ensured consistent particle morphology across all samples, which was predominantly sub-angular to sub-rounded, with a sphericity estimated to be between 0.5 and 0.7.
To precisely measure the liquid film thickness under different operating conditions, an experimental platform was constructed as illustrated in Figure 3c. The platform primarily consists of a pumping system, a measurement system, and the spiral concentrator. The pumping system regulates the feed flow rate at the inlet: during operation, a flow meter installed on the feed pipe provides real-time data to the electrical control box, which dynamically adjusts the centrifugal pump speed via a variable frequency drive to achieve closed-loop flow control. Pre-experiments confirmed the stability of the inlet flow control, with a standard error of less than 3%.
The measurement system consists of multiple ultrasonic sensors. The ultrasonic sensors are manufactured by LORDDOM (Leqing, China) and use the LGUB120 model. This sensor has a measuring range of 20–120 mm, a resolution of 0.1 mm, and an accuracy of ±0.1 mm, making it particularly suitable for applications requiring small blind zones, narrow beam angles, and high precision.
In the experimental setup, one ultrasonic sensor was positioned at the end of each turn of the spiral concentrator. The sensor was mounted on a bracket that allowed for precise adjustment of its radial monitoring position (R70, R100, R120, R140 mm). During operation, the sensor converts the distance to the target surface into a 0–20 mA standard current signal, which is transmitted to a data acquisition card. Data collection was performed using our in-house developed program. Furthermore, the system utilizes an external triggering device for the sensors to achieve synchronous data acquisition across all channels, ensuring temporal consistency of the data from different points.
The operating principle is as follows (Figure 3d,e): At the start of the experiment, the fixed reference point at the bottom of the spiral groove ( P 1 ) was calibrated, and the baseline distance ( L 1 ) from the sensor to P 1 was recorded. After the fluid flow reached a steady state, the distance ( L 2 ) corresponding to the free-surface position ( P 2 ) was measured. Consequently, the dynamic liquid film thickness ( h ) at the target radial position was calculated as the distance difference ( h = L 1 L 2 ).

3.2.2. Evaluation Metrics for Roll Wave Intensity Characteristics

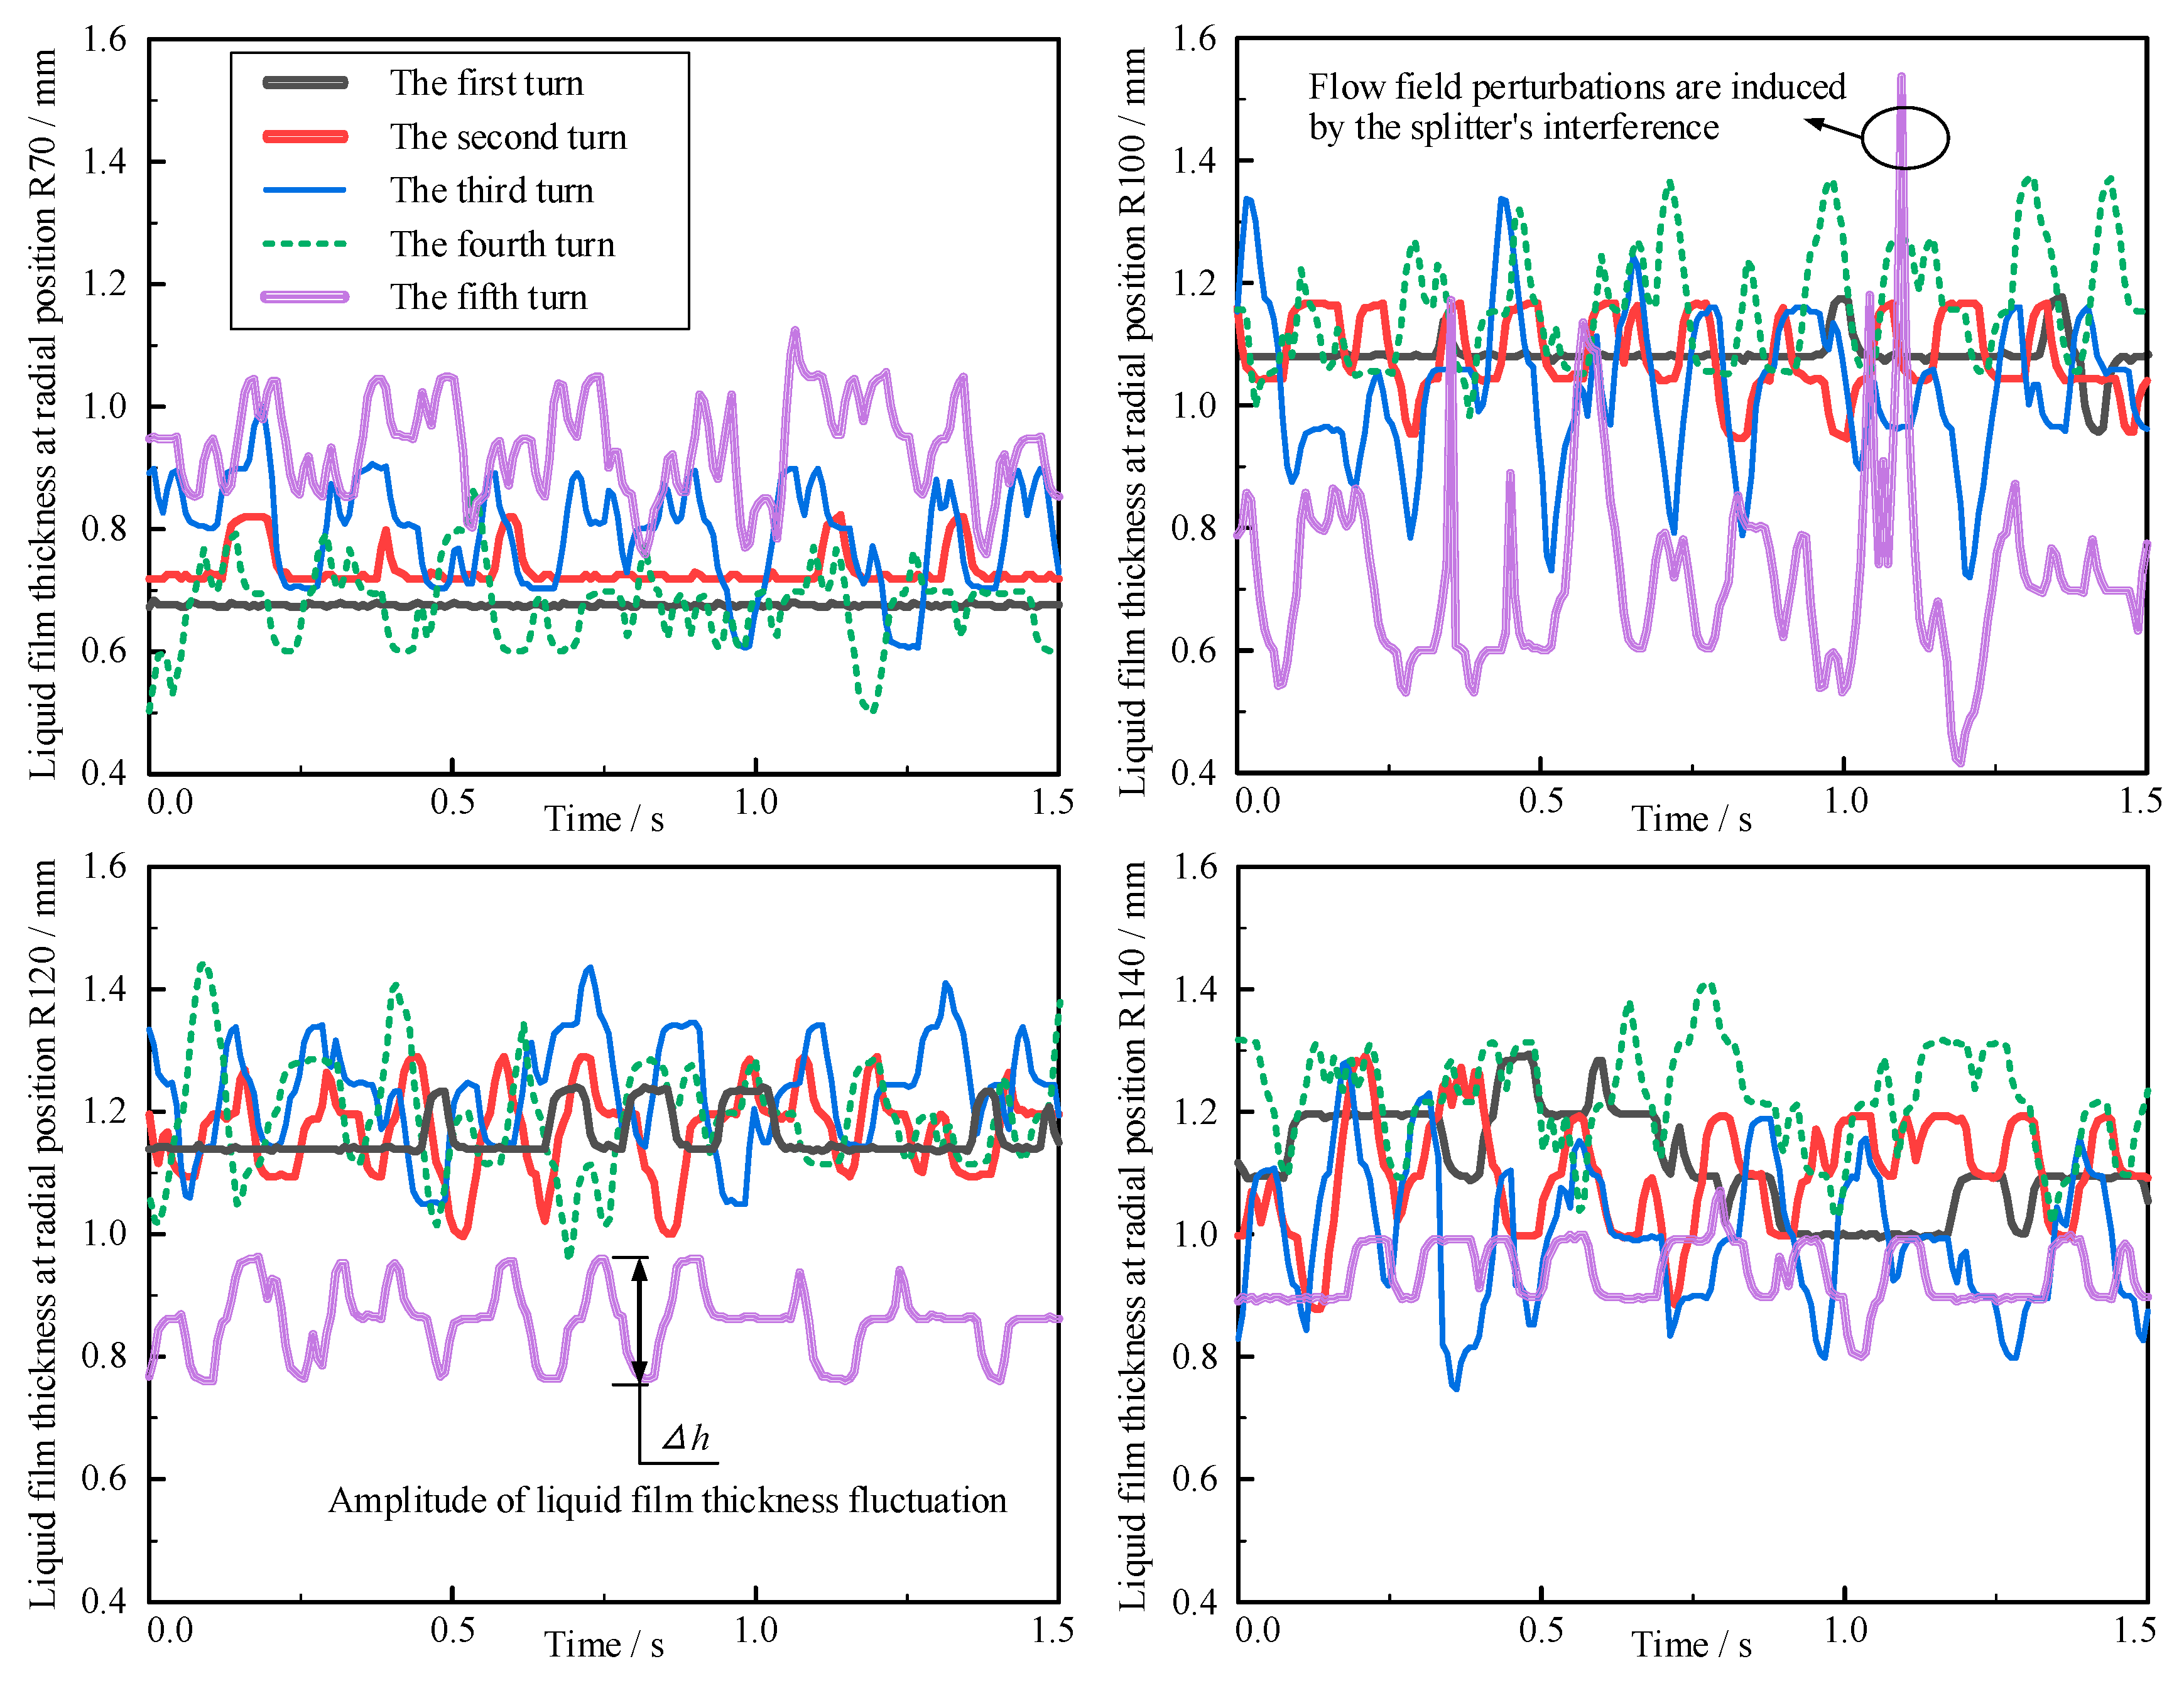
Given that spiral concentrators consist of multiple turns and exhibit significant variations in liquid film thickness distribution across different turns and radial positions, effective metrics for evaluating roll waves intensity characteristics need to be established. Taking experimental group No. 10 (P/D = 0.45, slurry particles: quartz- magnetite mixture, a fine fraction, C w = 30 % , Q = 11   L / min ) as an example, Figure 4 illustrates the roll waves state on the free surface across different turns. Observations reveal that roll waves gradually initiate in the second turn, develop to their peak intensity in the third turn, and begin to attenuate after the fourth turn, where larger waves split into multiple smaller peak waves. Notably, roll waves primarily form in the inner and middle groove regions; the outer groove exhibits irregular turbulent flow due to higher velocities, lacking typical roll wave features.
Based on these observations, four key radial positions within the inner and middle groove regions—R70 mm, R100 mm, R120 mm, and R140 mm—were selected as monitoring points for each turn. The amplitude of liquid film thickness variation over time (i.e., fluctuation amplitude) was measured at each monitoring point from the end of turn 1 to the end of turn 5. Results, shown in Figure 5, indicate that larger liquid film thickness fluctuations correspond to more pronounced roll waves. Analysis of Figure 5 shows: Turn 1: Negligible liquid level fluctuations, indicating stable flow without instability or roll wave formation. Turns 2–3: Significant increase in fluctuation amplitude, signifying strengthening roll wave intensity. Turn 4: Gradual decrease in fluctuation amplitude. Turn 5: Reliability of measurements decreases significantly due to proximity to the splitter and resultant flow disturbances.
In summary, the second turn is the primary formation zone for roll waves, while the third turn represents a critical transition zone for their morphological evolution. To optimize data analysis efficiency and exclude splitter interference, subsequent analysis focuses on measurements taken at the end of turns 2, 3, and 4, combined with results from the four radial positions (R70 mm, R100 mm, R120 mm, R140 mm). Based on the measured liquid film thickness fluctuation amplitude h , the following three categories of evaluation metrics for roll wave intensity characteristics were established:
1
Global Mean Fluctuation Amplitude ( h G ):
Calculated as the arithmetic average of the liquid film thickness fluctuation amplitudes (temporal variations) measured at all monitoring points (R70, R100, R120, R140) across turns 2, 3, and 4. h G provides an intuitive quantification of the overall difference in liquid film thickness fluctuation between experimental groups, reflecting the comprehensive roll wave intensity.
2
Per-Turn Mean Fluctuation Amplitude ( h T ):
Calculated as the arithmetic average of the fluctuation amplitudes at the four radial monitoring points (R70, R100, R120, R140) measured at the end of a specific turn (e.g., end of turn 2: h T 2 ). h T reveals the evolution of roll wave intensity with turn number (temporal evolution) for a fixed set of radial positions, highlighting the effect of the turn number on roll wave characteristics.
3
Per-Radial-Position Mean Fluctuation Amplitude ( h R ):
Calculated as the arithmetic average of the fluctuation amplitudes measured at a specific radial position (e.g., R70) at the end of turns 2, 3, and 4 (e.g., h R 70 ). h R characterizes the spatial variation in roll wave intensity along the radial direction for a fixed set of turns (turns 2, 3, 4).

4. Results and Analysis

Based on the orthogonal experimental design L 27 3 13 , a total of 27 experimental groups were conducted, with each group repeated three times. The arithmetic mean of the measured values served as the raw data. This raw data was then transformed according to the three evaluation metrics defined in Section 3.2.2, with detailed results presented in Table 4. Utilizing this transformed data, this study analyzed the spatiotemporal evolution patterns of roll waves and employed range analysis to determine the ranking of influencing factors’ impact. Analysis of Variance (ANOVA) was further applied to quantitatively assess the significance of each factor’s effect on the liquid film thickness fluctuation amplitude.

4.1. Analysis of Spatiotemporal Evolution of Roll Waves

Data from Table 4 reveals that the liquid film thickness fluctuation amplitude exhibits a significant overall increasing trend from the inner groove towards the middle groove region (R70 → R140). This indicates that roll wave intensity strengthens with increasing radial distance and is most pronounced in the middle groove region. A possible explanation for this phenomenon is the enhanced centrifugal force acting on the fluid in the middle groove region [39]. This amplifies the velocity gradient and shear stress between the surface and bottom layers of the flow, making it more prone to free surface instability and promoting roll wave development.
Analyzing the temporal evolution of roll wave intensity with turn number shows that from the end of turn 2 to the end of turn 4, the fluctuation amplitude exhibits a unimodal distribution, peaking at the end of turn 3. Specifically, the mean fluctuation amplitude at the end of turn 3 was 25.25% higher than at the end of turn 2 and 18.35% higher than at the end of turn 4. This evolution pattern can be interpreted as follows: the inlet flow begins to destabilize and develop roll waves in turn 2, reaches its fully developed stage (energy accumulation and morphological maturity) in turn 3, and gradually attenuates in turn 4 due to energy dissipation or flow stabilization. For instance, Group 20 (under specific conditions) observed a fluctuation amplitude as high as 0.7 mm at R140 in turn 3, corroborating the strong roll wave characteristics of this turn. Integrating radial position and turn effects, roll wave intensity reaches its maximum in the middle groove region at the end of turn 3.

4.2. Ranking of Factors Influencing Liquid Film Thickness Variation (Range Analysis)

Range analysis, known for its intuitiveness and simplicity, is widely used for ranking the influence of factors. First, statistical parameters K i j and K i j ¯ were calculated for each evaluation metric of roll wave intensity using the following formulas:
  K i j = k = 1 n Y i j , k
K i j ¯ = K i j N / P i
where Y i j , k is the metric value for the k-th experiment under level j of factor i ( i ∈ {Factors: A, B, C, D, E}, j ∈ {Levels: 1, 2, 3}). N = 27 is the total number of experiments. P i is the number of levels for factor i . n = N / P i is the number of experiments per level for each factor.
Subsequently, the range R i for each factor was calculated as follows:
  R i = max K i 1 ¯ , K i 2 ¯ , K i 3 ¯ min K i 1 ¯ , K i 2 ¯ , K i 3 ¯
The range R i is the core quantity for analysis. A larger R i value for a factor indicates a greater influence of that factor on roll waves.

4.2.1. Range Analysis for Global Mean Amplitude of Fluctuation

Applying Formulas (13)–(15) to the Global Mean Fluctuation Amplitude data (Column 2, Table 4), the range analysis results are plotted in Figure 6 (complete data in Table S1). The figure shows that the mean fluctuation amplitude increases with increasing P / D ; it first decreases and then increases with increasing C w ; and it first increases and then decreases with increasing d p and Q . The range analysis reveals the following order of influence on the global mean fluctuation amplitude: Pitch-to-Diameter Ratio (Factor A) > Particle Diameter (Factor C) > Particle Density (Factor B) > Inlet Flow Rate (Factor E) > Mass Concentration (Factor D). When P / D increases from 0.35 to 0.55, the mean fluctuation difference increases by 328% ( K A j ¯ from 0.090 to 0.387), indicating that P / D has a highly significant impact on liquid film thickness variation. The increase in P / D leads to a quadratic increase in centrifugal force, severely disturbing film stability and becoming the dominant mechanism inducing roll waves. Particle diameter ( d p ), influencing roll wave intensity by modulating solid–liquid interactions, has the second strongest effect after P / D . Fluctuation amplitudes are lower for fine or coarse particles, peaking for medium-sized particles ( K C 2 ¯ = 0.248 ). In contrast, inlet flow rate ( Q ) and mass concentration ( C w ) have relatively minor effects, with flow rates of 8 L/min showing slightly higher fluctuations. Globally, the combination predicted to yield maximum roll waves is A3B3C2D1E2, while the combination for minimum roll waves is A1B2C3D2E1.

4.2.2. Range Analysis for Per-Turn Mean Amplitude of Fluctuation

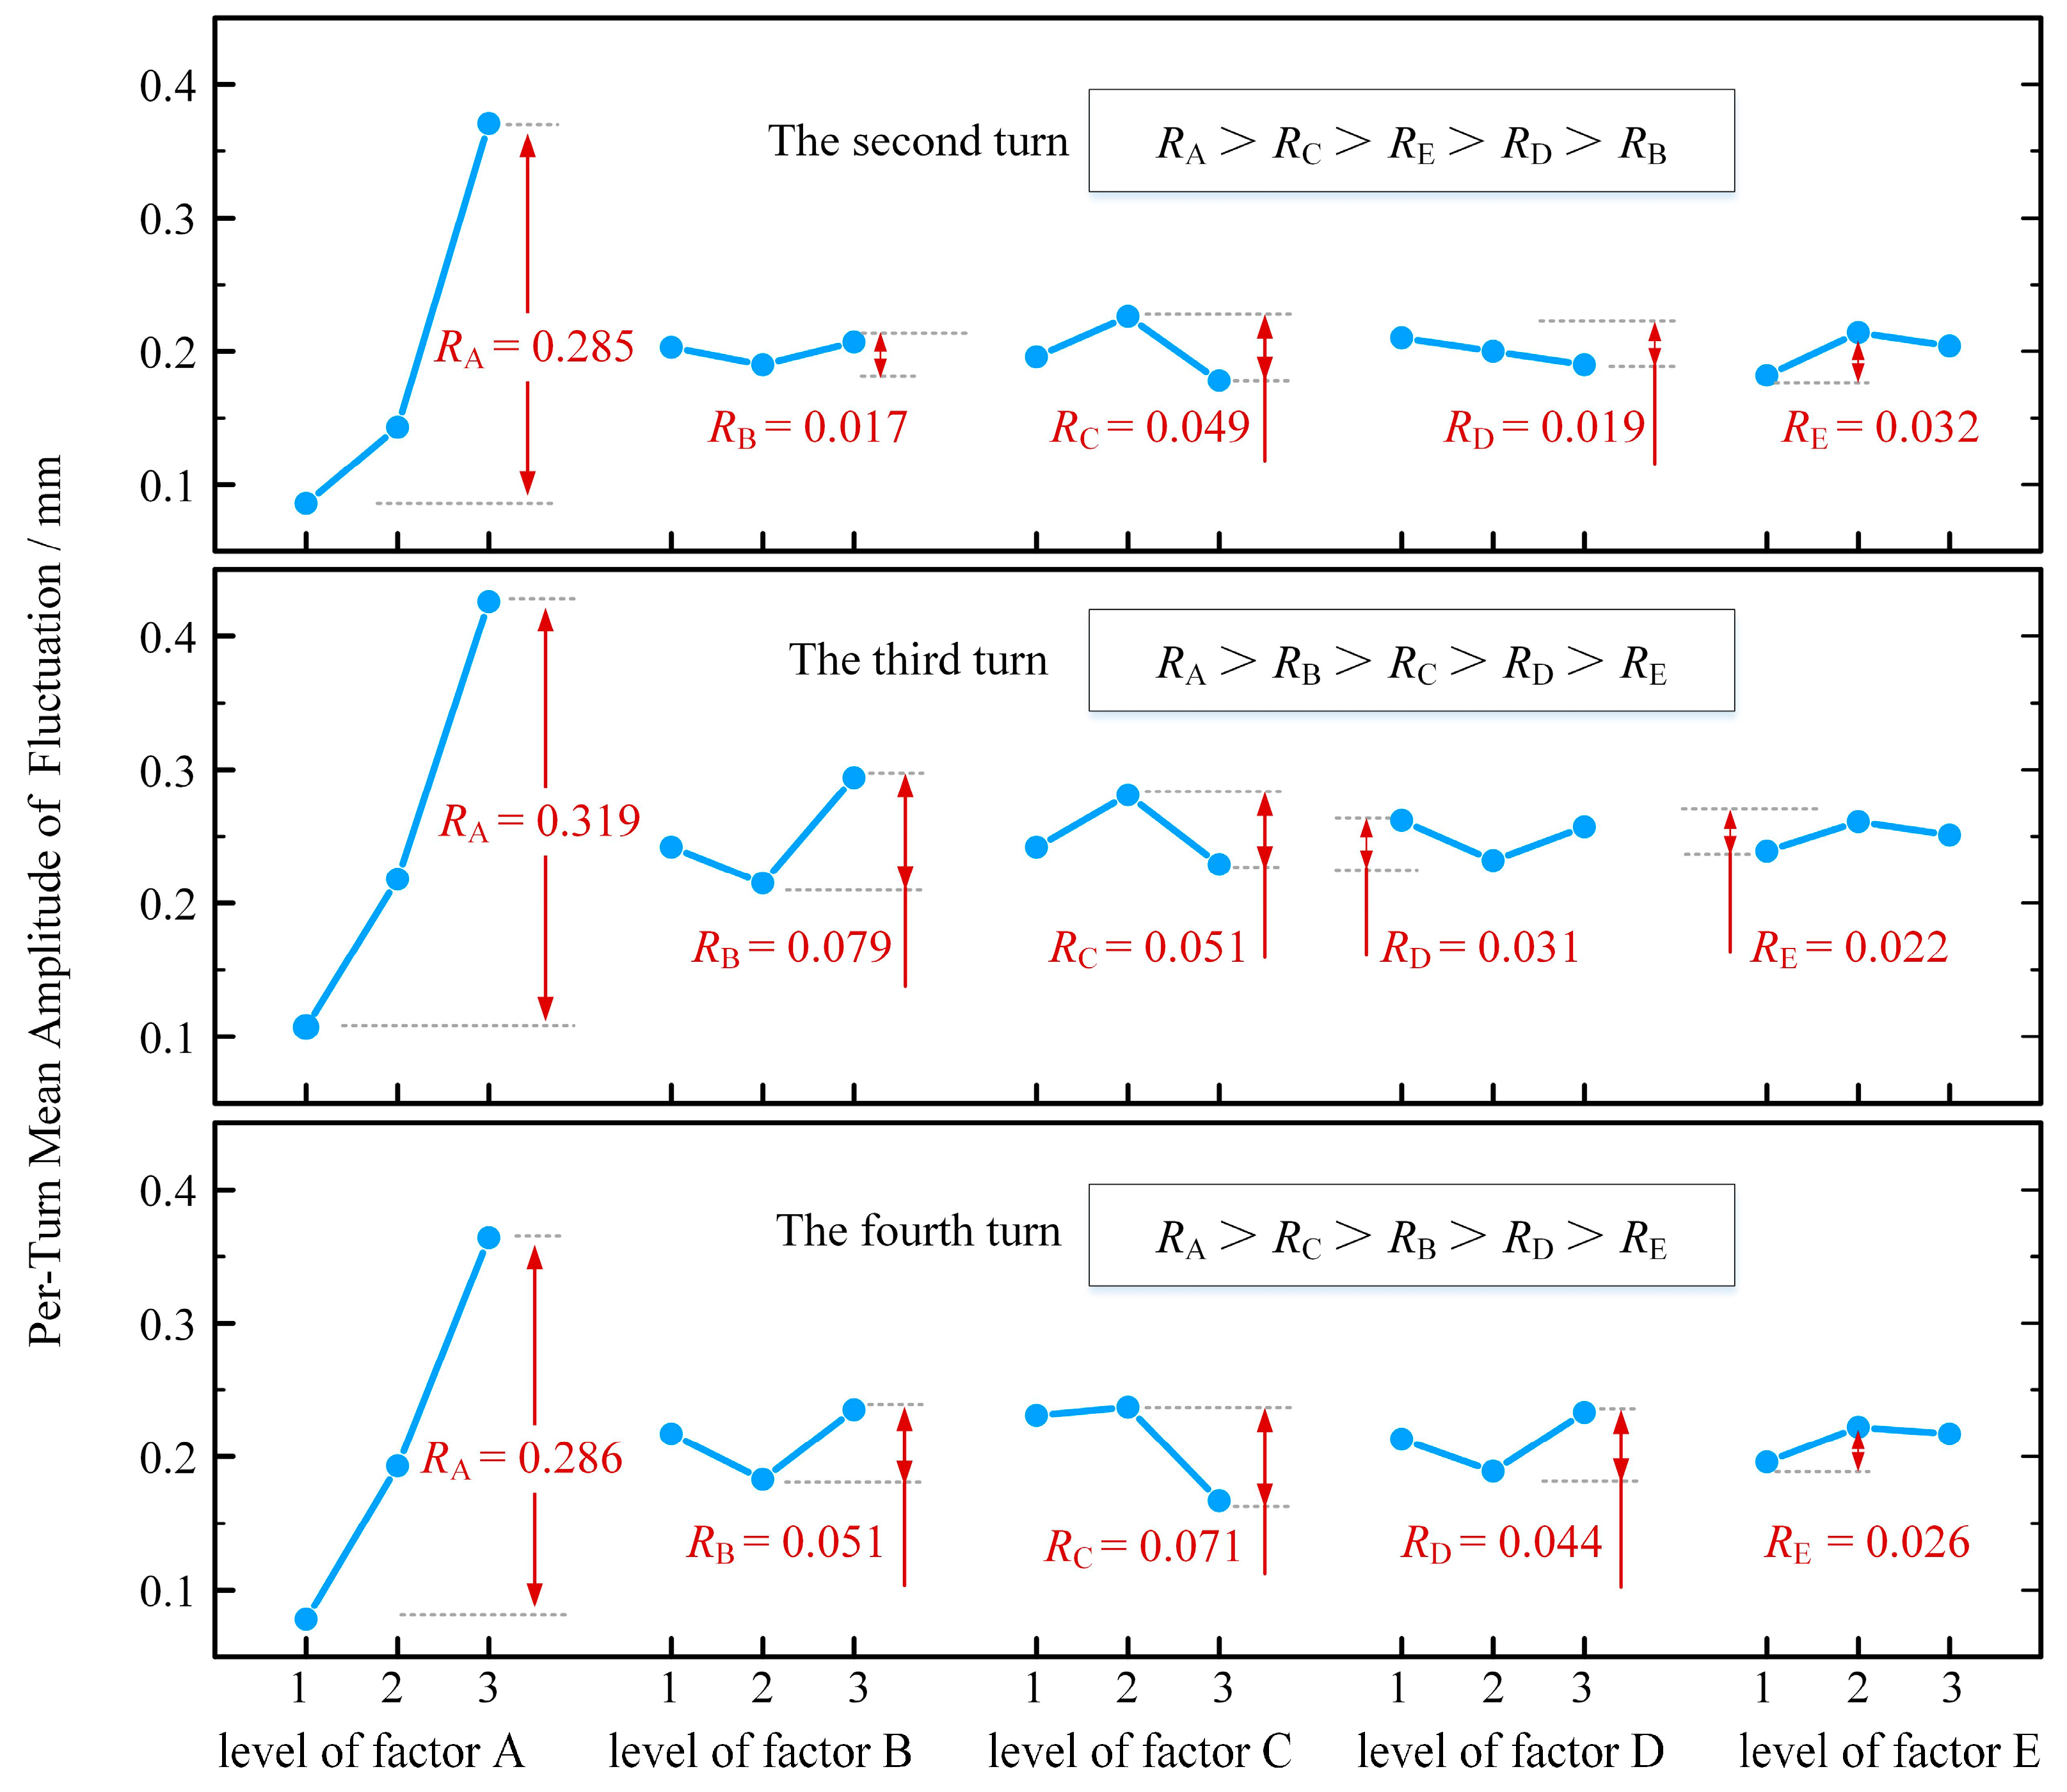
Given the significant dynamic evolution of roll wave intensity across different turns, it is essential to analyze its variation with turn progression. Applying Formulas (13)–(15) to the Per-Turn Mean Fluctuation Amplitude data (Columns 3–5, Table 4) separately, the range results are plotted in Figure 7 (complete data in Table S2). Analysis of fluctuation amplitude from turns 2 to 4 reveals an evolution in the ranking of factor influence:
Turn 2: Influence ranking: P / D (A) > d p (C) > Q (E) > C w (D) > ρ p (B). Notably, inlet flow rate (Q) has a prominent influence at this stage due to the high initial kinetic energy of the slurry entering the groove, leading to unstable flow.
Turn 3: Influence ranking evolves to: P / D (A) > ρ p (B) > d p (C) > C w (D) > Q (E). The influence of slurry type ( ρ p ) significantly increases here, while the effect of inlet flow rate diminishes due to energy dissipation. As indicated by Lingguo Meng’s research [6], the secondary flow reaches its most developed stage in turn 3. Particle forces reach a complex dynamic equilibrium: heavy minerals continue to settle, while the interaction between light mineral settling and the secondary flow intensifies, increasing the velocity difference between surface and bottom layers and thus enhancing fluid instability and roll wave intensity. Consequently, the ranking of particle density rises in turn 3, and the disturbance effects of particle diameter and mass concentration also become more pronounced.
Turn 4: As mineral settling is largely complete, the flow tends to stabilize. The influence ranking adjusts to: P / D (A) > d p (C) > ρ p (B) > C w (D) > Q (E). The influence of particle density decreases significantly compared to turn 3.

4.2.3. Range Analysis for Per-Radial-Position Mean Amplitude of Fluctuation

Applying Formulas (13)–(15) to the Per-Radial-Position Mean Fluctuation Amplitude data (Columns 6–9, Table 4) separately, the range results are plotted in Figure 8 (complete data in Table S3). The data shows:
  P / D , the global dominant factor for roll wave generation, exhibits an exponentially increasing influence intensity with radius. This stems from the amplification effect of centrifugal force–increased P / D causes steep tangential velocity gradients and higher centrifugal acceleration, significantly amplifying roll wave size. Particle density ( ρ p ) shows a consistent pattern: light minerals (e.g., quartz) induce roll waves more readily than heavy minerals (e.g., magnetite). The core mechanism is that heavy minerals rapidly settle, forming a buffer layer that dampens the flow field, while light minerals remain suspended, inducing solid–liquid interaction forces that exacerbate fluid instability.
In addition, the influence of other factors ( d p , C w , Q ) exhibits significant spatial differentiation: In the inner groove region (R70 mm), d p and C w significantly impact roll wave generation. A possible reason is that particles migrate inward under centrifugal force; interactions between particles and fluid induce local turbulence, increasing roll wave intensity. In the middle groove region (R120 mm, R140 mm), the number of suspended particles decreases, and the influence of particle characteristics is gradually superseded by flow characteristics. Research by PR Ankireddy, Mangadoddy Narasimha, and others [17,39] indicates that increased flow rate elevates fluid velocity in the middle and outer groove regions. Higher velocity in the outer regions increases inertia, enhancing liquid film fluctuations. Thus, high flow rates are more likely to trigger roll waves in the outer middle groove region.

4.3. Significance Analysis of Factor Influence

While range analysis can identify the ranking of factor influence on the roll wave intensity metrics, it cannot quantify the significance of experimental error [40]. Therefore, ANOVA is necessary to rigorously evaluate the statistical significance of each factor’s effect.
Let S S T be the total sum of squares, S S i be the sum of squares for the independent effect of factor i , and S S E be the sum of squares for error. Their calculation formulas are as follows:
  S S T = Y i j , k Y ¯ 2
S S i = K i 1 2 + K i 2 2 + K i 3 2 n Y i j , k 2 N
S S E = S S T i = 1 r S S i
d f T = N 1
d f i = P j 1
d f E = d f T 1 r d f i
where Y ¯ is the overall mean of all Y i j , k . In this paper, the experiment was conducted a total of 27 times. There were five factors, each with three levels. Therefore, d f T , d f i , and d f E are 26, 2, and 16, respectively.
The F-statistic ( F i ) tests the significance level of factor i [41]. A larger F i indicates a more significant influence of the factor on the fluctuation amplitude:
  F i = S S i / d f i S S E / d f E
Using the Global Mean Fluctuation Amplitude (Column 2, Table 4), Per-Turn Mean Fluctuation Amplitudes (Columns 3–5), and Per-Radial-Position Mean Fluctuation Amplitudes (Columns 6–9) as the metric values, the F-statistics were calculated based on Formulas (16)–(22). The ANOVA results are summarized in Table 5. In this study, d f j = 2 and d f T = 16 . For significance levels α = 0.05 and α = 0.01 , the F-distribution critical values are F α = 0.05 ( 2 , 16 ) = 3.63 and F α = 0.01 ( 2 , 16 ) = 6.23 . The criteria are as follows:
  F i > 6.23 : Highly significant influence (marked ***)
  3.63 < F i < 6.23 : Generally significant influence (marked *)
  F i < 3.63 : Non-significant influence (marked -)
As shown in Table 5, regardless of the metric used, the Pitch-to-Diameter Ratio (Factor A) has a highly significant influence on roll wave intensity. Increasing P / D causes a high centrifugal force field, drastically increasing tangential velocity and strengthening secondary circulation, severely disrupting flow field stability and inducing roll waves. In contrast, particle characteristics (Factors B and C) exhibit generally significant influence under specific conditions, with their effects showing spatial heterogeneity. The influence of solid mass fraction (Factor D) and inlet flow rate (Factor E) did not reach statistical significance.

4.4. Analysis of Roll Wave Impact on Particle Migration

The presence of roll waves intensifies oscillatory forces within the fluid. Excessive oscillatory forces can readily alter the original trajectories of mineral particles [42], inducing stochastic particle migration. To quantify the impact of roll wave intensity on particle separation, splitters were installed at radial positions R = 85 mm and R = 135 mm at the end of turn 5, dividing the concentrate collection zone into three regions: r1: 40–85 mm (inner), r2: 85–135 mm (middle), r3: 135–200 mm (outer). The spatial distribution of particles was characterized by the Zone Recovery Rate (ZRR)–defined as the percentage of the target mineral mass within a specific region relative to the total mass exiting the concentrator:
  Z R R i = m i k = 1 3 m k × 100 %
where m i is the dry mineral mass collected in region r i .
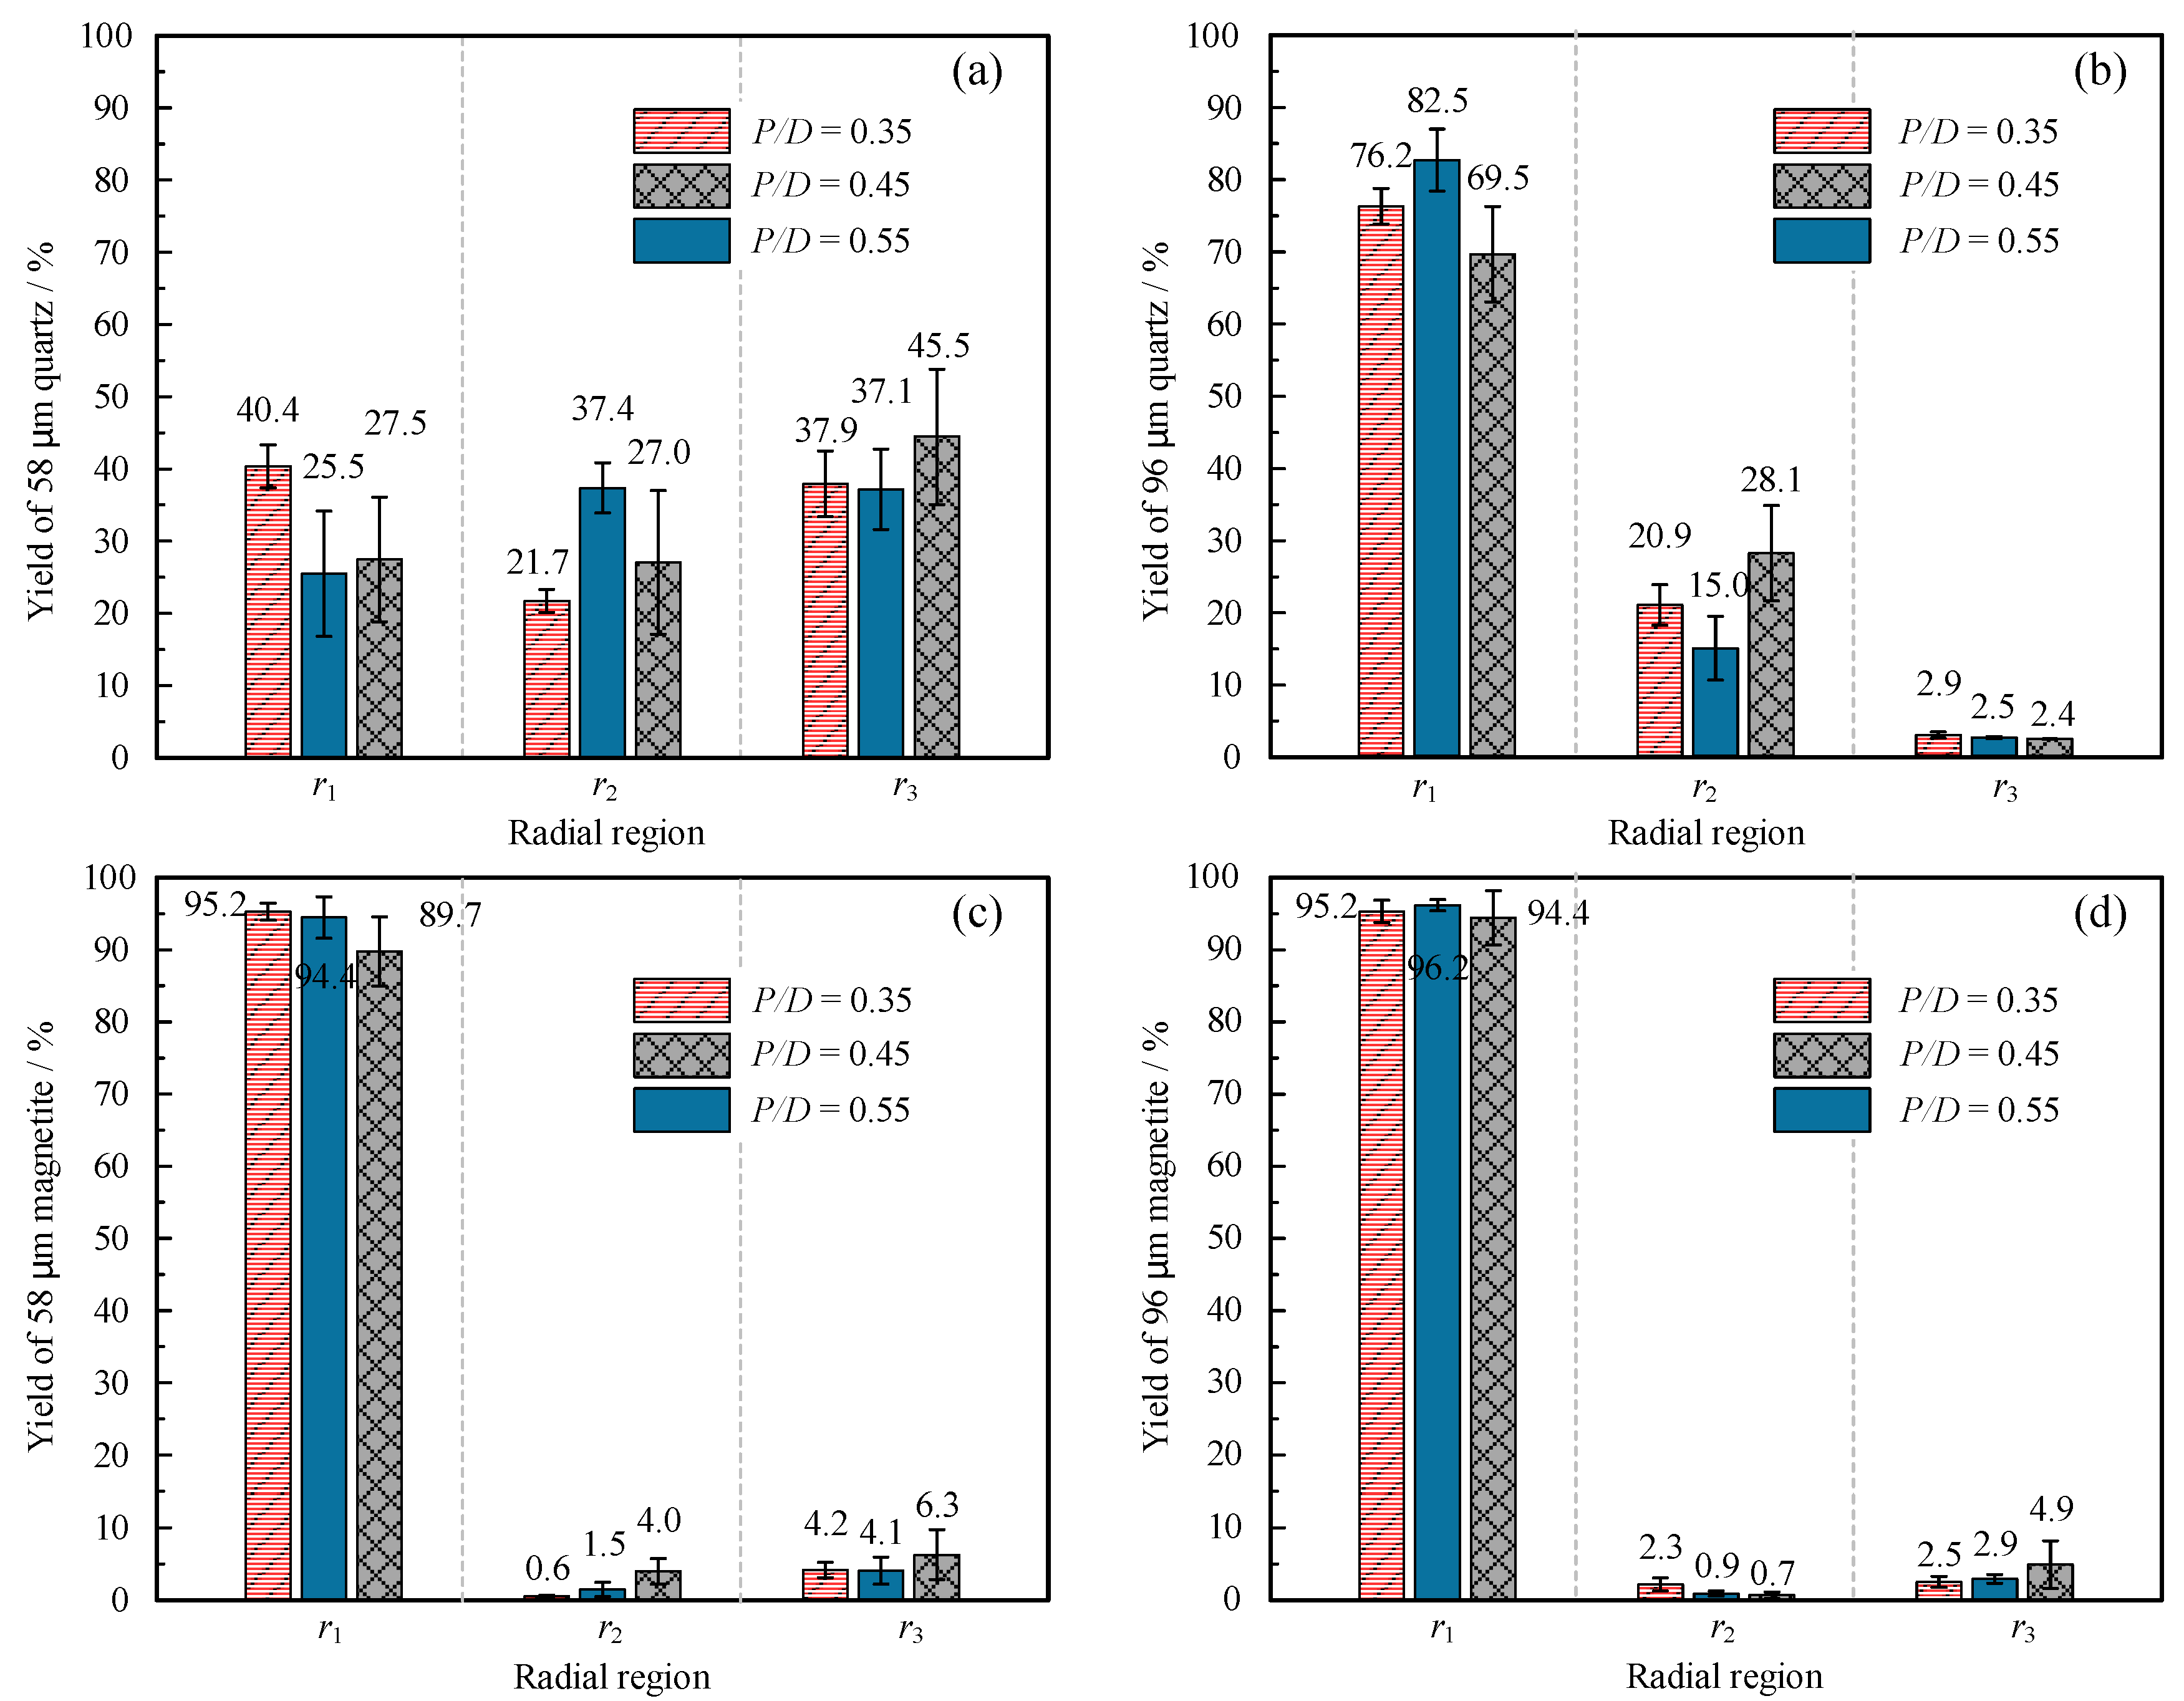
Based on the significance analysis results ( P / D most significant, particle characteristics secondary), four particle types were selected for subsequent experiments: 58 μm quartz and magnetite, and 96 μm quartz and magnetite. Under fixed solid mass fraction (20%) and inlet flow rate (5 L/min), 12 comparative experiments were conducted in spiral concentrators with P / D of 0.35, 0.45, and 0.55. Each experiment was repeated four times. The ZRR for regions r1 to r3 was recorded, and the results are plotted in Figure 9.
Figure 9 reveals the following: For medium quartz (58 μm), particles are distributed across all regions. As P / D increases, particles in r1 show an increasing tendency to diffuse towards r2 and r3. This is primarily because a larger P / D increases the primary flow velocity, subjecting particles to greater outward centrifugal force. For coarse quartz (96 μm), particles are mainly distributed in r1 and r2. As P / D increases, ZRR does not change monotonically; coarse quartz particles exhibit random shifts and segregation within r1 and r2. For magnetite particles, particles primarily concentrate in the inner groove region (r1). When P / D increases, fine particles migrate more readily from the inner to the outer groove.
Crucially, a common phenomenon observed across Figure 9a–d is that the standard deviation of ZRR increases with increasing P / D . A larger standard deviation indicates greater randomness in the migration trajectories of some particles. Higher standard deviation corresponds to more severe stochastic particle migration.
Table 6 presents the relationship between measured roll waves intensity and ZRR for different experimental groups. A significant positive correlation is evident between roll waves intensity and the standard deviation of ZRR within the same slurry flow. Specifically, increased P / D leads to intensified liquid film thickness variations, inducing fluid instability and generating larger roll waves. Increased roll wave amplitude produces stronger fluid disturbances that cause some particles to deviate from their expected paths, migrating unexpectedly to other zones. This stochastic diffusion of particles increases the randomness of the separation process, ultimately manifesting as an increase in the standard deviation of ZRR. Furthermore, fine, light mineral particles, due to their low inertia and susceptibility to fluid oscillation, are more easily perturbed by roll waves. In summary, roll waves interfere with particle migration trajectories. Stronger roll waves, resulting from liquid instability within the groove, lead to more significant stochastic particle migration behavior, degrading separation precision. The specific mechanisms by which roll waves affect particle motion paths require further in-depth analysis and validation using techniques like PIV or CFD.

5. Conclusions

Through theoretical modeling and orthogonal experimentation, this study systematically reveals the evolution patterns of roll waves within spiral concentrators and their impact mechanisms on particle separation. The main conclusions are as follows:
1
Spatiotemporal Evolution of Roll Waves: Significant quasi-periodic roll waves appear on the surface of the slurry flow traversing the inner to middle groove regions. The dynamic characteristics of roll waves exhibit clear spatiotemporal evolution patterns. Spatially, roll wave intensity significantly increases from the inner towards the middle groove region, attributed to enhanced fluid shear stress due to increasing centrifugal force gradients. Temporally, roll waves follow an evolutionary sequence: “initiation in turn 2, peak in turn 3, and attenuation in turn 4”.
2
Influence Mechanisms of Key Parameters: Parameter sensitivity analysis identifies the pitch-to-diameter ratio ( P / D ) as a highly significant controlling factor for roll wave intensity. When P / D increases from 0.35 to 0.55, the global fluctuation amplitude increases drastically, driven by quadratic growth in centrifugal force disrupting flow field stability. Particle characteristics (density and size) exhibit generally significant influence: light minerals (e.g., quartz sand) induce roll waves more readily than heavy minerals (e.g., magnetite); medium-fine particles ( d 50 58   μ m ) exhibit the strongest disturbance effect. In contrast, the influence of inlet flow rate and slurry mass concentration did not reach statistical significance.
3
Impact of Roll Waves on Separation Process: Roll waves induce stochastic particle migration by enhancing fluid disturbances, leading to an increased standard deviation of ZRR and significantly reduced separation precision. Stronger roll waves, resulting from liquid instability within the groove, correspond to more significant stochastic particle migration. Fine particles, due to their low inertia and ease of oscillation with the fluid, are far more affected by roll wave disturbances than coarse particles. Coarse particles, possessing greater inertia, exhibit relatively stable migration behavior.
This study pioneers the application of open-channel roll wave theory to the analysis of slurry flow dynamics in spiral concentrators, providing a novel paradigm for the structural optimization and process control of high-precision separation equipment.

Supplementary Materials

The following supporting information can be downloaded at: https://www.mdpi.com/article/10.3390/separations12090245/s1, Table S1: Summary table of range analysis data for global mean fluctuation amplitude; Table S2: Summary table of range analysis data for per-turn mean fluctuation amplitude; Table S3: Summary table of range analysis data for per-radial-position mean fluctuation amplitude.

Author Contributions

Conceptualization, J.W.; methodology, J.W.; software, J.W. and J.H.; validation, J.W., H.L. and J.H.; formal analysis, J.W. and J.H.; investigation, J.W. and H.L.; resources, H.L.; data curation, J.W. and Q.Z.; writing—original draft preparation, J.W.; writing—review and editing, J.W. and H.L.; visualization, J.W. and Q.Z.; supervision, H.L. and Q.Z.; project administration, H.L.; funding acquisition, H.L. All authors have read and agreed to the published version of the manuscript.

Funding

This research was funded by the National Natural Science Foundation of China [Grant No. 52164019] and the Scientific and Technological Research Project of Jiangxi Provincial Department of Education [Grant No. GJJ2205009]. The APC was funded by National Natural Science Foundation of China [Grant No. 52164019].

Data Availability Statement

The original contributions presented in this study are included in the article/Supplementary Materials. Further inquiries can be directed to the corresponding author.

Acknowledgments

We acknowledge the technical support provided by the School of Mechanical and Electrical Engineering, Jiangxi University of Science and Technology and Jiangxi Mining and Metallurgical Mechanical and Electrical Engineering Technology Research Center.

Conflicts of Interest

The authors declare no conflicts of interest.

References

  1. Richards, R.; Hunter, J.; Holland-Batt, A. Spiral concentrators for fine coal treatment. Coal Prep. 1985, 1, 207–229. [Google Scholar] [CrossRef]
  2. Tripathy, S.K.; Murthy, Y.R. Modeling and optimization of spiral concentrator for separation of ultrafine chromite. Powder Technol. 2012, 221, 387–394. [Google Scholar] [CrossRef]
  3. Routray, S.; Rao, R.B. Optimization of some parameters of rougher spiral concentrator for preconcentration of total heavy minerals from beach sand. World Metall. ERZMETALL 2013, 66, 5–12. [Google Scholar]
  4. Rao, G.; Rath, B.; Sharma, P.; Chaurasiya, S. Modeling and Optimisation of Spiral Concentrator for Beneficiation of Iron Ore Slimes from Kirandul, India. Trans. Indian Natl. Acad. Eng. 2020, 5, 497–508. [Google Scholar] [CrossRef]
  5. Jain, P.K.; Rayasam, V. An analytical approach to explain the generation of secondary circulation in spiral concentrators. Powder Technol. 2017, 308, 165–177. [Google Scholar] [CrossRef]
  6. Meng, L.; Gao, S.; Wei, D.; Cui, B.; Shen, Y.; Song, Z. Investigation on the evolution of flow field stability in a spiral separator. Miner. Eng. 2021, 174, 107224. [Google Scholar] [CrossRef]
  7. Mahran, G.M.; Doheim, M.A.; Abu-Ali, M.H.; Abdel, A.F. CFD simulation of particulate flow in a spiral concentrator. Mater. Test. 2015, 57, 811–816. [Google Scholar] [CrossRef]
  8. Sudikondala, P.; Mangadoddy, N.; Tripathy, S.K.; Yanamandra, R.M. CFD Modelling of the Spiral Concentrator at Moderate Feed Solids Content-Prediction of Particle Segregation. Trans. Indian Inst. Met. 2024, 77, 4193–4204. [Google Scholar] [CrossRef]
  9. Boucher, D.; Deng, Z.; Leadbeater, T.; Langlois, R.; Waters, K.E. Observation of iron ore beneficiation within a spiral concentrator by positron emission particle tracking of large (Ø = 1440 μm) and small (Ø = 58 μm) hematite and quartz tracers. Chem. Eng. Sci. 2016, 140, 217–232. [Google Scholar] [CrossRef]
  10. Sadeghi, M.; Bazin, C.; Renaud, M. Radial distribution of iron oxide and silica particles in the reject flow of a spiral concentrator. Int. J. Miner. Process. 2016, 153, 51–59. [Google Scholar] [CrossRef]
  11. Gao, S.; Meng, L.; Zhou, X.; Shen, Y.; Cui, B.; Song, Z. Design of partial cross-sectional geometry and prediction of separation performance in the spiral separator. Sep. Sci. Technol. 2022, 57, 2127–2144. [Google Scholar] [CrossRef]
  12. Stokes, Y.M.; Duffy, B.R.; Wilson, S.K.; Tronnolone, H. Thin-film flow in helically wound rectangular channels with small torsion. Phys. Fluids 2013, 25, 083103. [Google Scholar] [CrossRef]
  13. Jain, P. An analytical approach to explain complex flow in spiral concentrator and development of flow equations. Miner. Eng. 2021, 174, 107027. [Google Scholar] [CrossRef]
  14. Das, S.K.; Godiwalla, K.; Panda, L.; Bhattacharya, K.; Singh, R.; Mehrotra, S. Mathematical modeling of separation characteristics of a coal-washing spiral. Int. J. Miner. Process. 2007, 84, 118–132. [Google Scholar] [CrossRef]
  15. Meng, L.; Gao, S.; Wei, D.; Cui, B.; Shen, Y.; Song, Z.; Yuan, J. Effects of cross-sectional geometry on flow characteristics in spiral separators. Sep. Sci. Technol. 2021, 56, 2967–2977. [Google Scholar] [CrossRef]
  16. Ye, G.; Liu, Q.; Ma, L.; Dong, X. CFD-DEM investigation of fluid and particle motion behaviors in initial stage of spiral separation process at low solids concentration. Miner. Process. Extr. Metall. Rev. 2023, 44, 475–480. [Google Scholar] [CrossRef]
  17. Ankireddy, P.R.; Purushotham, S.; Narasimha, M. Fluid Flow Modeling and Analysis of Low-and High-Gravity Spiral Concentrators: Experimental and Analytical Approaches. Chem. Eng. Technol. 2023, 46, 1619–1629. [Google Scholar] [CrossRef]
  18. Romeijn, T.; Behrens, M.; Paul, G.; Wei, D. Experimental analysis of water and slurry flows in gravity-driven helical mineral separators. Powder Technol. 2022, 405, 117538. [Google Scholar] [CrossRef]
  19. Sudikondala, P.; Mangadoddy, N.; Kumar, M.; Tripathy, S.K.; Yanamandra, R.M. CFD Modelling of Spiral Concentrator-Prediction of Comprehensive Fluid Flow Field and Particle Segregation. Miner. Eng. 2022, 183, 107570. [Google Scholar] [CrossRef]
  20. Meng, L.; Gao, S.; Wei, D.; Zhao, Q.; Cui, B.; Shen, Y.; Song, Z. Particulate flow modelling in a spiral separator by using the Eulerian multi-fluid VOF approach. Int. J. Min. Sci. Technol. 2023, 33, 251–263. [Google Scholar] [CrossRef]
  21. Gao, S.; Zhou, X.; Meng, L.; Zhao, Q.; Liu, W. Variation of flow hydrodynamic parameters and prediction of particle separation indices in the spiral concentrator with the regulation of pitch-diameter ratio. Separations 2023, 10, 410. [Google Scholar] [CrossRef]
  22. Loveday, G.; Cilliers, J. Fluid flow modelling on spiral concentrators. Miner. Eng. 1994, 7, 223–237. [Google Scholar] [CrossRef]
  23. Dressler, R.F. Mathematical solution of the problem of roll-waves in inclined opel channels. Commun. Pure Appl. Math. 1949, 2, 149–194. [Google Scholar] [CrossRef]
  24. Julien, P.Y.; Hartley, D.M. Formation of roll waves in laminar sheet flow. J. Hydraul. Res. 1986, 24, 5–17. [Google Scholar] [CrossRef]
  25. Wang, J.; Zhang, K.; Li, P.; Meng, Y.; Zhao, L. Hydrodynamic characteristics and evolution law of roll waves in overland flow. Catena 2021, 198, 105068. [Google Scholar] [CrossRef]
  26. da Cunha, E.F.; de Oliveira Ferreira, F.; de Freitas Maciel, G.; Kitano, C. Absorbance photometric technique to measure roll waves in a free surface of a non-Newtonian fluid flow. Measurement 2024, 235, 114880. [Google Scholar] [CrossRef]
  27. Rocho, V.d.R.; Fiorot, G.H.; Viçosa Möller, S. Influence of the Perturbation Amplitude and the Froude Number on the Establishment Length of Roll Waves. J. Eng. Mech. 2022, 148, 04022057. [Google Scholar] [CrossRef]
  28. Zanuttigh, B.; Lamberti, A. Instability and surge development in debris flows. Rev. Geophys. 2007, 45, RG3006. [Google Scholar] [CrossRef]
  29. Thomas, H.A. The Propagation of Waves in Steep Prismatic Conduits. In Proceedings of the Hydraulics Conference, Iowa City, IA, USA, 12–15 June 1939; Thomas, H.A., Ed.; University of Iowa: Iowa City, IA, USA, 1940. [Google Scholar]
  30. Fiorot, G.H.; Rocho, V.d.R.; Möller, S.V.; Pereira, J.B.; da Cunha, E.F.; Maciel, G.d.F. An experimental assessment of roll waves evolution in mud-like fluids flowing down steep slopes. J. Braz. Soc. Mech. Sci. Eng. 2024, 46, 483. [Google Scholar] [CrossRef]
  31. Chen, X.; Wang, X.; Liu, Q. Numerical study of roll wave characteristics based on Navier-Stokes equations: A two-dimensional simulation. J. Eng. Mech. 2021, 147, 04020149. [Google Scholar] [CrossRef]
  32. Zanuttigh, B.; Lamberti, A. Roll waves simulation using shallow water equations and weighted average flux method. J. Hydraul. Res. 2002, 40, 610–622. [Google Scholar] [CrossRef]
  33. Fei, J.; Jie, Y.; Wu, Z.; Zhu, M. Emerging, ripening, and attenuating stages of granular roll waves. J. Non Newton. Fluid Mech. 2021, 287, 104411. [Google Scholar] [CrossRef]
  34. Wang, J.-W.; Andrews, J. Numerical simulations of liquid flow on spiral concentrators. Miner. Eng. 1994, 7, 1363–1385. [Google Scholar] [CrossRef]
  35. Holland-Batt, A. A method for the prediction of the primary flow on large diameter spiral troughs. Miner. Eng. 2009, 22, 352–356. [Google Scholar] [CrossRef]
  36. Liu, H.; Wang, J. Impact of inlet flow rate on dynamic liquid film thickness and flow stability in spiral concentrator. Powder Technol. 2025, 466, 121472. [Google Scholar] [CrossRef]
  37. Xu, L.; Zhang, Y.; Zhang, Z.; Taylor, S.; Chen, M.; Wang, X. Experimental investigation on thermal performance of self-service cold storage cabinet based on the orthogonal test. Appl. Therm. Eng. 2024, 242, 122315. [Google Scholar] [CrossRef]
  38. Wang, Y.; Guo, X.; Shi, C.; Zhang, M.; Tao, Z.; Zhang, Y. Orthogonal Analysis for Structural Optimization of Ejector for Multiejector Air Curtain. Asia-Pac. J. Chem. Eng. 2025, 20, e70011. [Google Scholar] [CrossRef]
  39. Ankireddy, P.R.; Sudikondala, P.; Mangadoddy, N.; Tripathy, S.K.; Yanamandra, R.M. Comparative studies of experimental and numerical investigations of fluid flow and particle separation of high-gravity spiral concentrators. Ind. Eng. Chem. Res. 2024, 63, 12177–12198. [Google Scholar] [CrossRef]
  40. Peng, C.; Jin, S.; Zhang, X.; Zhang, H.; Guo, Z.; Ouyang, X. Orthogonal optimization and parameter analysis of the hydraulic combined seals for the marine crane. Appl. Ocean Res. 2025, 158, 104595. [Google Scholar] [CrossRef]
  41. Xu, H.; Kong, Y.; Cheng, D.; Zhao, L.; Dong, H.; Zhang, M. Optimization of bischofite pyrolysis furnace system based on orthogonal experiments and exergy analysis with assessment of its green economy. Energy 2025, 322, 135773. [Google Scholar] [CrossRef]
  42. Sadeghi, M. Modeling and Simulation of Spiral Concentrators. Ph.D. Thesis, Université Laval, Quebec, QC, Canada, 2021. [Google Scholar]
Figure 1. Schematic diagram of roll wave patterns on the slurry surface within spiral concentrators.
Separations 12 00245 g001
Figure 2. The Cartesian coordinate system diagram of the spiral concentrator.
Separations 12 00245 g002
Figure 3. Experimental platform and slurry preparation system (a) Spiral concentrators with three pitch-to-diameter ratios (P/D = 0.35, 0.45, 0.55) (b) Particle blending matrix: three size fractions × three mineral types (c) Integrated experimental rig schematic (d) Ultrasonic transducer installation procedure (e) Operating principle of dynamic liquid film thickness measurement via ultrasonic pulse-echo technique.
Separations 12 00245 g003
Figure 4. Roll waves regime evolution across axial turns and radial zones on the free surface.
Separations 12 00245 g004
Figure 5. Temporal variations in liquid film thickness at variable radial positions.
Separations 12 00245 g005
Figure 6. Range analysis of the global mean amplitude of fluctuation.
Separations 12 00245 g006
Figure 7. Range analysis of per-turn mean amplitude of fluctuation.
Separations 12 00245 g007
Figure 8. Range analysis of the per-radial-position mean amplitude of fluctuation.
Separations 12 00245 g008
Figure 9. Zone recovery rate (ZRR) of particles collected at the end of turn 5 as a function of radial region (r1, r2, r3) and pitch-to-diameter ratio (P/D). (a) 58 µm quartz; (b) 96 µm quartz; (c) 58 µm magnetite; (d) 96 µm magnetite. Error bars represent the standard deviation of four replicate tests.
Separations 12 00245 g009
Table 1. Factors and levels of orthogonal test.
FactorSymbolMappingValue Level
123
Pitch-to-diameter ratio (-) P / D A0.350.450.55
Average density of pulp particles (kg/m3) ρ p B353353002650
Particle diameter (μm) d p   ( 50 ) C225896
Solid mass fraction (%) C w D102030
Inlet flow rate (L/min) Q E5811
Table 2. Orthogonal design table.
Test No.Factor Level
ABCDE
111111
211222
311333
412123
512231
612312
713132
813213
913321
1021133
1121211
1221322
1322112
1422223
1522331
1623121
1723232
1823313
1931112
2031223
2131331
2232121
2332232
2432313
2533133
2633211
2733322
Table 3. Particle size distribution parameters of the experimental samples.
Sample Labeld10 (μm)d50 (μm)d90 (μm)Span
11822401.00
24958840.60
381961240.45
41723431.13
54958840.60
678971280.52
71822421.09
84759860.66
981951260.47
Table 4. Orthogonal experiment results.
Test No. h G
/mm
h T /mm h R /mm
T2T3T4R70R100R120R140
10.1250.1000.1500.1250.0000.1330.2330.133
20.1420.1250.1500.1500.1000.1330.2000.133
30.0170.0500.0000.0000.0330.0330.0000.000
40.0580.0750.0500.0500.1330.0330.0000.067
50.0420.0250.0750.0250.1000.0000.0000.067
60.0880.0750.1130.0750.0000.1170.1330.100
70.1460.1000.1750.1630.1170.1670.1670.133
80.1460.1500.1750.1130.1000.1330.1500.200
90.0500.0750.0750.0000.1000.0670.0000.033
100.2500.1380.2750.3380.0830.3170.3500.250
110.2040.1500.2500.2130.1670.2000.2170.233
120.1540.1380.2130.1130.0830.1670.2000.167
130.1580.1750.1500.1500.1000.2330.2000.100
140.1210.1000.1250.1380.0830.0670.1330.200
150.1250.0880.1380.1500.1330.0670.2000.100
160.1830.1500.2250.1750.1500.2500.2000.133
170.2920.2500.3130.3130.1670.2670.4000.333
180.1750.1000.2750.1500.1330.2330.1330.200
190.3210.3380.3130.3130.1830.3000.3670.433
200.4330.4630.4500.3880.3500.3500.3670.667
210.3380.3250.3750.3130.3830.2830.3500.333
220.3500.3500.3630.3380.1670.2670.5000.467
230.4210.4000.4880.3750.3670.3830.5000.433
240.4040.4250.4380.3500.1830.4330.4670.533
250.4130.3380.4750.4250.3170.4000.4330.500
260.4330.3750.5000.4250.3670.4170.4330.517
270.3710.3250.4380.3500.1830.3670.4170.517
Table 5. Analysis of variance (ANOVA) results for global mean, per-turn mean, and per-radial-position mean amplitudes of fluctuation as indicator variables.
ItemFactor S S i S S E F i Significance
Global mean fluctuation amplitude i = A 0.4140.029114.207***
i = B 0.0113.034-
i = C 0.0154.138*
i = D 0.0030.828-
i = E 0.0030.828-
The second turn i = A 0.4090.031105.548***
i = B 0.0010.258-
i = C 0.0112.839-
i = D 0.0020.516-
i = E 0.0051.290-
The third
turn
i = A 0.4730.04977.224***
i = B 0.0294.7347*
i = C 0.0132.1224-
i = D 0.0050.8163-
i = E 0.0020.3265-
The fourth
turn
i = A 0.3730.04566.311***
i = B 0.0122.1333-
i = C 0.0274.800*
i = D 0.0091.600-
i = E 0.0040.711-
R70 i = A 0.2010.05529.236***
i = B 0.0081.1636-
i = C 0.0233.3455-
i = D 0.0131.891-
i = E 0.0040.582-
R100 i = A 0.3190.05645.571***
i = B 0.0273.857*
i = C 0.0060.857-
i = D 0.0142.000-
i = E 0.01191.700-
R120 i = A 0.4910.11633.862***
i = B 0.0020.138-
i = C 0.0211.448-
i = D 0.0090.621-
i = E 0.01911.317-
R140 i = A 0.7560.06593.046***
i = B 0.0141.723-
i = C 0.0384.677*
i = D 0.0030.369-
i = E 0.0202.462-
***: Highly significant influence; *: Generally significant influence; -: Non-significant influence
Table 6. Correlation between roll waves intensity and zone recovery rates (ZRR) across experimental groups.
Particle Characteristics P / D The Standard Deviation of ZRR h G
/mm
r1r2r3
Medium-grained quartz 0.352.9561.5944.5530.122
0.458.6753.4705.5700.291
0.558.6829.9489.3940.420
Coarse-grained quartz0.352.4632.7970.4250.050
0.454.2934.4270.1530.171
0.556.6126.5990.0830.362
Medium-grained magnetite0.351.2060.1451.0620.042
0.452.8710.9991.8810.108
0.554.7881.7683.4680.398
Coarse-grained magnetite0.351.5260.9130.7520.091
0.450.7600.3440.6040.112
0.553.7570.4513.3060.365
Disclaimer/Publisher’s Note: The statements, opinions and data contained in all publications are solely those of the individual author(s) and contributor(s) and not of MDPI and/or the editor(s). MDPI and/or the editor(s) disclaim responsibility for any injury to people or property resulting from any ideas, methods, instructions or products referred to in the content.