Abstract
The metabolism of antibiotics, antidepressants, and cardiovascular drugs has been investigated widely over the last few decades. The aim of this study was to develop an efficient analytical protocol based on the combination of electrochemistry (EC) and mass spectrometry for the identification of electrochemical products (potential pharmacologically active metabolites) of selected drugs (enalapril, metronidazole, midazolam, propranolol, venlafaxine). The electrochemical mimicry of the oxidative phase I and II metabolism was achieved in a thin-layer cell equipped with different working electrodes (magic diamond (MD), glassy carbon (GC), gold (Au), platinum (Pt)). The structures of the electrochemically generated metabolites were elucidated based on accurate mass ion data and tandem mass spectrometry (MS/MS) experiments. The in silico prediction of the main sites of selected drugs’ metabolism was performed using Biotransformer 3.0, GLORYx, and Xenosite software. Moreover, incubation with liver microsomes (LMs) was performed to examine the proposed metabolic pathways of target compounds. The data from in vitro experiments agreed with the data from electrochemical oxidation, which predicted some potential metabolites found in the real samples from patients. For enzymatic incubation, N-dealkylation, O-demethylation, and hydroxylation were the metabolic pathways involved mainly in their metabolism. Their in vitro phase II metabolites were identified as glucuronic acid conjugates. Finally, different in vivo phase I and II metabolites were identified for the studied drugs, including metabolic pathways for in vivo phase I N-demethylation, N-dealkylation, O-demethylation, and hydroxylation, while the metabolic pathways for in vivo phase II metabolites were identified as glucuronic acid conjugates.
1. Introduction
Recently, a new approach to studying the metabolic biotransformation of biologically active compounds emerged. It focuses on electrochemistry (EC) and mass spectrometry (MS). This technique allows the imitation of the course of many typical reactions of phase I and II metabolism. However, some drugs are converted into active metabolites with enhanced biological activities or reactive metabolites, often decreasing or deactivating their biological activity. Also, it enables the identification of electrochemical products that may be potential metabolites. EC/MS is most often used in the study of drug metabolism [1,2,3,4,5]. Many compounds in the body are oxidized or reduced because they have redox properties (over 90%). Hence, the explanation of redox reactions of metabolism is a key point in the field of drug pharmacology. Electrochemistry has been used in biomedical chemistry for years to study the oxidation–reduction properties of pharmaceuticals. In turn, the combination of electrochemistry with mass spectrometry EC/MS allows the generation and identification of electrochemical products for biologically active compounds with diverse physicochemical properties. The advantage of this method is that it can locate oxidation products immediately after their formation. This method can effectively predict the oxidation process initiated by single-electron oxidation, such as N-dealkylation, S-oxidation, P-oxidation, the oxidation of alcohols, the hydroxylation of aromatic systems, and dehydrogenation. Electrochemistry is not advantageous for reactions initiated by direct hydrogen atom acquisition, such as O-dealkylation or aliphatic hydroxylation of unsubstituted aromatic rings, due to the excessively high oxidation potential required for electrochemical oxidation reactions [1,2,3,4,5].
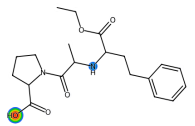
Enalapril (ENAL) is a drug belonging to the group of angiotensin-converting enzyme (ACE) inhibitors (Figure S1, Supplementary Information) [6,7].
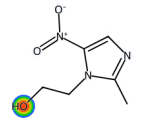
Metronidazole (MET) is an antibiotic belonging to the nitroimidazole class (Figure S3, Supplementary Information) [8,9].
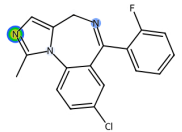
Midazolam (MID) belongs to the class of imidazobenzodiazepine derivatives (Figure S2, Supplementary Information) [10,11,12].
Propranolol (PRO) belongs to the group of drugs from the β-blockers group, blocking the action of catecholamines (adrenaline and noradrenaline) on the heart (Figure S4, Supplementary Information) [12,13].
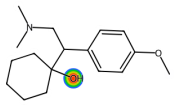
Venlafaxine (VEN) is a bicyclic derivative of phenylethylamine. VEN belongs to the group of second-generation antidepressants (Figure S5, Supplementary Information) [14,15,16].
The described pharmaceuticals are among the most frequently prescribed medications in modern medicine. It is therefore of great interest to study the detailed metabolism of these biologically active compounds. Mostly, they undergo hepatic metabolism, forming hydroxy, acetyl-, and carboxyl derivatives. As a result of these processes, several active metabolites are formed. Some metabolites are immediately conjugated with glucuronic acid after formation, creating end products considered pharmacologically inactive [17]. Moreover, some drug metabolites possess toxicity profiles distinct from those of the parental compounds, which are essential to consider when evaluating the toxicity of a drug as a whole [18]. Consequently, based on the obtained results, the in vitro and in vivo studies conducted on the metabolism of selected medicines occurring in the presence of the metabolizing enzyme present in liver cells, along with the implementation of an electrochemical reactor for generating potential metabolites, provide a basis for understanding the possible directions of activation and/or detoxification changes that these compounds undergo in vivo in the patient’s body [17,18].
Hence, the primary objective of this research was to develop new analytical procedures for identifying electrochemical products (instrumental method) in the sense of the potential pharmacologically active metabolites in biological samples. This objective was achieved by using mass spectrometry in the identification of electrochemical products of selected drugs (in combination on-line/off-line), performing in vitro metabolic transformations of selected drugs against enzymes of the microsomal fraction of liver cells, and identifying metabolites in real samples of patients undergoing pharmacological therapy (Table 1). Additionally, in silico predictions were performed using GLORYx and Biotransformer 3.0 freeware. Additionally, the predicted sites of reactive functional groups for the study molecules were obtained using the XenoSite predictor, available at https://xenosite.org/ (accessed on 28 April 2025). The outcomes were obtained as a visual image regarding the color gradient intensity, including a color scale bar. The highest probability of metabolism at an atomic site is denoted with a red color (highest score: 1), while a white color implies a zero SOM (site of metabolism) score, indicating no possibility for metabolism at an atomic site. SOMs were proposed using nine key CYP450 isoenzymes including 1A2, 2A6, 2B6, 2C8, 2C9, 2C19, 2D6, 2E1, and 3A4.

Table 1.
Characteristics of the analytes belonging to different therapeutic groups obtained with the use of EC experiments, in vitro incubation, and real samples (with the predicted atomic sites of metabolism for the study drugs by the Xenosite web predictor).
2. Experimental
2.1. Apparatus
The studies were conducted using the following apparatus: a mass spectrometer(Agilent, Waldbronn, Germany) with an ESI ionizer in the positive ionization mode. The data collection was performed using MassHunter software (Agilent, Waldbronn, Germany); a liquid chromatograph 1100 (Agilent, Waldbronn, Germany) equipped with a binary pump (G1310A), degasser, autosampler (G1313A), and UV-Vis detector (G1314A); a computer with MassHunter Qualitative Analysis software, MassHunter Quantitative Analysis; an analytical Sigma 3K30C centrifuge (Hanna Instrument, Berdfordshire, UK); an ultrasonic bath (Polsonic, Warsaw, Poland); a laboratory pH meter, which was used to prepare buffer solutions (IKA POL, Warsaw, Poland); a Sartorius Stedim solvent filtering kit (Göettingen, Germany); an AS 220/C/2 electronic analytical balance (Radwag, Radom, Poland); and an Eppendorf Research automatic pipette set (Eppendorf, Hamburg, Germany).
2.2. Reagents
The following reagents were used in the analyses: water for LC/MS, 99.9% (Sigma-Aldrich Chemie, Steinheim, Germany); methanol for LC/MS (Sigma-Aldrich Chemie, Steinheim, Germany); acetonitrile for LC/MS (Sigma-Aldrich Chemie, Steinheim, Germany); deionized water from Mili-Q apparatus (MiliporeIntertech, Bedford, MA, USA); ammonium formate for LC/MS (Sigma-Aldrich Chemie, Steinheim, Germany); ammonium acetate for LC/MS (Sigma-Aldrich Chemie, Steinheim, Germany); ammonia for LC/MS (Sigma-Aldrich Chemie, Steinheim, Germany); formic acid for LC/MS (Sigma-Aldrich Chemie, Steinheim, Germany); drugs and metabolites—enalapril (ENAL), enalaprilat (ENALAP), enalapril glucuronide (GLU ENAL), metronidazole (MET), hydroxymetronidazole (MET OH), metronidazole glucuronide (GLU MET), midazolam (MID), hydroxymidazolam (MID OH), propranolol (PRO), hydroxypropranolol (PRO OH), propranolol glucuronide (GLU PRO), venlafaxine (VEN), and desmethylvenlafaxine (VEN DEME) (Sigma-Aldrich Chemie, Steinheim, Germany) (Table 1). Chemicals and solvents were LC/MS or analytical with the highest quality. They were obtained from Sigma-Aldrich (Schnelldorf, Germany). Acetonitrile, methanol, and formic acid were LC/MS-grade, obtained from J. T. Baker (Deventer, the Netherlands). Ultra-pure water used for all analyses was obtained from Sigma-Aldrich (Schnelldorf, Germany). Ammonium formate was purchased from Fluka (Buchs, Switzerland), and ammonium hydroxide and formic acid from Sigma-Aldrich (Schnelldorf, Germany). Glucose-6-phosphate, β-NADP+, glucose-6-phosphate dehydrogenase, and uridine 5′-diphosphoglucuronic acid triammonium salt (UDPGA) were obtained from Sigma-Aldrich (Schnelldorf, Germany).
2.3. In Silico Metabolite Prediction
Putative metabolites of the target pharmaceuticals were predicted using selected compounds’ SMILES strings:
(ENAL: O=C(O)[C@H]2N(C(=O)[C@@H](N[C@H](C(=O)OCC)CCc1ccccc1)C)CCC2;
MET: OCCn1c(C)ncc1[N+](=O)[O-];
MID: ClC1=CC=C2C(C(C3=CC=CC=C3F)=NCC4=CN=C(C)N42)=C1;
PRO: OC(COC1=C2C=CC=CC2=CC=C1)CNC(C)C;
VEN: OC2(C(c1ccc(OC)cc1)CN(C)C)CCCCC2). Prediction was achieved through free online software GLORYx [19] and Biotransformer 3.0 [20]. Briefly, GLORYx integrates machine learning-based site of metabolism (SoM) prediction into biotransformation reaction rule sets to predict and classify the putative structures of metabolites that could be formed by phase I and/or phase II metabolism. Biotransformer 3.0 is an open access software tool that supports the rapid, accurate, and comprehensive prediction of small molecule metabolism in mammals and environmental microorganisms. The ChemDraw software (version: 21.0.0) generated all the metabolite structures (PerkinElmer, Inc., Waltham, MA, USA).
2.4. In Vitro Studies Using Liver Microsomal Fraction Enzymes
The incubation of selected drugs with liver cell microsomal fraction enzymes was carried out in an appropriate reaction buffer (BR). After the initial preincubation in a water bath (37 °C), a cofactor of the enzymatic reaction—NADPH/UDPGA at a concentration of 20 mM [16.67 mg NADPH/1 mL H2O]—was added to the mixture of a given biologically active compound and microsome (enzyme). The resulting reaction mixture was further incubated at the same temperature for a specified time (0, 15, 30, 60, 90, and 120 min). Then, the obtained solution was cooled in an ice bath with the addition of an equivalent amount of chilled acetonitrile to stop the reaction. The obtained mixture was centrifugated (5–15 min, 5000 rpm). The resulting supernatant was analyzed using RP–HPLC with UV-Vis detection and ESI–MS/MS. BR (sodium phosphate solution used for incubation with the microsomal enzyme fraction, pH = 7.4): 100 mM Na2HPO4 × 7 H2O [1.78 g/100 mL H2O]; 2 mM EDTA(Na3) [0.0716 g/100 solution]; mixed with magnesium chloride solution in a 1:1 (v/v) ratio of 6 mM MgCl2 × 6 H2O [0.122 g/100 mL H2O]. Reactions in the presence of human microsomal enzymes were carried out in the following solution: 10 µL of a 2 mM solution of the compound (drug) in water (0.2 mM), 10 µL of 20 mM NADPH (2 mM), 10 µL of 20 mg/mL microsomal enzymes (2 mg/mL), and 35 µL of phosphorus solution (BR). Microsomes derived from mouse liver cells (MLMs) at 10 mg/vial concentrations were used in the enzymatic studies. The microsomal fractions were stored at 80 °C and thawed immediately prior to each experiment.
2.5. EC-LC-MS/MS Experiments
The electrochemical experiments were performed using the ROXY™ system (Antec, Zoeterwoude, The Netherlands) containing a potentiostat equipped with an electrochemical cell ReactorCell™, an infusion pump, and all the necessary LC connections. The instrument was controlled via the Dialog software, version 2.02 (Antec, Zoeterwoude, The Netherlands). The electrochemical system was connected to the Triple Quad MS (Agilent, Germany) for direct EC/MS analysis. The instrument was operated with the Agilent Mass Hunter software version B.04.01, which is used for data acquisition, instrument control, and data analysis. A Labconce CentriVap DNA concentrator (Kansas City, MO, USA) was used for sample evaporation and centrifugation. In our laboratory, water was obtained using Millipore’s Milli-Q RG apparatus (Millipore Intertech, Bedford, MA, USA).
The analyses in combination with LC were performed using an ACE5 C18 300 chromatographic column (150 × 4.6 mm), with the following mobile phases: (A) water + formic acid 0.1% + 2 mM ammonium formate; (B) acetonitrile + formic acid 0.1% + 2 mM ammonium formate; mobile phase flow 0.4 mL/min. Table 2 presents the appropriate operating parameters of the mass spectrometer, which were used during further experimental work. The selection of conditions was established using a central composition plan (CCD). The MS was operated in multiple reaction monitoring (MRM) mode. The MRM analysis was used to monitor the transitions from precursor ions to dominant product ions. Two specific transitions were used to determine each compound, with the most intense transition used for quantification (quantifier transition) and the other one being used for confirmation purposes (qualifier transition).

Table 2.
Mass spectrometer operating parameters for the tested drugs and their metabolites (ESI(+) ionization; carrier gas: nitrogen; gas flow: 6.0 L/min, 35 psi, 4000 V).
The electrochemical cell consisted of a classical three-electrode arrangement, including a working electrode, a counter electrode (inlet block), and a reference electrode (HyREF electrode) (Antec, The Netherlands). A 50 mm spacer (a cell volume of 0.7 μL) separated the working and the counter electrode inlet block. In addition, the scan was performed using different working electrode materials such as glassy carbon (GC), a boron-doped diamond electrode (MD) consisting of an ultra-thin crystalline diamond layer deposited on top of a silicon substrate, gold (Au), and platinum (Pt). The accessible area of the working electrode was 15 mm2. The applied working electrodes without MD were cleaned with a polishing disk and diamond slurry provided by the manufacturer before each experiment.
To simulate phase I metabolism, a 5 μM solution of a tested compound in one of the above mobile phases was prepared. Then, the solution with added acetonitrile was introduced via an injection pump into the reaction chamber (kept at 36.7 °C), equipped with a working electrode (GC, Pt, Au, or MD) at the rate of 10 μL/min. The recorded mass voltammograms were obtained by linearly increasing the working electrode potential from 0 to 2000 mV (for GC, Pt, Au) or 3000 mV (for MD) at 10 mV/s.
Potential phase II metabolism occurred similarly to potential phase I metabolism. Then, the solution containing the derivatives of the studied drug (created during phase I) left the chamber, mixing with 25 μM glucuronic acid solution, with enzymatic catalysis required for the spontaneous reaction of UDPGA (uridine 5′-diphosphoglucuronic acid triammonium salt) in the same mobile phase as the analyzed substance, which was achieved using a 100 μL reaction coil placed between the ReactorCell and the ESI source. The defined volumes (100 μM UDPGA solution and 25 μM glucuronic acid solution) of both reactants were injected into the electrochemical system via a syringe pump. Having passed through a reaction coil, the reaction products were directly detected using an ESI-MS ion trap mass analyzer in positive ion mode for identifying potential adducts. The optimization of EC conditions was accomplished for each target compound by the infusion of the native form (Figures S6 and S7, Supplementary Information).
The efficiency of a performed conversion was calculated as a ratio between the signal intensity of the target compound with no potential applied (CellOff, no oxidation/reduction, control measurement) and with applied voltages (CellOn, oxidation/reduction) according to the following equation: 100% × (CellOff − CellOn)/CellOff. Accordingly, the values of CellOff and CellOn correspond to the intensity of the average mass spectra characterized for the target compound.
2.6. Real Samples from Patients
The study material consisted of urine and plasma samples from patients from various clinical departments. The Nicolaus Copernicus University Bioethics Committee approved the study in Toruń (decision no. 477/2021). All the study participants were informed verbally and in writing about the purpose of the study and completed a questionnaire and a declaration of voluntary consent to participate in the study. Samples were collected in test tubes after the oral administration of the drug (minimum 2 weeks). Then, after centrifugation, they were frozen (−80 °C) and thawed immediately before the developed analytical procedure was performed. The study group of patients also had other comorbidities, including hypertension, diabetes, osteoporosis, obesity, bronchial asthma, circulatory failure, thyroid disease, or urinary incontinence, and therefore, these people took various medicinal preparations that could affect the body’s metabolism.
2.7. Microextraction in Packed Syringe Procedure
Microextraction in a packed syringe (MEPS) was performed using a 250 L volume syringe coupled with barrel insert and needle assemblies (BINs) packed with the relevant sorbent. C18 MEPS sorbent material was obtained from SGE Analytical (Melbourne, Australia). Before being used for the first time, a BIN was conditioned with 100 mL of MeOH/H2O (v/v, 9:1) followed by 100 L 0.1% formic acid. After that, 5 × 50 mL of human plasma diluted with water (1:1, v/v) was drawn through a BIN very slowly to provide sufficient interaction between the analytes and the sorbent (urine without dilution). Then, to remove interfering agents, the BIN was washed with 2 × 50 mL of 0.1% formic acid and dried by blowing 2 × 50 mL of air. Then, 250 mL of MeOH eluted the analyzed drugs to Eppendorf vials (1.5 mL) in the following step. The MEPS cartridge was rinsed with 2 × 250 mL of MeOH and then 2 × 250 mL of 0.1% formic acid to prepare for the following sample. The eluate evaporated, and the dry residue was dissolved in 50 mL of the mobile phase.
2.8. Method Validation
The method was validated according to ICH guidelines. The following validation characteristics were addressed: linearity, detection and quantitation limits, accuracy, precision, robustness, selectivity, and stability (Tables S1–S3, Supplementary Information).
3. Results and Discussion
3.1. Selection of Mass Spectrometer Operating Parameters
The first stage of the study was the selection of the operating parameters of the mass spectrometer (Table 2). For this purpose, the ionization mode and the fragmentor voltage were changed for selected compounds at a constant pressure of 35 psi. No signals were observed, or their intensity was much lower for the negative ionization mode than for the ionization in the positive mode. Therefore, the ionization in the positive ESI(+) mode was selected for further studies. The determination of analytes using the mass spectrometer was carried out with positive polarization in the so-called full-spectrum sweep mode (Full Scan), with single-ion monitoring (SIM), and product ion search (Product Ion). Scanning in full mode was performed to determine the m/z quotient value of the pseudomolecular ion; i.e., the analyte molecule mass was increased by the mass of the attached proton. Using the selected ion monitoring mode, the voltage value on the fragmentor was chosen—the voltage at the end of the capillary directing ions to the Q1 analyzer. Using the Product Ion mode, daughter ions were obtained for each parent ion due to its fragmentation. At this stage, the previously selected voltage value on the fragmentor and the drying gas temperature were used, and the appropriate collision energy values were chosen depending on the tested compound.
3.2. Application of the Central Composition Plan
At the stage of selecting the mass spectrometer operating parameters for the tested analytes, a central compositional design (CCD) was used, which significantly facilitated the planning of the experiment. The drying gas temperature was set in the range of 290–350 °C, while the voltage value on the fragmentor was from 70 to 150 V. The plan consisted of nine experiments (Table 3), and the parameter values were in the normalized form of −1, 0, and +1.

Table 3.
Central composition plan used to select MS operating parameters.
The obtained results were presented graphically in spatial response surface plots for ENAL, MID, VEN, and their metabolites (Figure 1). The determined values of the drying gas temperature and the fragmentor voltage are presented in Table 3.
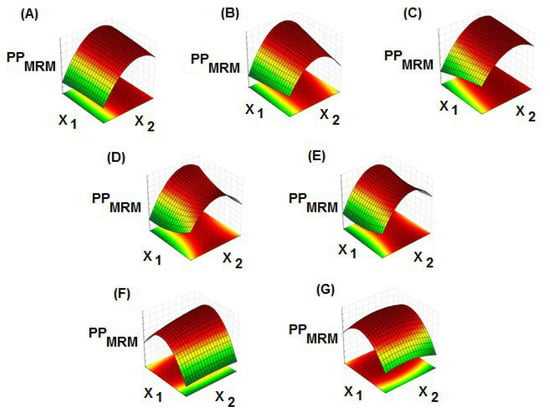
Figure 1.
Response surface area for the output quantity (PPMRM—the area under the peak used in the multiple reaction monitoring mode) as a function of the fragmentor voltage (X1, range from 70 to 150 V) and drying gas temperature (X2, range from 290 to 350 °C) for (A) ENAL, (B) ENALAP, (C) ENAL GLU, (D) MID, (E) MID OH, (F) VEN, and (G) VEN DEME.
The graphs show that the best matching of conditions for ENAL and its metabolites depends on X2. The higher the drying gas temperature, the better the matching of the system and the larger the surface area. The value of X1, i.e., the voltage on the fragmentor, is not essential here. The results for MID and its metabolite are similar. However, for VEN and its metabolite, the opposite is true. The matching depends on the voltage value on the fragmentor. Initially, the higher the value of X1, the better the matching, but after reaching the optimal value to determine the best matching, a further increase in X1 causes the result to deteriorate. However, the value of the drying gas temperature is not significant here. The conclusion is that with the exact parameters of the drying gas temperature and the voltage on the fragmentor for the drug, its metabolites can be simultaneously marked and identified.
The fragmentor voltage is a key parameter that controls the degree of in-source fragmentation, influencing the intensity and fragmentation patterns of ions. It affects the sensitivity and limit of the detection of target compounds in the LC-MS analysis. Optimizing the fragmentor voltage is crucial for achieving the best analytical performance and obtaining reliable data in the targeted analysis. It constitutes a compromise between maximizing the signal intensity and ensuring the sufficient fragmentation for identification. Such a specific range (70–150 eV) was used to generate some fragmentation for the structural analysis, to maximize the number of fragment ions for the analysis and improvement of the signal-to-noise ratio by reducing the background interference. Drying gas flow (N2) is crucial for effective ionization and detection. It helps remove solvent vapor from the samples, preventing it from interfering with the ionization process and ensuring accurate measurements. Optimizing drying gas flow in mass spectrometry involves finding a balance between maximizing the analyte signal and maintaining a good peak shape. Such a specific range (290–350 °C) was used to find a balance between efficient desolvation and maintaining the analyte stability.
3.3. In Silico Prediction of Metabolism
The in silico prediction of metabolism was performed using GloryX (Table S4, Table S6, Supplementary Information) and Biotransformer3.0 free ware and results are shown in Table S3, Supplementary Information. Moreover, a reliable tool for classifying predicted metabolites was obtained by using SoM (site of metabolism) probabilities predicted by FAME 3 machine learning models (Table S5, Supporting Information) to evaluate predicted metabolites [19,20]. Predicted derivatives were classified as probable, minor, and less probable with appropriate numbering. Phase I and phase II metabolites were proposed in the study. Primary phase I metabolites included hydroxylated and oxidized derivatives such as enalaprilat, hydroxymidazolam, hydroxymetronidazole, desmethylvenlafaxine, and hydroxypropranolol. Major phase II metabolites included glucuronic conjugated, sulfo conjugated, and methylated derivatives such as enalapril glucuronide, metronidazole glucuronide, and propranolol glucuronide.
3.4. Electrochemical Simulation of the Metabolism of Selected Drugs
During the study, four types of working electrodes were tested: platinum (Pt), gold (Au), carbon (GC), and Magic DiamondTM. The platinum and carbon electrodes are adapted to work in the range of 0–2000 mV. The potential range of the Magic DiamondTM electrode is higher than in the case of previous electrodes and is 0–3000 mV. The electrochemical processes of the tested analytes were carried out with an increasing potential value (10 mV/s) and a mobile phase flow (FR) of 10 µL/min. The criteria for selecting the working electrode was the number and intensity of signals in the mass spectrum. Analyzing the obtained MS spectra of the tested compounds, it can be stated that the most significant number of signals is possible using a diamond electrode (MD). This working electrode’s efficiency is probably related to the possibility of conducting electrochemical processes across a broader range of potentials. The MD electrode is a type of electrode material used in electrochemistry due to its exceptional properties. These include a wide potential window, low background currents, and corrosion resistance, making it suitable for various applications. In comparison to the different electrodes (GC, Au, Pt) it can be used to apply a wide range of voltages in electrochemical reactions without causing the water to decompose or the electrode to corrode, allowing for the study of a broader range of target compounds. Moreover, the MD electrode produces very little current when no reaction is taking place, which allows for more accurate measurements of electrochemical reactions. It is stable in harsh chemical environments, making it ideal for long-term experiments.
In connection with the attempt to simulate human metabolism, it was assumed that the experiment would be performed in an environment corresponding to physiological pH (pH = 7.4). Lower and higher pH decreased the amount of electrochemical products obtained, which is probably related to changes in the solubility of analytes in the mobile phase. The obtained results prove that electrochemistry and mass spectrometry effectively simulate drug metabolism. Further development of this technique will probably allow it to also be used as an alternative in vitro method for studying oxidation–reduction reactions. It should be expected that in the future, the popularization of research in this field will allow for the conducting of standard screening tests, enabling the prediction of its further course, and consequently will allow individualized and more effective treatment among patients. Detailed information regarding the optimization steps is presented in the Supplementary Information [Part 2. Electrochemical simulation of selected drug metabolism].
3.5. Analysis of Mass Spectrometric Fragmentation Patterns of Selected Drugs and Their Pharmacologically Active Metabolites for EC/ESI-MS/MS Experiments
Based on the MS spectra and signal intensities for characteristic m/z, the proposed structures of the products obtained by electrochemical oxidation were presented (Table 1). The structures were proposed based on EC/ESI-MS/MS experiments, the Mass Hunter Metabolite ID computer program, and information available in the literature. Using this analytical tool, the signals from the tested analyte regarding the control samples were determined by comparing their retention times, MS spectra, and surface areas. With the previously selected conditions of analysis using a mass spectrometer, the signals for the tested drugs were identified as [M+H]+ with characteristic m/z and retention coefficients (k). The multi-stage fragmentation of the tested drugs was performed to obtain data to interpret MS/MS spectra for potential metabolites of selected compounds (Figure 2). In phase II, there were no signals of free glucuronic acid because its molar mass (194.1 g/mol) or m/z was below the detected range. Because the ESI mass spectra presented a mixture of the resulting oxidation products and their conjugation with glucuronic acid, only proposed chemical structures could be provided. Separating the products using a preparative scale for further NMR experiments could contribute to structural identification. Nevertheless, it can be assumed that the determined m/z values represent known metabolites from the phase II metabolism of the studied drugs. Figure S8 shows the MS/MS fragmentation patterns of selected drugs and their pharmacologically active metabolites.
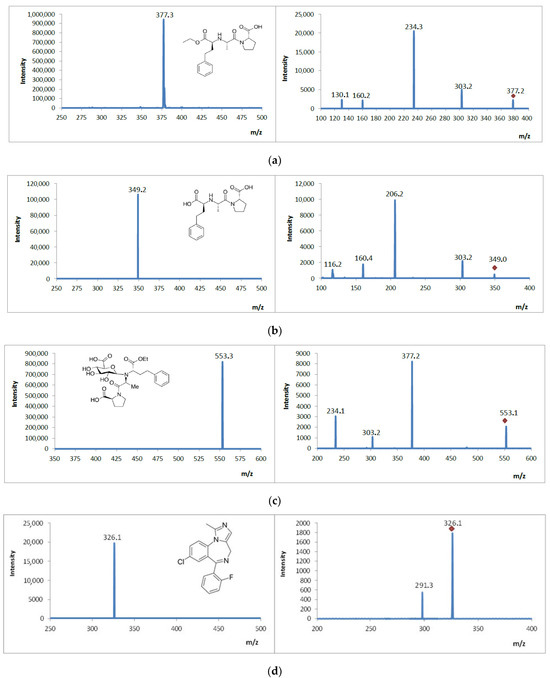
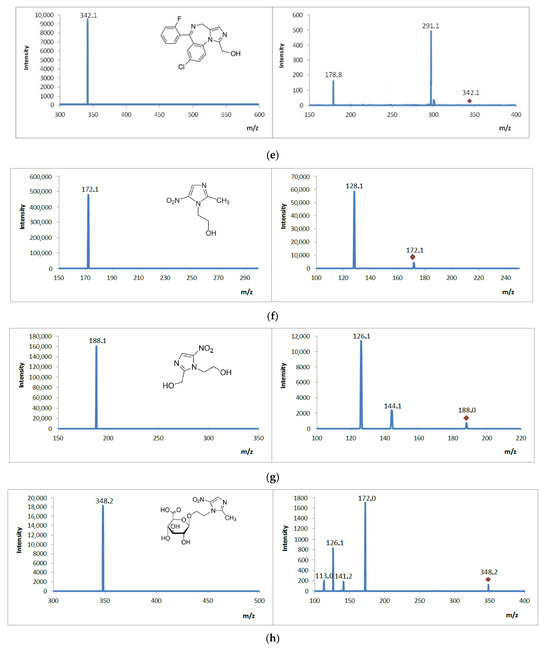
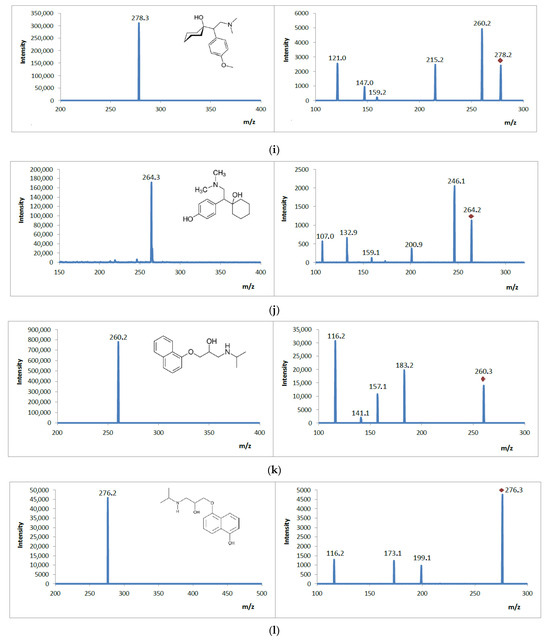

Figure 2.
Full scan spectra (MS, left) and product ion spectra (MS/MS, right) for (a) enalapril, (b) enalaprilat, (c) enalapril glucuronide, (d) midazolam, (e) hydroxymidazolam, (f) metronidazole, (g) hydroxymetronidazole, (h) metronidazole glucuronide, (i) venlafaxine, (j) desmethylvenlafaxine, (k) propranolol, (l) hydroxypropranolol, and (m) propranolol glucuronide with the use of LC-ESI-MS/MS. Experimental conditions: mobile phase composition (A) water + formic acid 0.1% + 2 mM ammonium formate; (B) acetonitrile + formic acid 0.1% + 2 mM ammonium formate; flow rate: 0.4 mL/min; autosampler temperature 21 °C; collision energy 25 eV; nebulizing gas flow 6.0 L/min; heating gas flow 10 L/min; drying gas flow 10 L/min; interface temperature 300 °C; heat block temperature 350 °C; DL temperature 250 °C. Red symbol is the primary ion.
The fragmentation spectrum for enalapril (Figure 2a) shows the signal m/z = 377, which corresponds to the structure of the tested compound, the signal m/z = 303, which was generated by the cleavage of the ethyl ester, and the signal m/z = 234, which was generated by the cleavage of 1-carboxyproline. The fragmentation spectrum for enalaprilat (Figure 2b) reveals the signal m/z = 349, which corresponds to the structure of the tested compound, the signal m/z = 206, which was generated by the cleavage of 1-carboxyproline, and styrene, and the signal m/z = 160, which was generated by the cleavage of 1-carboxyproline and formic acid. The fragmentation spectrum for enalapril glucuronide (Figure 2c) shows the signal m/z = 553, which corresponds to the structure of the tested compound, the signal m/z = 377, which was caused by the cleavage of glucuronic acid, the signal m/z = 303, which was caused by the cleavage of glucuronic acid and ethyl ester, and the signal m/z = 234, which was caused by the cleavage of glucuronic acid and 1-carboxyproline. The fragmentation spectrum for midazolam (Figure 2d) shows the signal m/z = 326, which corresponds to the structure of the tested compound, and the fragment signal m/z = 291. The fragmentation spectrum for hydroxymidazolam (Figure 2e) shows the signal m/z = 342, which corresponds to the structure of the tested compound, and the fragment signal m/z = 291. The fragmentation spectrum for metronidazole (Figure 2f) shows the signal m/z = 172, which corresponds to the structure of the tested compound, and the signal m/z = 128, which was created by the cleavage of the C2H4O molecule. The fragmentation spectrum for hydroxymetronidazole (Figure 2g) shows the signal m/z = 188, which corresponds to the structure of the tested compound, the signal m/z = 144, which was created by the cleavage of the C2H4O molecule, and the signal m/z = 126, which is likely a protonated 2-methylene-4-nitroimidazole. The fragmentation spectrum for metronidazole glucuronide (Figure 2h) shows the signal m/z = 348, which corresponds to the structure of the tested compound, and the signal m/z = 172, which was created by the cleavage of glucuronic acid. m/z= 126 corresponds to protonated 2-methylene-4-nitroimidazole, m/z = 141 is a dehydrated gluconic acid oxonium ion, and m/z = 113 is a further fragment from m/z = 141. The fragmentation spectrum for venlafaxine (Figure 2i) shows the signal m/z = 278, which corresponds to the structure of the tested compound, the signal m/z = 260, which was caused by the cleavage of the OH group, the signal m/z = 215, which was caused by the cleavage of the OH group and dimethylamine, the signal m/z = 121, which is likely (4-methoxyphenyl)methylium, and the signal m/z = 147, which was caused by the cleavage of dimethylamine and phenol. The fragmentation spectrum for desmethylvenlafaxine (Figure 2j) shows the signal m/z = 264, which corresponds to the structure of the tested compound, the signal m/z = 246, which was generated by the cleavage of the OH group, the signal m/z = 201, which was generated by the cleavage of the OH group and dimethylamine, the signal m/z = 107, which is likely (4-hydroxyphenyl)methylium, and the signal m/z = 132, which was generated by the cleavage of dimethylamine and phenol. The fragmentation spectrum for propranolol (Figure 2k) shows the signal m/z = 260, which corresponds to the structure of the tested compound, the signal m/z = 116, which was generated by the cleavage of 1-hydroxynaphthalene, the signal m/z = 157, which was generated by the cleavage of methoxynaphthalene, and the signal m/z = 183, which was generated by the cleavage of 1-isopropylamine and the -OH group. The fragmentation spectrum for hydroxypropranolol (Figure 2l) shows the signal m/z = 276, which corresponds to the structure of the tested compound, the signal m/z = 116, which was generated by the cleavage of 4,8-dihydroxynaphthalene, the signal m/z = 173, which was generated by the cleavage of 4-hydroxy-8-methoxynaphthalene, and the signal m/z = 199, which was generated by the cleavage of the -OH group and isopropylamine. The fragmentation spectrum for propranolol glucuronide (Figure 2m) shows the signal m/z = 436, which corresponds to the structure of the tested compound, the signal m/z = 260, which was caused by the cleavage of glucuronic acid, the signal m/z = 115, which results from the loss of CO2 and H2O from the glucuronic acid oxonium ion, and the signal m/z = 183, which was caused by the cleavage of isopropylamine and glucuronic acid.
3.6. Comparison of the Obtained Results
The results obtained for experiments conducted by the electrochemical simulation (EC) and incubation of the test drugs with liver cell microsomal fraction (LM) enzymes with the results of biological sample analysis for the five selected drugs (ENAL, MET, MID, PRO, and VEN) are presented in Table 4. All the proposed metabolites that were observed in the electrochemical cell (EC), liver microsomes (LMs), or real samples are summarized, including their ion ID, experimental m/z, and MS/MS fragmentation pattern, along with the chemical formula. It should be mentioned that the results obtained by the in vitro route show remarkable similarity to those obtained by the electrochemical method, since it was possible to generate all metabolites in vitro in the EC reaction cell. Table 4 summarizes the key similarities in the case of study drugs and their pharmacologically active metabolites. Moreover, the data from the biological samples originating from patients receiving medication were studied in detail. They were compared with the results obtained via the proposed EC-MS method using an electrochemical cell and the microsomal approach. Figure 3 presents MRM MS chromatograms for the selected drugs and their pharmacologically active metabolites. MRM MS spectra further confirmed the presence of the drug and its potential metabolites in biological samples collected from patients. The obtained results and the adopted methods are consistent with the literature, and reciprocally, as the same potential phase I and II metabolites were identified in all modeling approaches. The results demonstrate that combining electrochemistry and mass spectrometry is reliable for simulating drug metabolism. Development of this technique will likely enable its use as an alternative in vitro method for studying oxidation–reduction reactions.

Table 4.
The experimental m/z values for product ions of selected drugs and their electrochemical products for EC experiments, potential metabolites in cases of in vitro incubation, and biological samples.
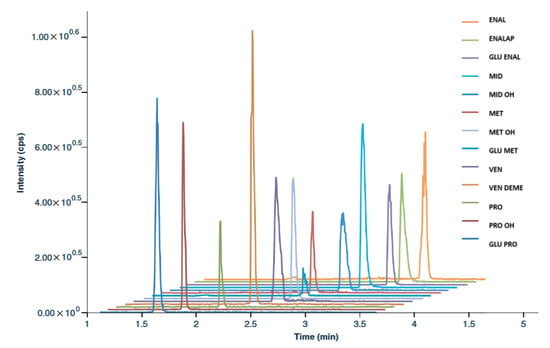
Figure 3.
Overlap of representative MRM MS chromatograms for studied drugs and their pharmacologically active metabolites. MRM—multiple reaction monitoring mode. For abbreviations, see Table 1 and Table 2. enalapril (ENAL), enalaprilat (ENALAP), enalapril glucuronide (GLU ENAL), metronidazole (MET), hydroxymetronidazole (MET OH), metronidazole glucuronide (GLU MET), midazolam (MID), hydroxymidazolam (MID OH), propranolol (PRO), hydroxypropranolol (PRO OH), propranolol glucuronide (GLU PRO), venlafaxine (VEN), desmethylvenlafaxine (VEN DEME).
Numerous approaches have been used in the literature to simulate the biotransformation of selected compounds in liver microsomes using enzyme-independent chemical systems. The results obtained in this study demonstrate that systems using an EC reaction cell can mimic these metabolic reactions and, in some cases, can generate the same metabolites observed in conventional enzymatic systems using CYP450 enzymes. However, no previous literature reports have compared the similarity of the metabolic profiles between mimic systems and conventional in vitro metabolism systems with real biological samples from patients. Therefore, a metabolic prediction approach using an EC/MS system was developed, demonstrating the ability to mimic the metabolite profiles generated by traditional microsomal incubation systems. All proposed phase I and II metabolic reactions of biotransformation are typical of processes catalyzed by cytochrome P450 isoenzymes. It can be concluded that liver microsomes exhibiting enzymatic activity can be very useful in studying the metabolism of drugs belonging to various therapeutic groups. A flowchart for the approach used in the experimental section is presented in Figure S8. Potential metabolites were identified during biotransformation simulations, consistent with the literature data and those resulting from oxidation using cytochrome P450 isoenzymes in the liver microsomal fraction. Based on the results obtained, it can be concluded that this approach can effectively predict oxidation processes initiated by single-electron oxidation, such as N-dealkylation, S-oxidation, β-oxidation, alcohol oxidation, hydroxylation of aromatic systems, and dehydrogenation. Due to the high oxidation potential required to initiate electrochemical oxidation reactions, it does not yield results for reactions initiated by direct hydrogen addition, such as O-dealkylation or aliphatic hydroxylation of unsubstituted aromatic rings.
The EC-MS approach determines and identifies electrochemical products (ETPs) in many electrochemical systems. EC-MS applications are divided into two groups: volatile and non-volatile ETPs. This method has been used for decades to mimic biochemical transformations and obtain reliable information on oxidation and reduction processes. EC-MS is an interesting approach to studying redox processes and identifying oxidation and reduction products. Studies using EC-MS described in the scientific literature involve electrochemical simulation of oxidative metabolism, oxidative stress, or degradation processes. Although the instrumentation of EC-MS and EC-HPLC-MS is well established and commercially available, new research in recent years has focused on interfacing strategies and the development of real-time online analytical systems and electrochemical interfaces combining electrochemistry and ionization for MS. Studies using tandem mass spectrometry (MS/MS) can be used to identify chemical structures based on characteristic fragments. However, structures can still only be proposed in many cases because analytical standards for comparison are often lacking or prohibitively expensive. Another challenge is the small amount of product the reaction cell (EC) generates. Therefore, obtaining sufficient samples for chromatographic separation and offline analysis, for example, by NMR, is difficult if longer electrolysis times are used. This results in the loss of one significant advantage: the short analysis time. Many subsequent reactions involving the main oxidation products take place, and the composition of the reaction mixture will change significantly over time, considerably complicating analysis. This can be a problem, especially in studies with pharmaceutical or biomedical applications, as there is often interest in reactive intermediates. In the future, additional structural identification techniques will be needed to characterize the oxidation and reduction products reliably.
4. Conclusions
The obtained results allowed the development of an alternative method based on electrochemistry and mass spectrometry (EC-MS) for studying the metabolism of drugs (enalapril, metronidazole, midazolam, propranolol, venlafaxine) belonging to different therapeutic groups (antibiotics, antidepressants, cardiovascular drugs). The oxidation process of the studied drugs in the electrochemical system was influenced by the buffer’s type, concentration, and pH and the type of working electrode used. The central composite design (CCD) was successfully used to predict MS parameters for the studied drugs and their pharmacologically active metabolites for identification based on the multiple reaction monitoring mode (MRM).
In silico tools (Biotransformer 3.0, GLORYx, and Xenosite) predicted the most vulnerable sites of metabolism (SOMs) in the structure of the studied drugs. Finally, the suggested atomic sites for metabolism in their chemical structure were the same as seen in the generated metabolites in phases I and II of biotransformation. Hence, these probabilities were used as a guide during the experimental part. Moreover, the results were correlated with data obtained from in vitro enzymatic incubation and samples taken from patients in clinical departments (Table 4).
During in vitro experiments, different phase I and II metabolites were identified for the compounds studied. For enzymatic incubation, N-dealkylation, O-demethylation, and hydroxylation were the metabolic pathways involved mainly in their metabolism. Their in vitro phase II metabolites were identified as glucuronic acid conjugates. Finally, different in vivo phase I and II metabolites were identified for the studied drugs, including metabolic pathways for in vivo phase I N-demethylation, N-dealkylation, O-demethylation, and hydroxylation, while the metabolic pathways for in vivo phase II metabolites were identified as glucuronic acid conjugates.
Supplementary Materials
The following supporting information can be downloaded at: https://www.mdpi.com/article/10.3390/separations12090243/s1, Figure S1. Metabolic scheme for enalapril (ENAL). Figure S2. Metabolic scheme for midazolam (MID). Figure S3. Metabolic scheme for metronidazole (MET). Figure S4. Metabolic scheme for propranolol (PRO). Figure S5. Metabolic scheme for venlafaxine (VEN). Figure S6. Mass spectra obtained from electrochemical processes for ENAL using (A) platinum, (B) gold, (C) carbon, and (D) diamond electrodes. Figure S7. Electrochemical mass spectra of PRO for ammonium formate buffer at pH 3 (A), ammonium acetate buffer at pH 7 (B), ammonium acetate buffer at pH 5 (C) and ammonium acetate buffer at pH 9 (D) (using a diamond electrode). Figure S8. MS/MS fragmentation patterns for (a) enalapril, (b) enalaprilat, (c) enalapril glucuronide, (d) midazolam, (e) hydroxymidazolam, (f) metronidazole, (g) hydroxymetronidazole, (h) metronidazole glucuronide, (i) venlafaxine, (j) desmethylvenlafaxine, (k) propranolol, (l) hydroxypropranolol, and (m) propranolol glucuronide with the use of LC-ESI-MS/MS. Experimental conditions: mobile phase composition (A) water + formic acid 0.1% + 2 mM ammonium formate; (B) acetonitrile + formic acid 0.1% + 2 mM ammonium formate; flow rate: 0.4 ml/min; au-tosampler temperature 21 °C; collision energy 25 eV; nebulizing gas flow 6.0 L/min; heating gas flow 10 L/min; drying gas flow 10 L/min; interface temperature 300 °C; heat block temperature 350 °C; DL temperature 250 °C. Figure S9. The flow chart of the applied approach during the experimental part. Table S1. Linearity ranges, calibration curve parameters and LOD and LOQ of the tested compounds. Table S2. Repeatability, precision, accuracy and recoveries of determined compounds. Table S3. Stability in biological samples depending on the sample storage conditions used. Table S4 In silico predicted metabolites of the target compounds and associated predictive score (GLORYx software) [an exemplary for ENAL]. Table S5. In silico predicted sites of the metabolism of the target compounds (FAME3) software). Table S6. In silico predicted metabolites of the target compounds and associated predictive score (GLORYx soft-ware) and enzyme predicted to be involved in biotransformation (Biotransformer3.0).
Funding
This work was financially supported by the Torun Center of Excellence “Towards Personalized Medicine” operating under Excellence Initiative-Research University (Małgorzata Szultka-Młyńska).
Institutional Review Board Statement
Not applicable.
Informed Consent Statement
The study with the use of real samples from patients was conducted according to the guidelines of the Declaration of Helsinki and approved by the Bioethics Committee of Nicolaus Copernicus University in Torun (decision no. 477/2021). The use of MLMs that were purchased from Sigma removes the necessity for ethical approval.
Data Availability Statement
The data presented in this study are available on request from the corresponding author. The original contributions presented in this study are included in the article/Supplementary Materials. Further inquiries can be directed to the corresponding authors.
Conflicts of Interest
The author declares no conflicts of interest. The funder had no role in the design of the study; in the collection, analyses, or interpretation of data; in the writing of the manuscript; or in the decision to publish the results.
References
- Bussy, U.; Boisseau, R.; Thobie-Gautier, C.; Boujtita, M. Electrochemistry-mass spectrometry to study reactive drug metabolites and CYP450 simulations. Trends Anal. Chem. 2015, 70, 67–73. [Google Scholar] [CrossRef]
- Karst, U. Electrochemistry/Mass Spectrometry (EC/MS)-A New Tool To Study Drug Metabolism and Reaction Mechanisms. Angew. Chem. 2004, 43, 2476–2478. [Google Scholar] [CrossRef] [PubMed]
- Lohmann, W.; Baumann, A.; Karst, U. Electrochemistry and LC-MS for Metabolite Generation and Identification: Tools, Technologies and Trends. LC-GC N. Am. 2010, 28, 470–478. [Google Scholar]
- Permentier, H.P.; Bruins, A.P.; Bischoff, R. Electrochemistry-mass spectrometry in drug metabolism and protein research. Mini-Rev. Med. Chem. 2008, 8, 46–56. [Google Scholar] [CrossRef] [PubMed]
- Chipiso, K.; Simoyi, R.H. Electrochemistry-coupled to mass spectrometry in simulation of metabolic oxidation of methimazole: Identification and characterization of metabolites. J. Electroanal. Chem. 2016, 761, 131–140. [Google Scholar] [CrossRef]
- Tabacovaa, S.A.; Kimmelb, C.A. Enalapril: Pharmacokinetic/dynamic inferences for comparative developmental toxicity. A review. Reprod. Toxic. 2001, 15, 467–478. [Google Scholar]
- Gu, Q.; Chen, X.; Zhong, D.; Wang, Y. Simultaneous determination of enalapril and enalaprilat in human plasma by liquid chromatography–tandem mass spectrometry. J. Chromatogr. B 2004, 813, 337–342. [Google Scholar] [CrossRef] [PubMed]
- Lamp, K.; Lacy, M.K.; Freeman, C. Metronidazole, Clindamycin and Streptogramin Pharmacodynamics. In Antimicrobial Pharmacodynamics in Theory and Clinical Practice; CRC Press: Boca Raton, FL, USA, 2001; pp. 221–227. [Google Scholar] [CrossRef]
- Kathriarachchi, U.L. Development of a LC-MS method for simultaneous determination of amoxicillin and metronidazole in human serum using hydrophilic interaction chromatography (HILIC). J. Chromatogr. B 2018, 1089, 78–83. [Google Scholar] [CrossRef] [PubMed]
- Marquet, P.; Baudin, O.; Gaulier, J.M.; Lacassie, E.; Dupuy, J.L.; Francois, B.; Lachatre, G. Sensitive and specific determination of midazolam and 1-hydroxymidazolam in human serum by liquid chromatography–electrospray mass spectrometry. J. Chromatogr. B 1999, 734, 137–144. [Google Scholar] [CrossRef] [PubMed]
- Svanström, C.; Hansson, G.P.; Svensson, L.D.; Sennbro, C.J. Development and validation of a method using supported liquid extraction for the simultaneous determination of midazolam and 1-hydroxy-midazolam in human plasma by liquid chromatography with tandem mass spectrometry detection. J. Pharm. Biomed. Anal. 2012, 58, 71–77. [Google Scholar] [CrossRef] [PubMed]
- Trobeca, K.C.; Trontelj, J.; Springer, J.; Lainscak, M.; Kos, M.K. Liquid chromatography–tandem mass spectrometry method for simultaneous quantification of bisoprolol, ramiprilat, propranolol and midazolam in rat dried blood spots. J. Chromatogr. B 2014, 958, 29–35. [Google Scholar] [CrossRef] [PubMed]
- Steenen, S.A.; van Wijk, A.J.; van der Heijden, G.; van Westrhenen, R.; de Lande, J.; de Jongh, A. Propranolol for the treatment of anxiety disorders: Systematic review and meta-analysis. J. Psychopharm. 2016, 30, 128–139. [Google Scholar] [CrossRef] [PubMed]
- Barman Balfour, J.A.; Jarvis, B. Venlafaxine Extended-Release. CNS Drugs 2000, 14, 483–503. [Google Scholar] [CrossRef]
- Bhatt, J.; Jangid, A.; Venkatesh, G.; Subbaiah, G.; Singh, S. Liquid chromatography–tandem mass spectrometry (LC–MS–MS) method for simultaneous determination of venlafaxine and its active metabolite O-desmethyl venlafaxine in human plasma. J. Chromatogr. B 2005, 829, 75–81. [Google Scholar] [CrossRef] [PubMed]
- Gu, G. Validation of an LC-MS/MS method for simultaneous quantification of venlafaxine and its five metabolites in rat plasma and its application in a pharmacokinetic study. J. Chromatogr. B 2018, 1087–1088, 29–35. [Google Scholar] [CrossRef] [PubMed]
- King, R.S. Biotransformations in Drug Metabolism. In Drug Metabolism Handbook: Concepts and Applications; John Wiley & Sons: Hoboken, NJ, USA, 2009; pp. 17–21. [Google Scholar]
- Oellerich, M.; Armstrong, V.W. Prodrug Metabolites: Implications for Therapeutic Drug Monitoring. Clin. Chem. 2001, 47, 805–806. [Google Scholar] [CrossRef] [PubMed]
- de Bruyn Kops, C.; Šícho, M.; Mazzolari, A.; Kirchmair, J. GLORYx: Prediction of the Metabolites Resulting from Phase 1 and Phase 2 Biotransformations of Xenobiotics. Chem. Res. Toxicol. 2021, 34, 286–299. [Google Scholar] [CrossRef] [PubMed]
- Djoumbou-Feunang, Y.; Fiamoncini, J.; Gil-de-la-Fuente, A.; Greiner, R.; Manach, C.; Wishart, D.S. BioTransformer: A comprehensive computational tool for small molecule metabolism prediction and metabolite identification. J. Cheminform. 2019, 11, 2. [Google Scholar] [CrossRef] [PubMed]
Disclaimer/Publisher’s Note: The statements, opinions and data contained in all publications are solely those of the individual author(s) and contributor(s) and not of MDPI and/or the editor(s). MDPI and/or the editor(s) disclaim responsibility for any injury to people or property resulting from any ideas, methods, instructions or products referred to in the content. |
© 2025 by the author. Licensee MDPI, Basel, Switzerland. This article is an open access article distributed under the terms and conditions of the Creative Commons Attribution (CC BY) license (https://creativecommons.org/licenses/by/4.0/).

